
|
|
|
| [Science] [BAS home] [Met home] [Beowulf home] | Antarctic Meteorology |
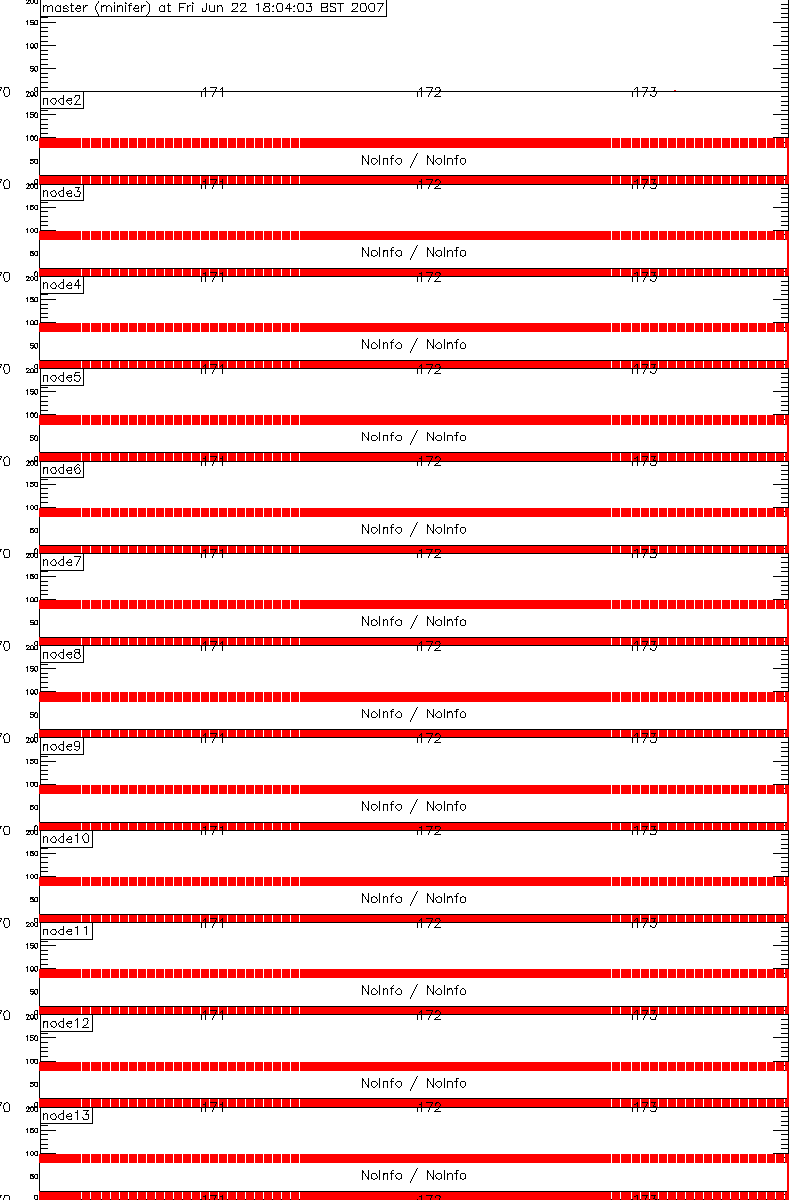
Colours are:
LightGreen > 99 > DarkGreen > 95 > Blue > 90 > yellow > 50 > red percent cpu usage.
RHS: experimental, plus job+owner.
BTW, the old cluster is now turned off... anyone want to buy 4 dual 1 GHz PIII's?
| Past last modified: 22/8/2003 / wmc@bas.ac.uk |
© Copyright Natural Environment Research Council - British Antarctic Survey 2002 |