This page shows graphs of Ozone at Halley and Vernadsky/Faraday stations for the seasons of 2021-2022 back to 1990-1991, Rothera since 2002 and a contour plot of all our monthly means. The graphs are gifs, jpegs or pngs.
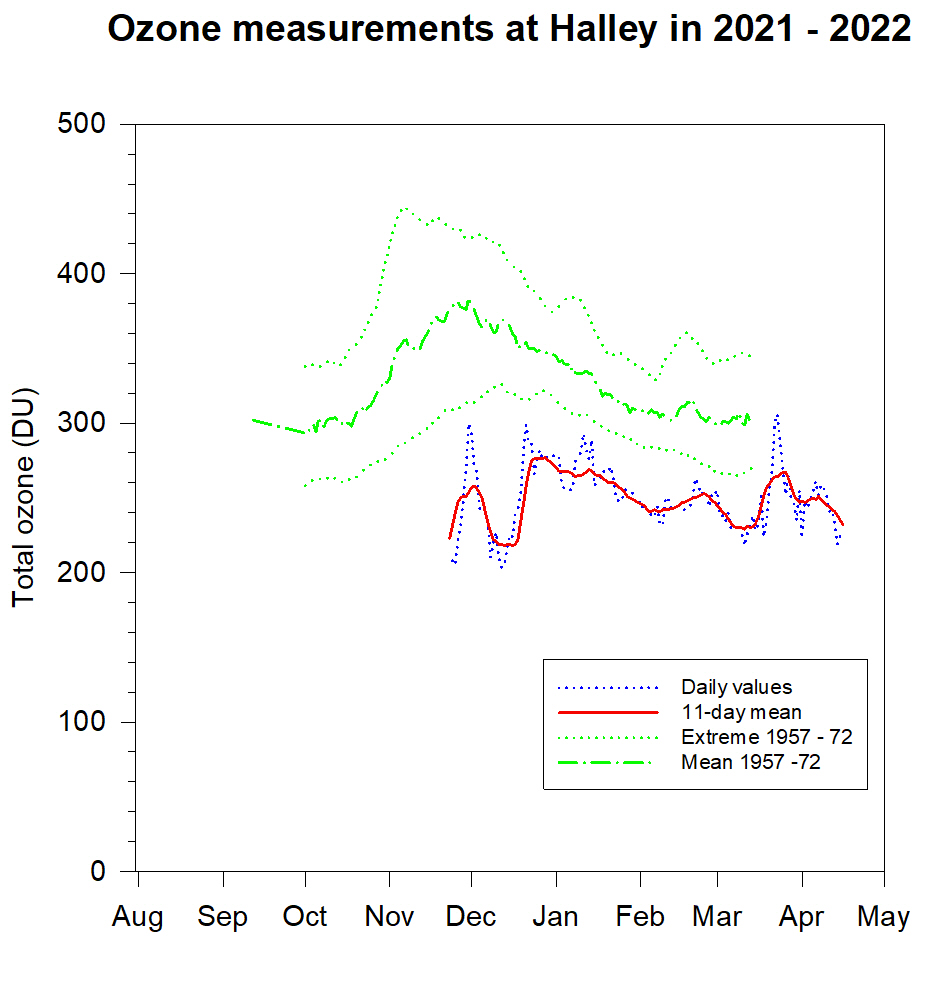
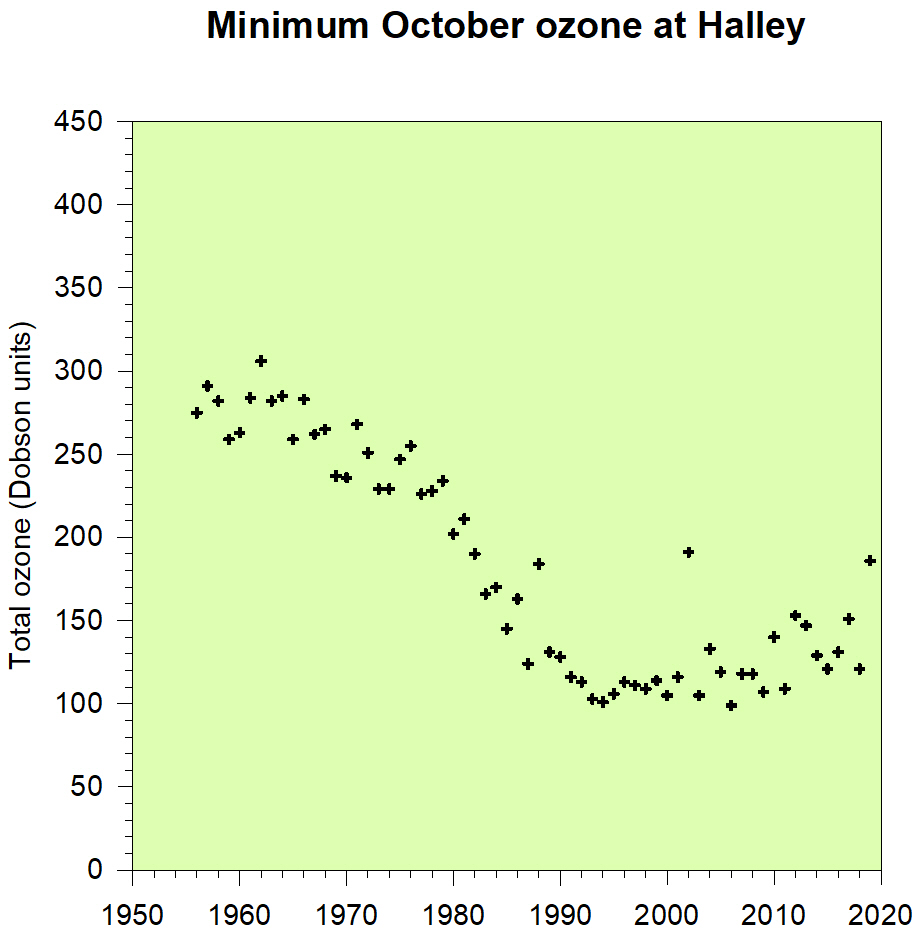
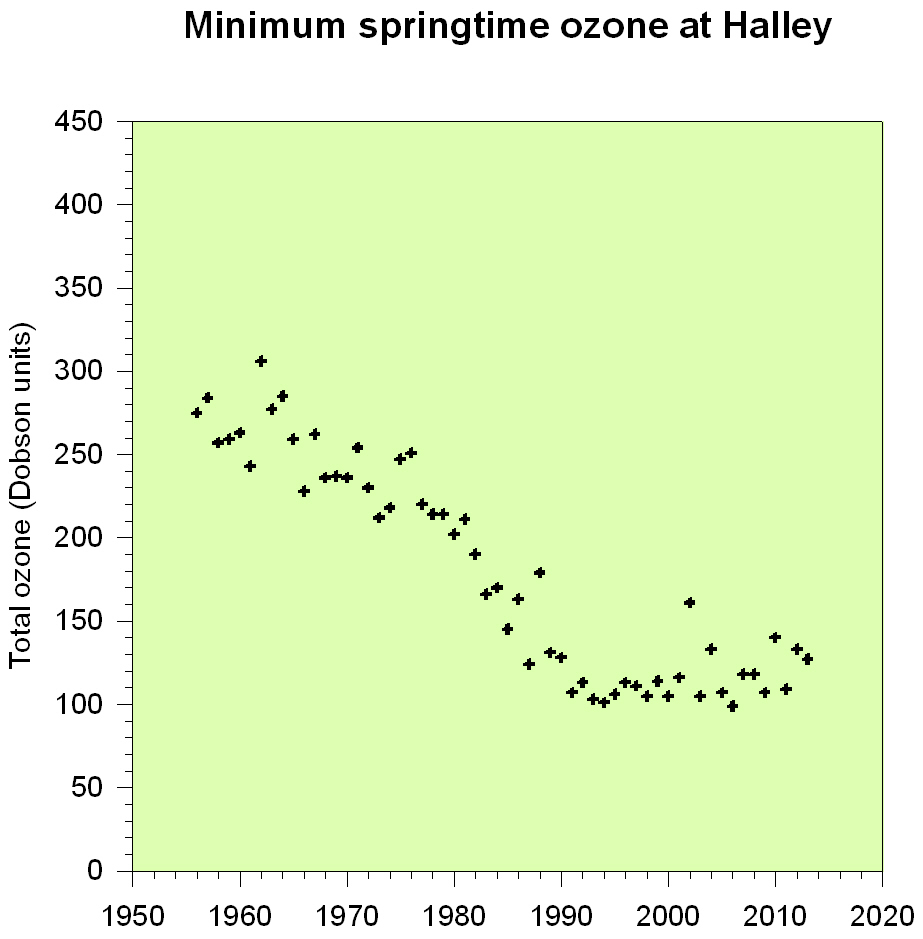
Halley
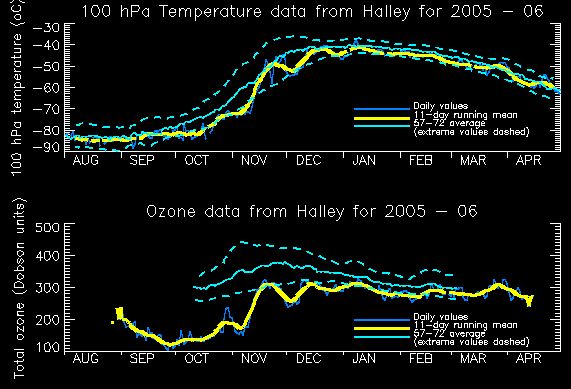
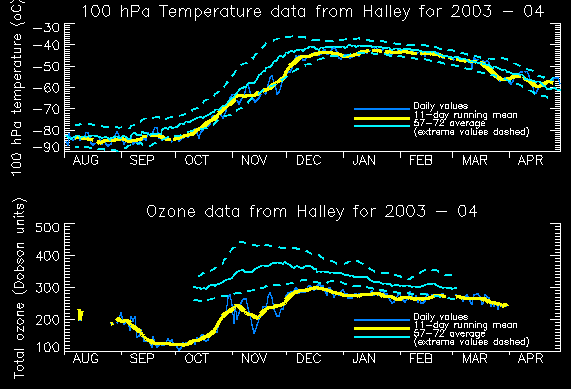
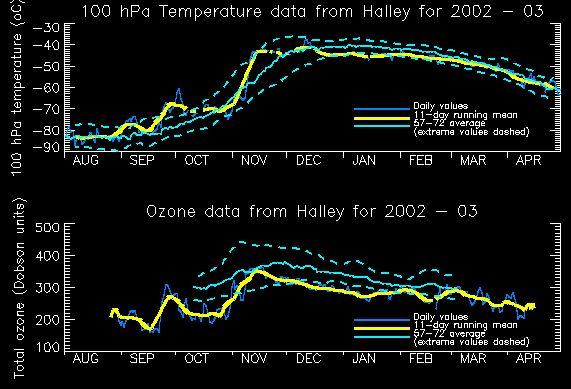
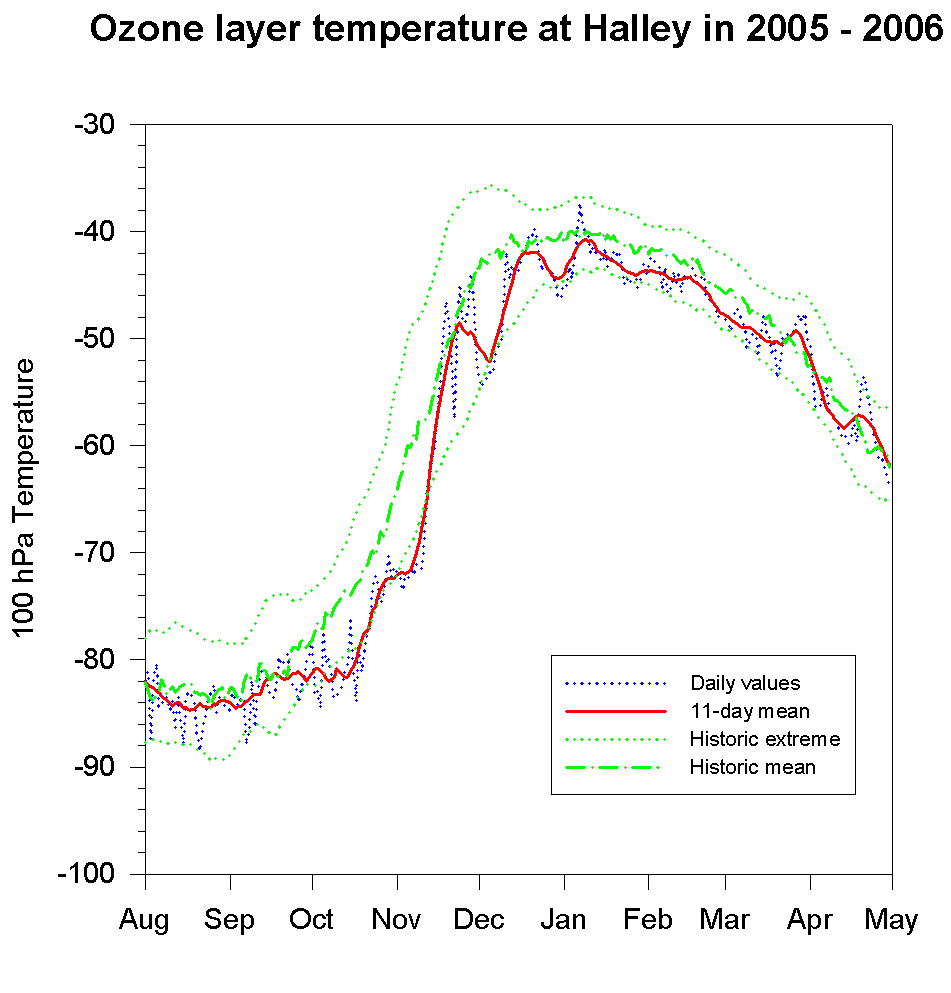
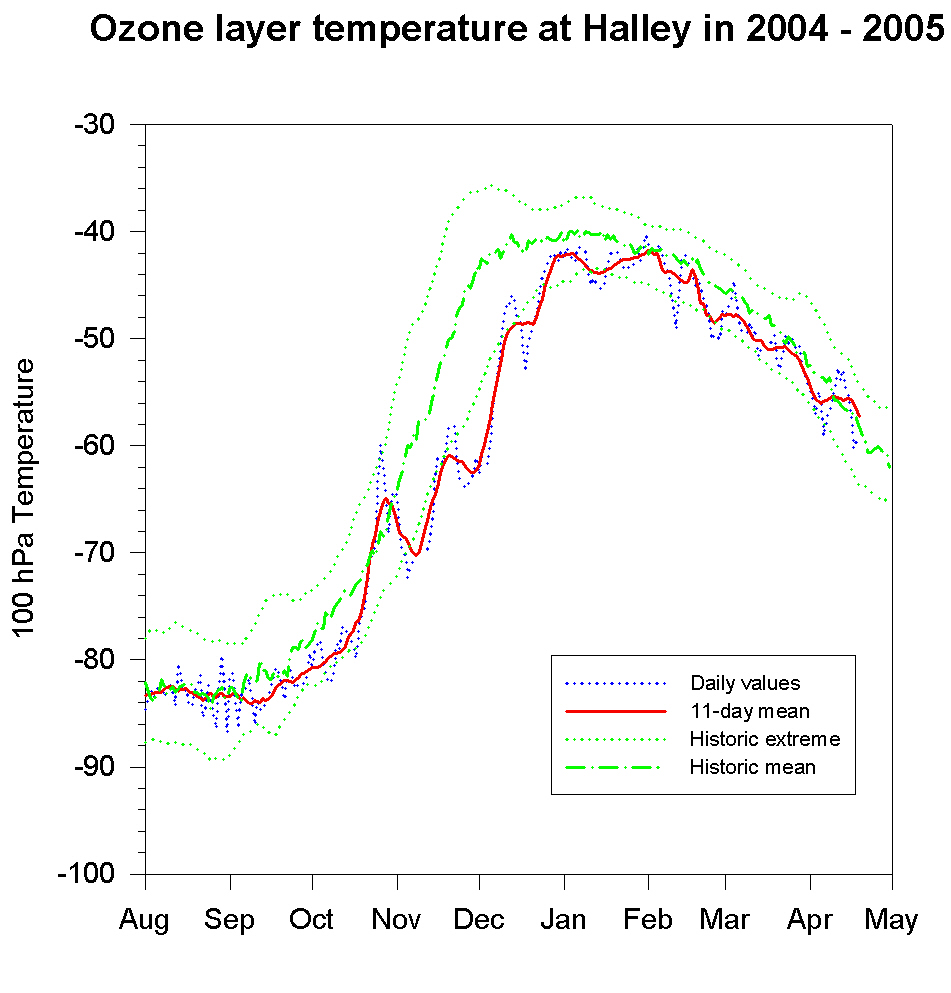
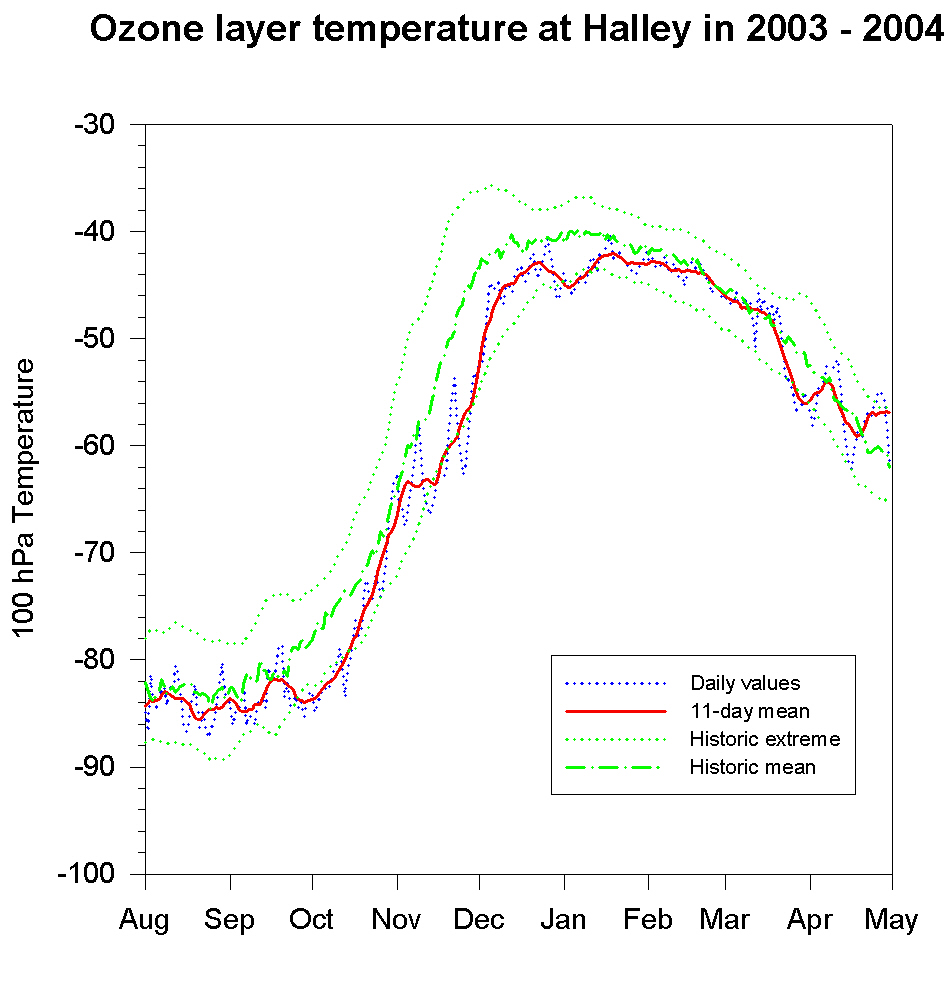
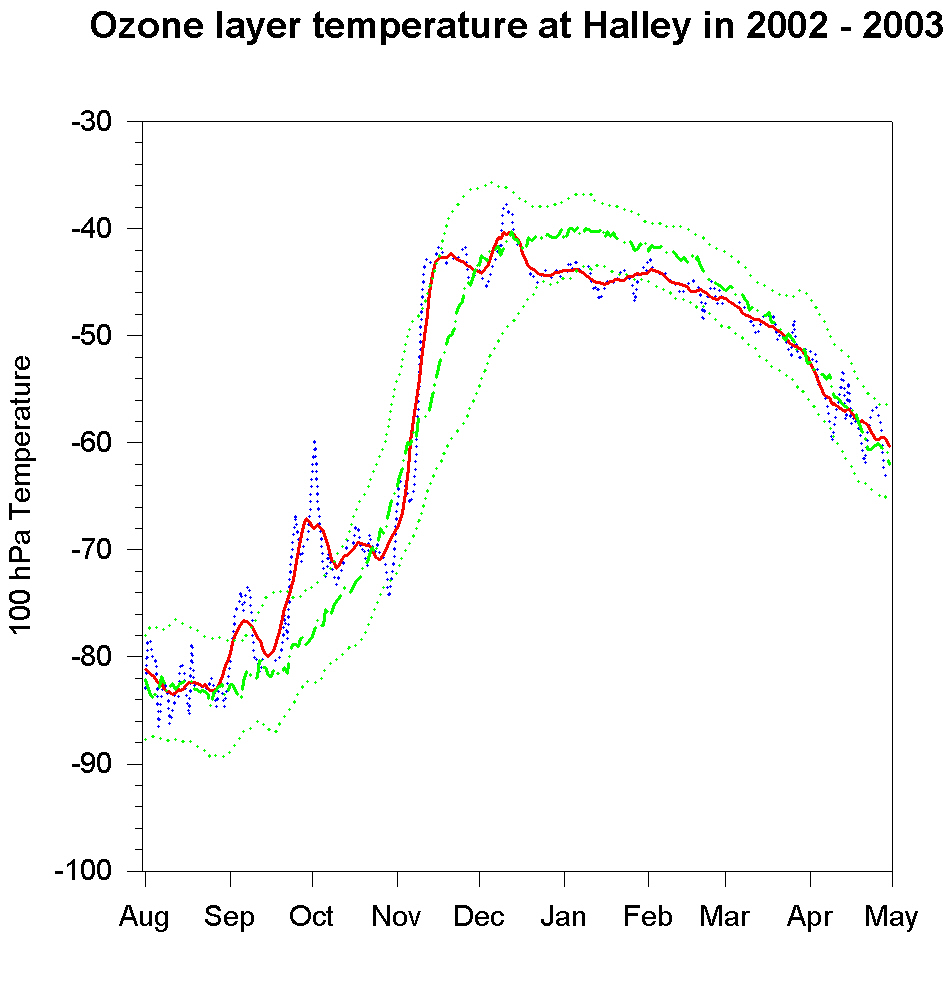
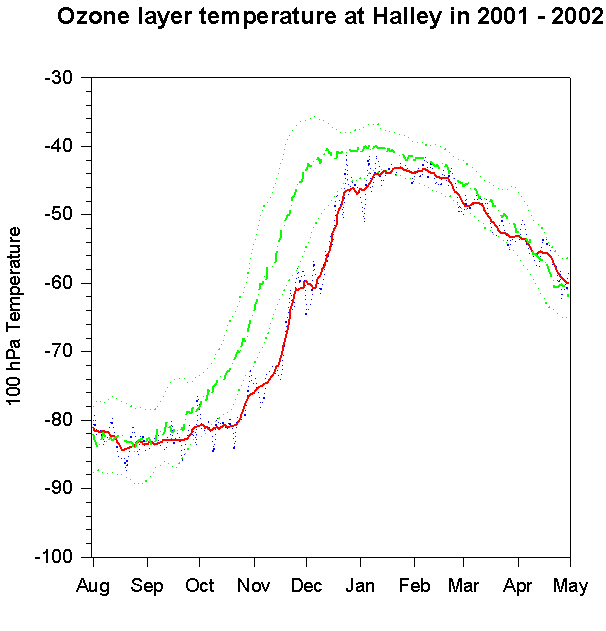
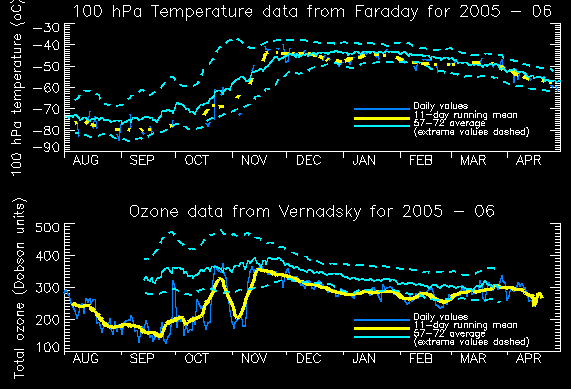
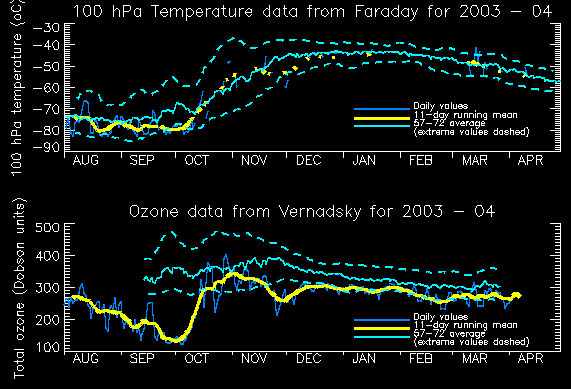
Combined ozone and 100 hPa temperature 05-06, 04-05, 03-04, 02-03, 01-02, 00-01, 99-00, 98-99, 97-98, 96-97, 95-96, 94-95, 93-94, 92-93, 91-92, 90-91
Dobson ozone only
21-22,
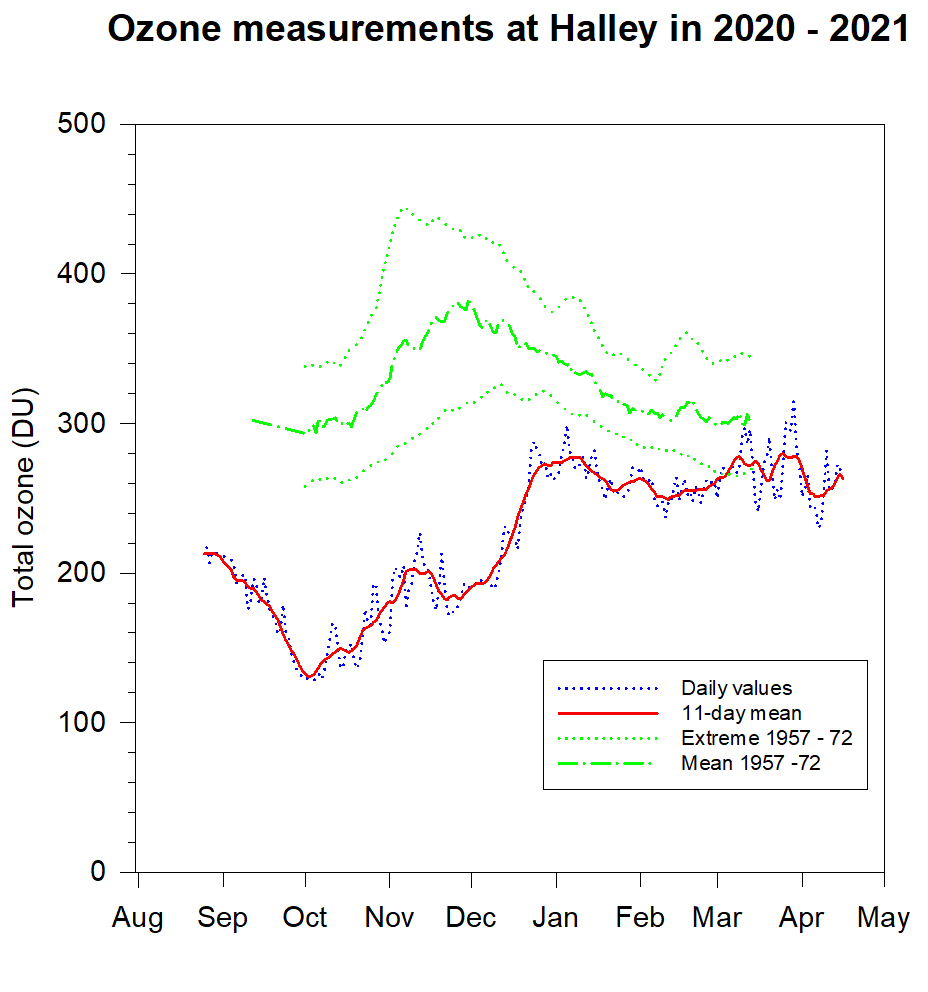
20-21,
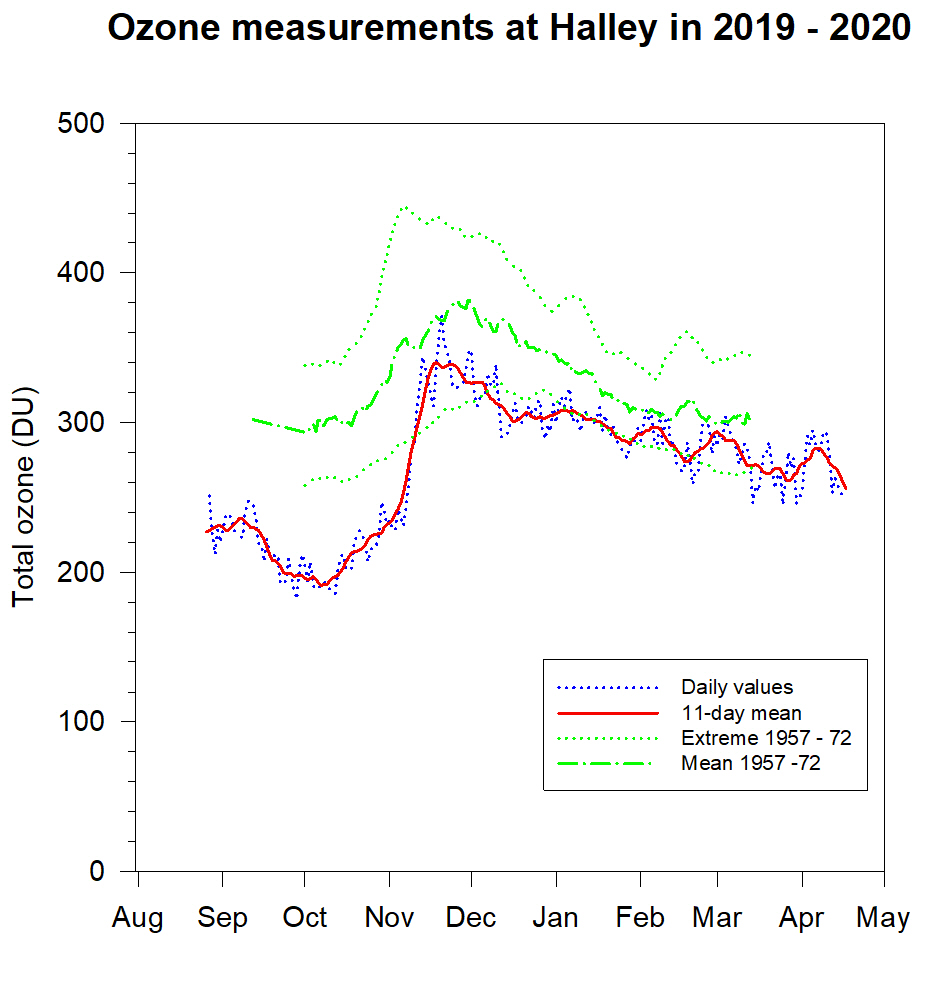
19-20,
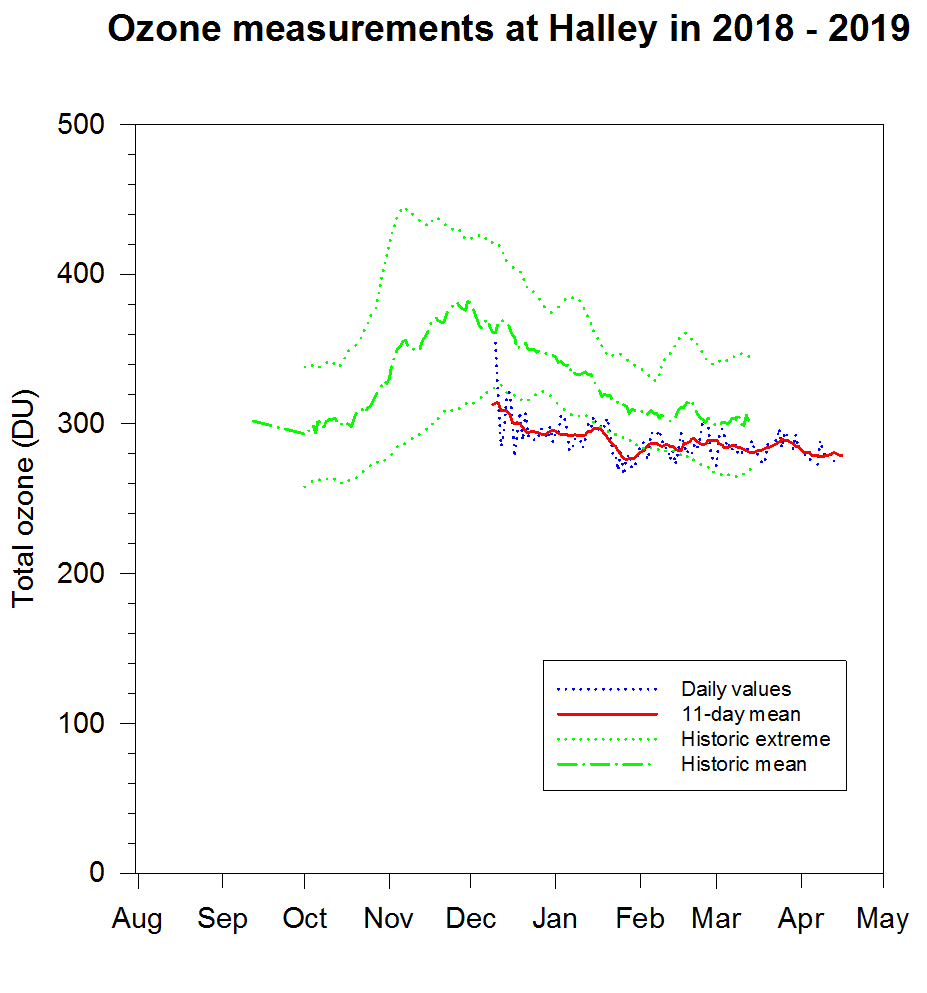
18-19,
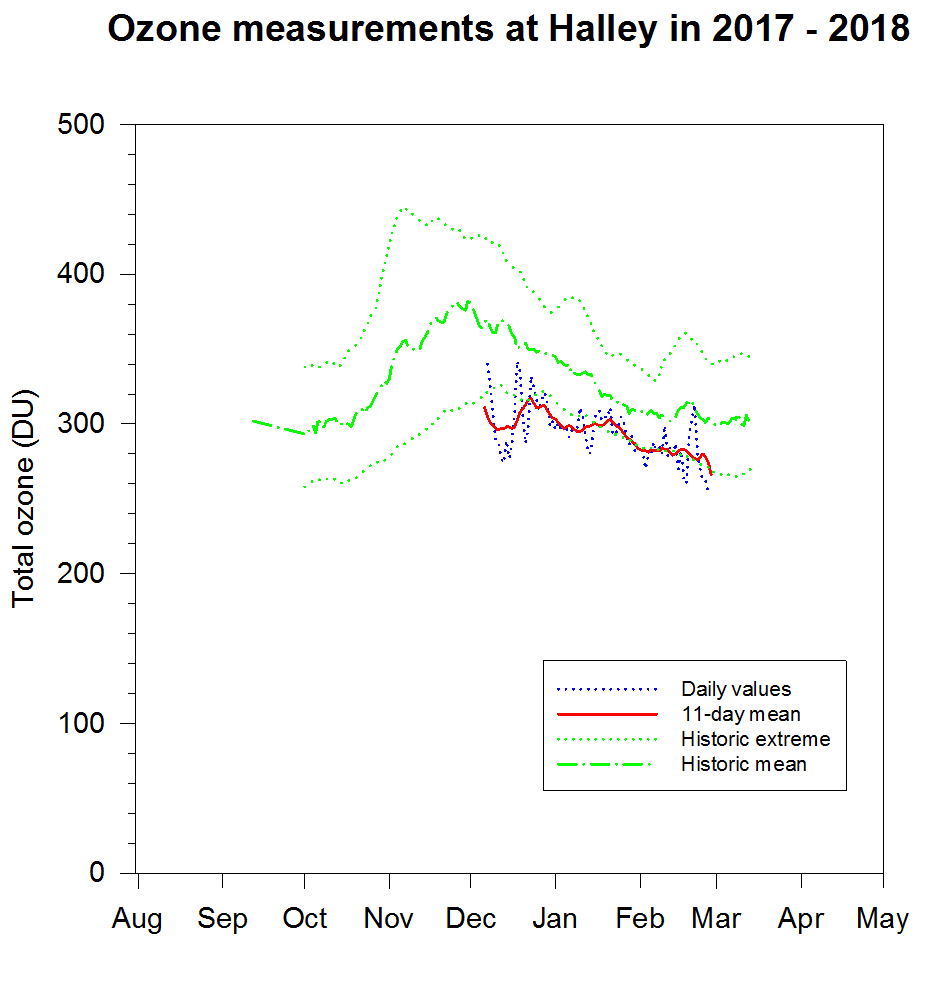
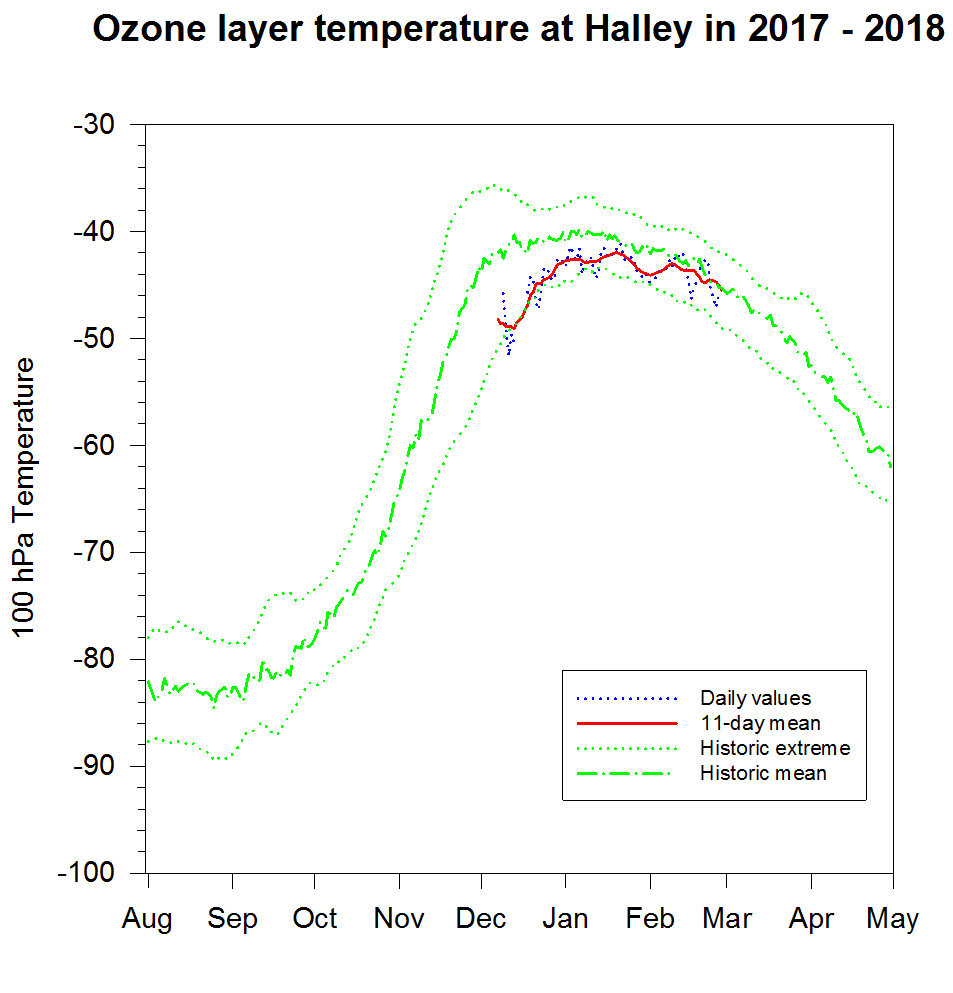
17-18,
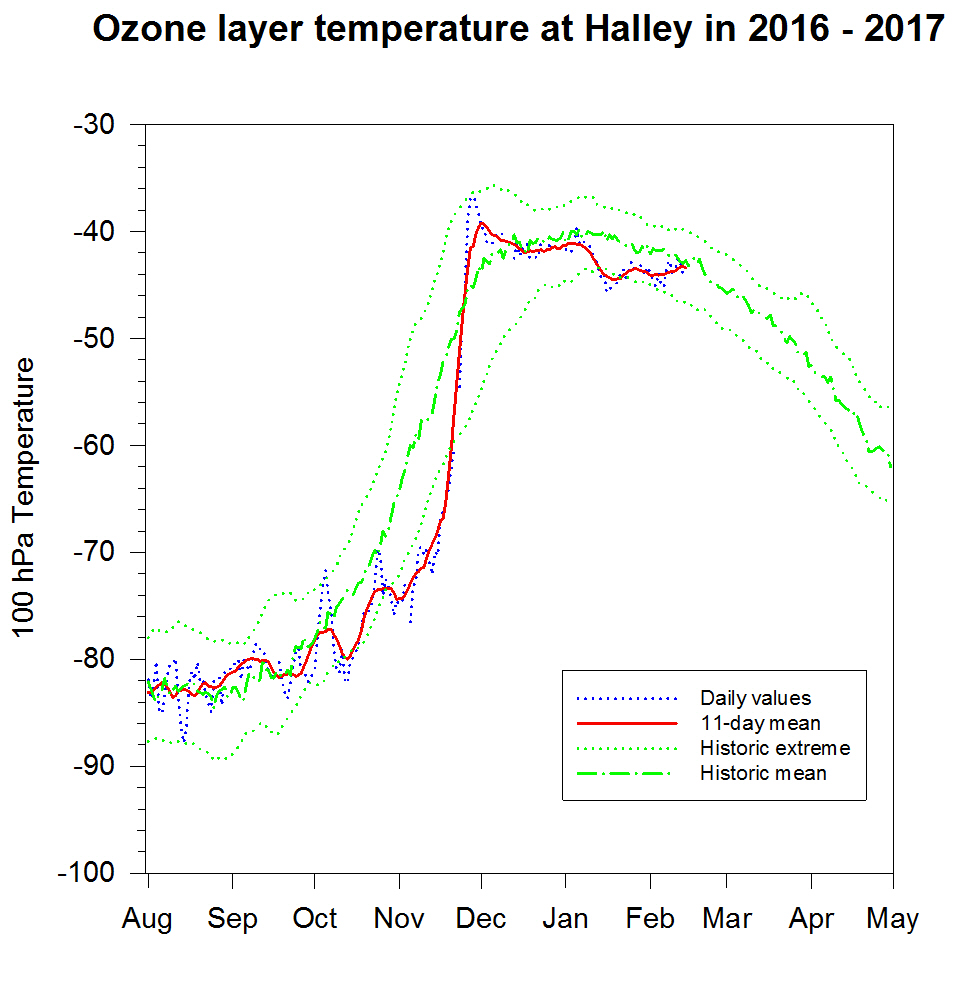
16-17,
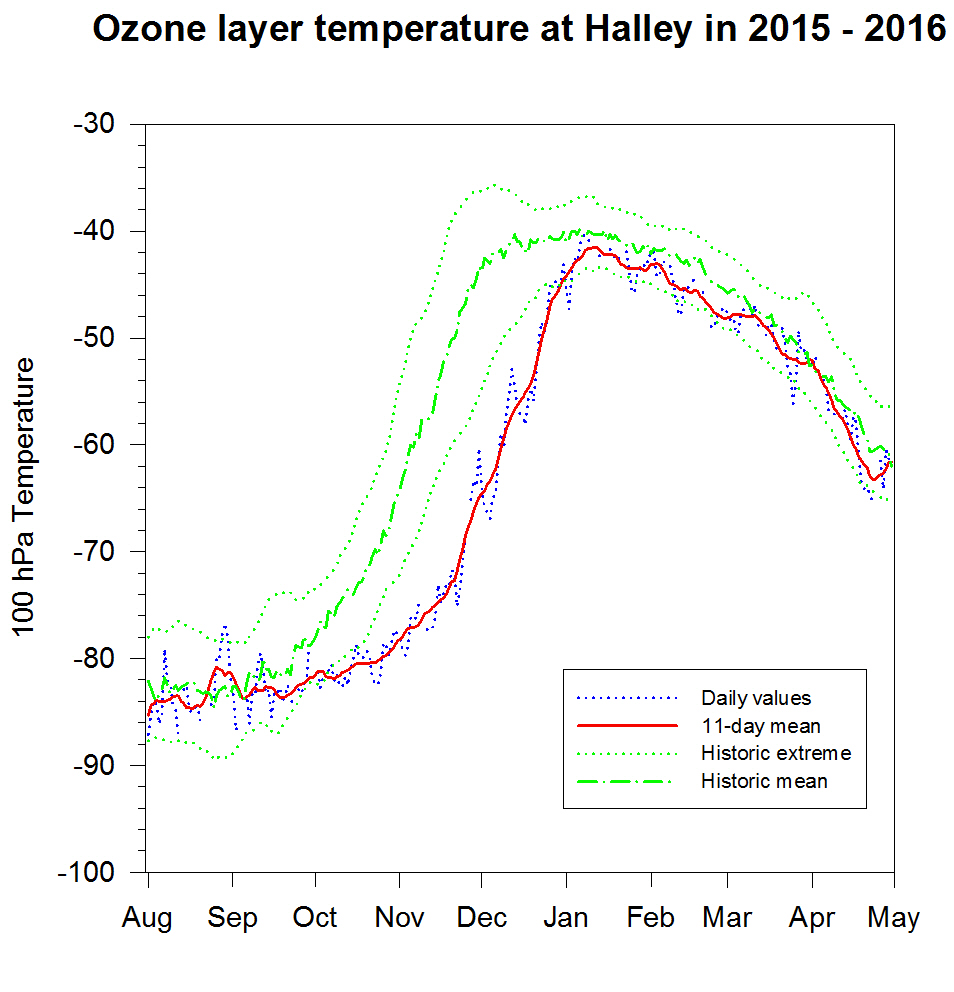
15-16,
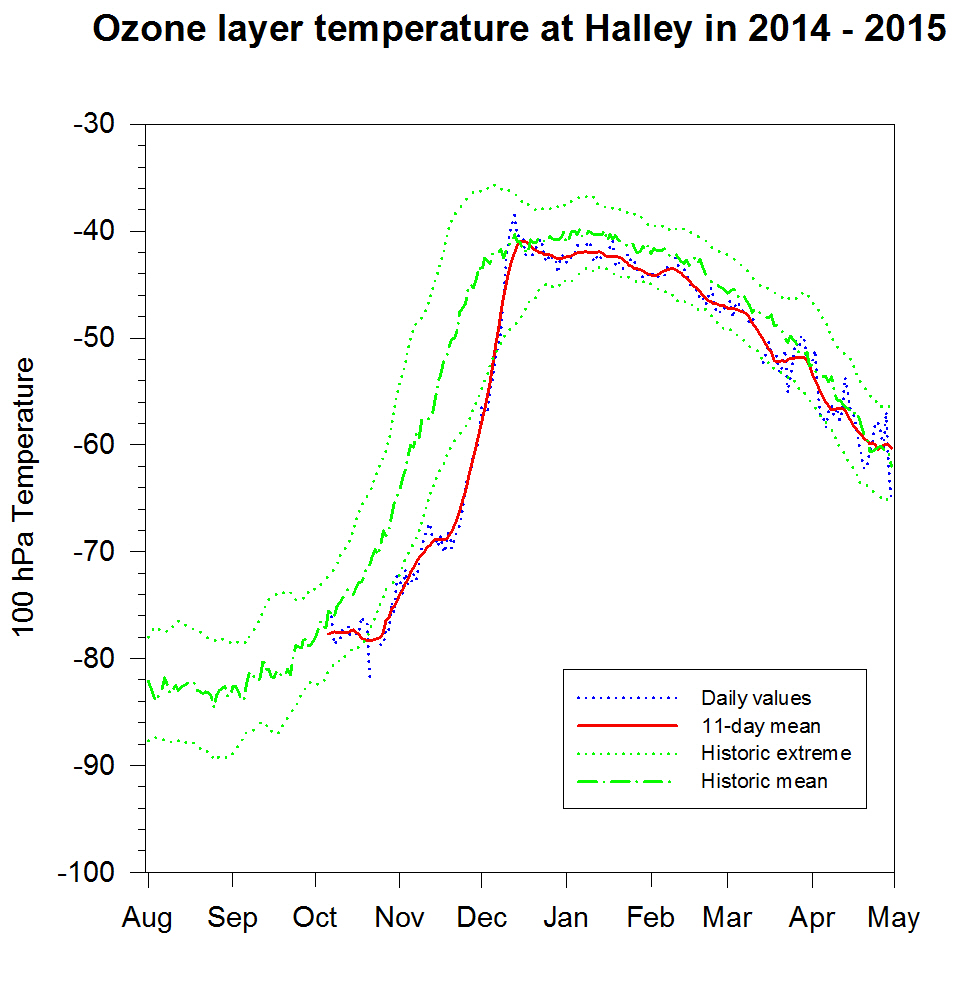
14-15,
13-14,
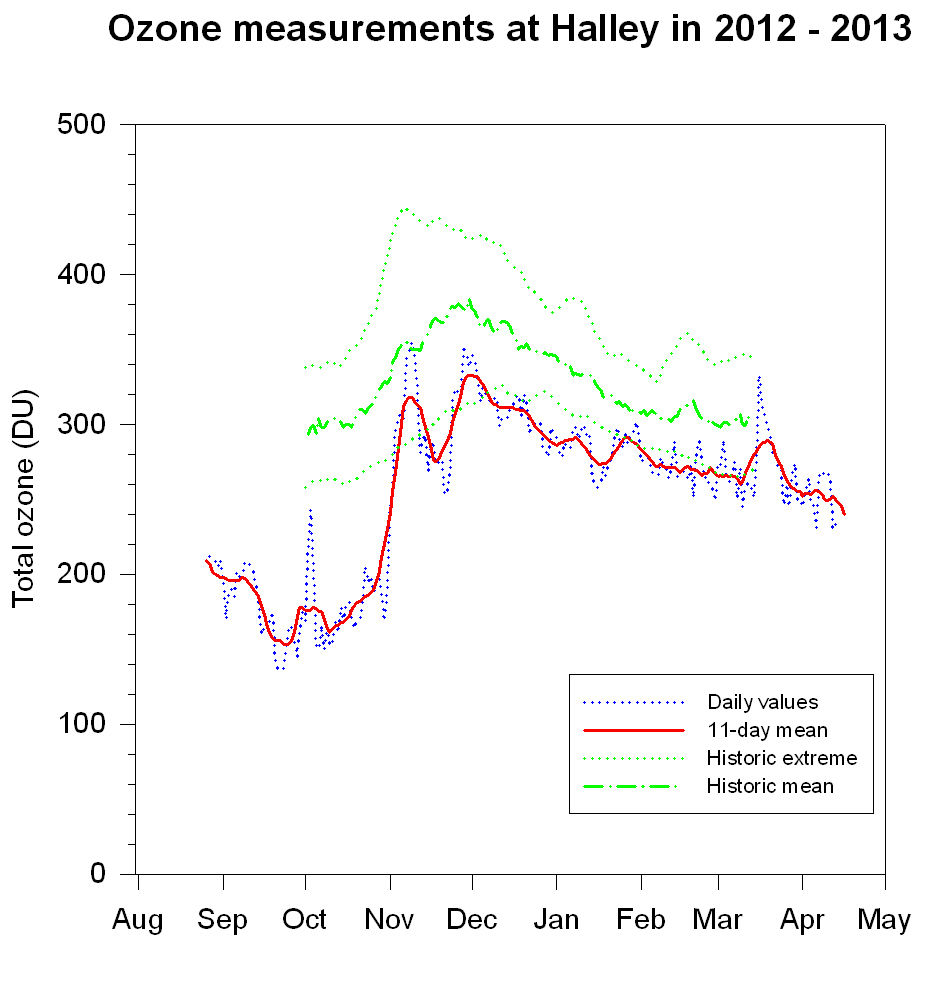
12-13,
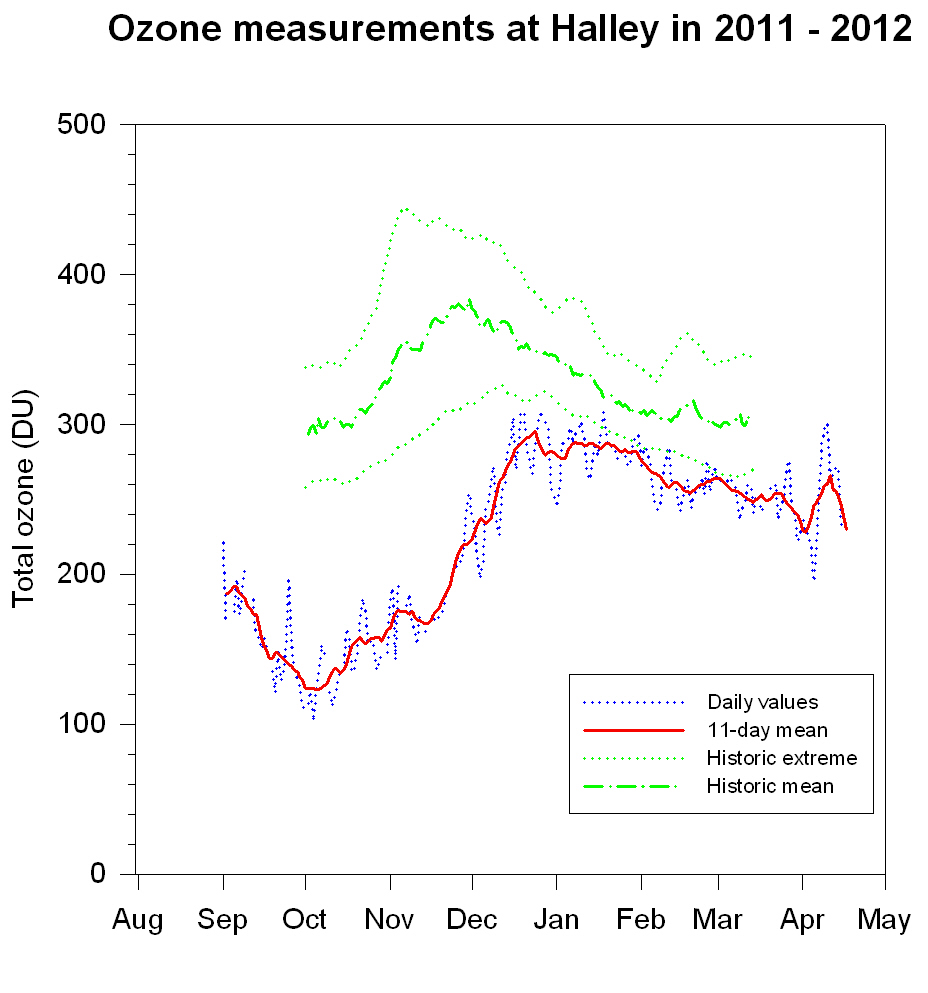
11-12,
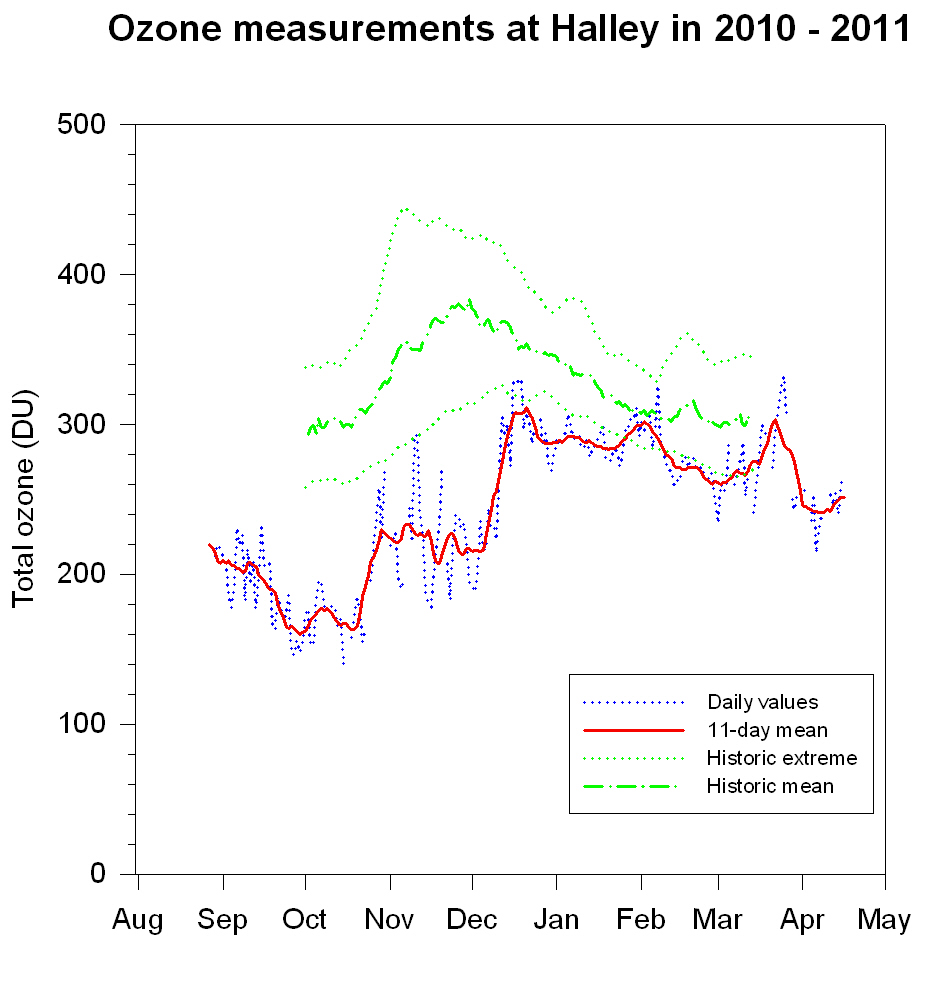
10-11,
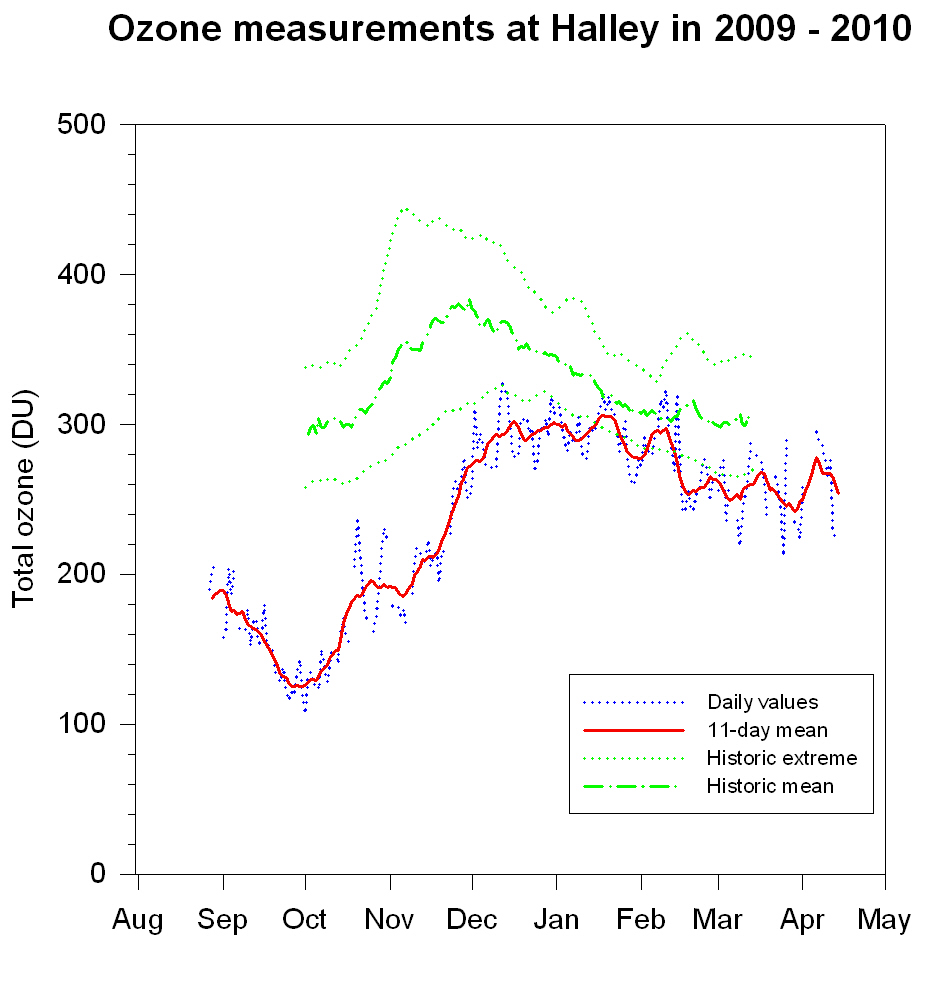
09-10,
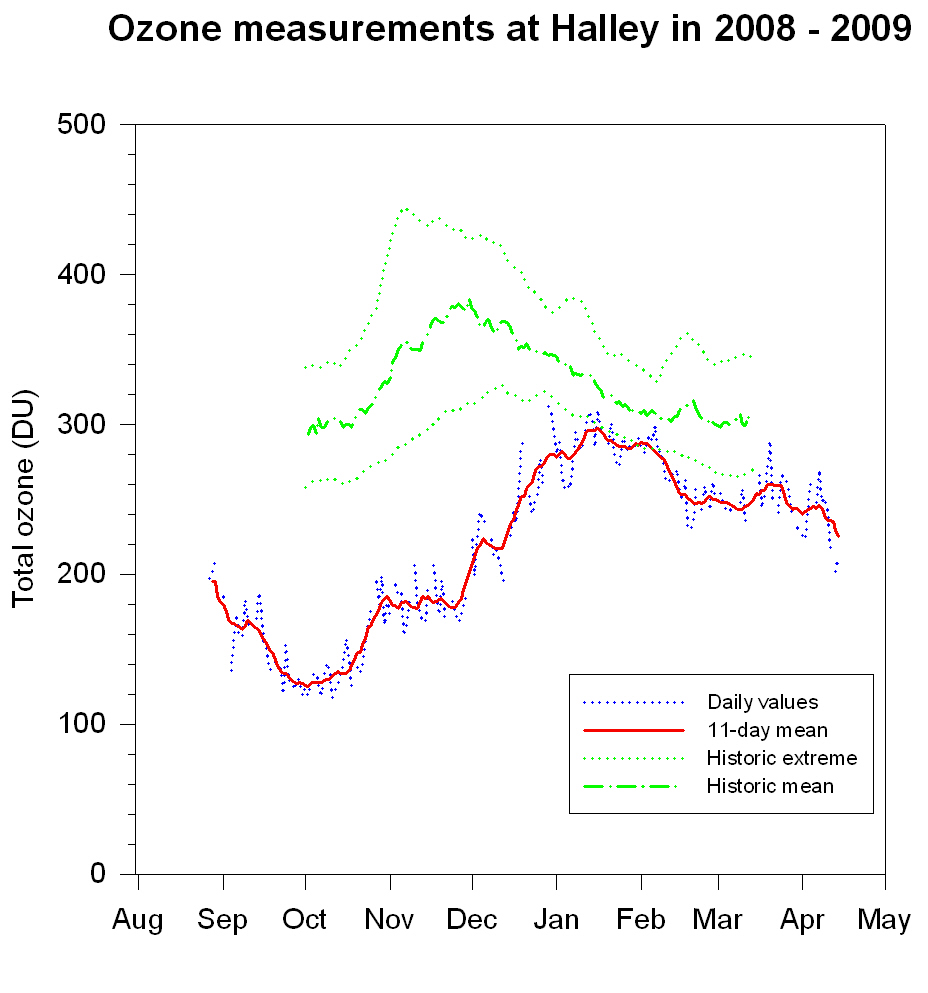
08-09,
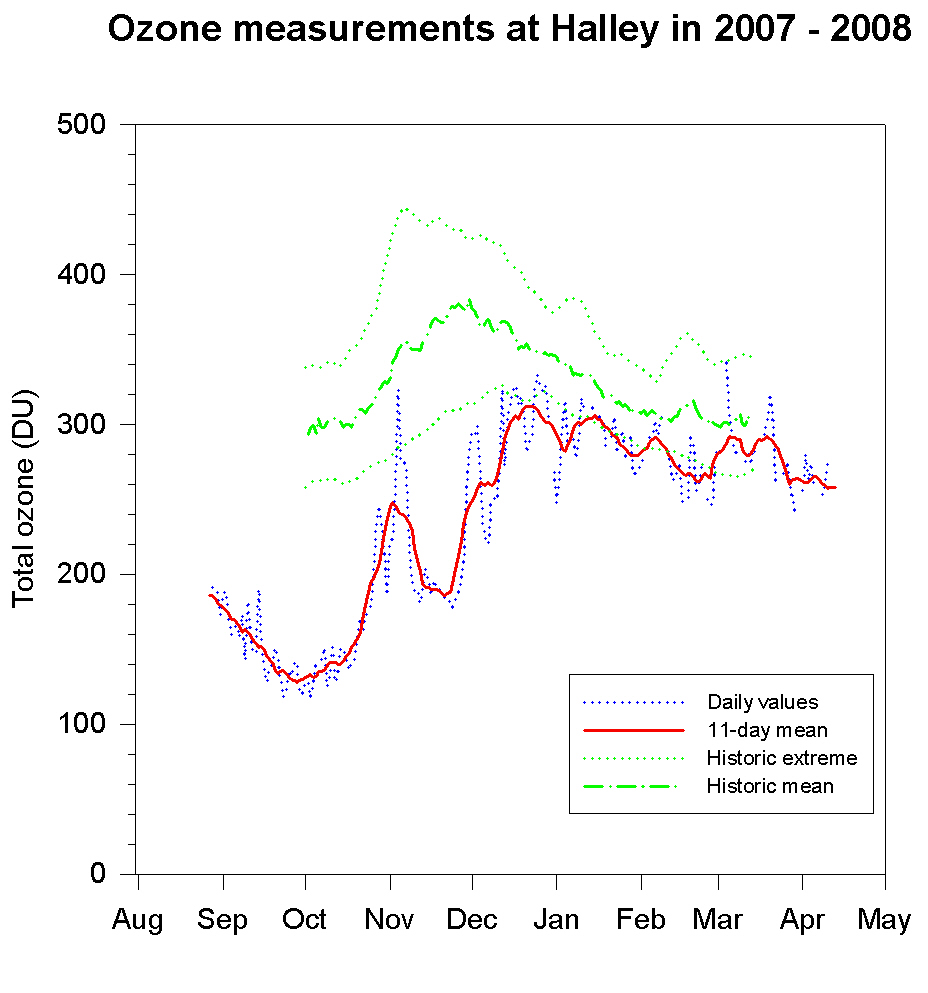
07-08,
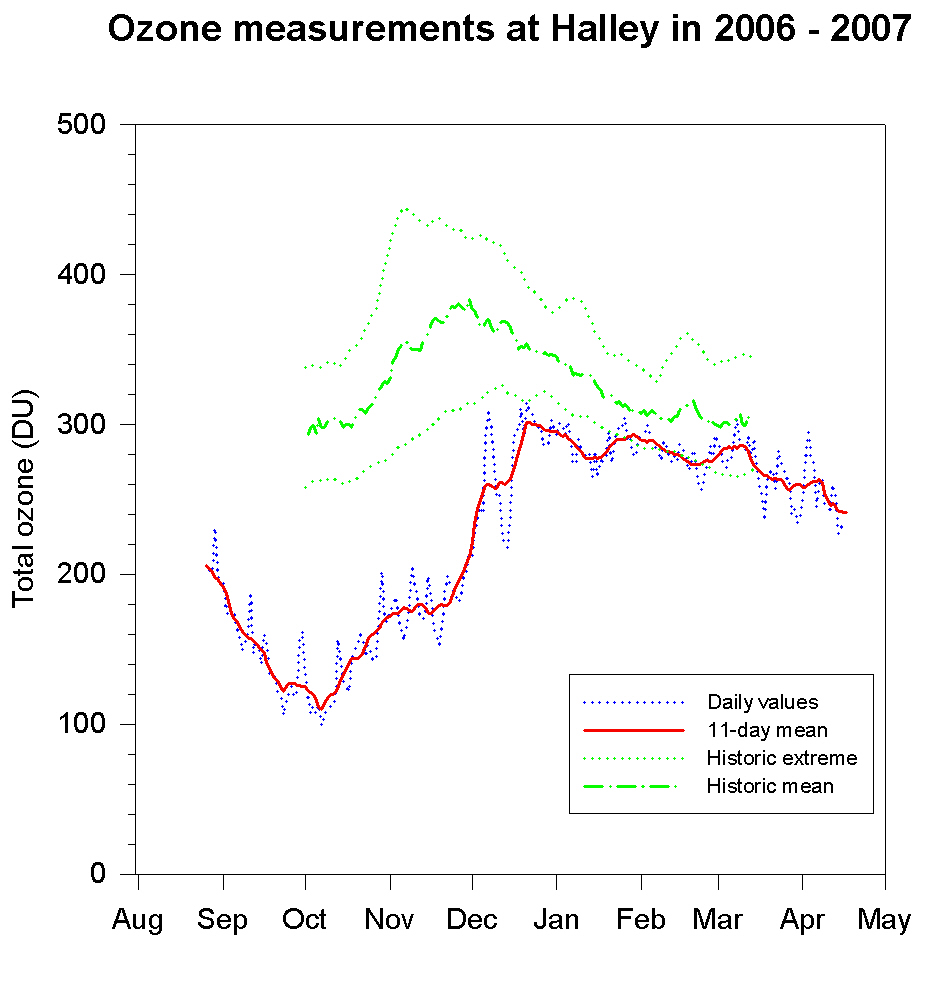
06-07,
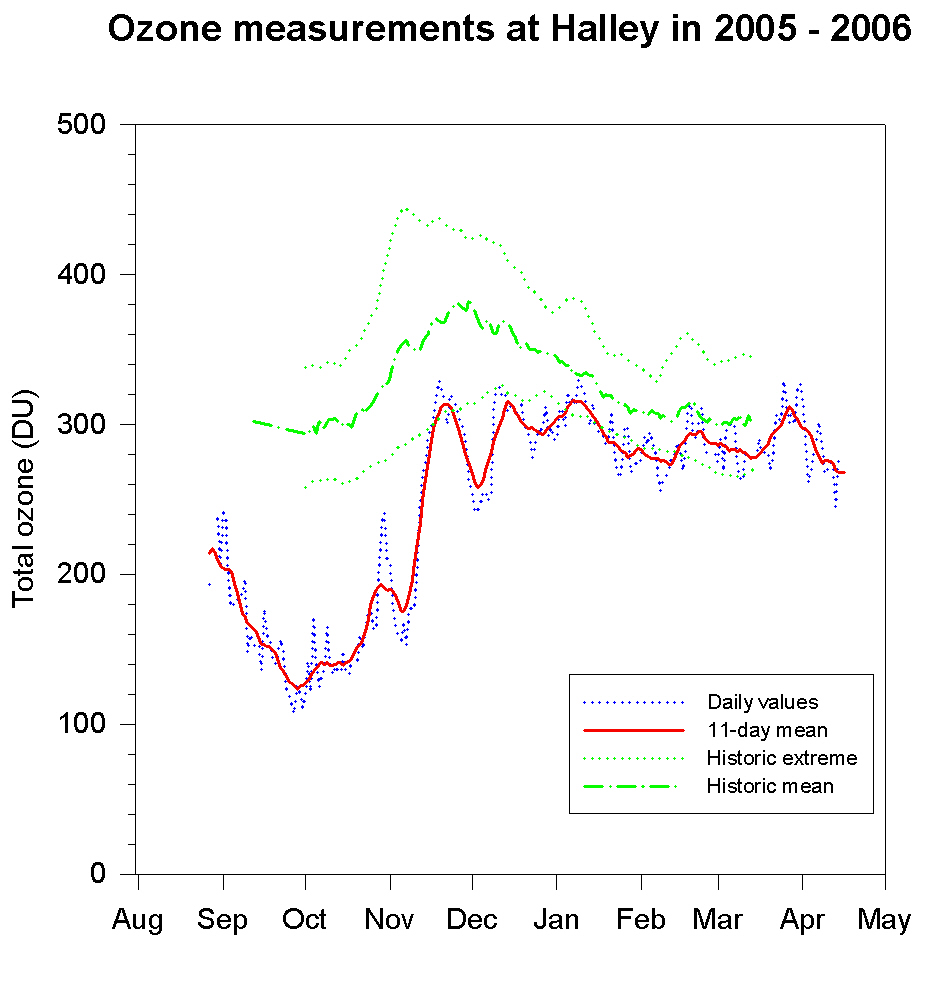
05-06,
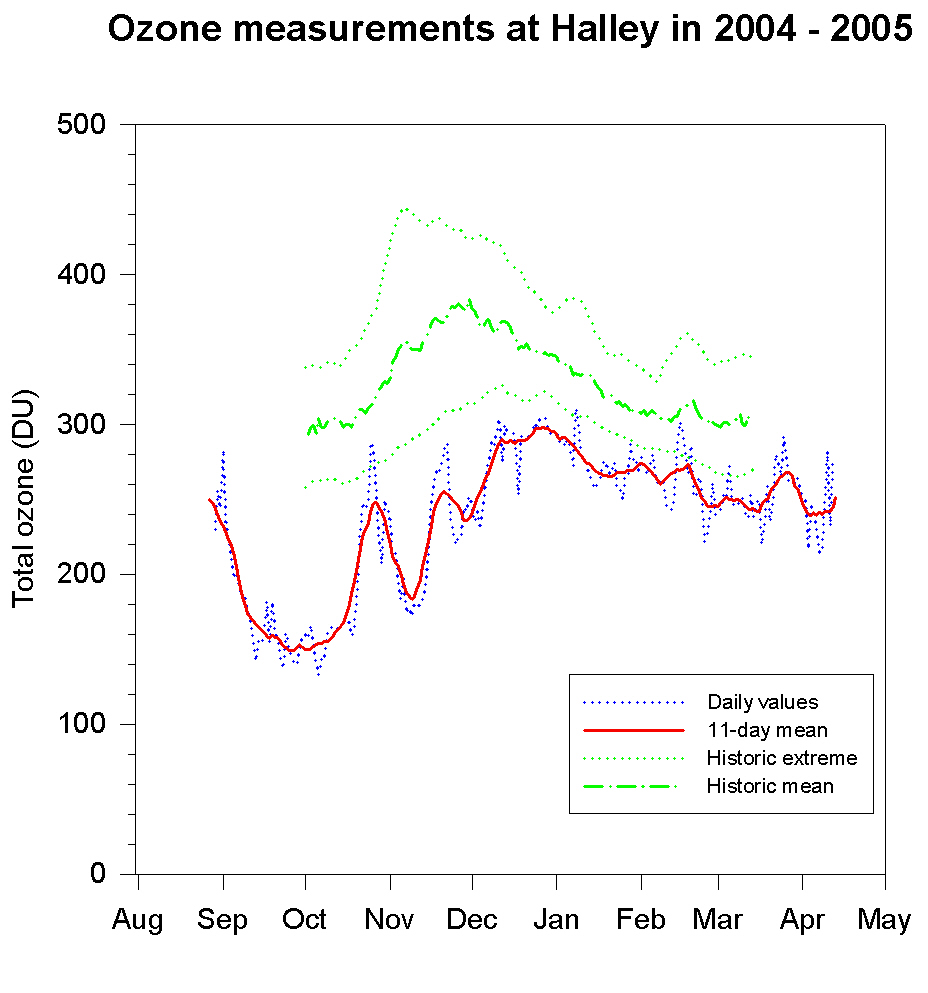
04-05,
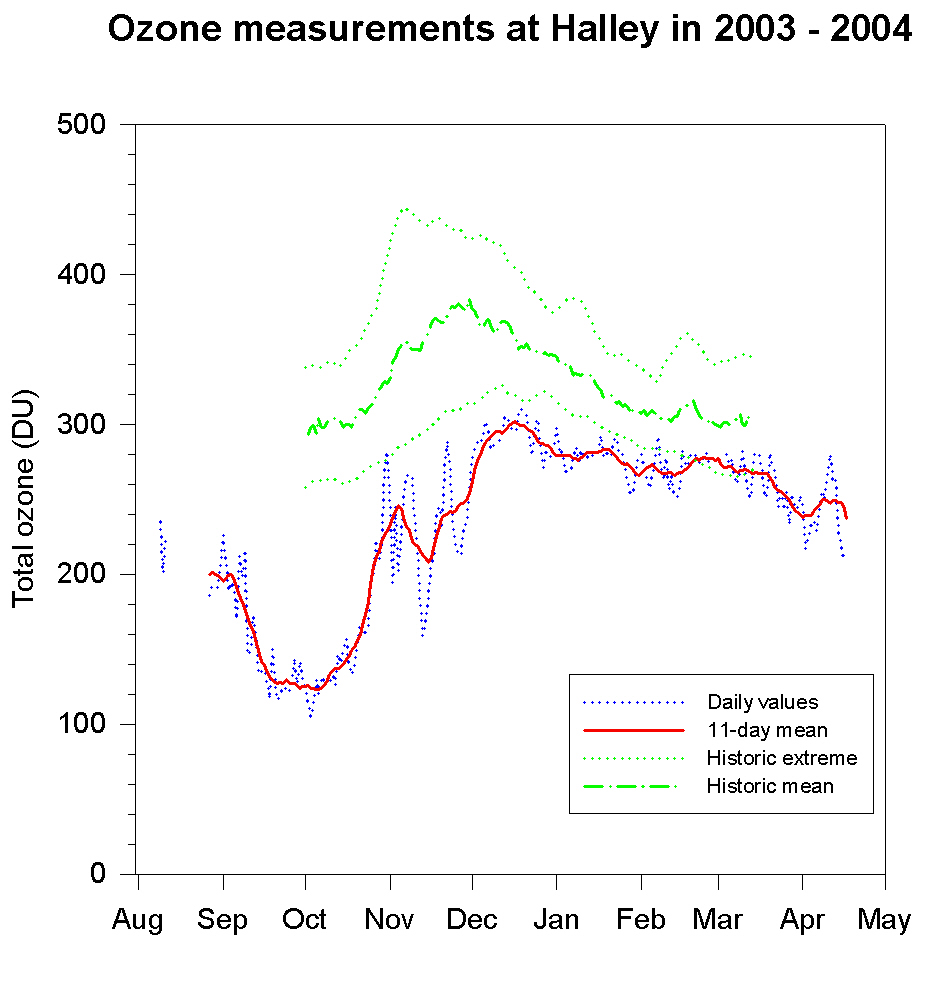
03-04,
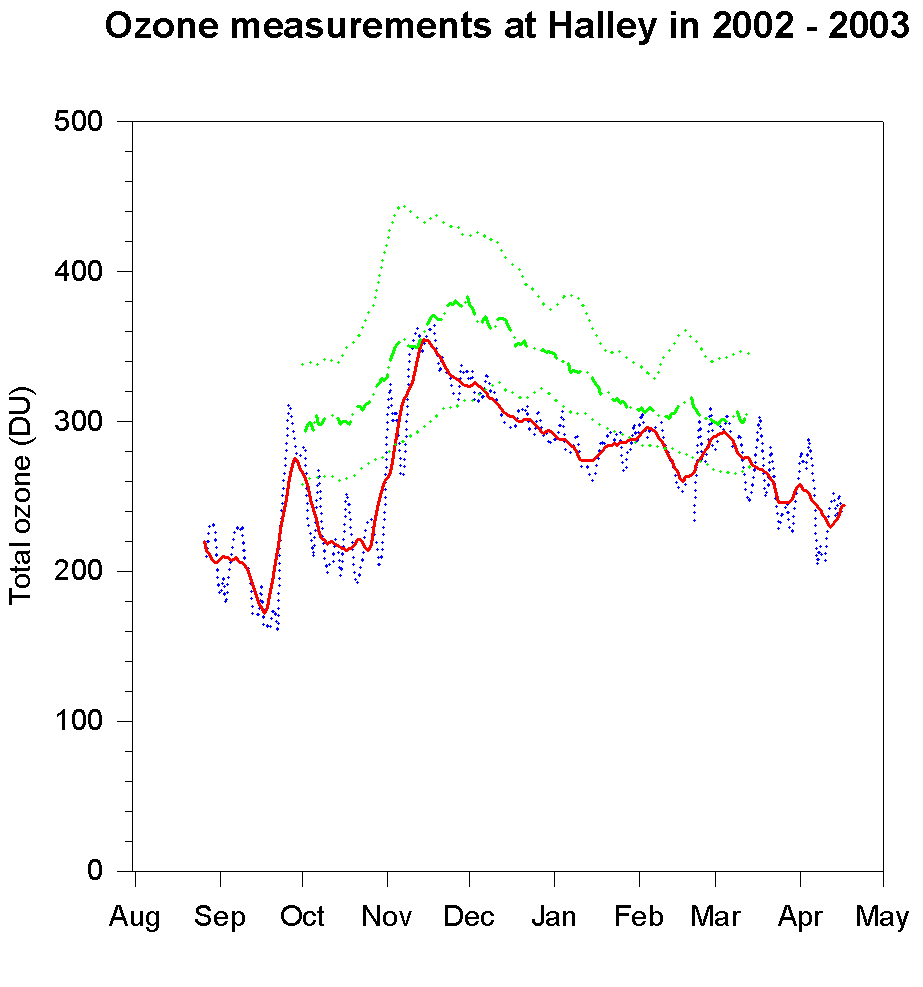
02-03,
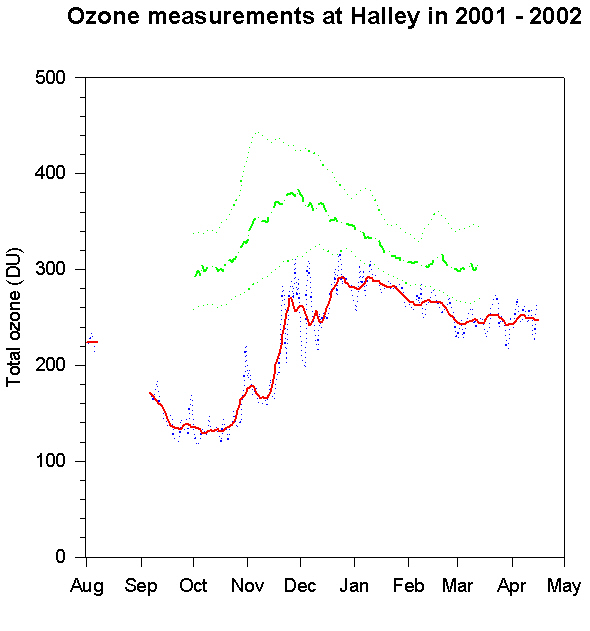
01-02.
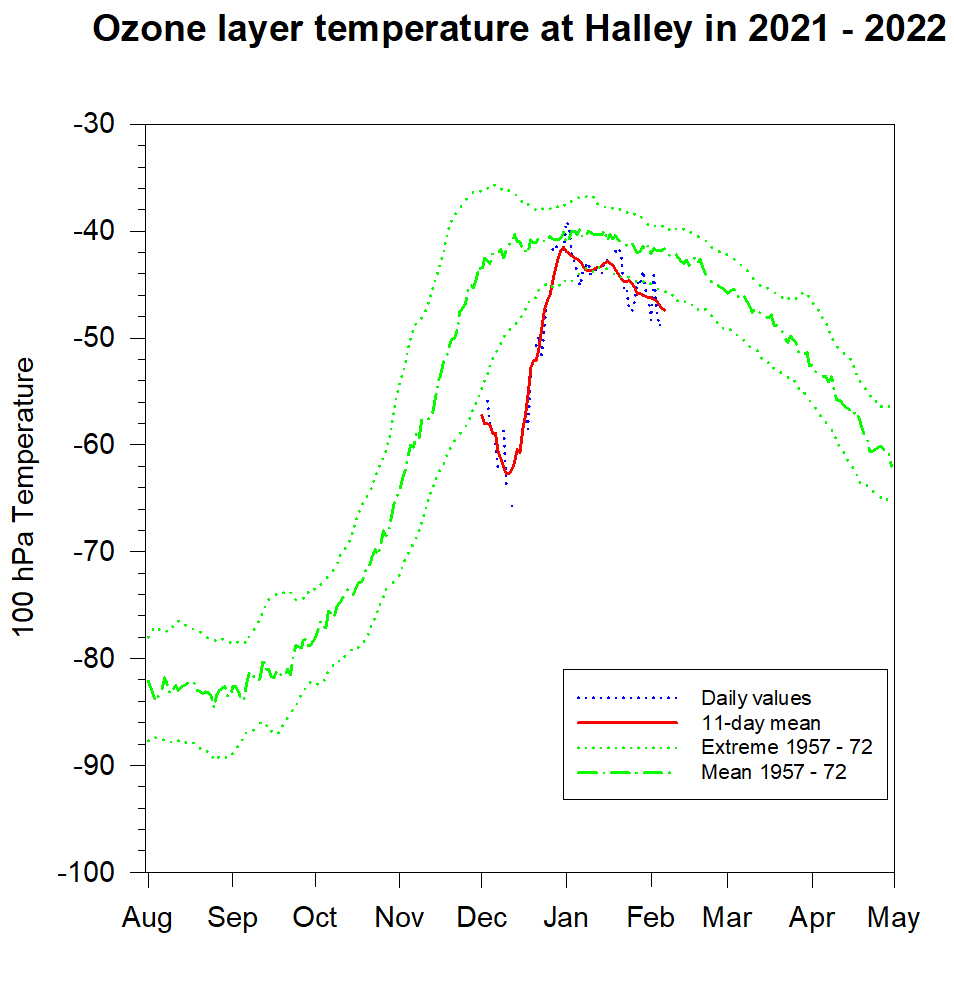
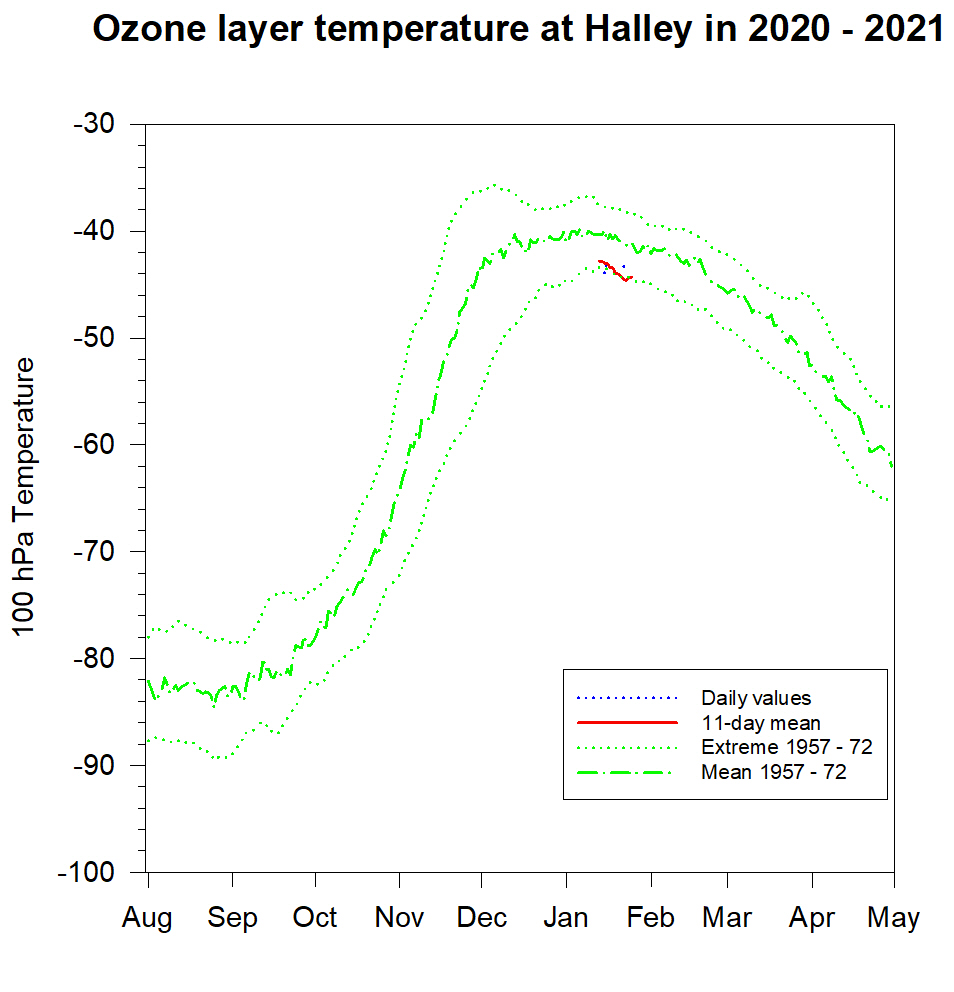
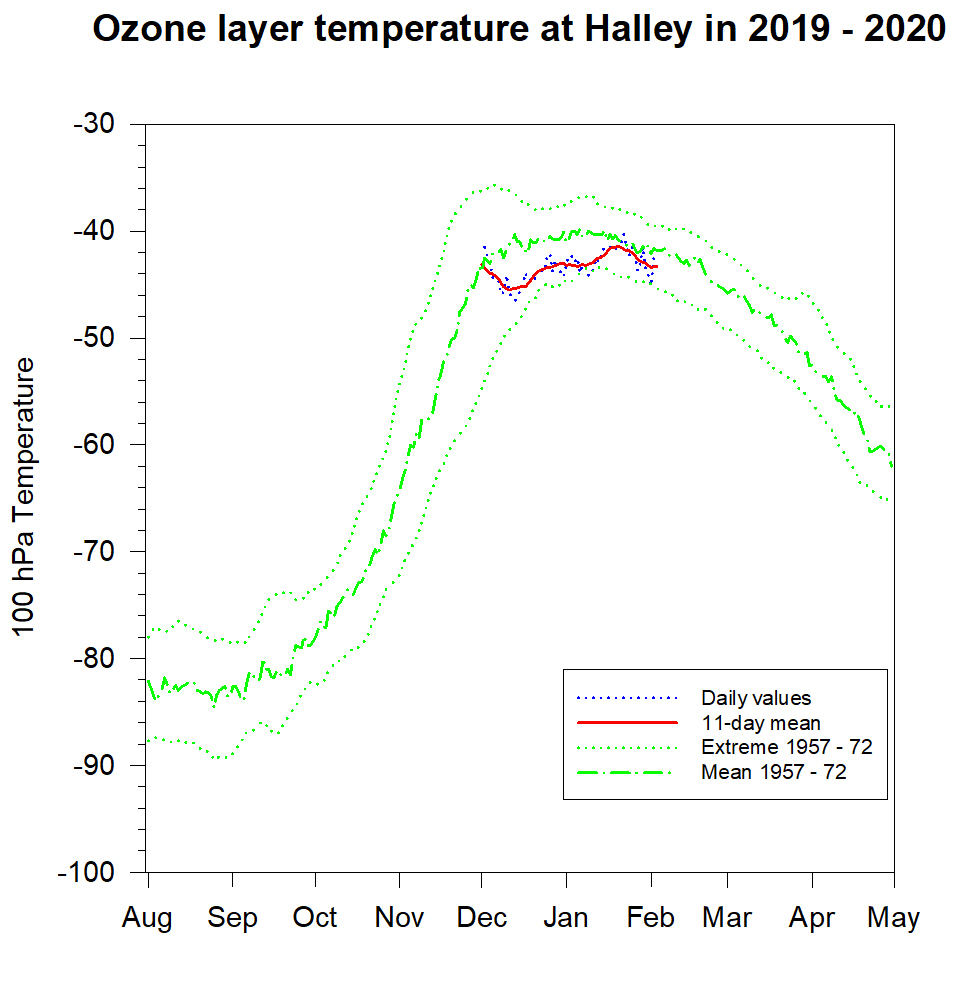
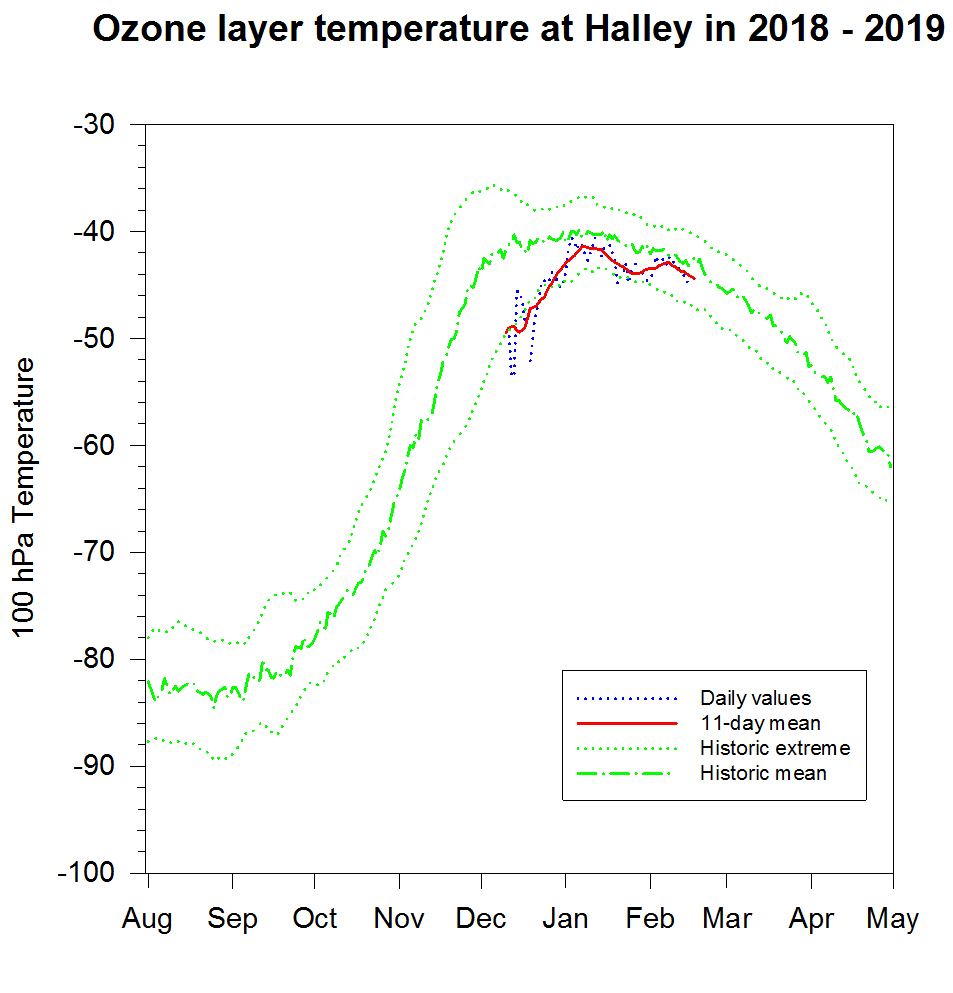
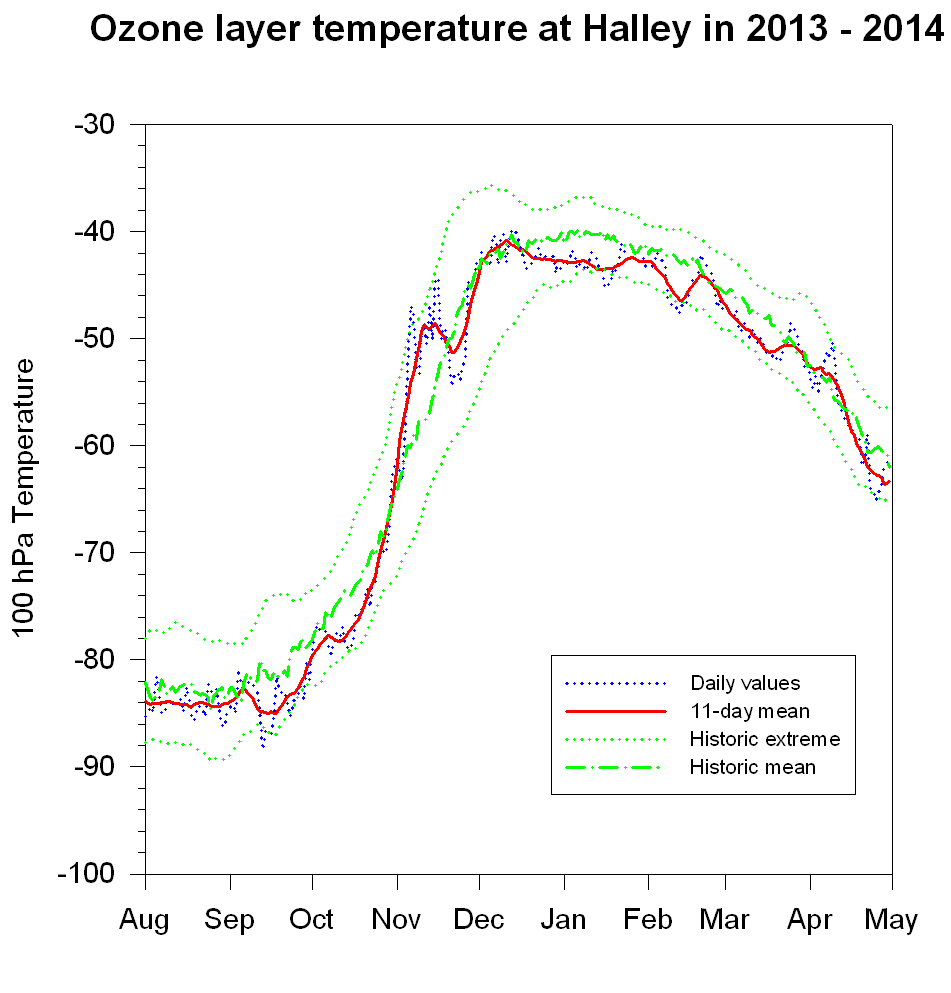
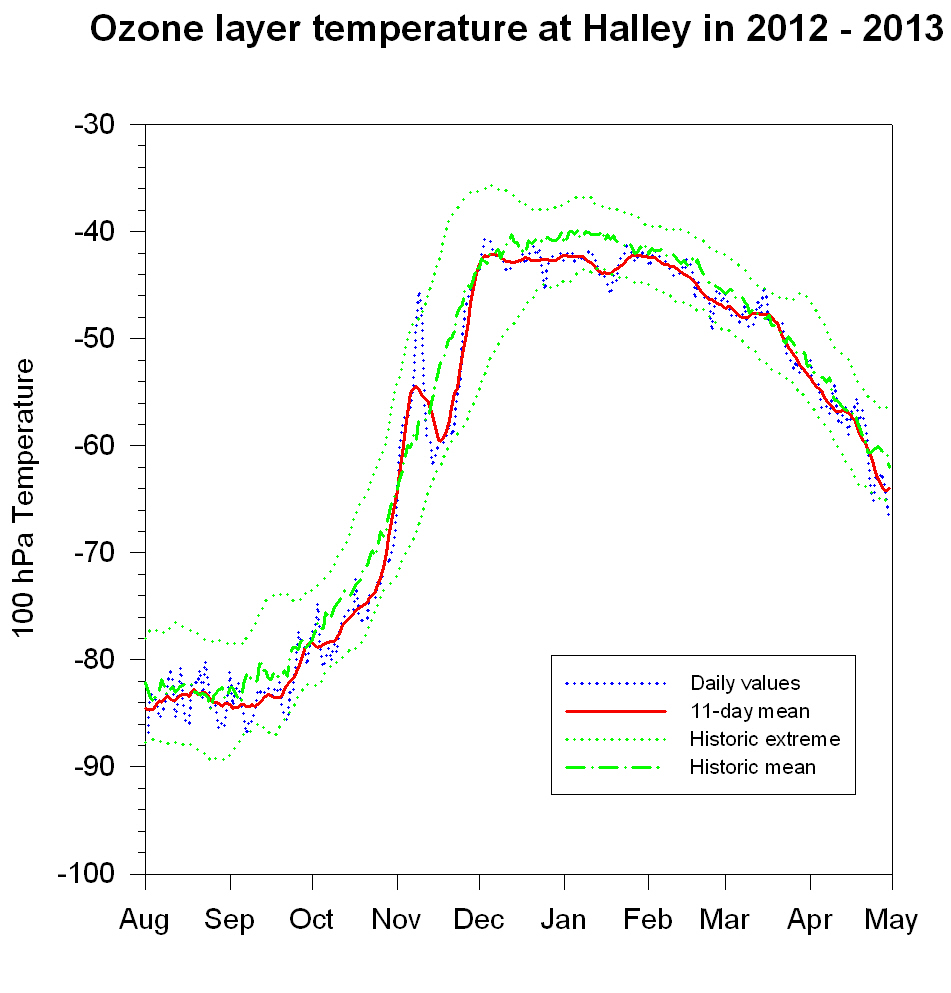
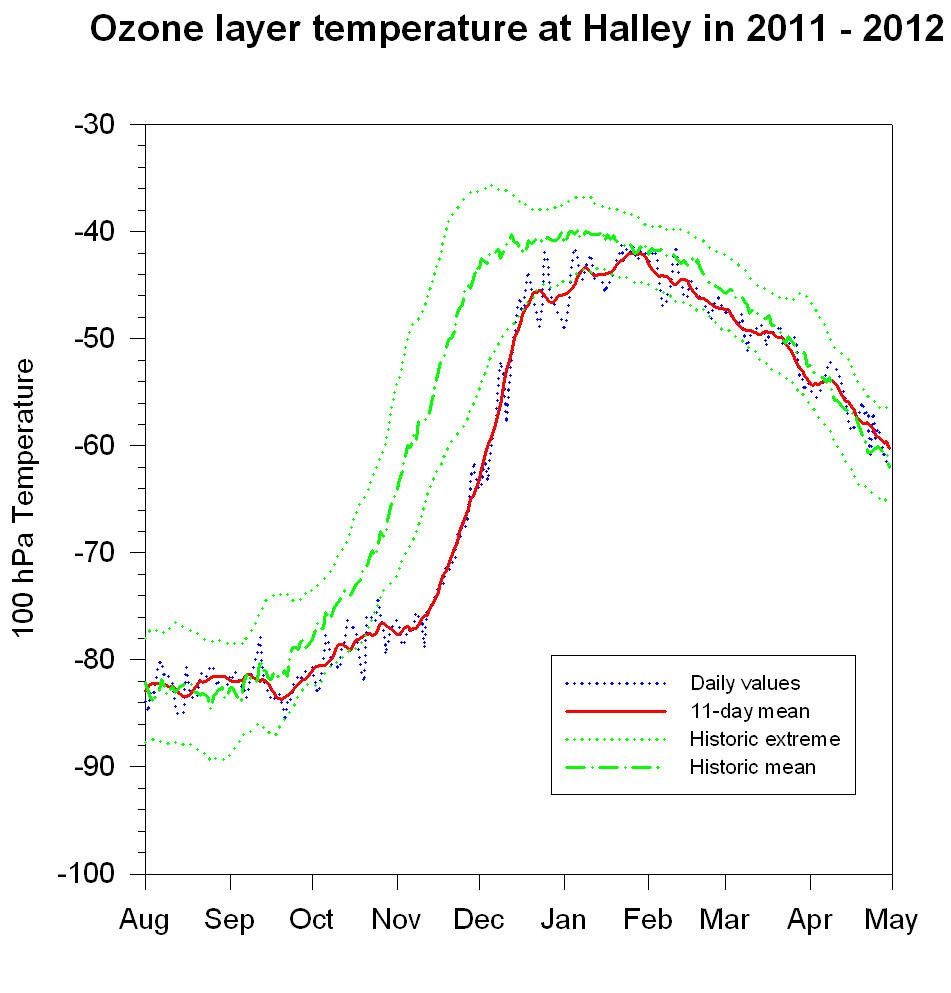
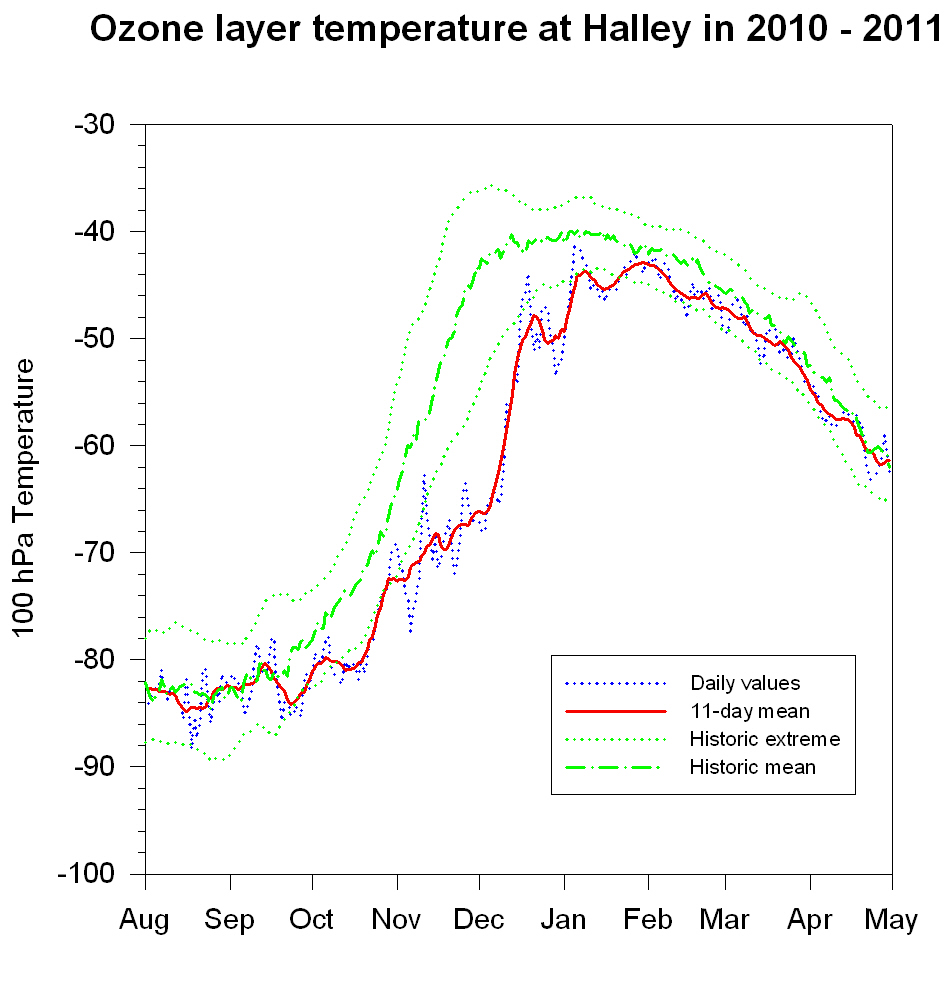
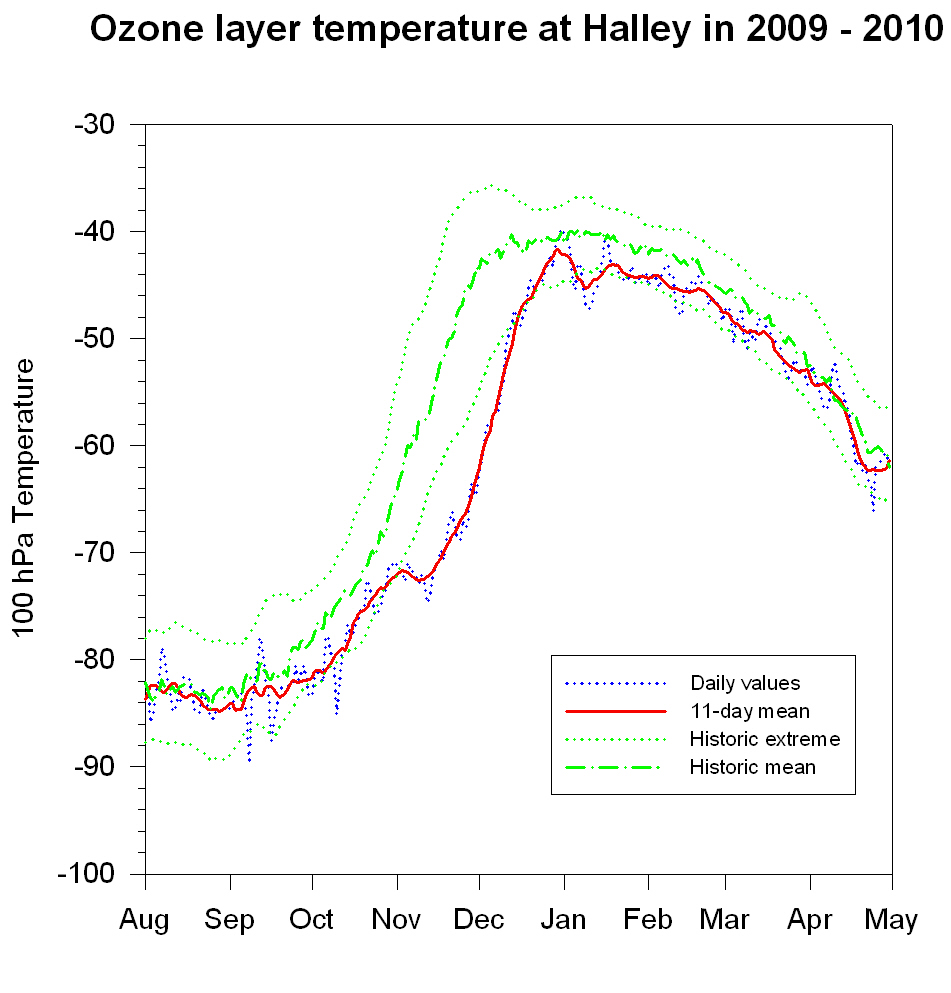
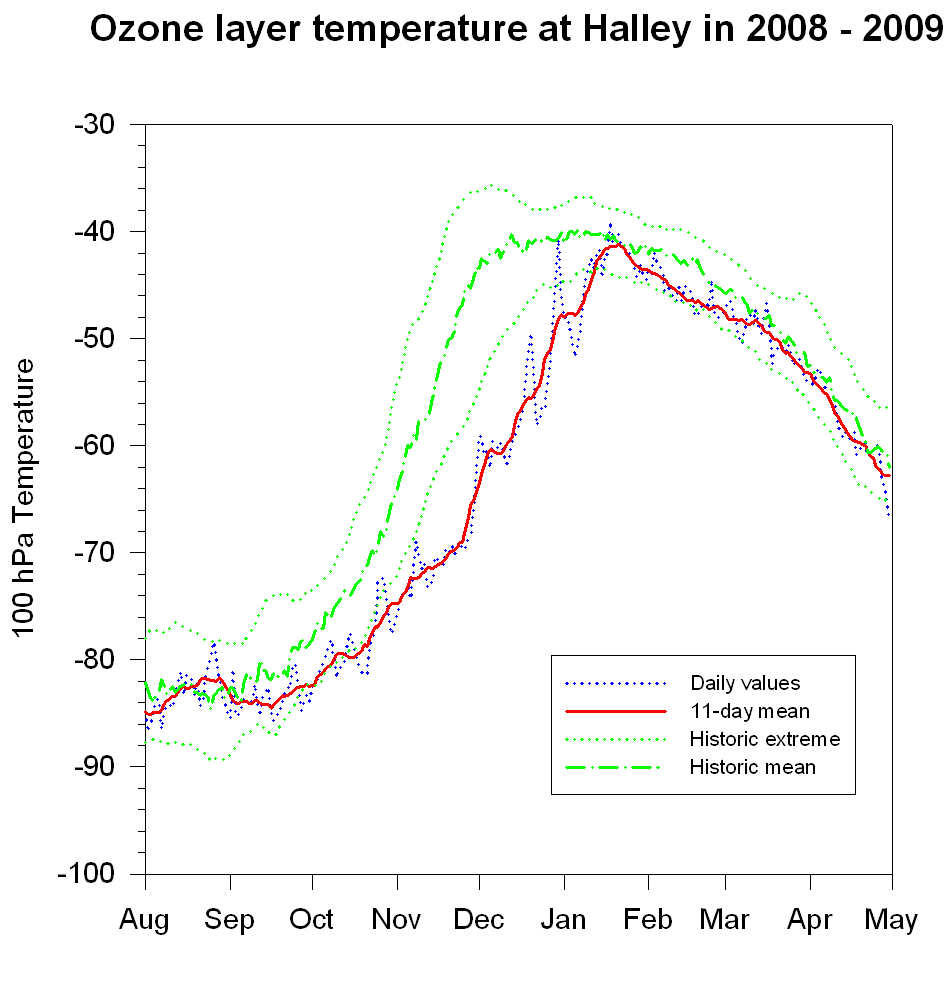
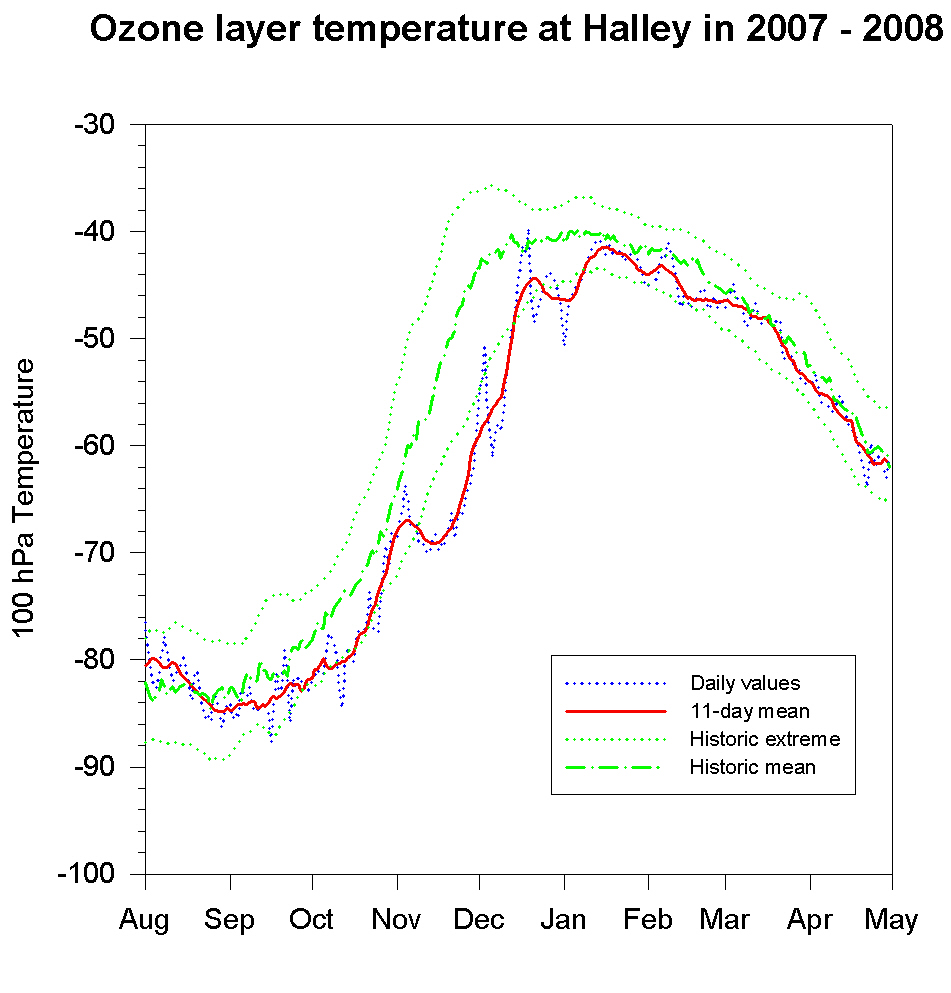
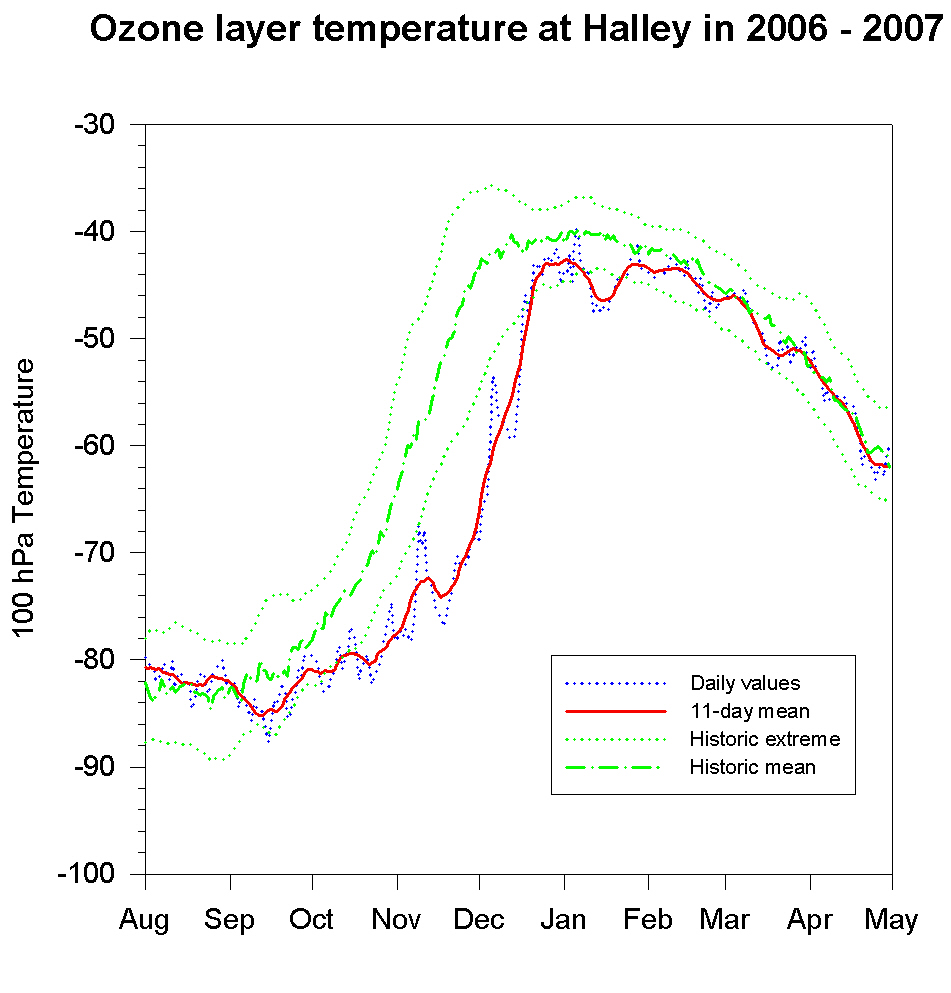
100 hPa temperature only
21-22,
20-21,
19-20,
18-19,
17-18,
16-17,
15-16,
14-15,
13-14,
12-13,
11-12,
10-11,
09-10,
08-09,
07-08,
06-07,
05-06,
04-05,
03-04,
02-03,
01-02.
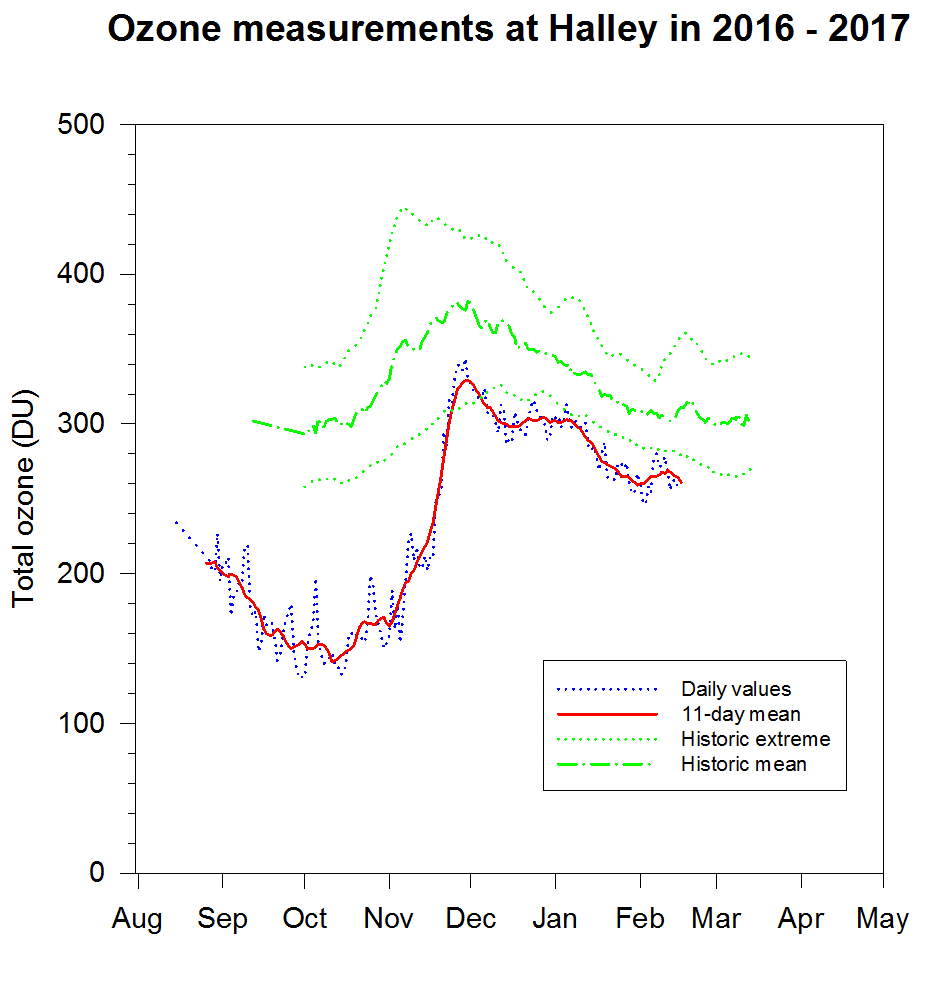
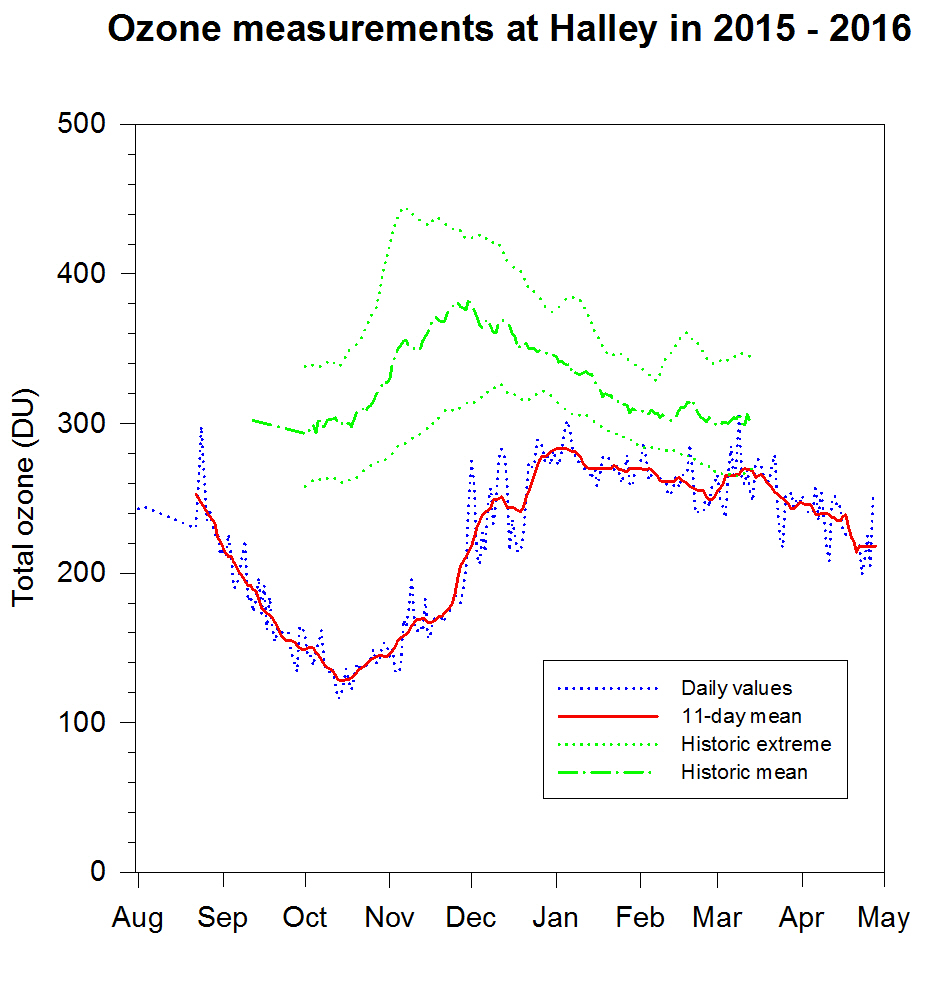
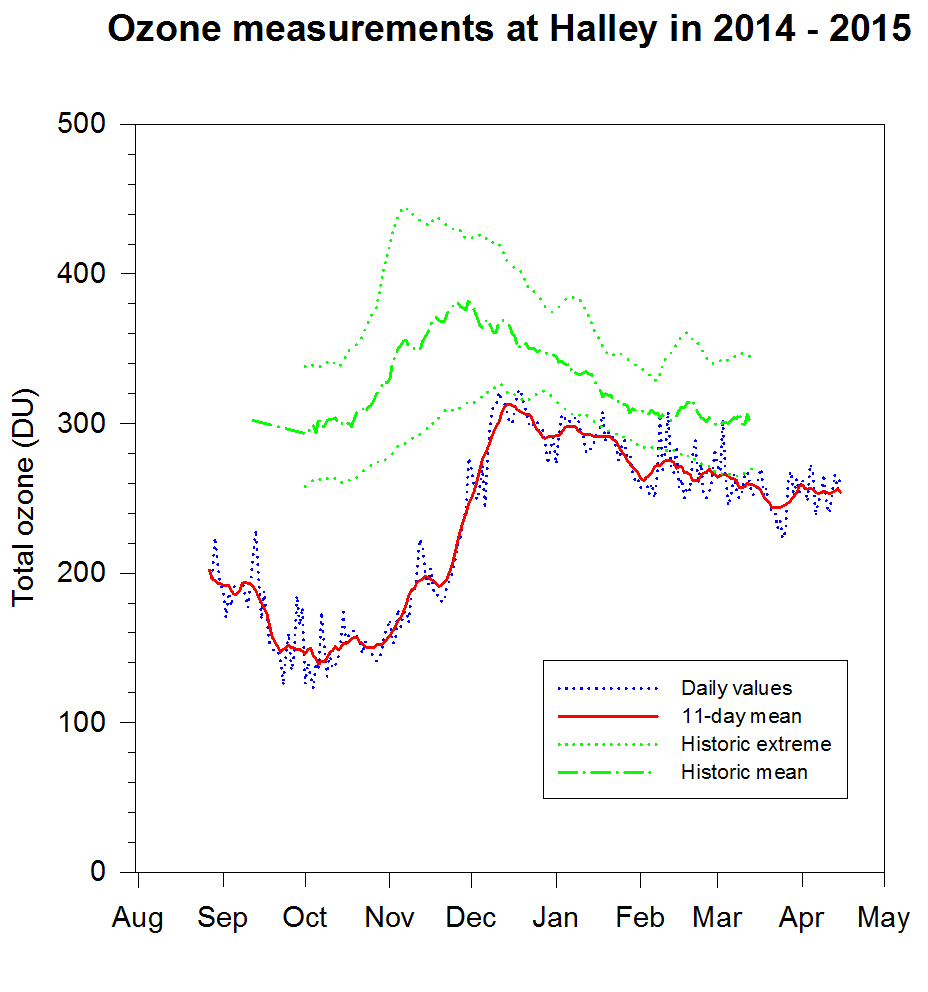
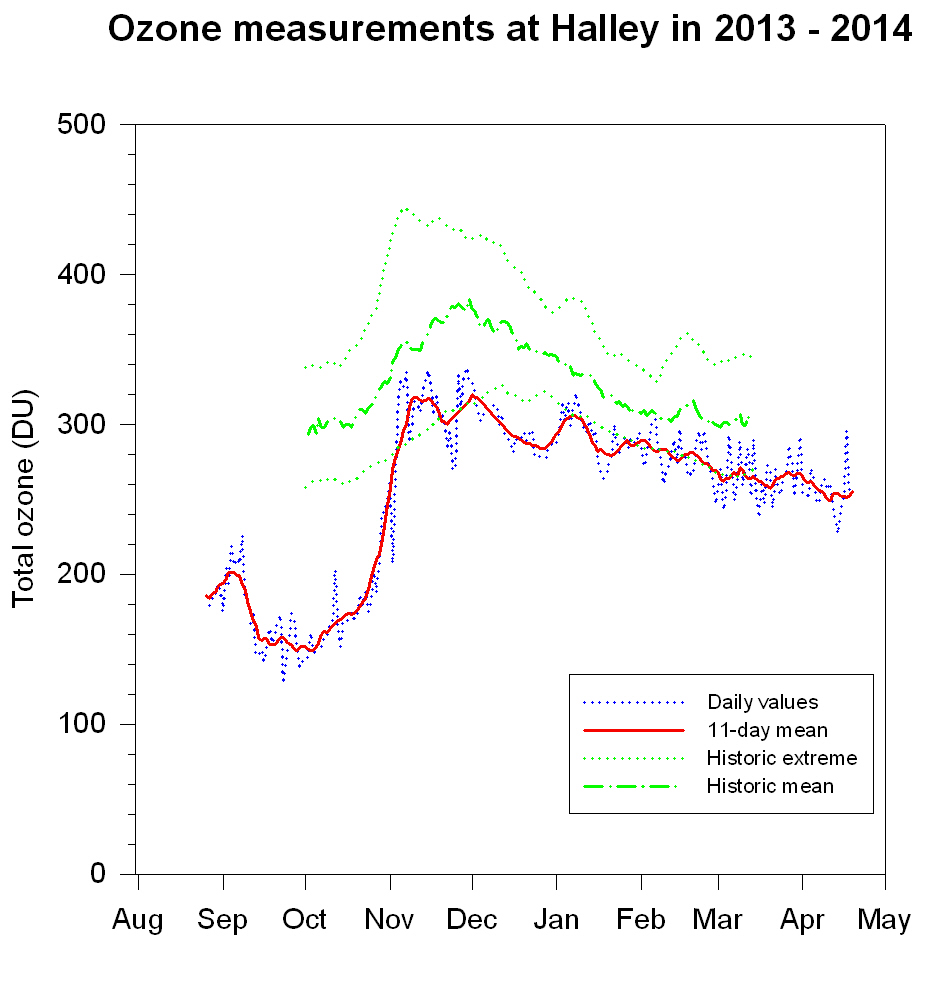
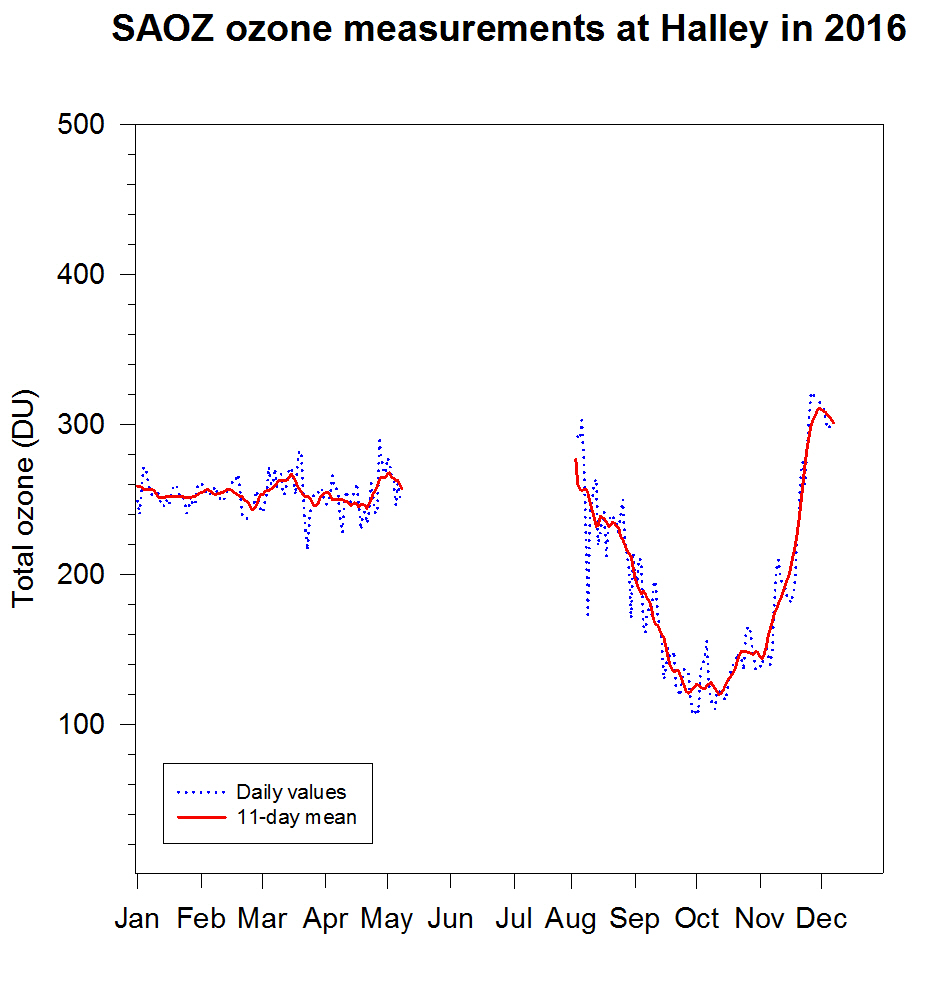
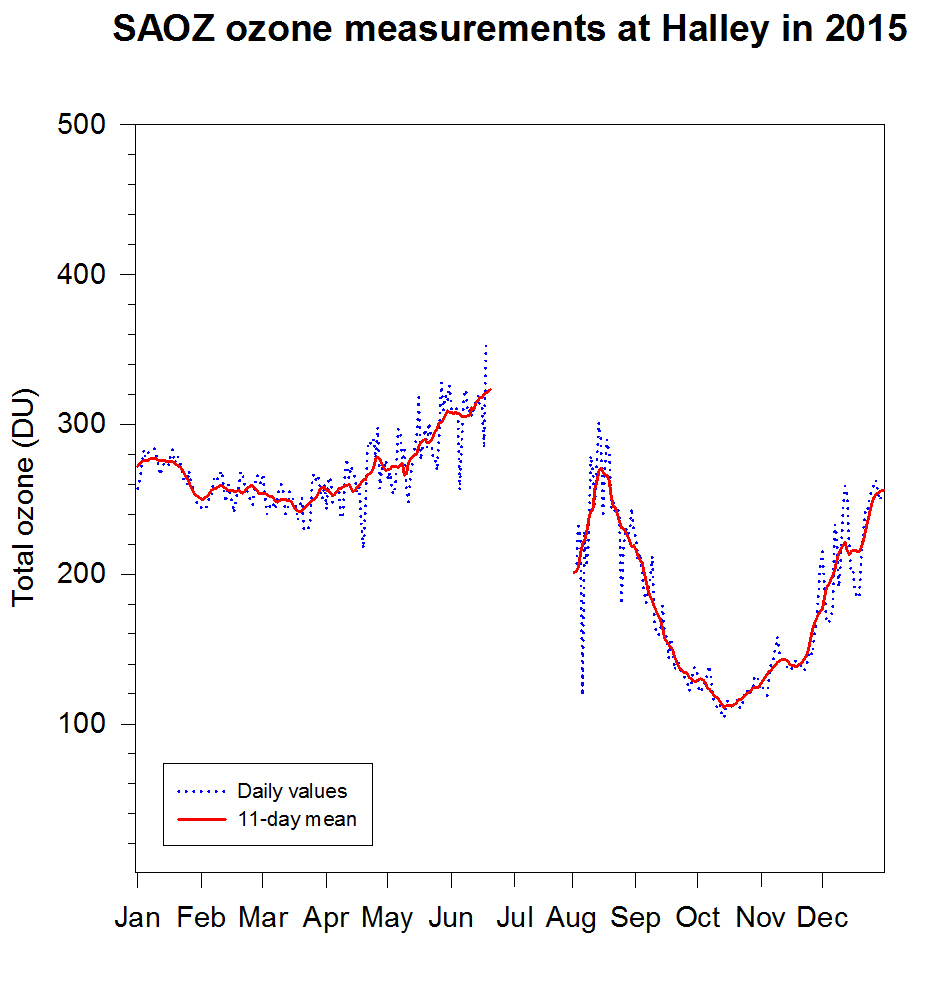
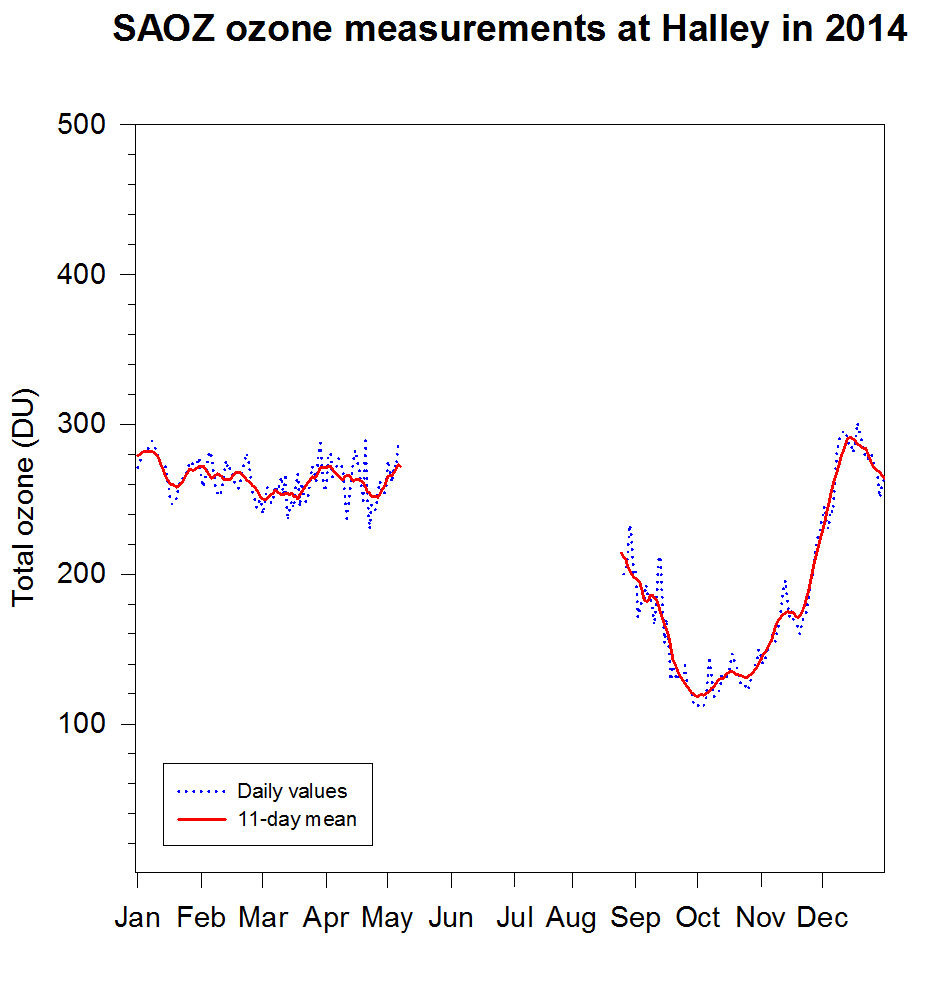
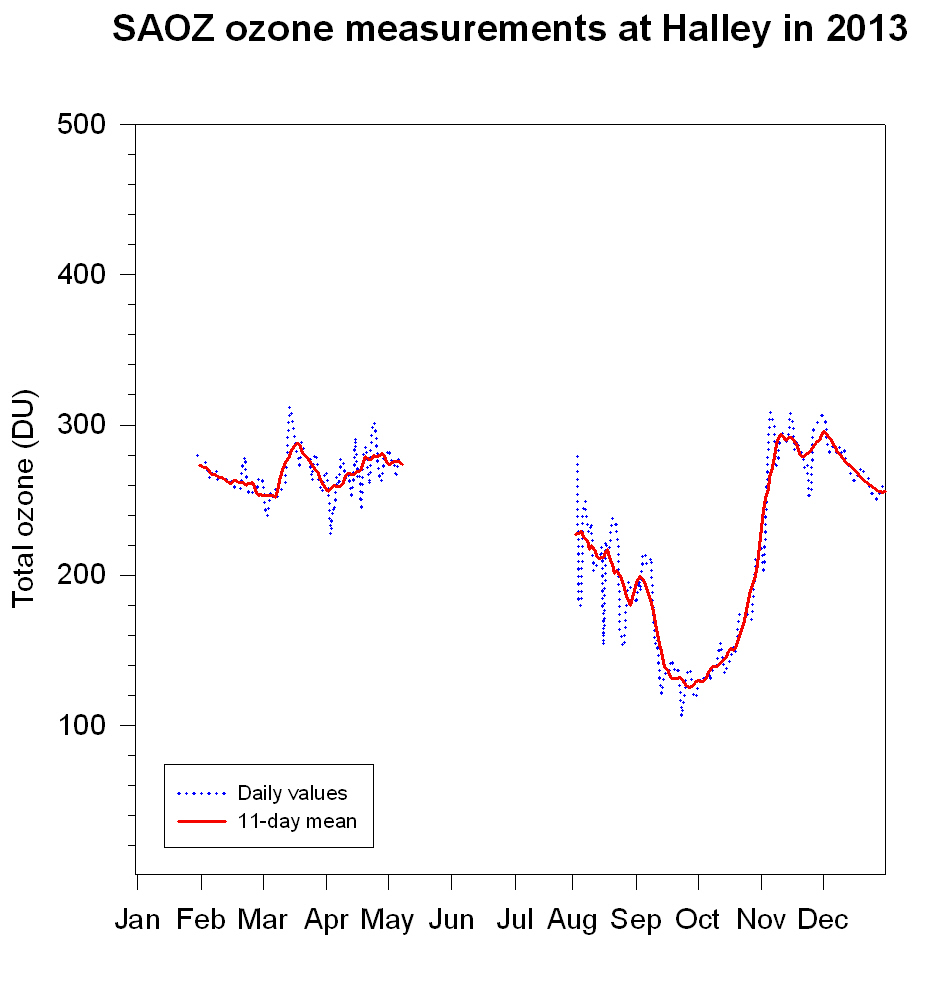
SAOZ ozone
2016,
2015,
2014,
2013,
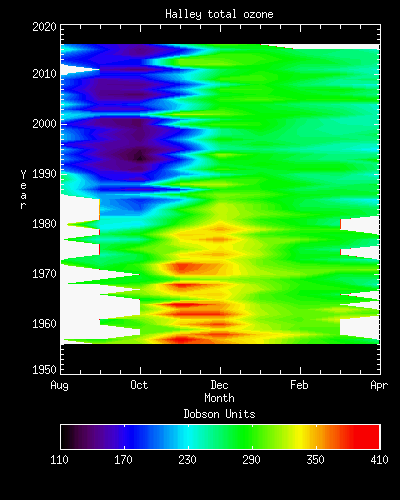
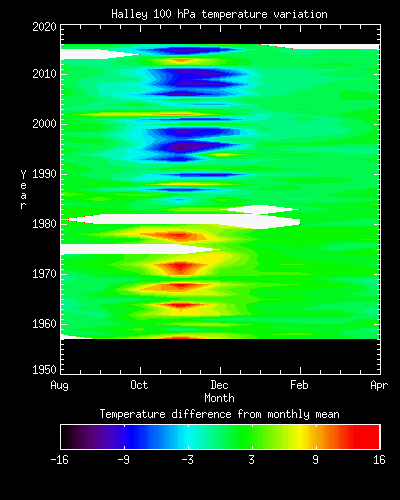
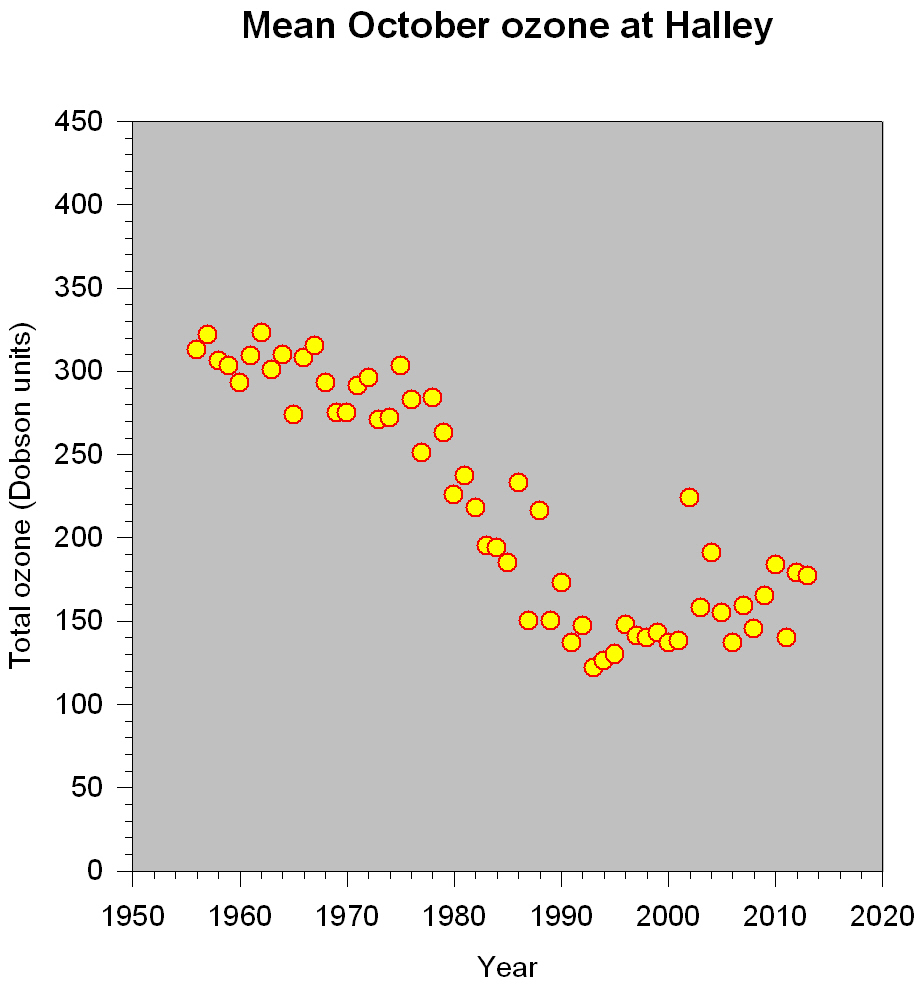
The monthly means from 1956 - 2016 give a complete picture of the changes in ozone amount and 100 hPa temperature at Halley, which is greatest in October. Note the strong QBO/ENSO signal in the complete picture. The minimum October or the minimum springtime values are beginning to show a slow recovery.
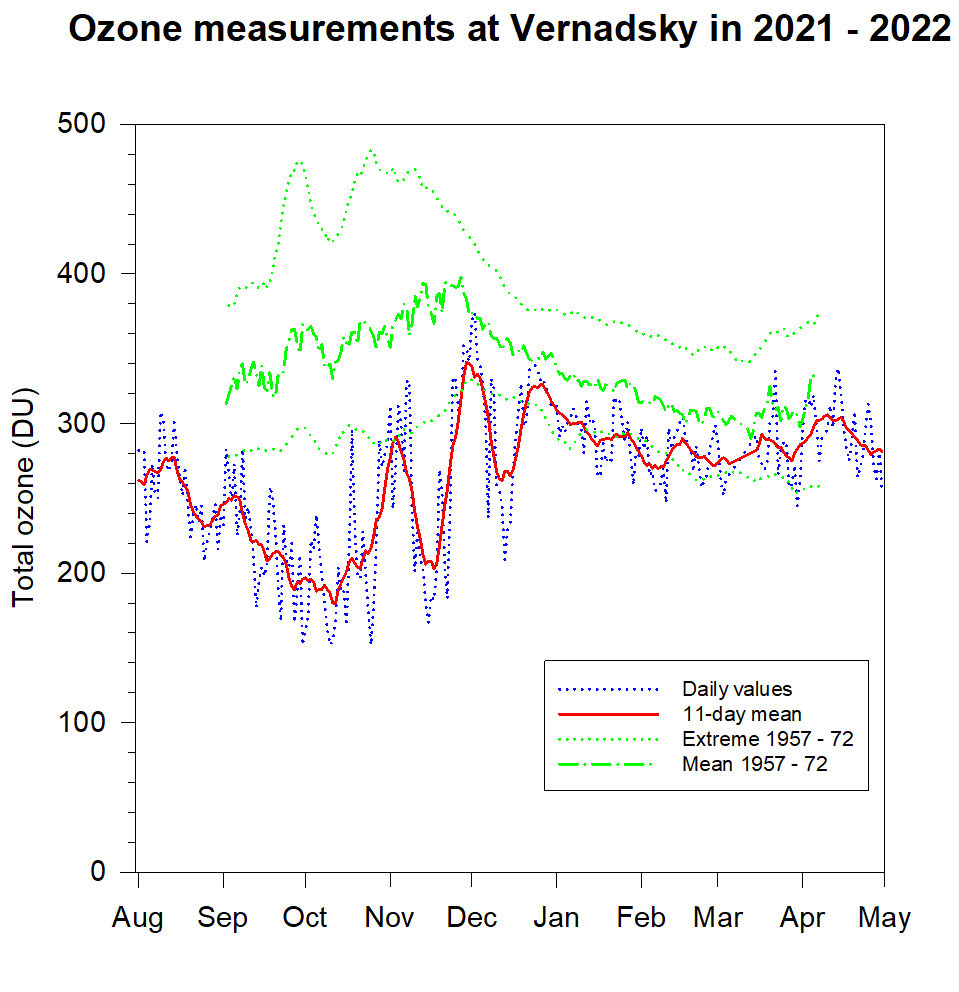
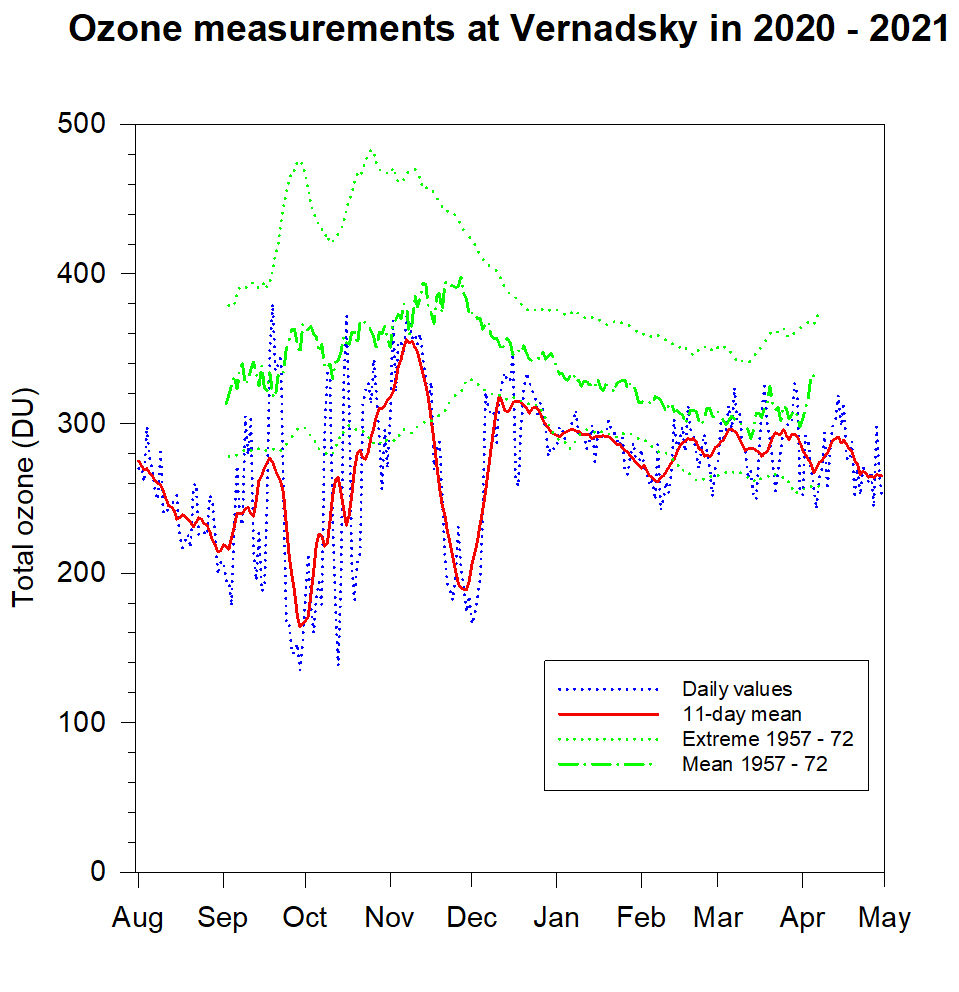
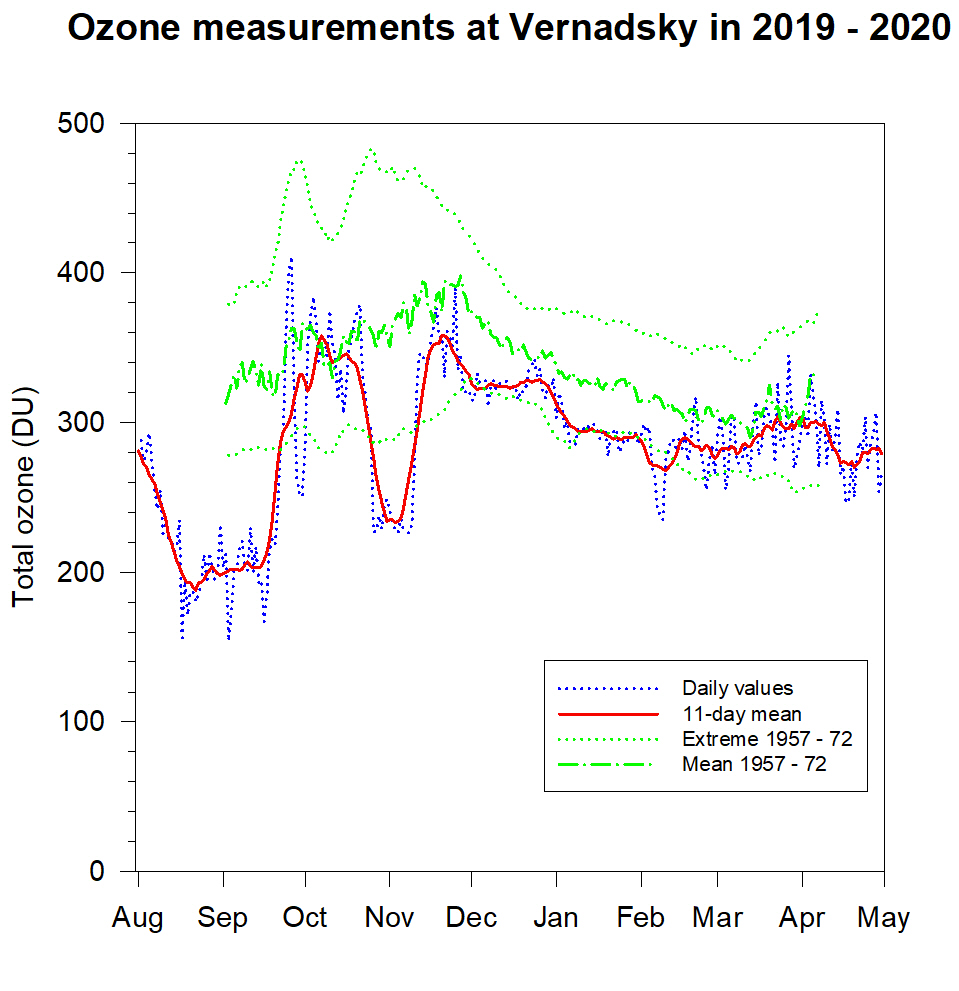
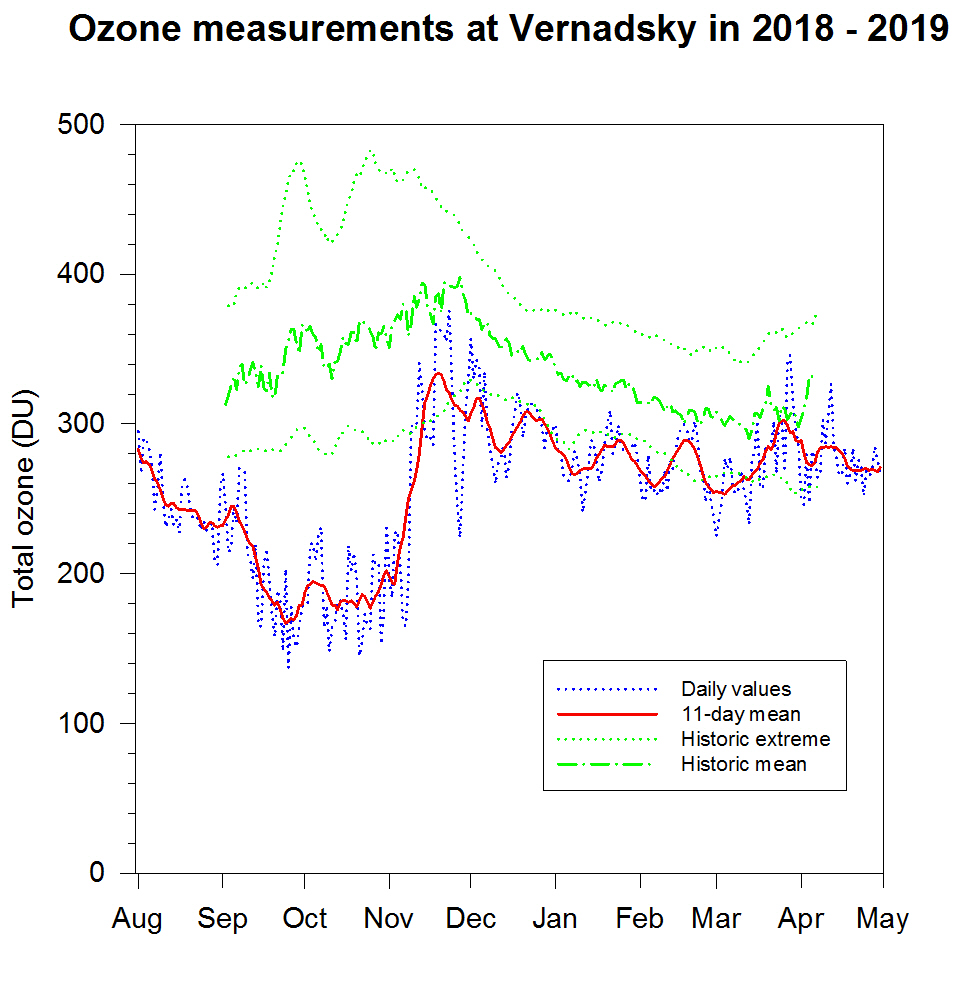
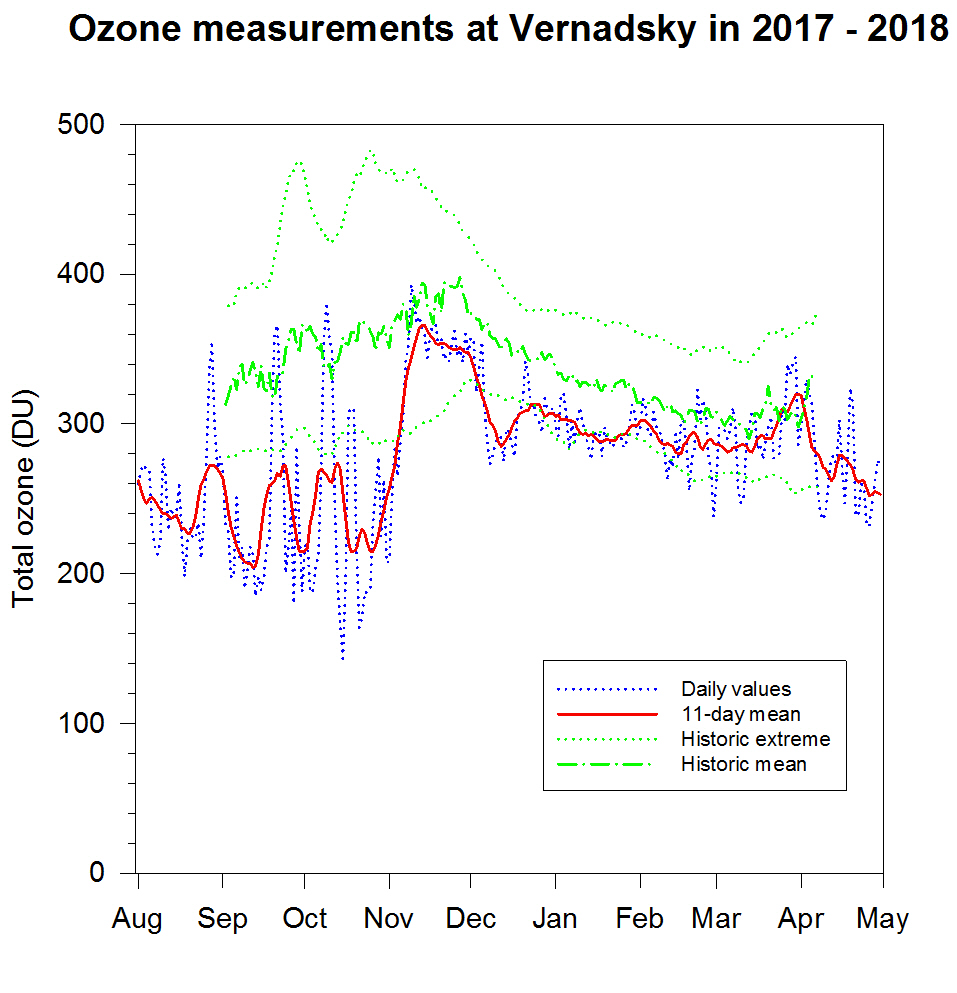
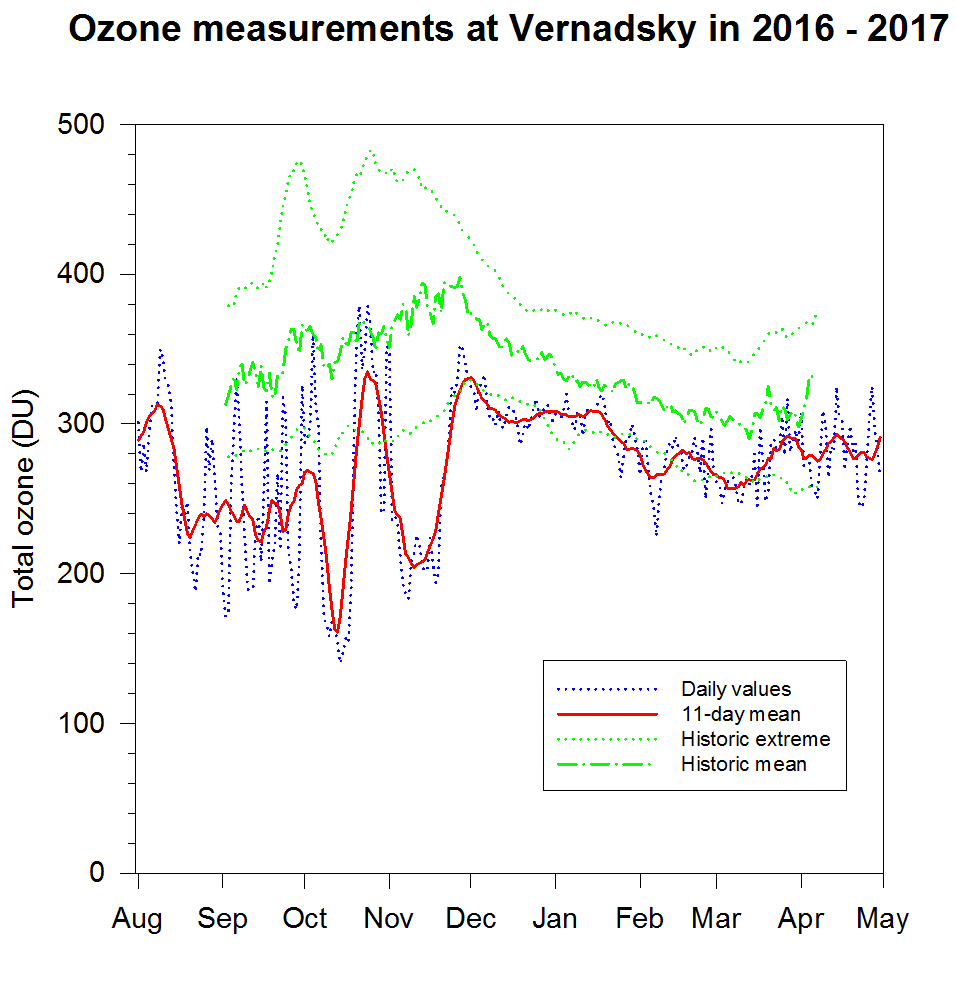
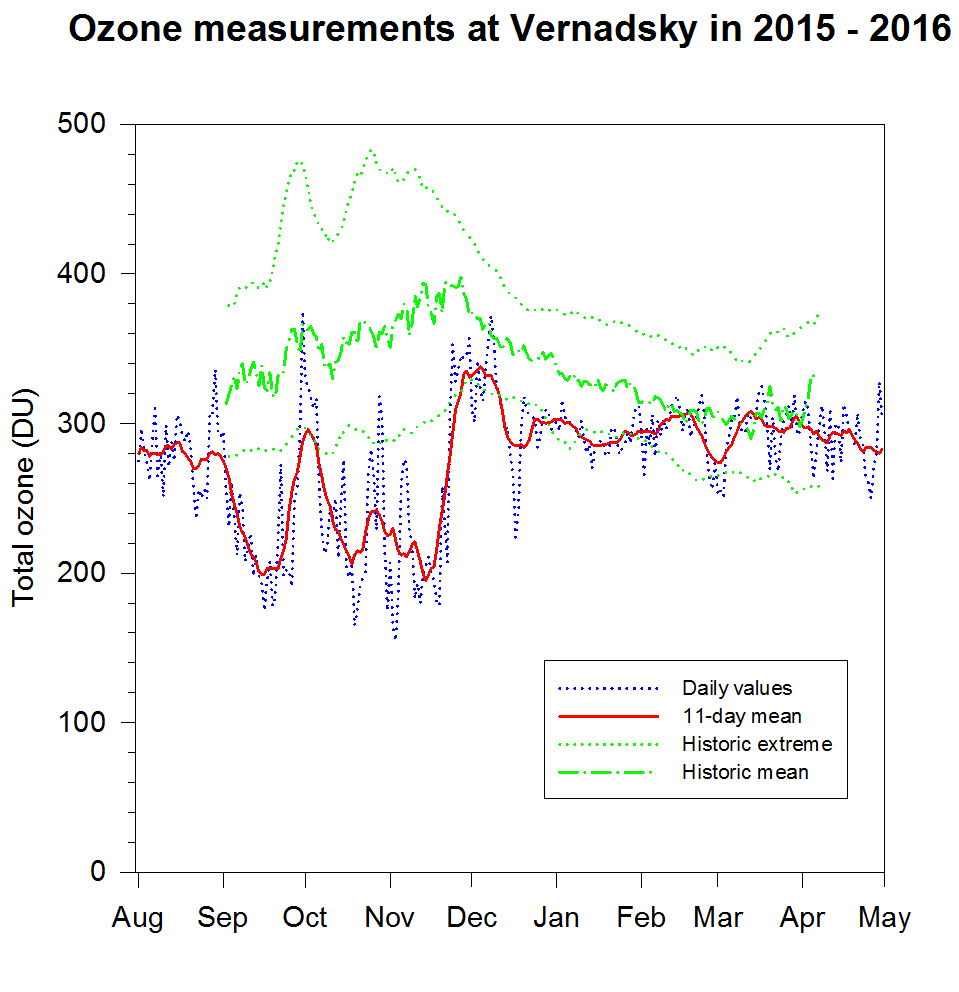
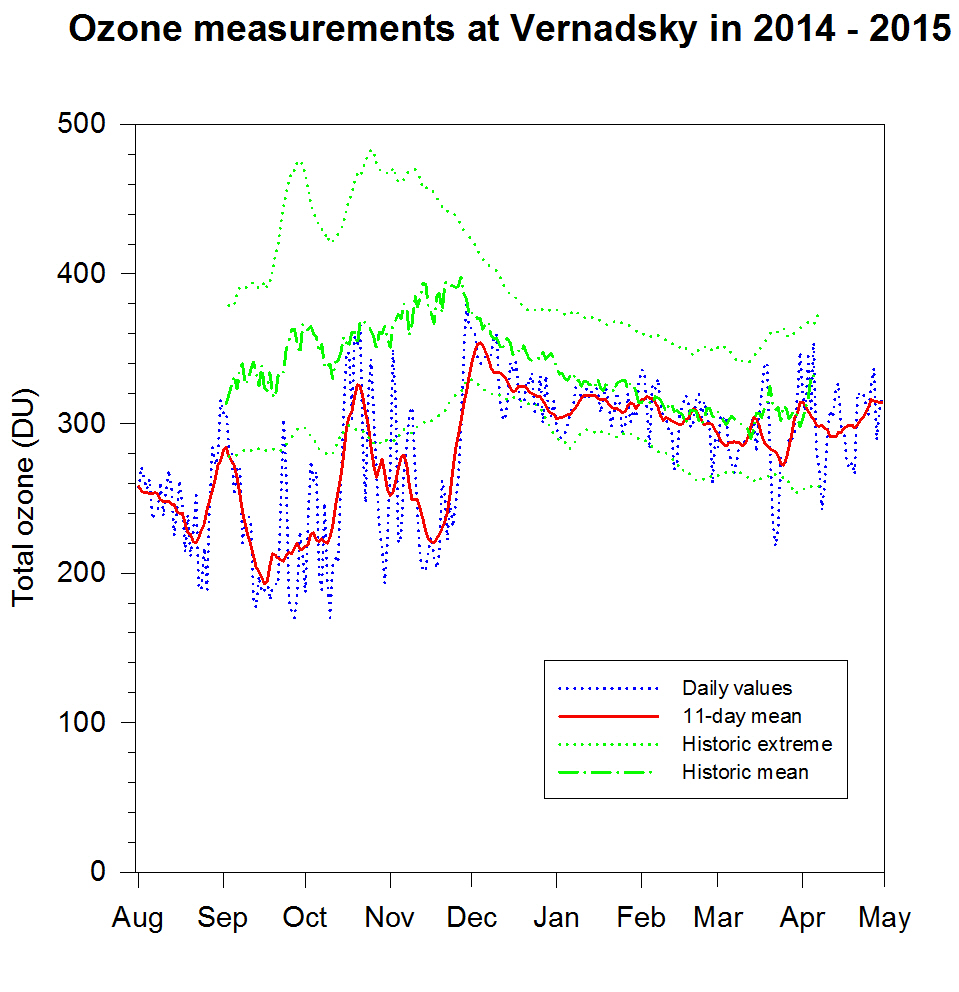
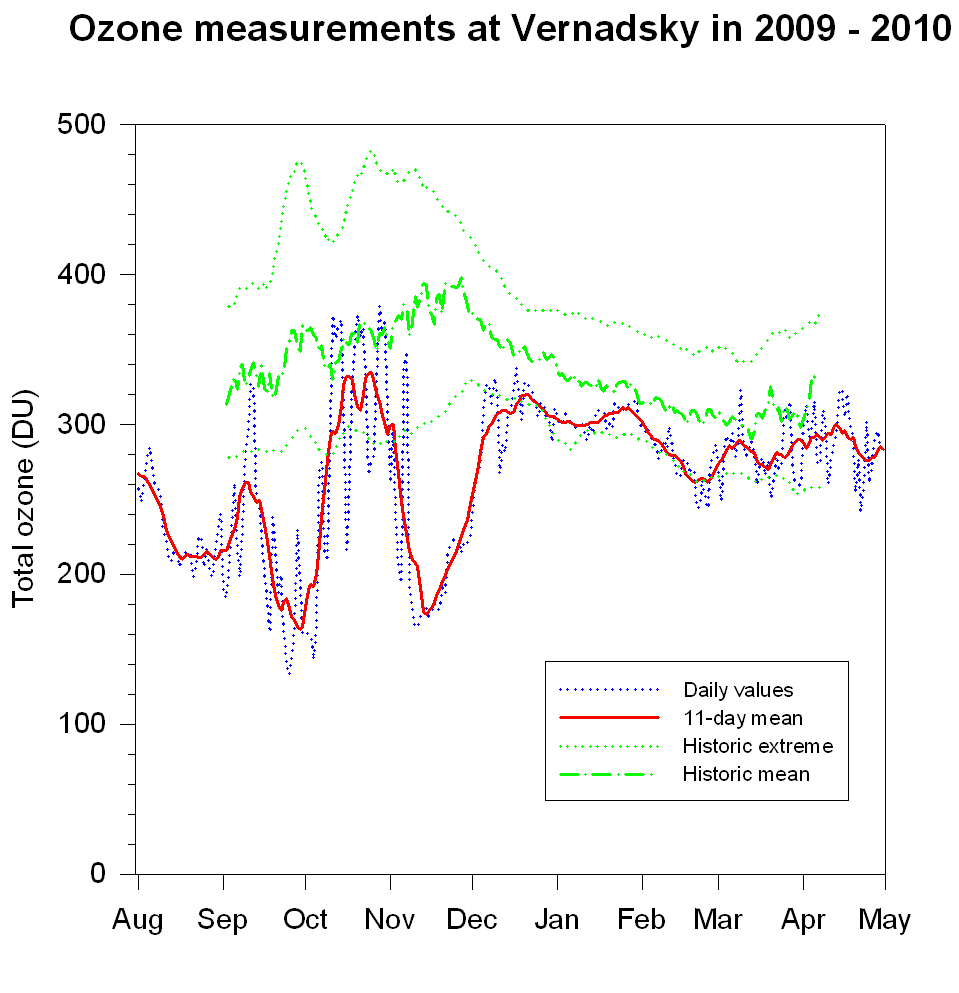
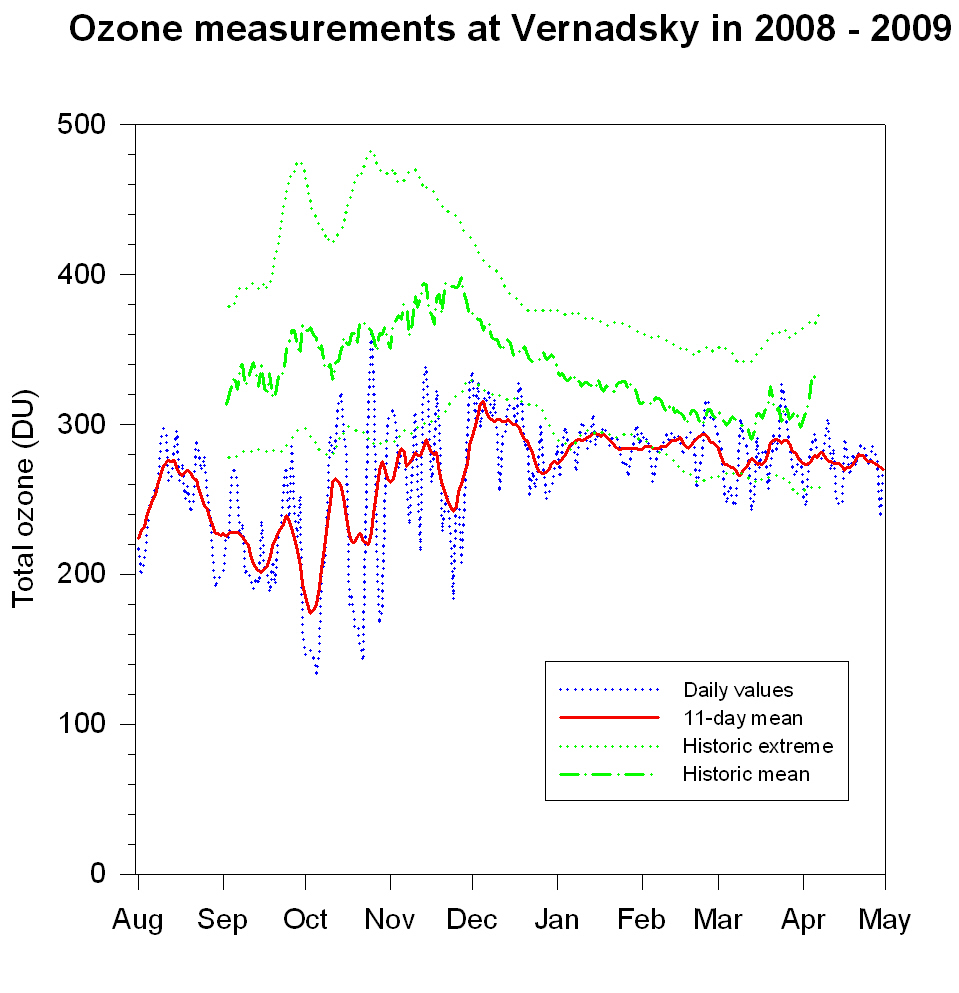
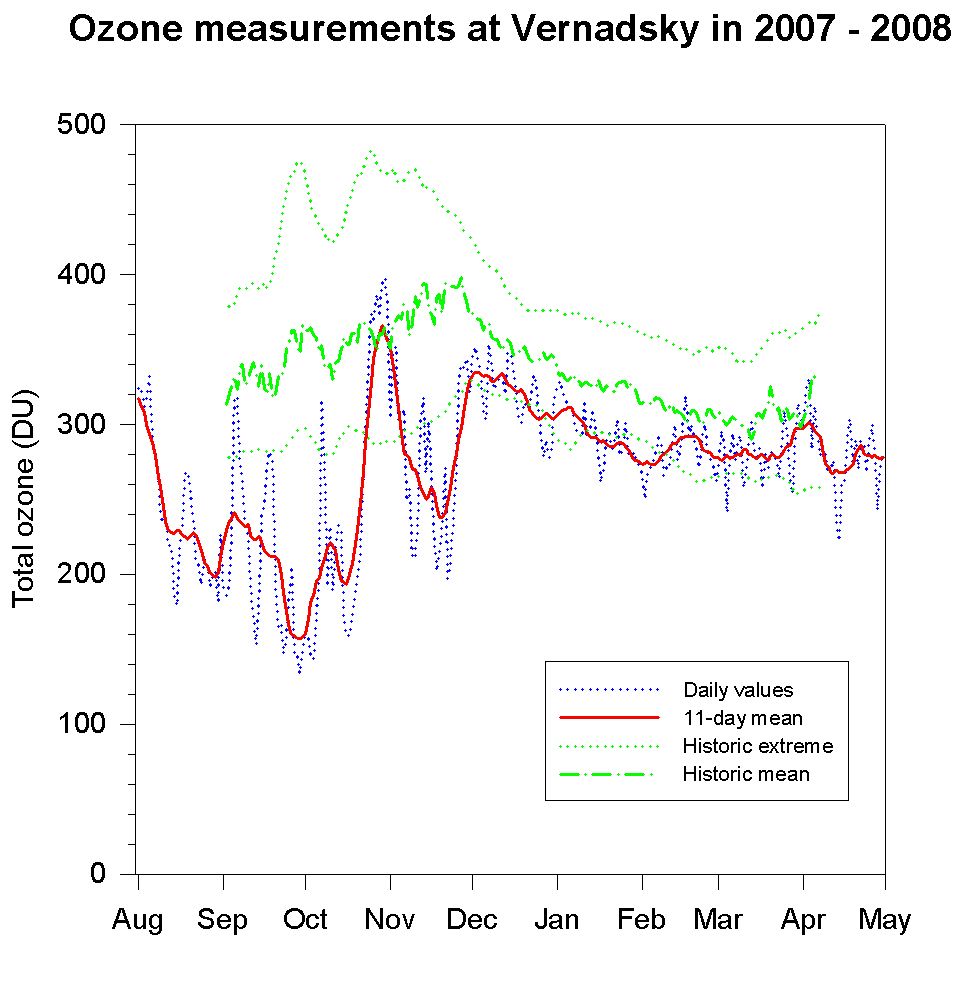
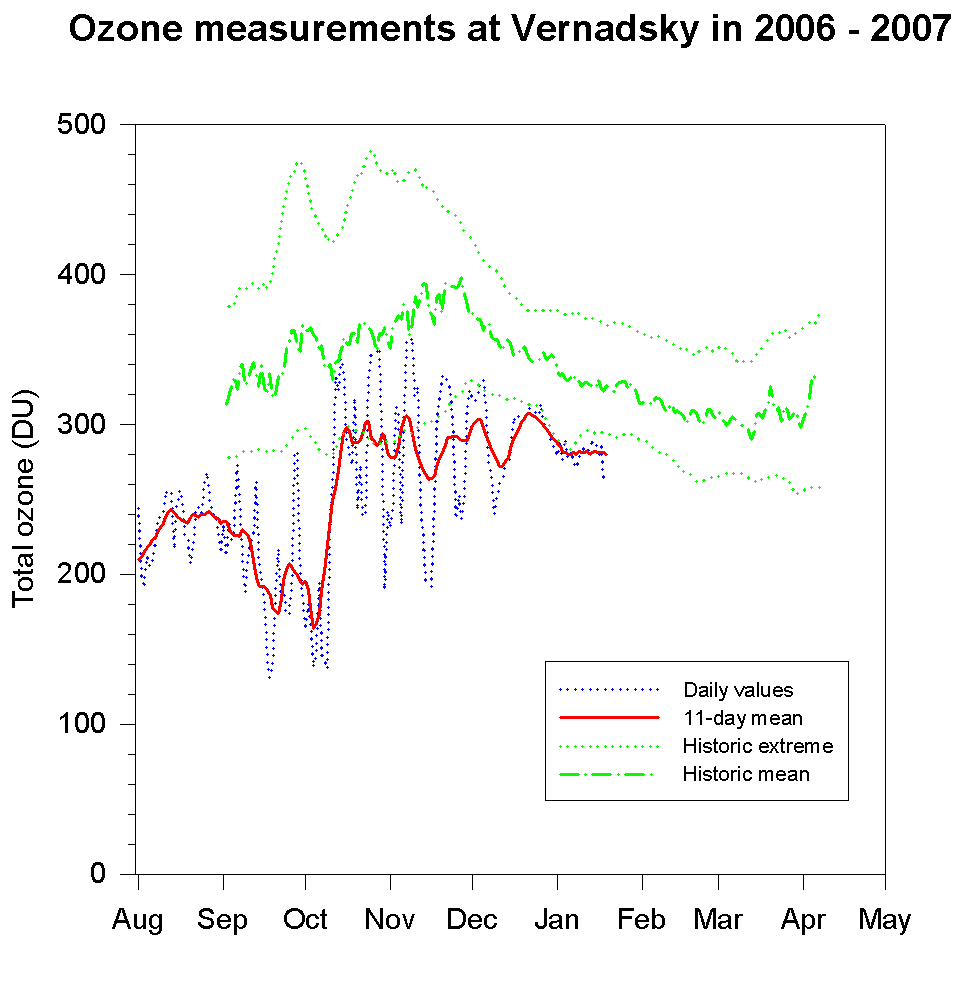
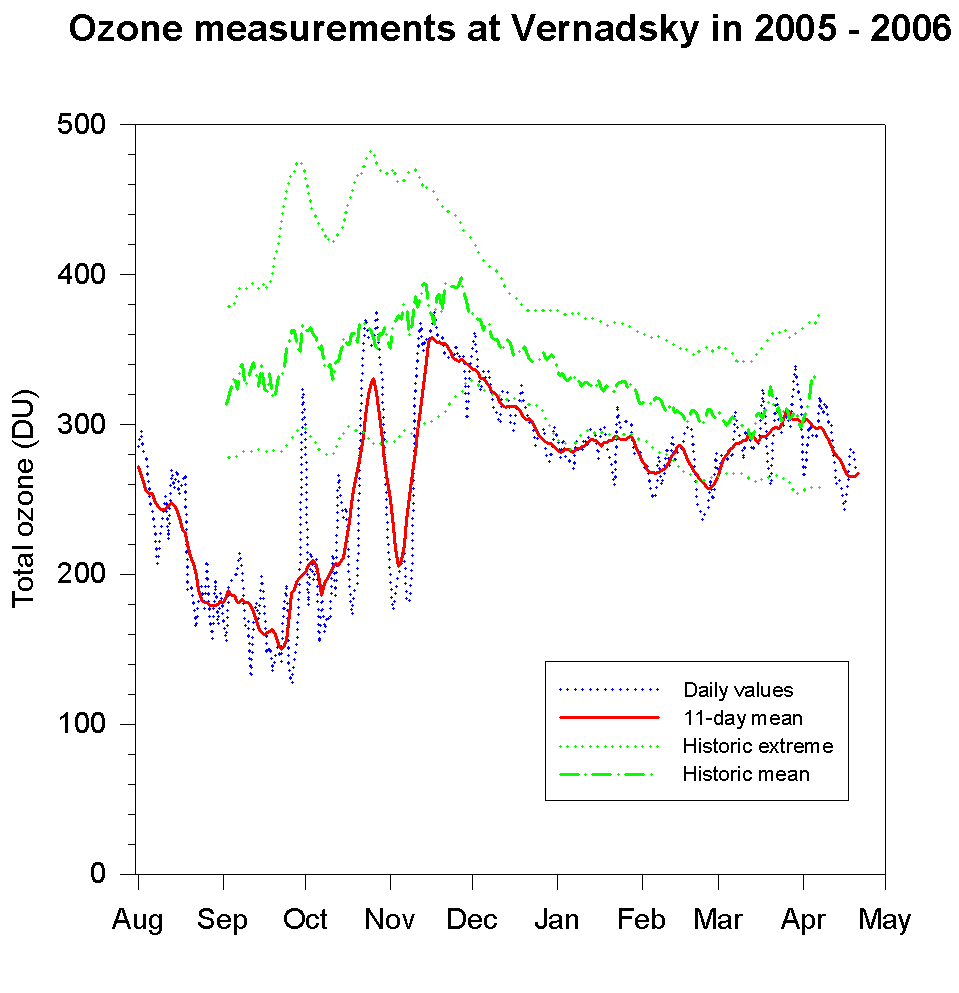
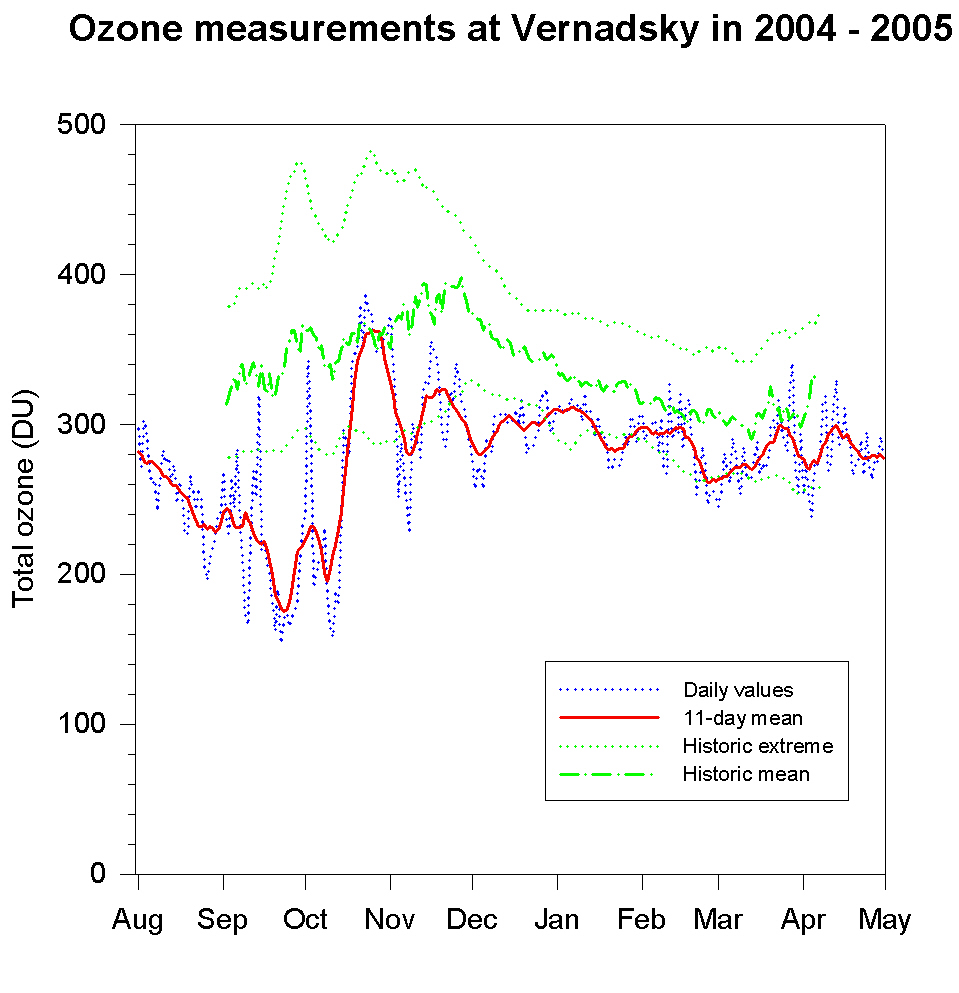
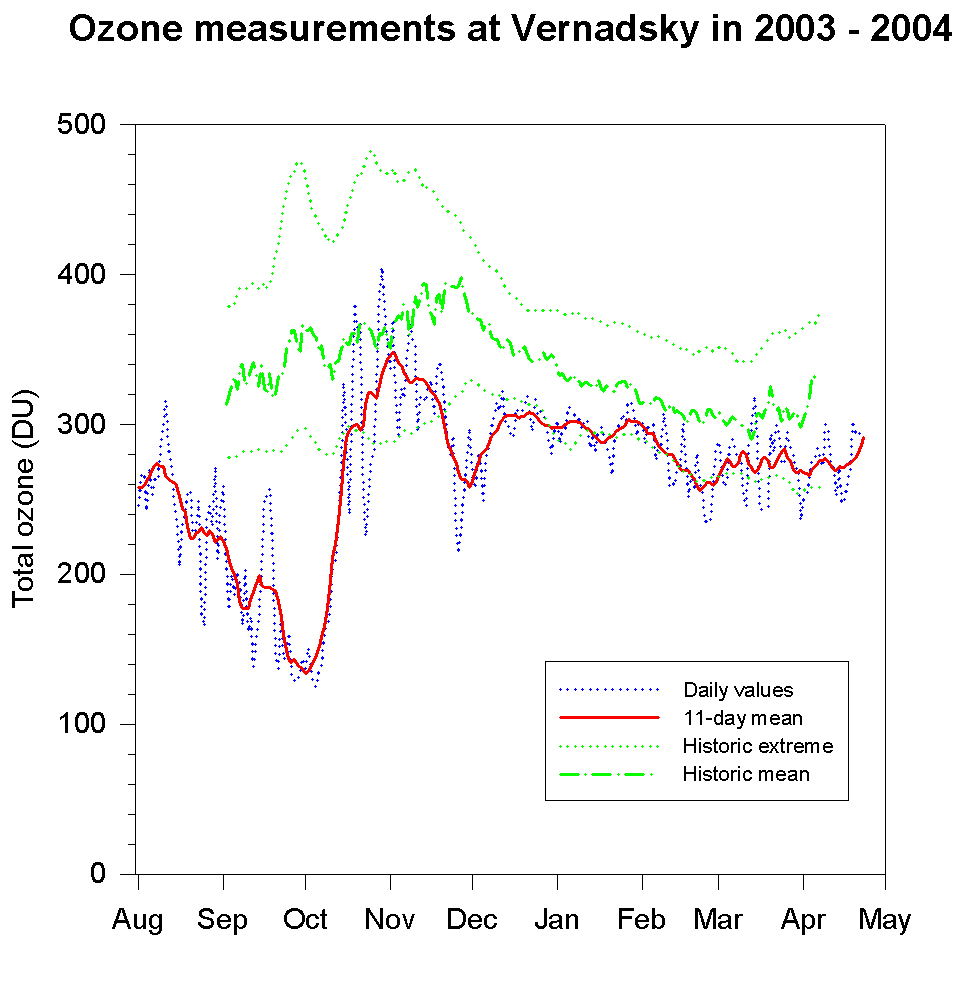
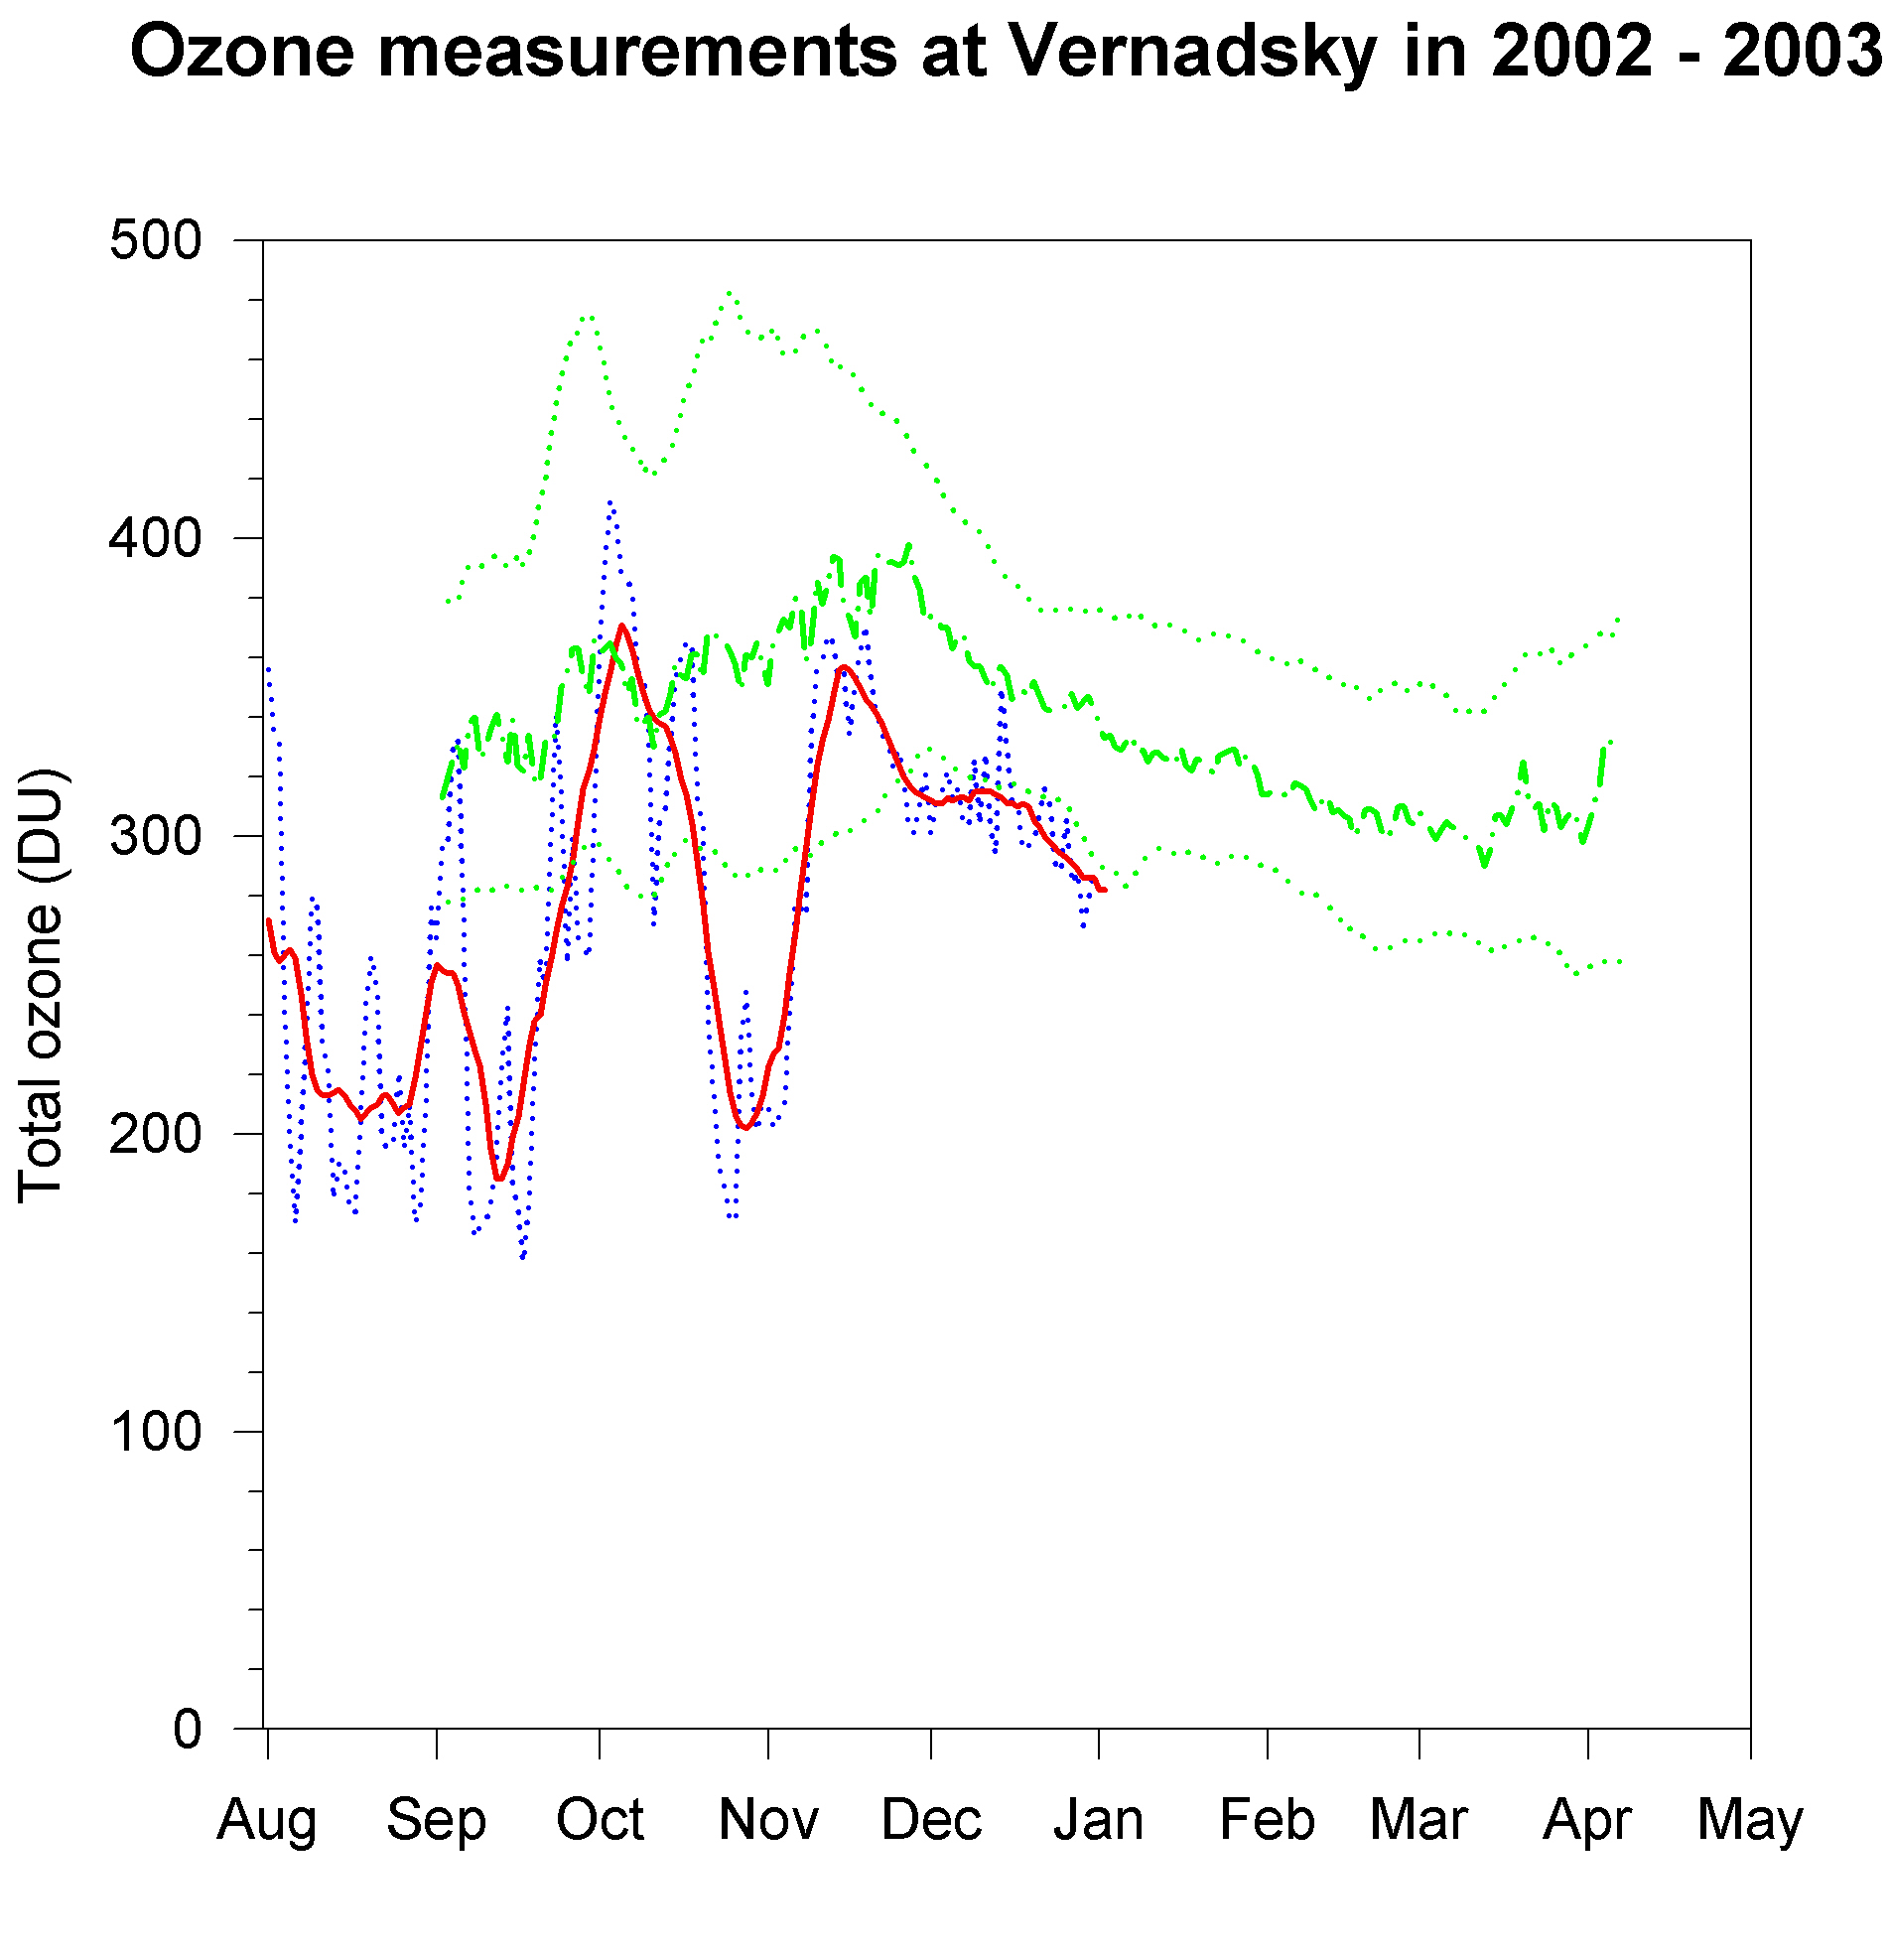
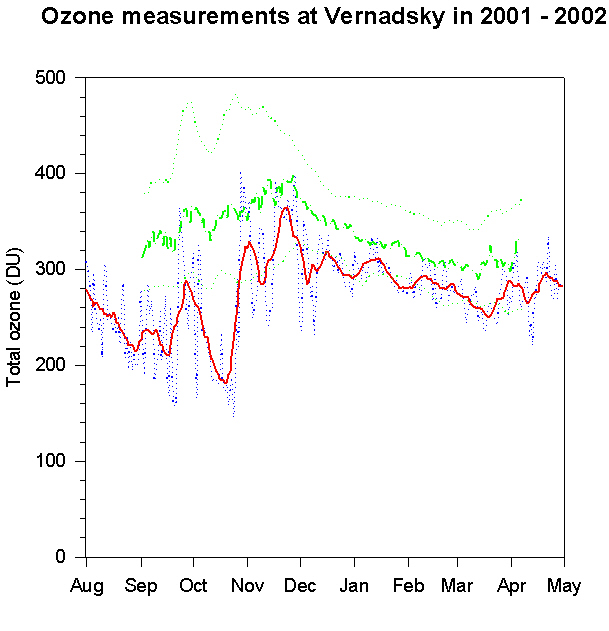
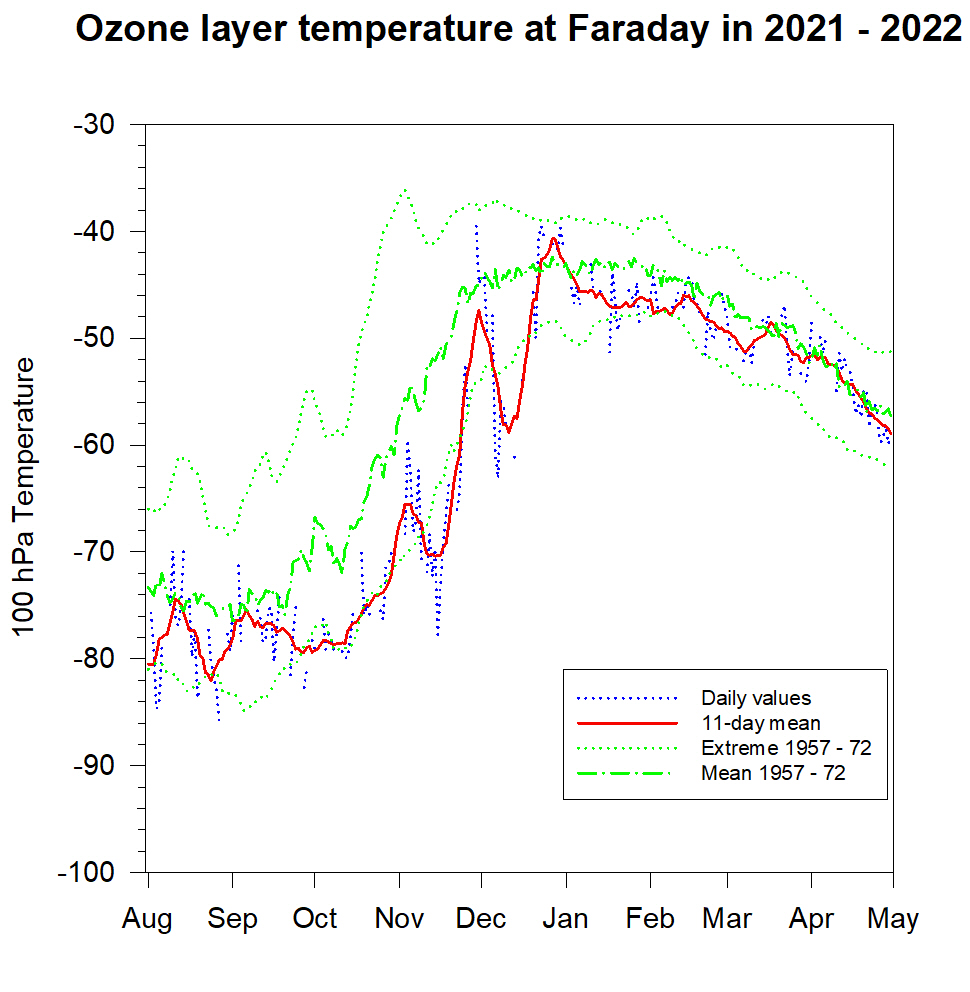
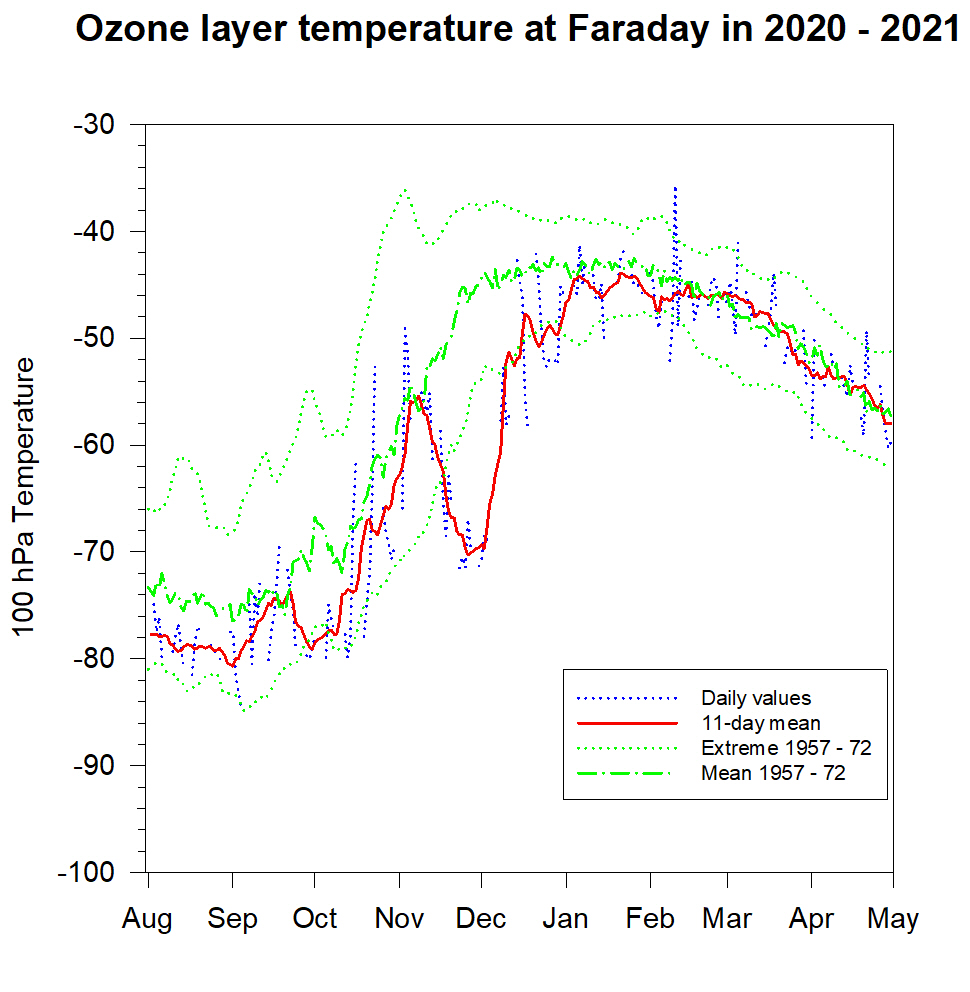
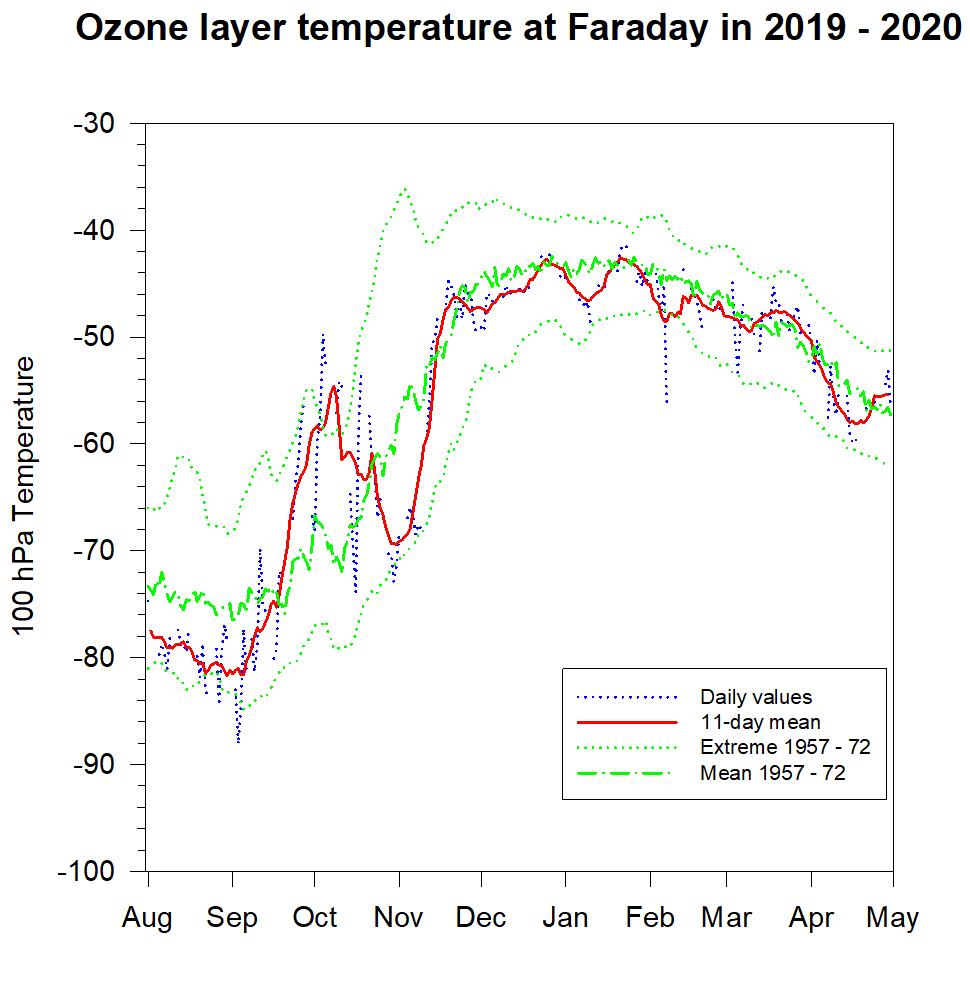
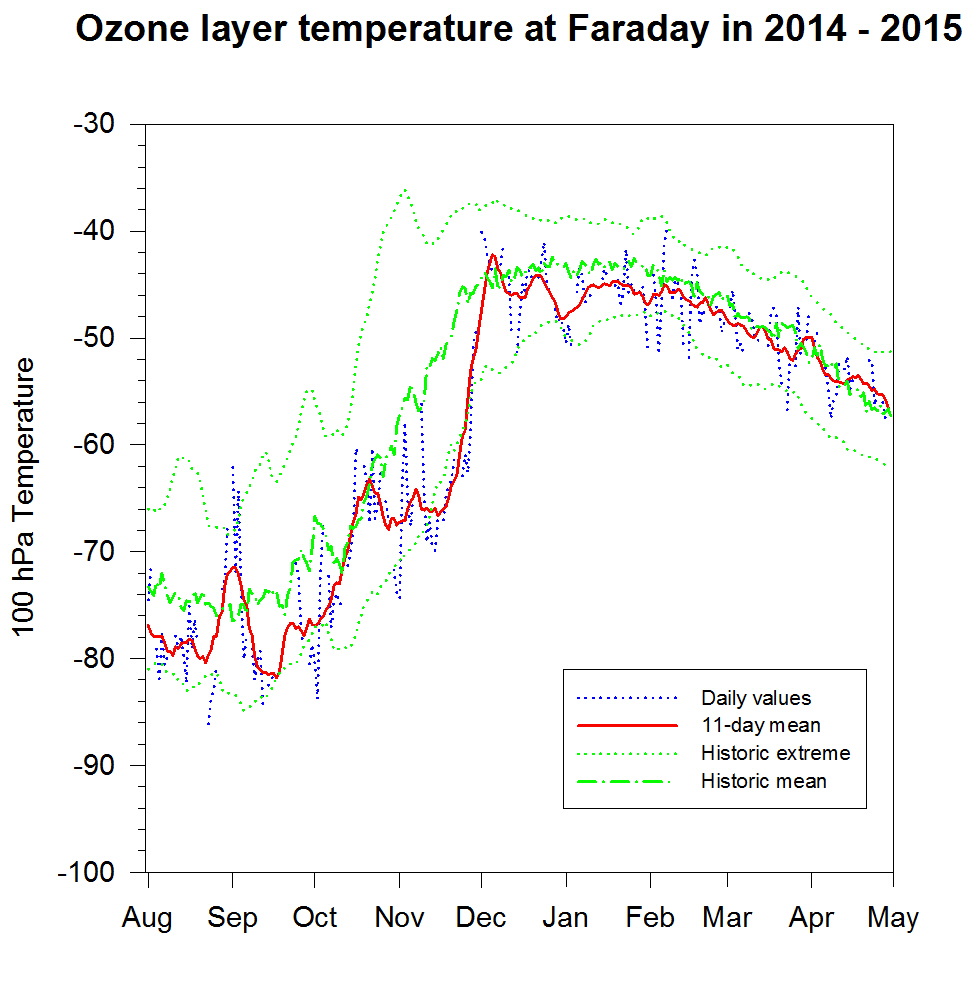
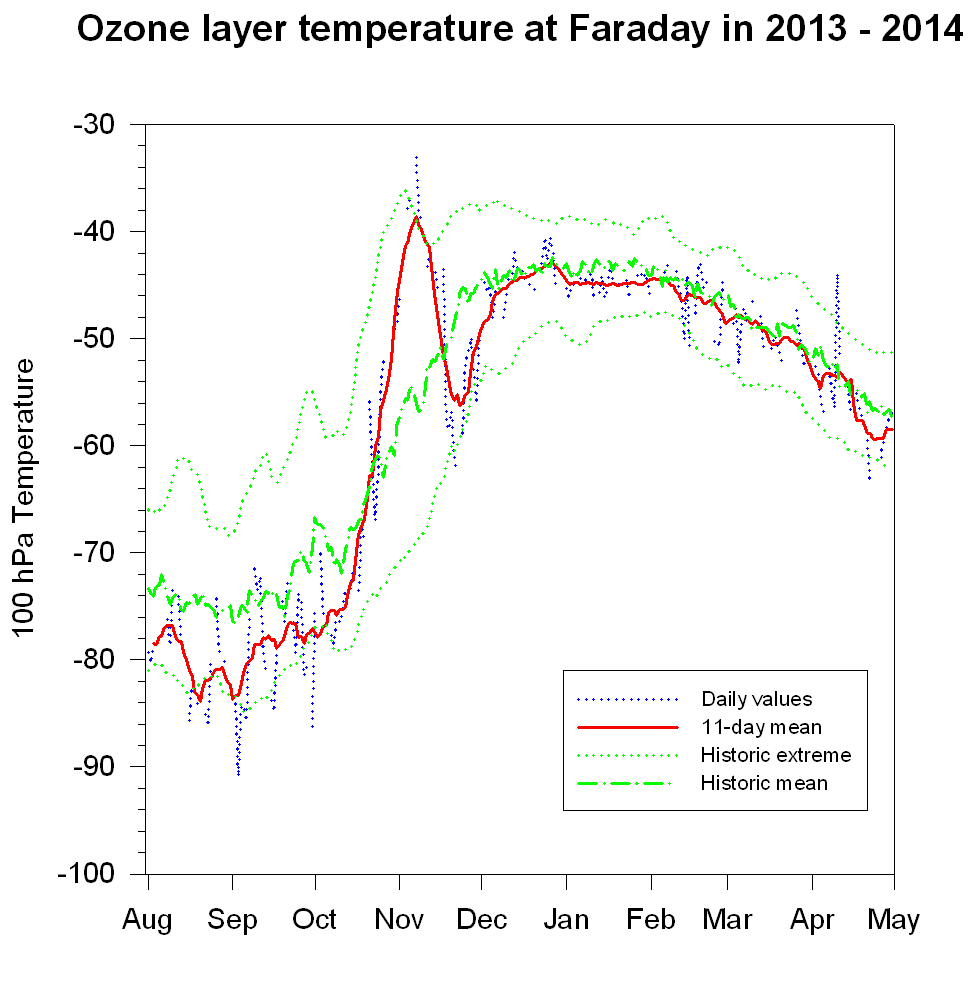
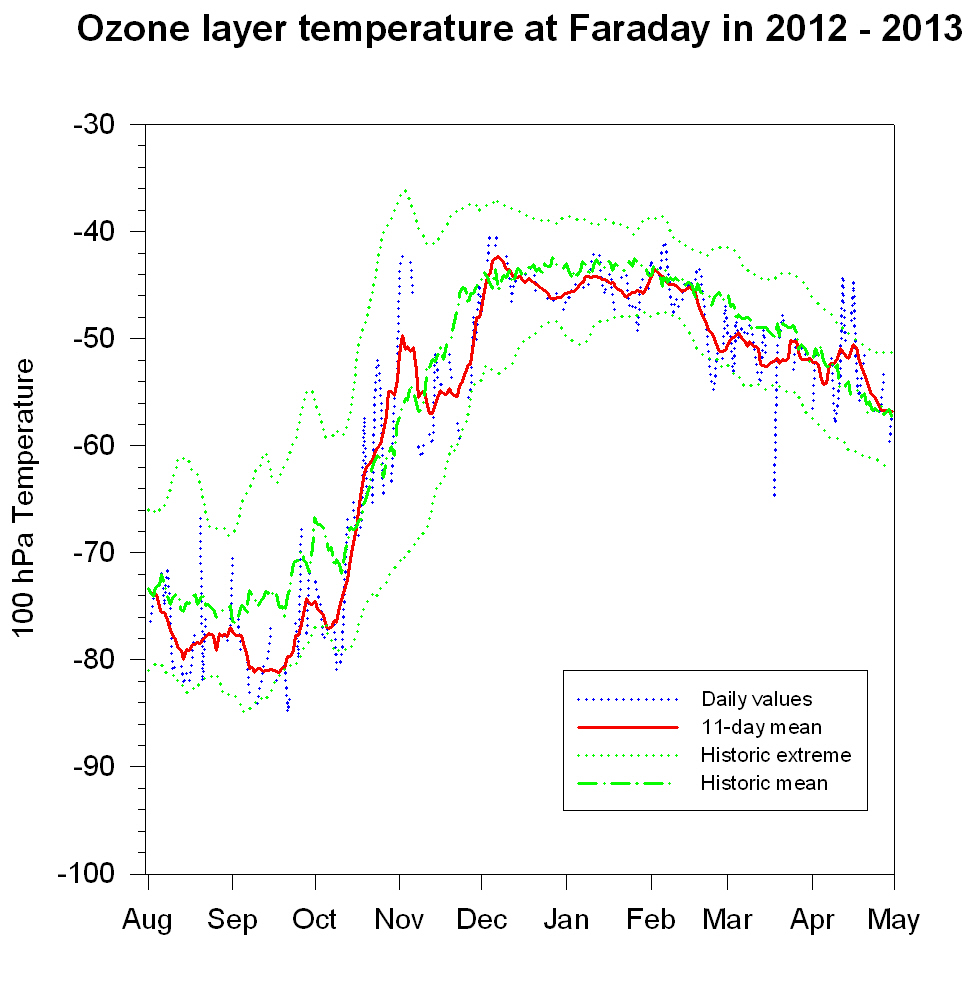
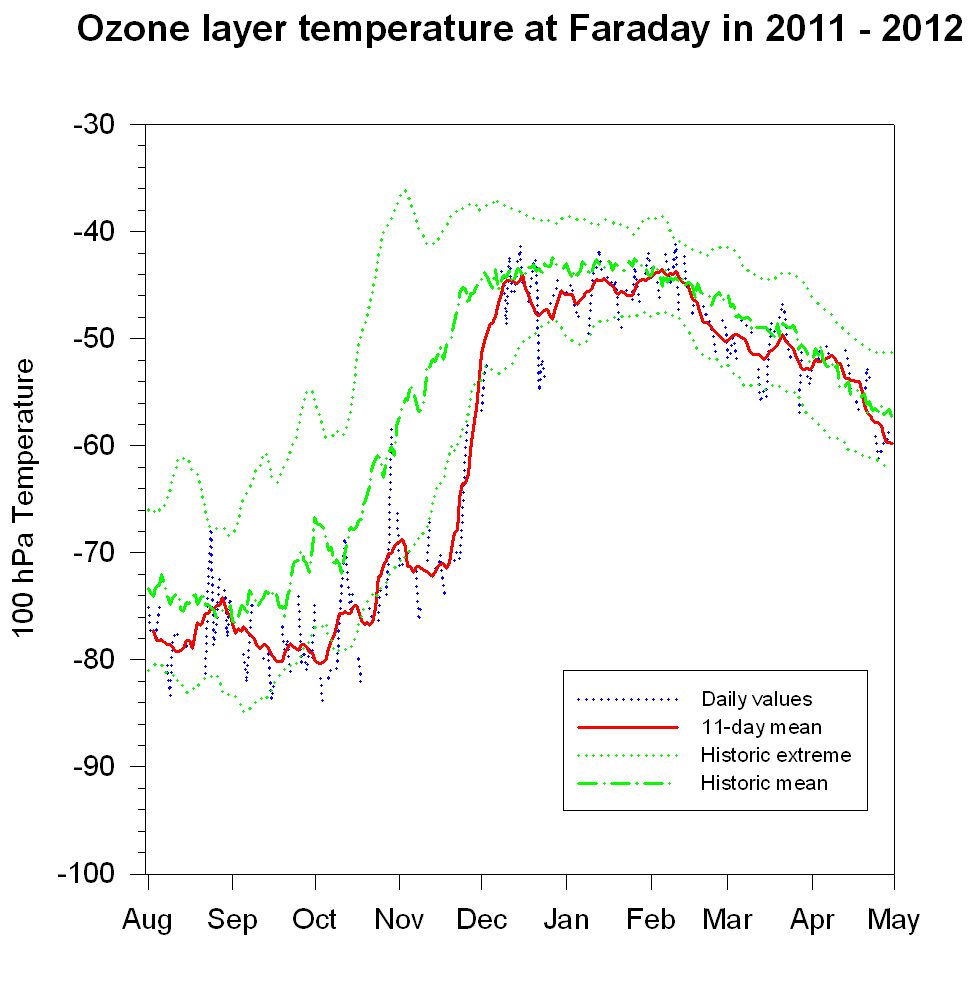
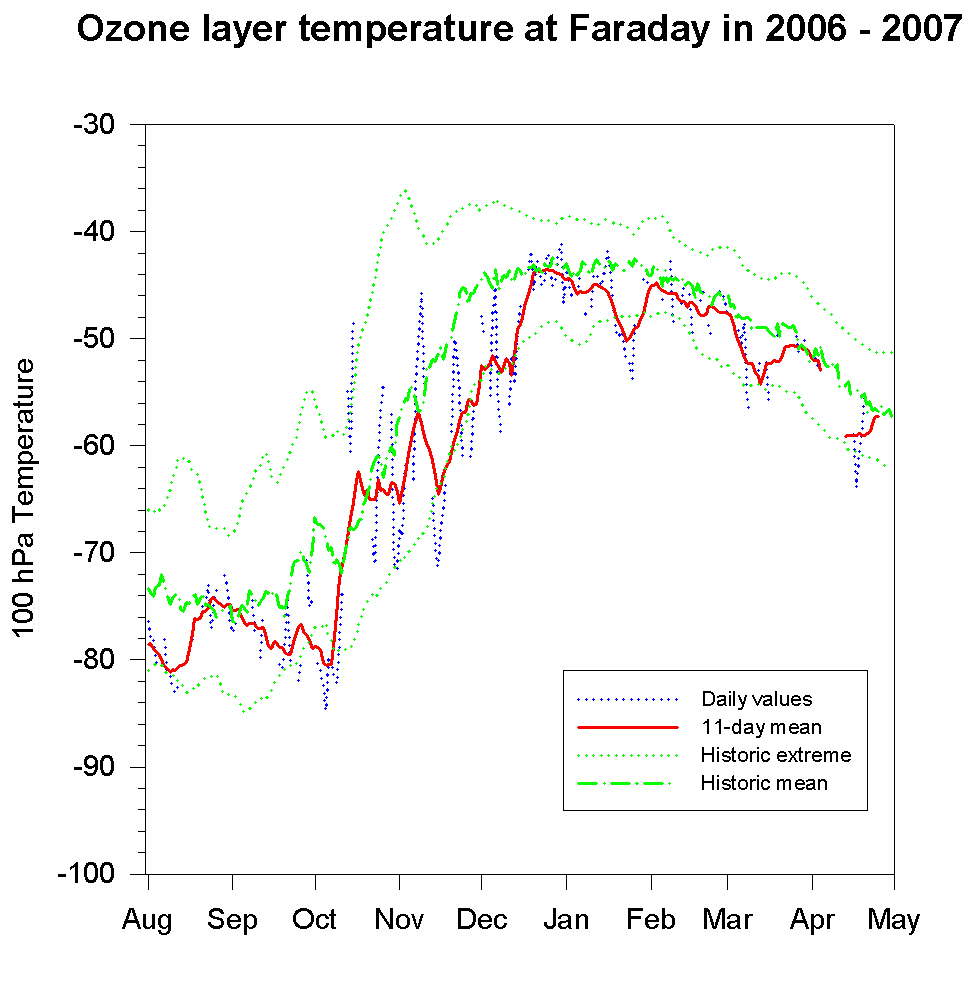
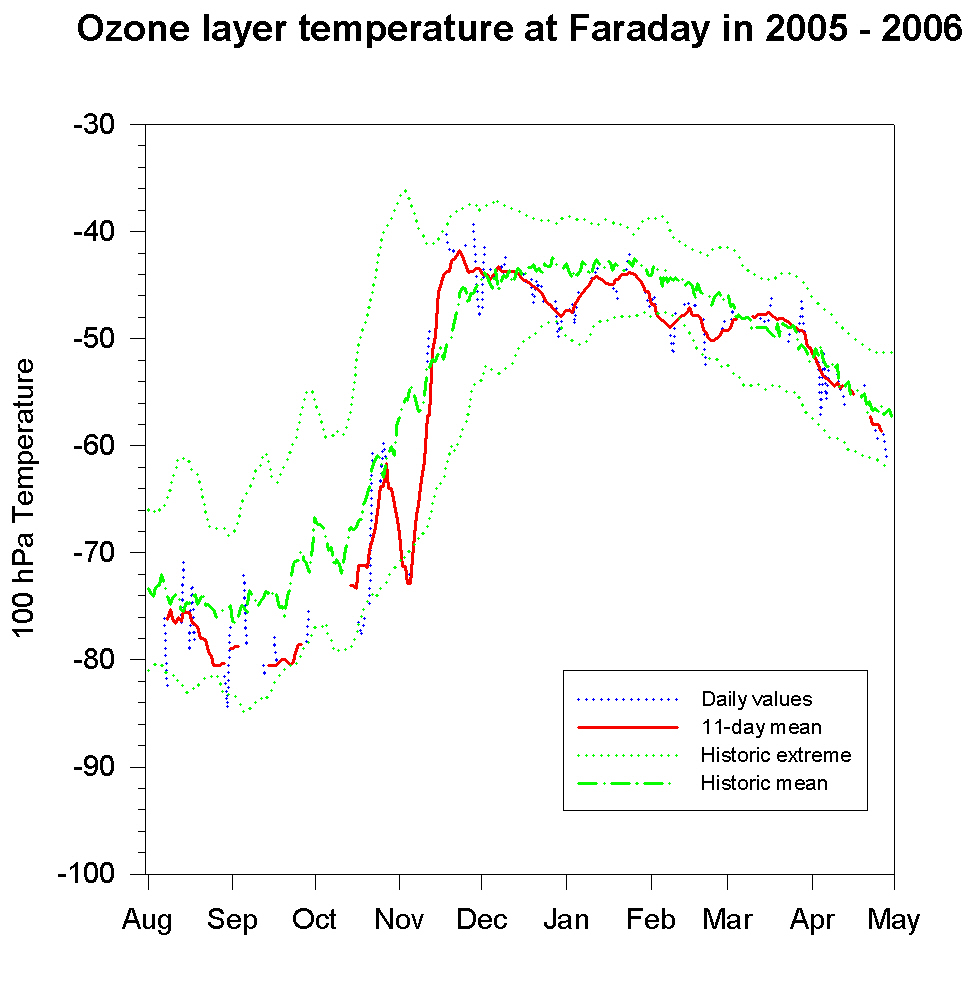
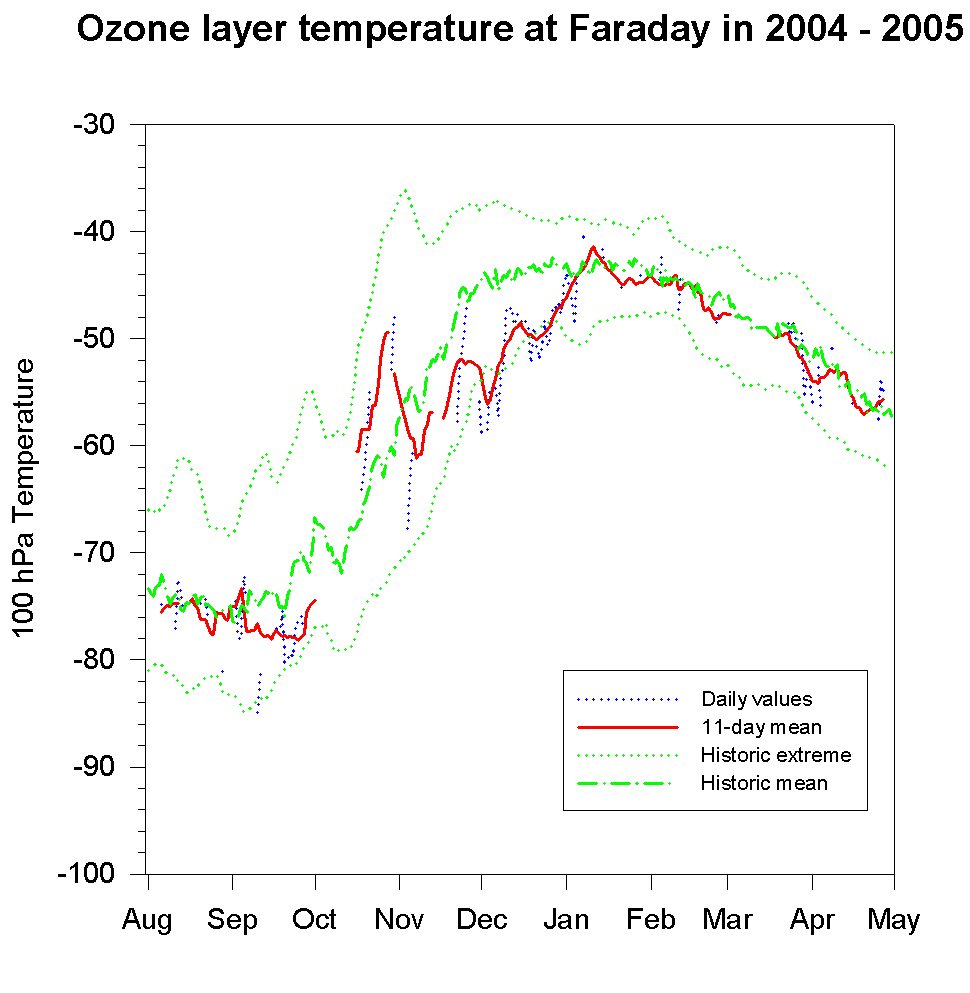
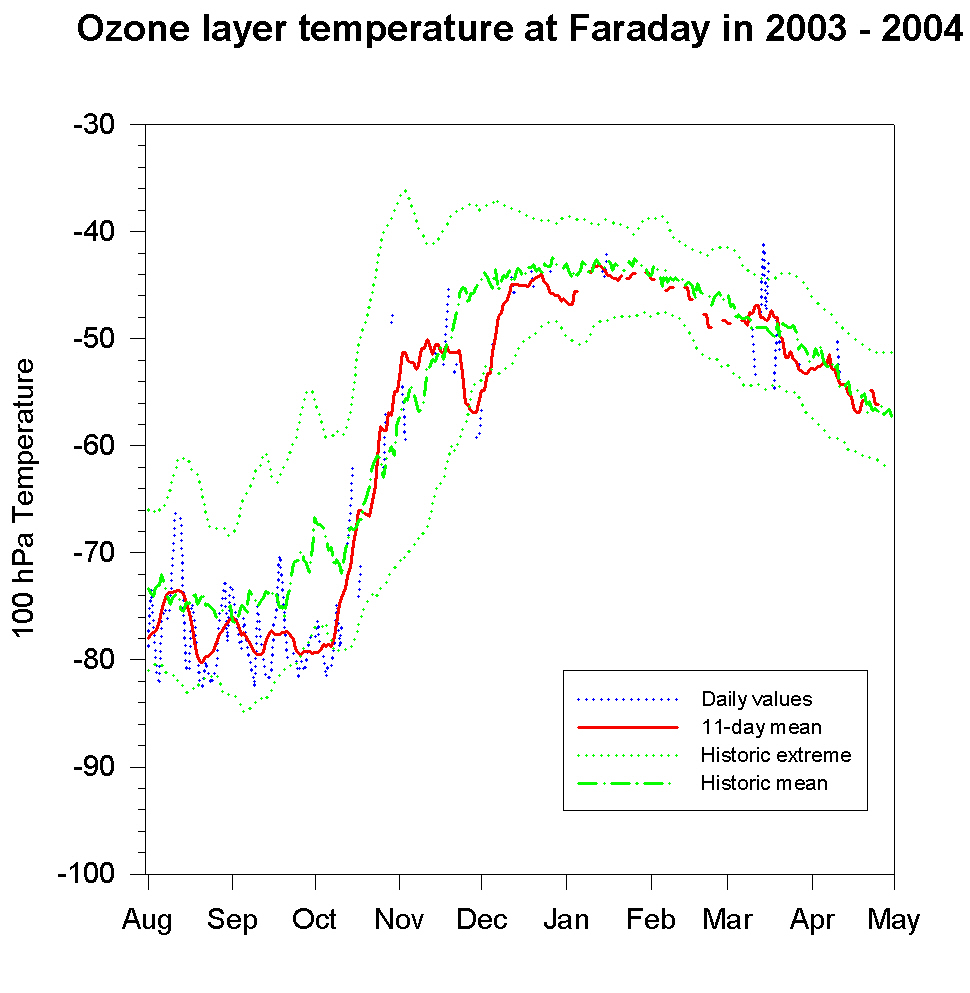
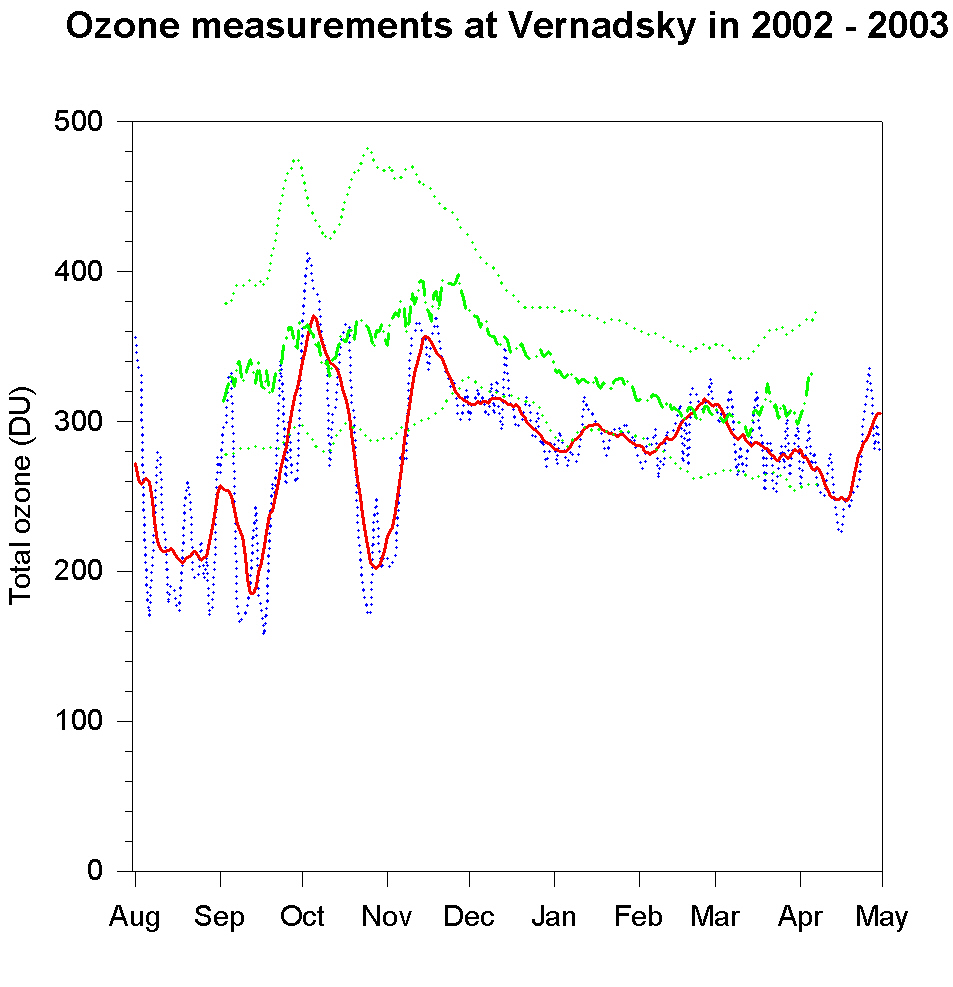
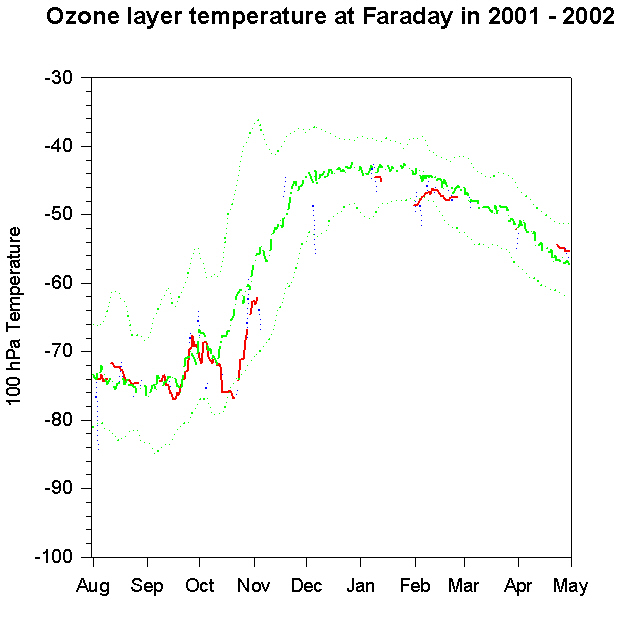
Vernadsky/Faraday
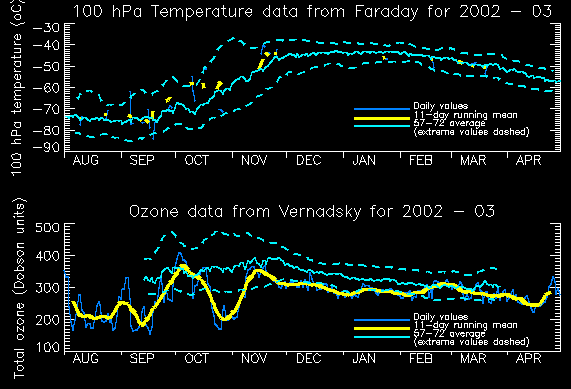
Combined ozone and 100 hPa temperature 05-06, 04-05, 03-04, 02-03, 01-02, 00-01, 99-00, 98-99, 97-98, 96-97, 95-96, 94-95, 93-94, 92-93, 91-92, 90-91, 89-90, 88-89, 87-88
Ozone only
21-22,
20-21,
19-20,
18-19,
17-18,
16-17,
15-16,
14-15,
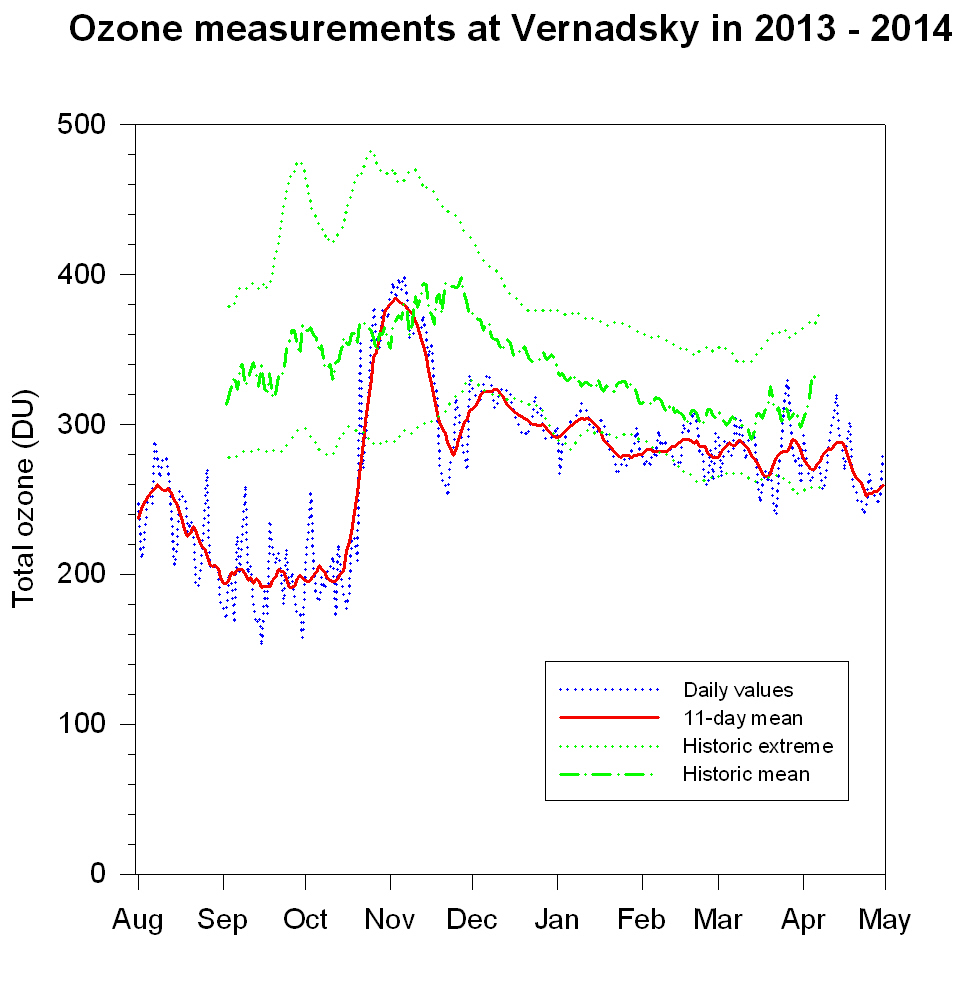
13-14,
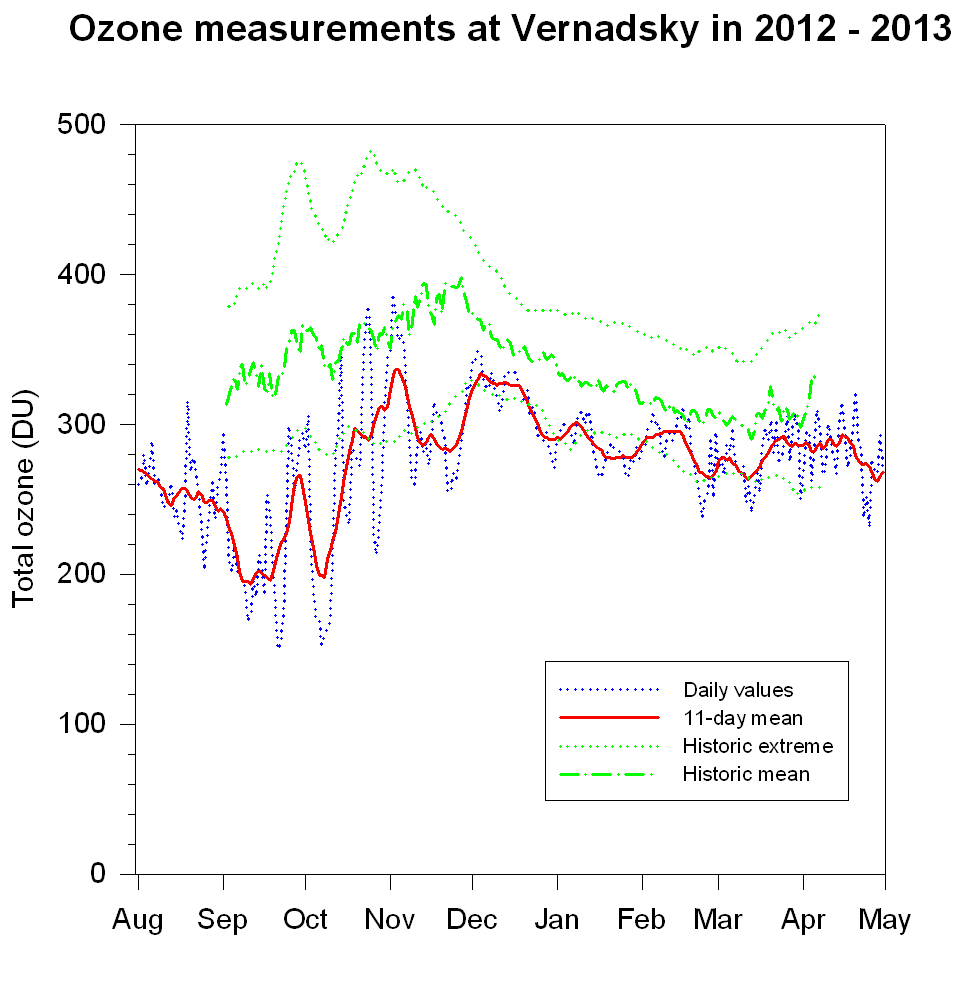
12-13,
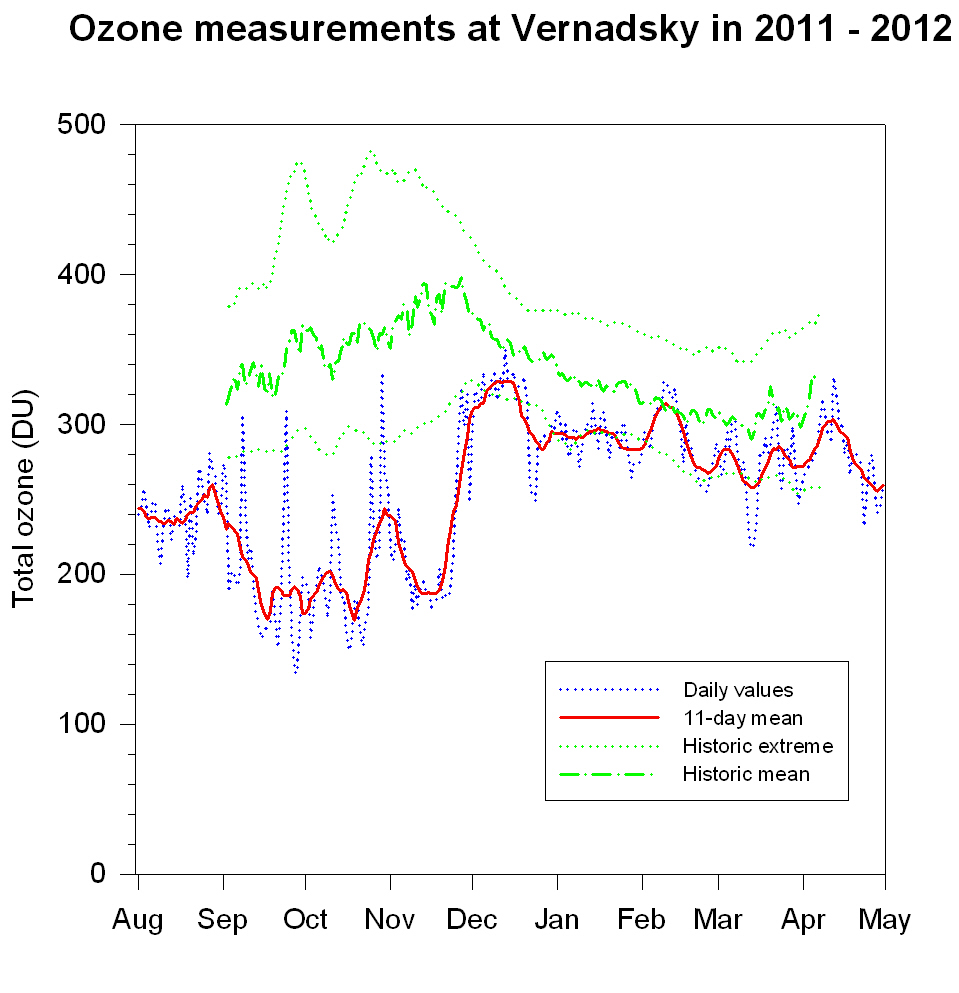
11-12,
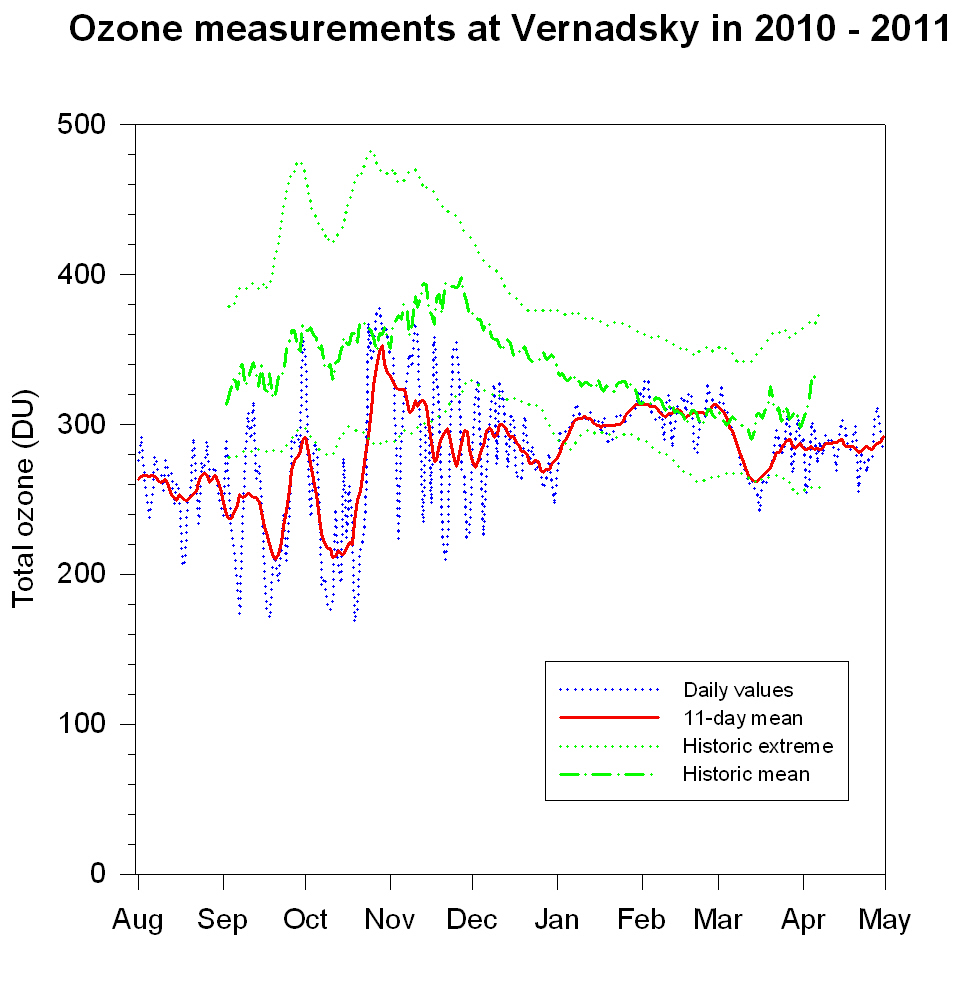
10-11,
09-10,
08-09,
07-08,
06-07,
05-06,
04-05,
03-04,
02-03,
01-02.
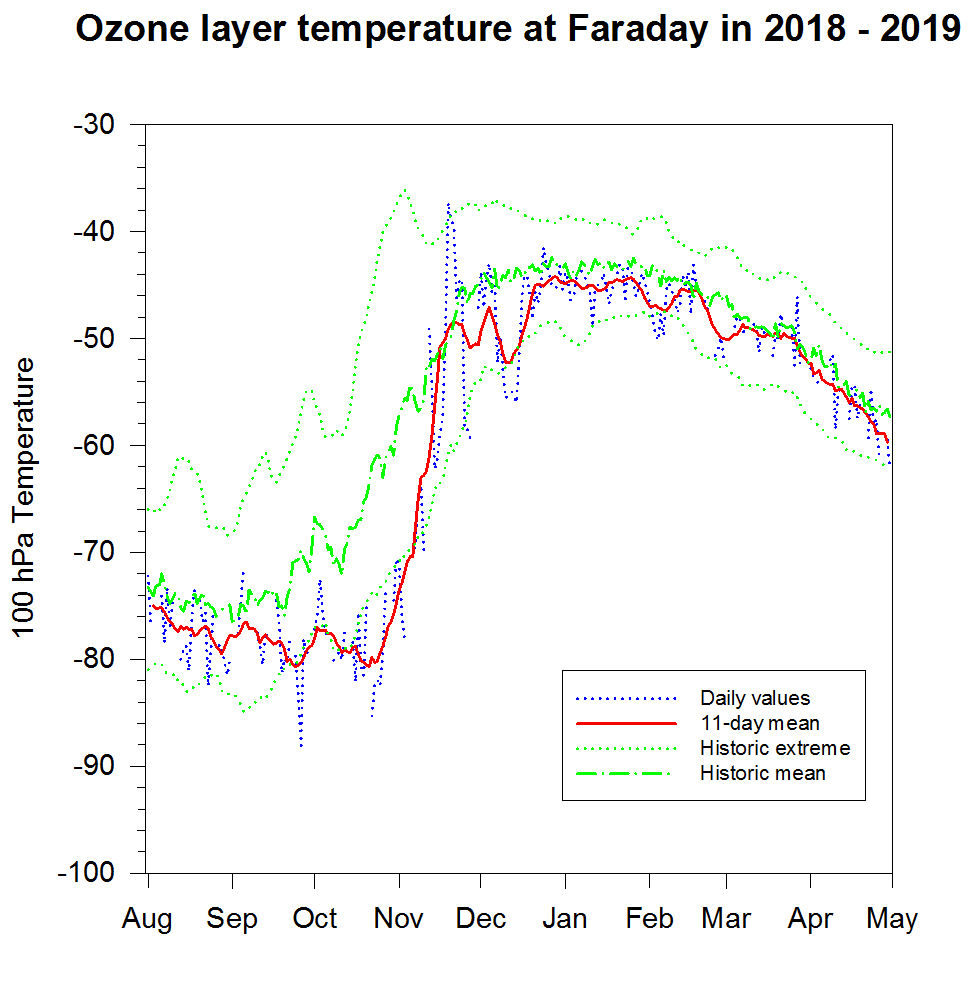
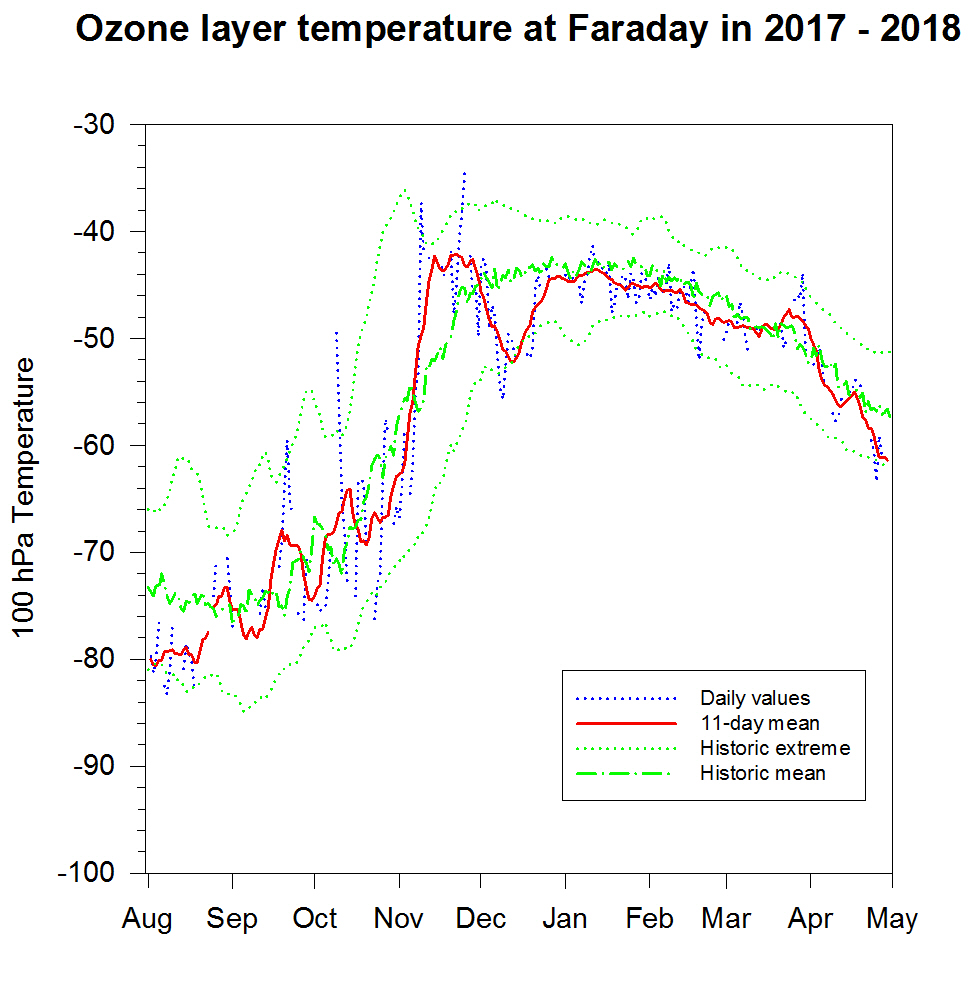
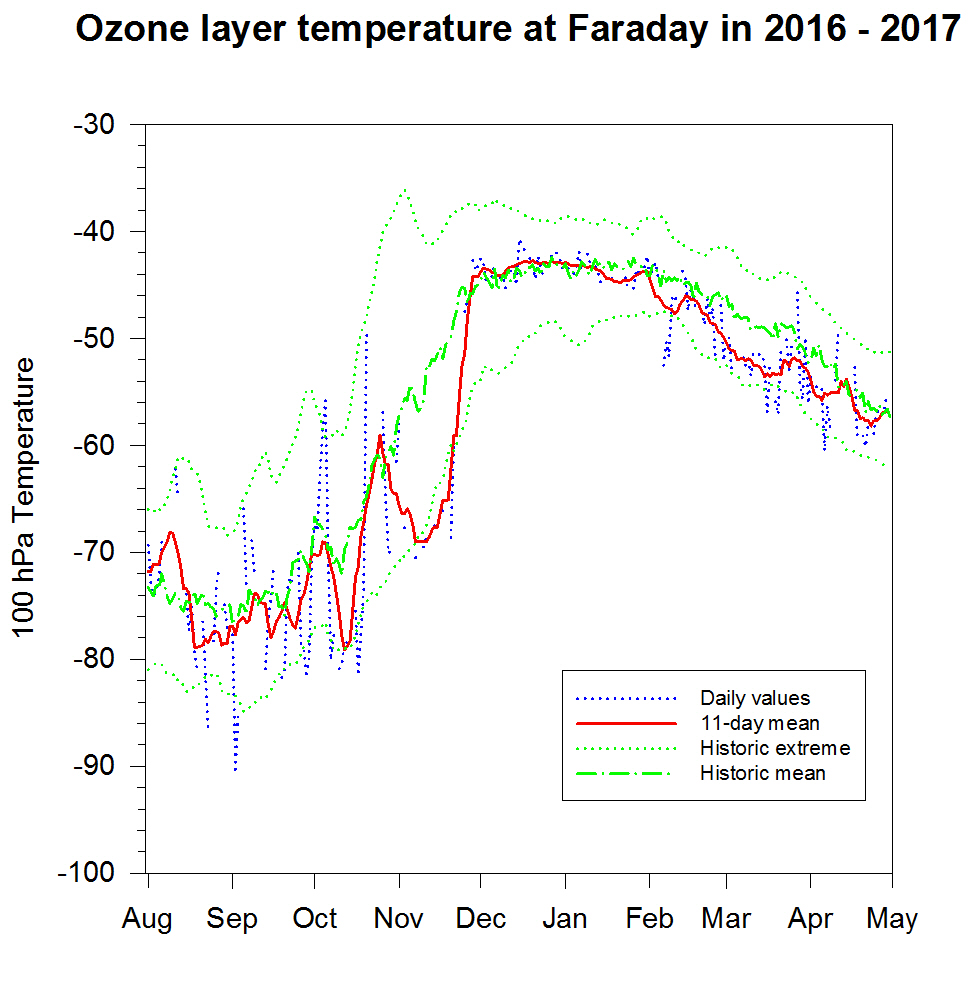
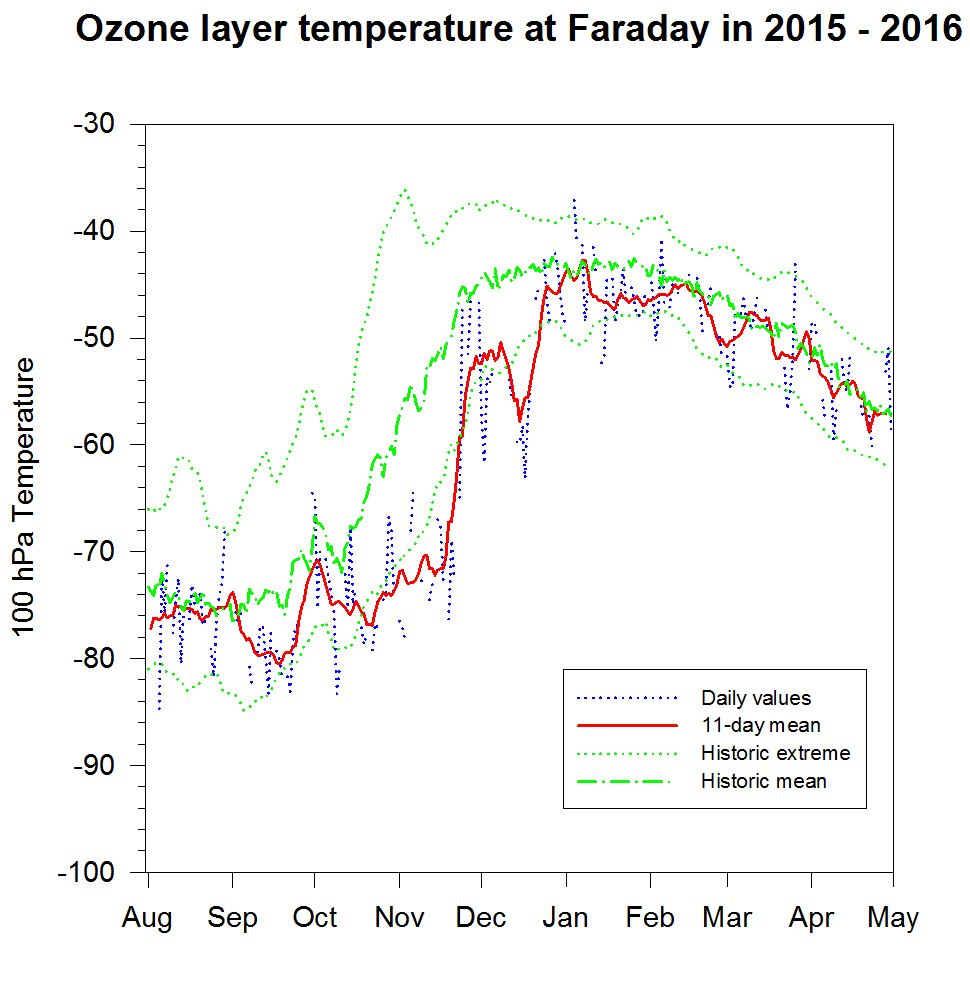
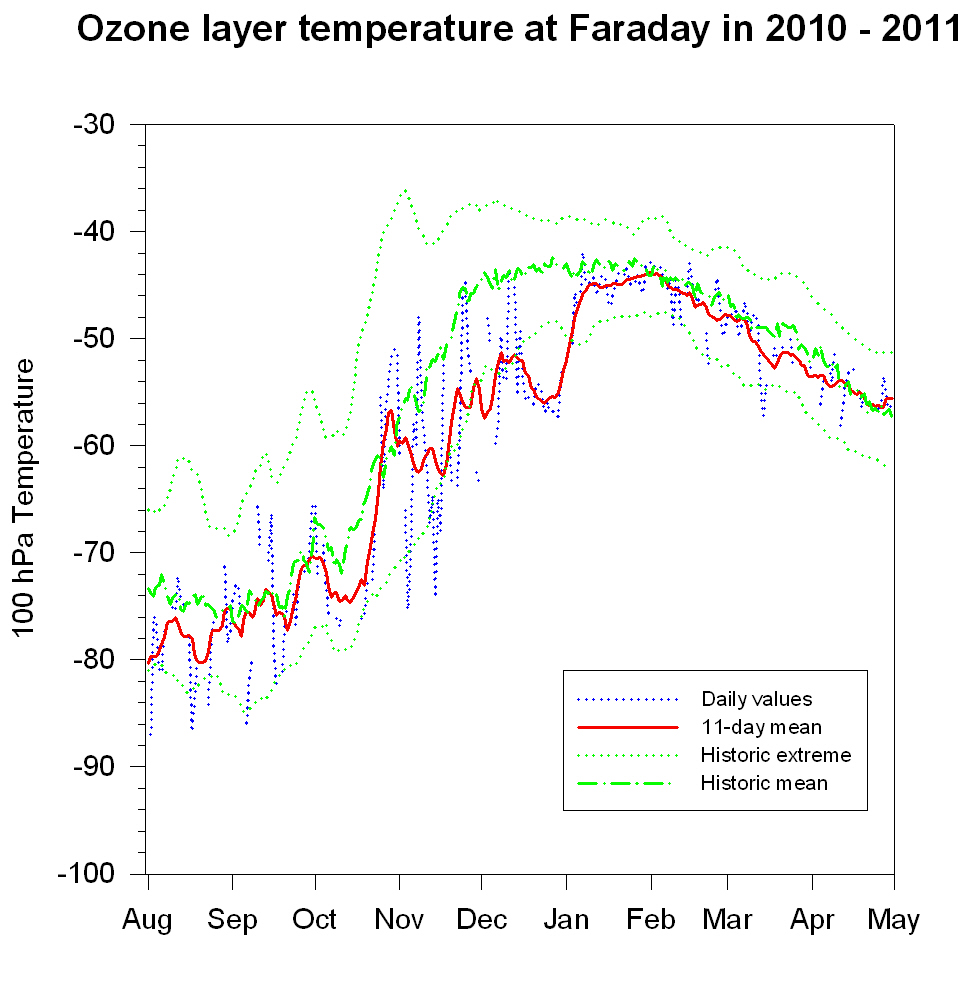
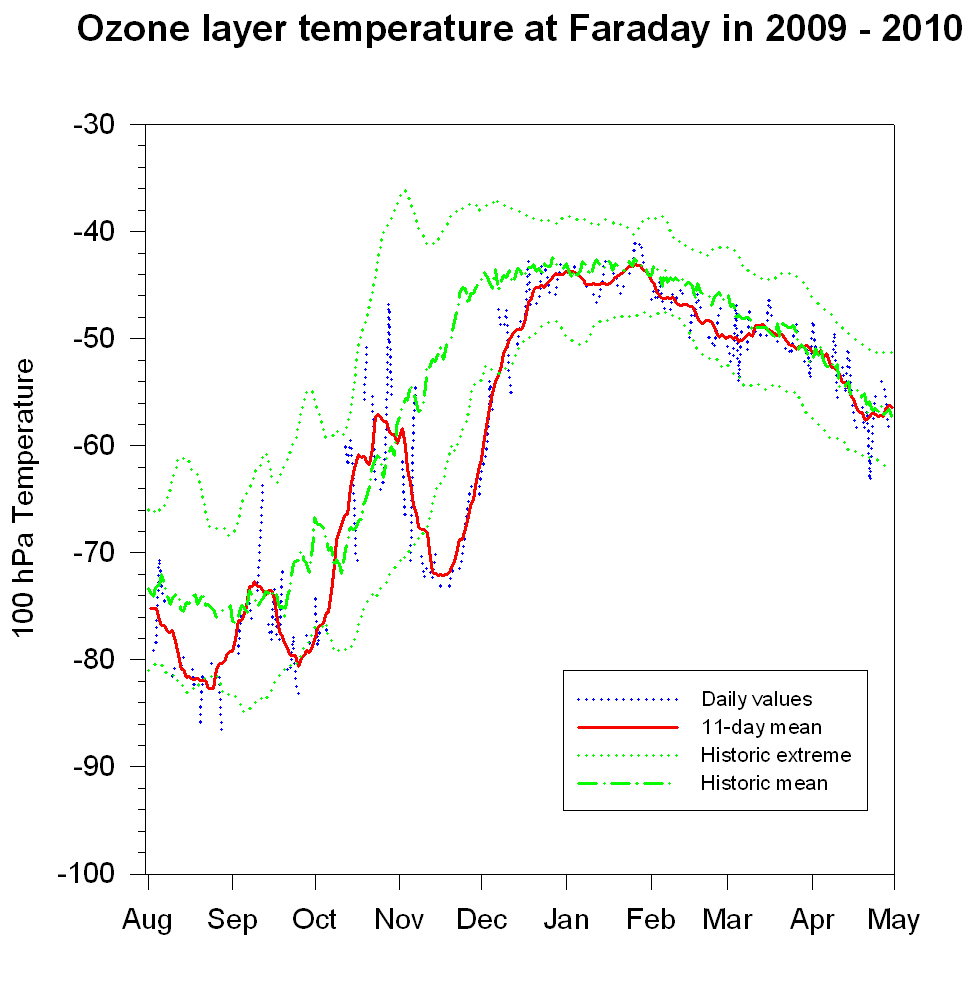
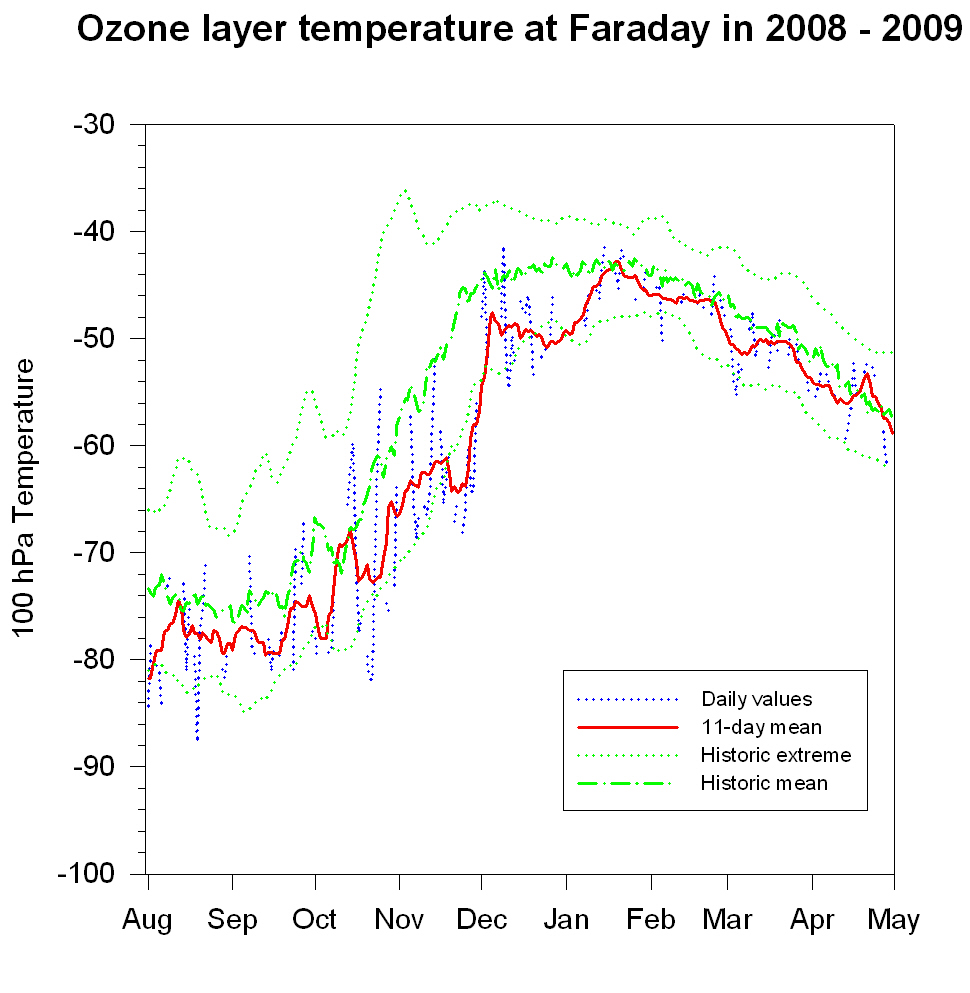
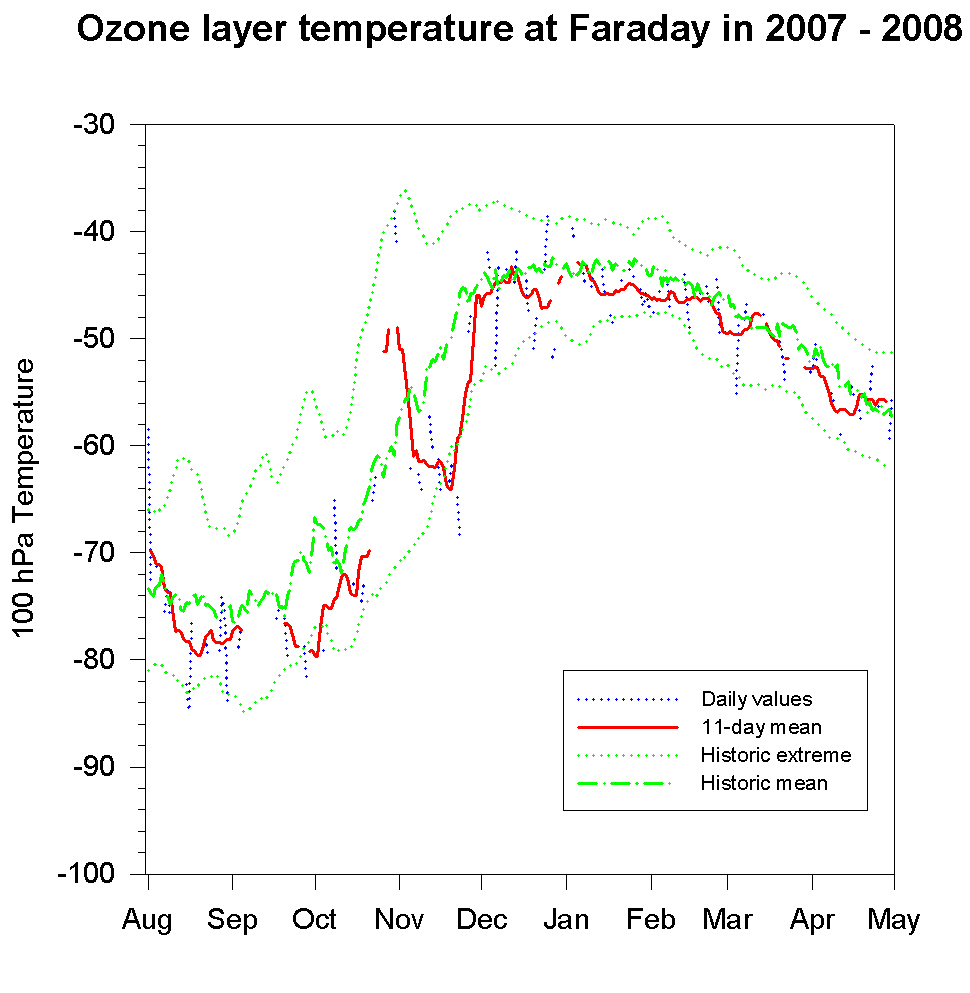
100 hPa temperature only
21-22,
20-21,
19-20,
18-19,
17-18,
16-17,
15-16,
14-15,
13-14,
12-13,
11-12,
10-11,
09-10,
08-09,
07-08,
06-07,
05-06,
04-05,
03-04,
02-03,
01-02.
Note: Vernadsky/Faraday has not carried out radiosonde ascents since 1986. Hence the 100 hPa temperatures for Vernadsky/Faraday are taken from nearby stations, including Bellingshausen (which suspended flights between November 1996 and November 1997 and since February 1999), Marambio (which suspended flights between 2001 December and 2002 February due to a fire in the hydrogen generator) and Rothera (which since March 2003 carries out at least three flights per week) or BAS or AWI ships when near the station.
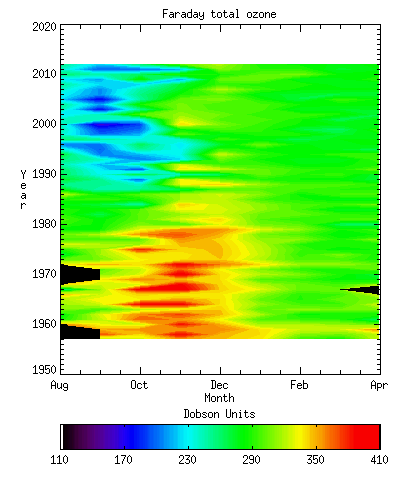
The monthly means from 1957 - 2013 give a complete picture of the changes in ozone amount and 100 hPa temperature at Faraday/Vernadsky.
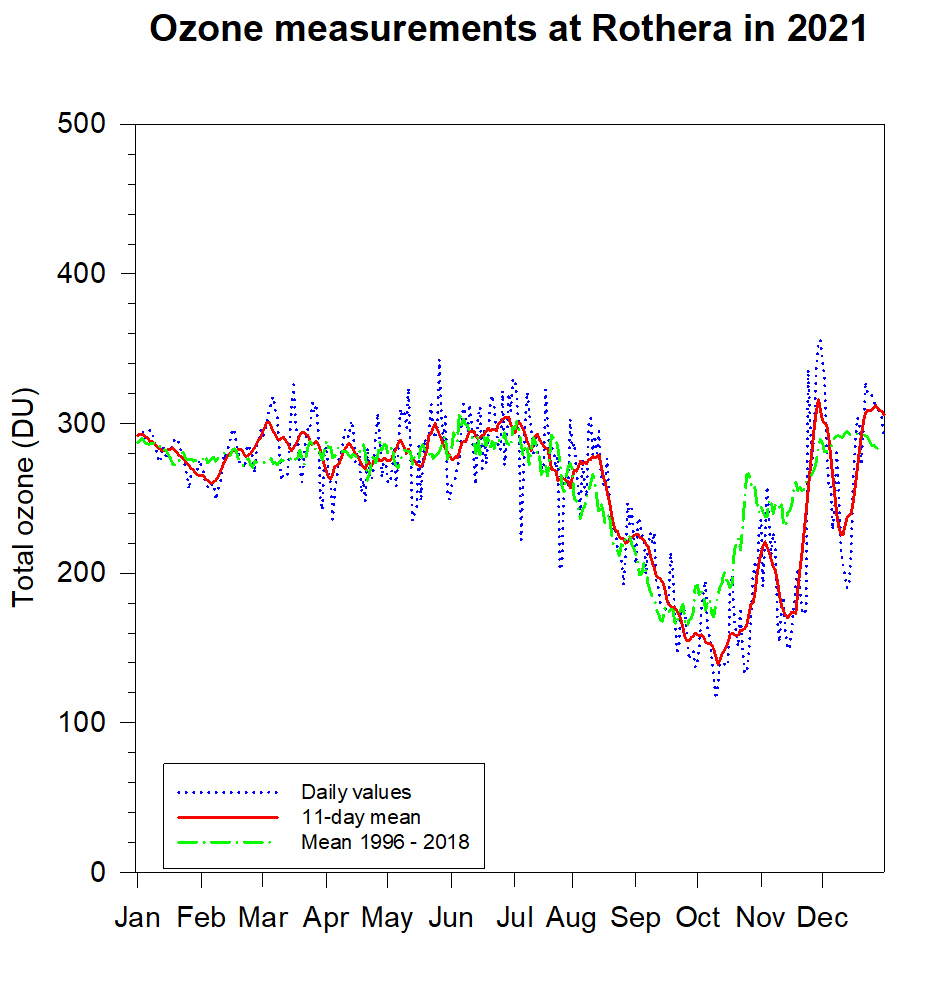
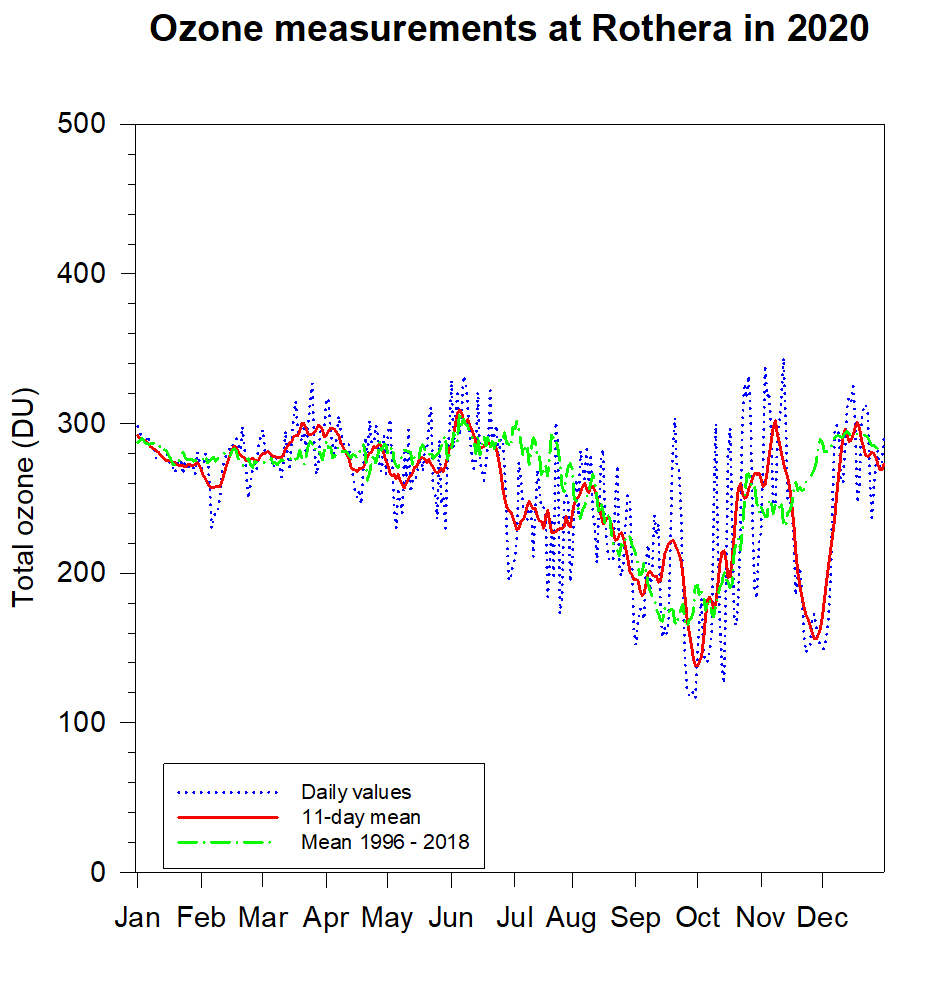
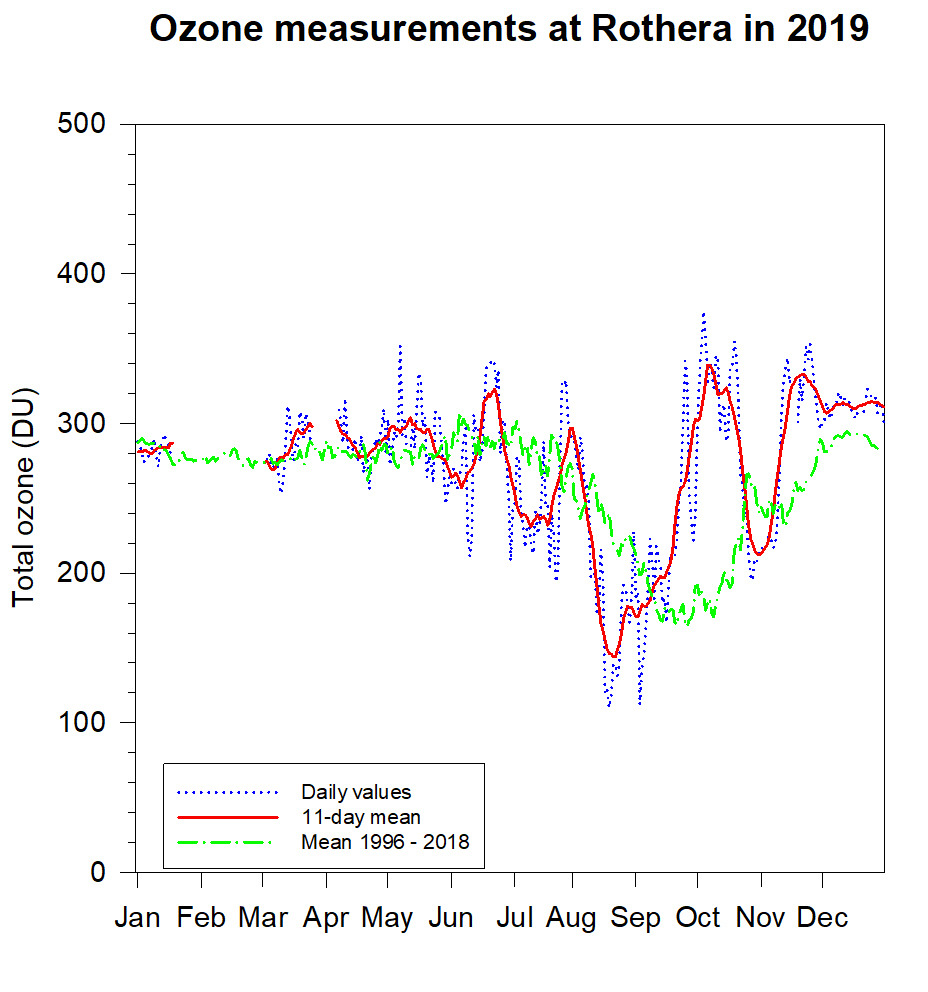
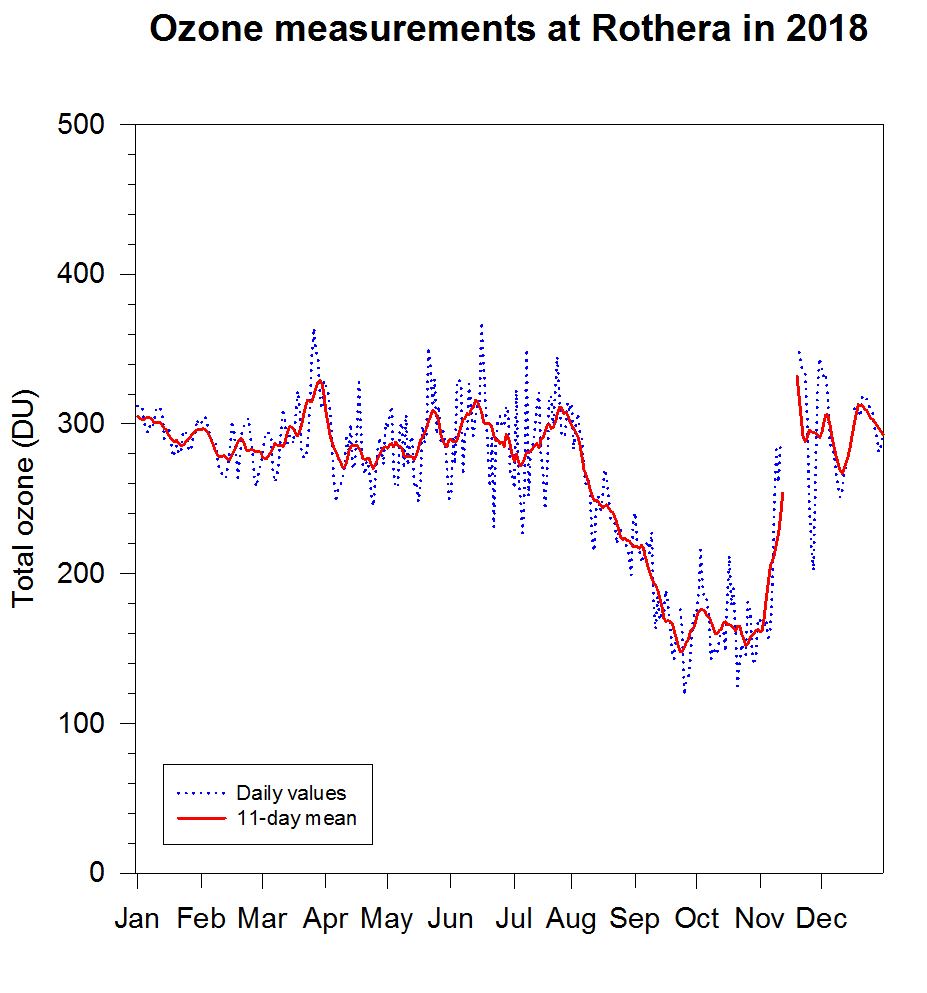
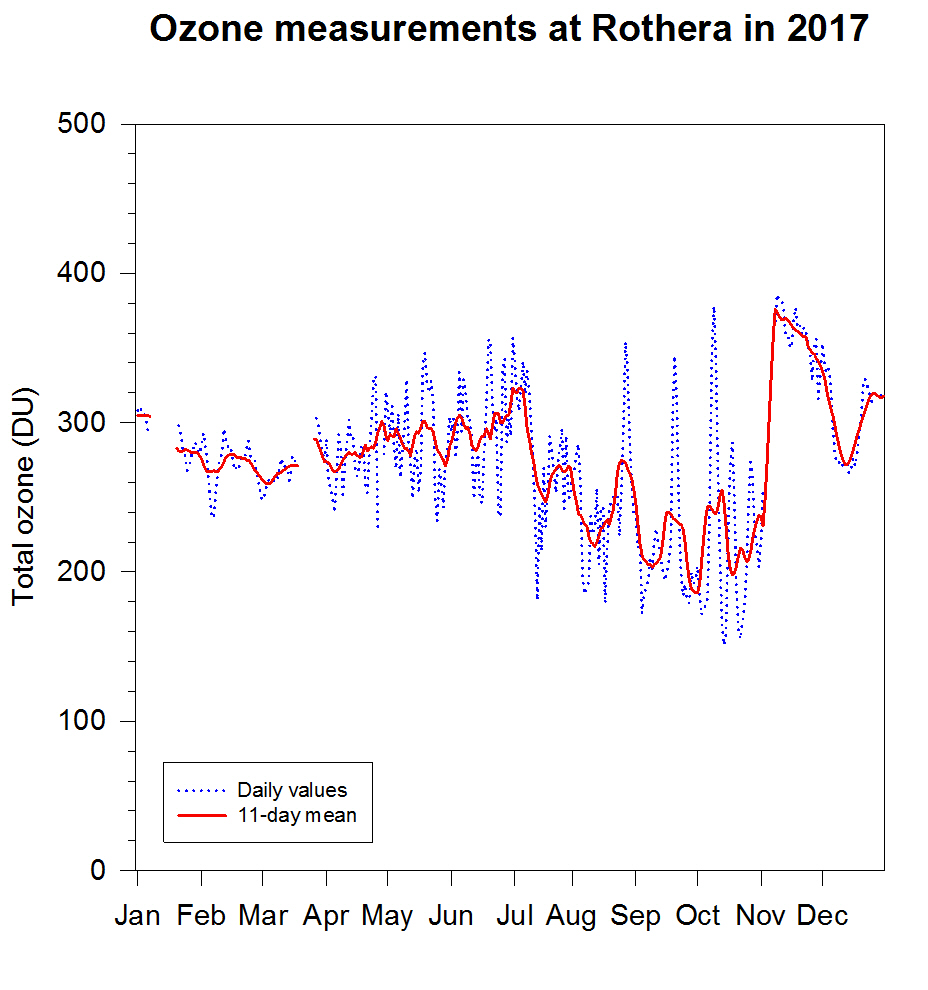
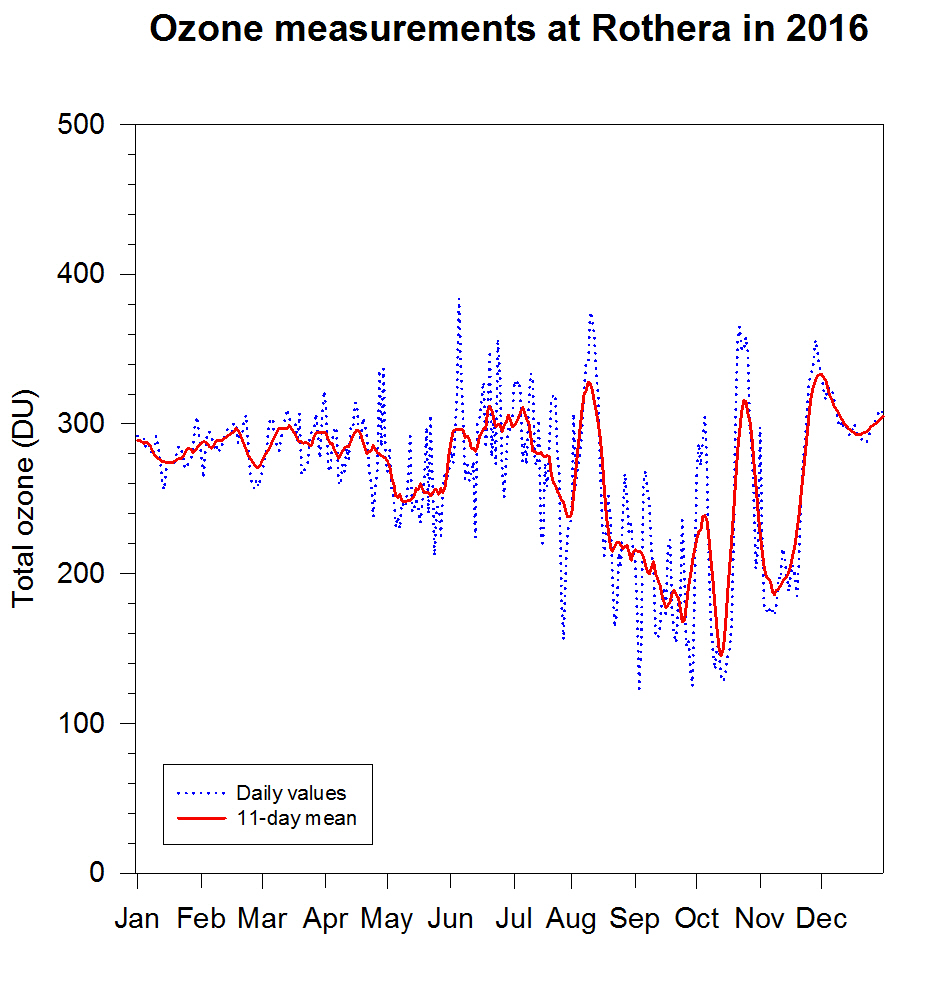
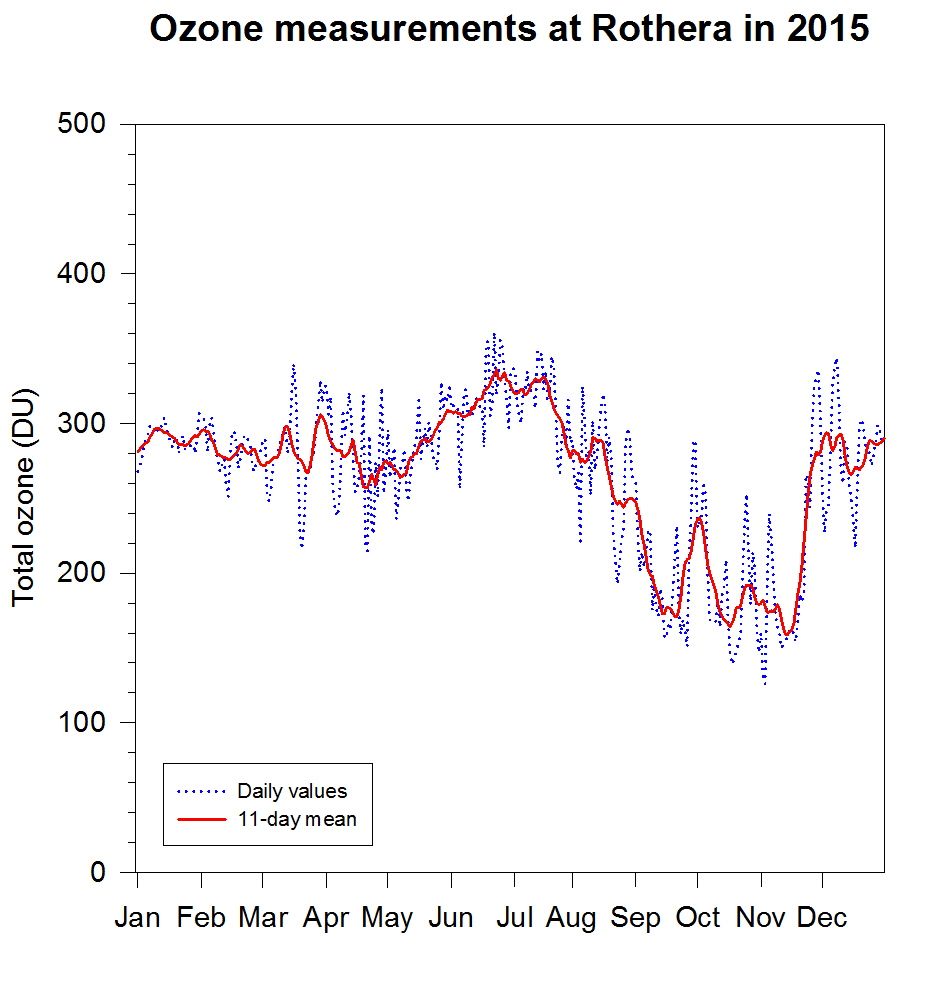
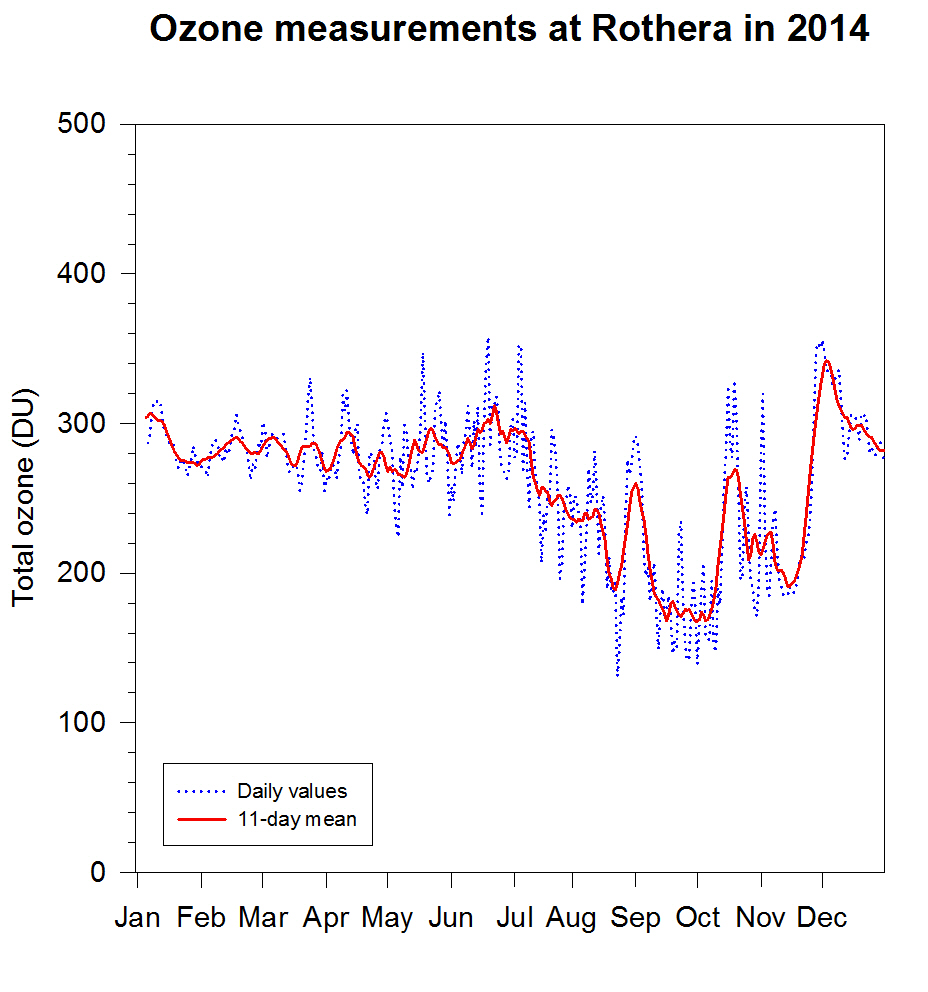
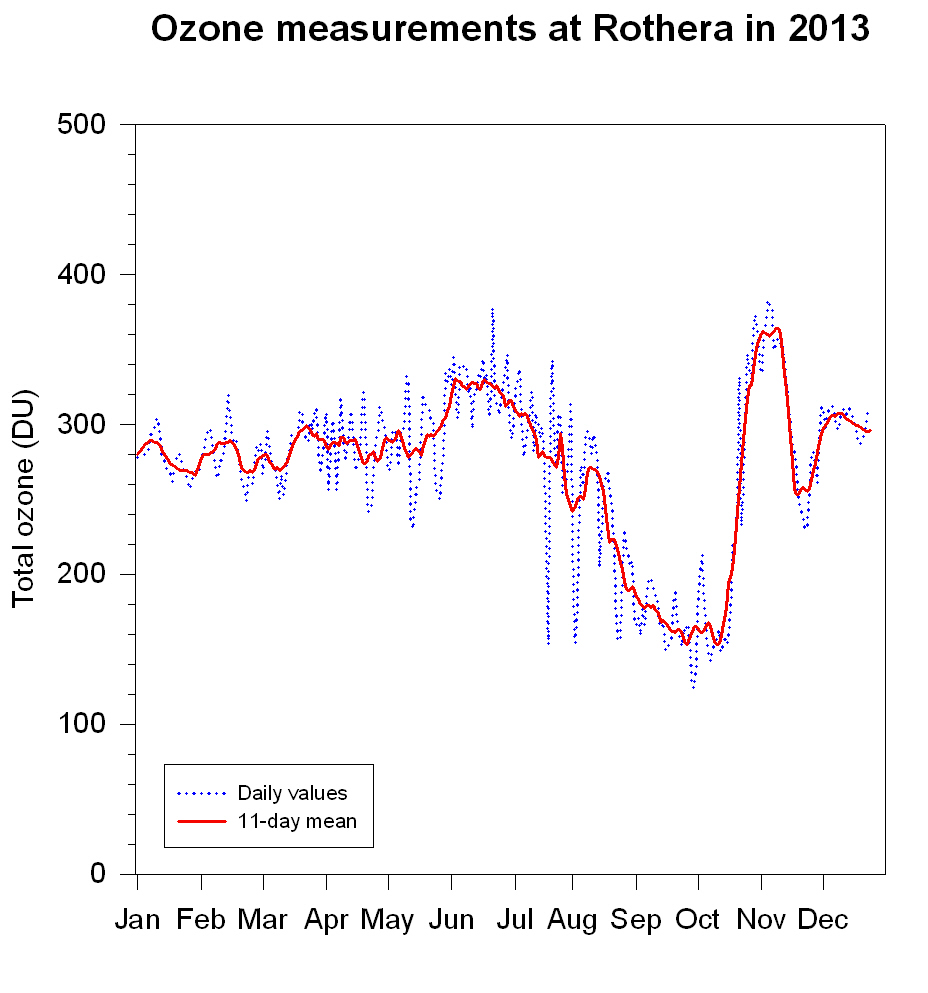
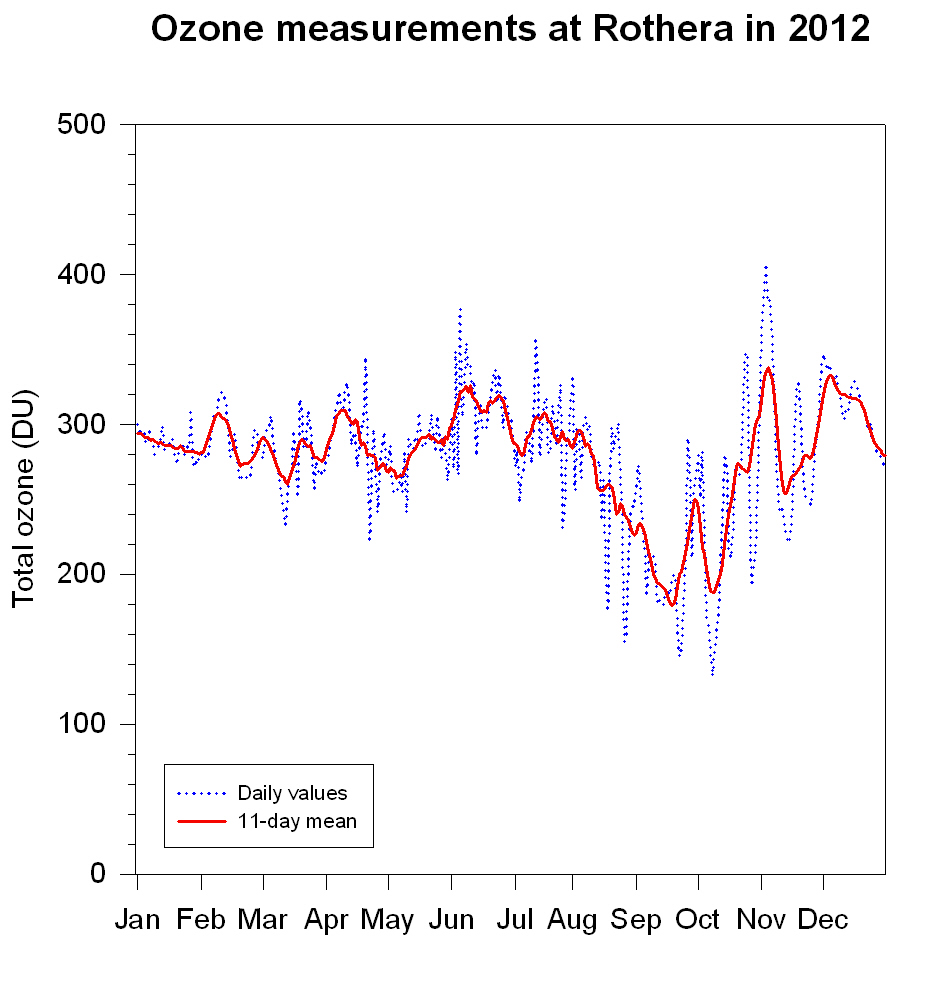
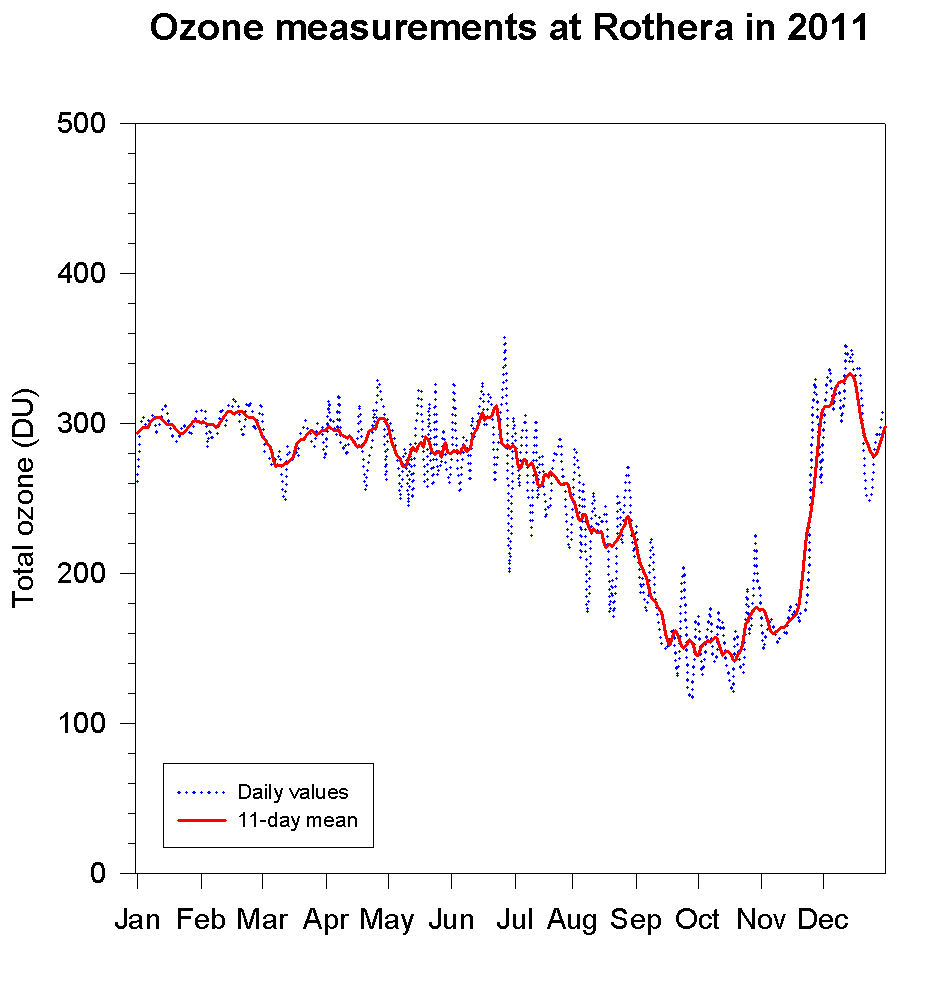
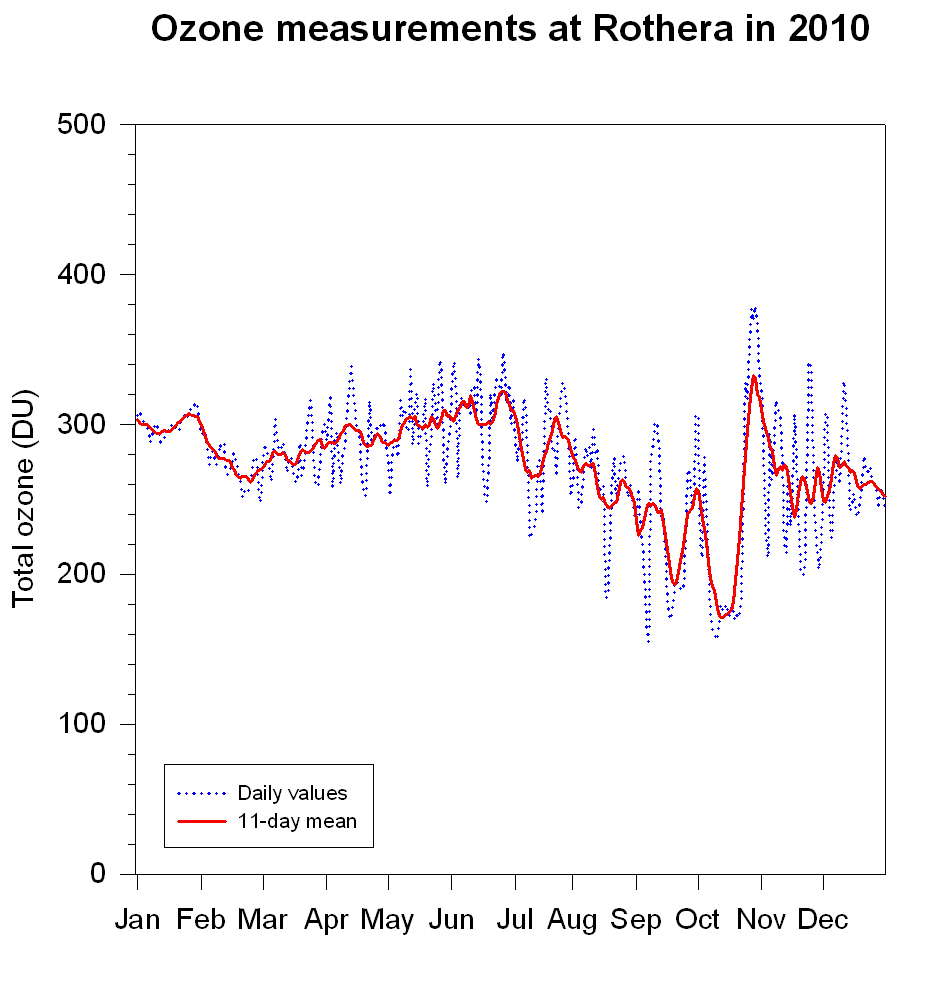
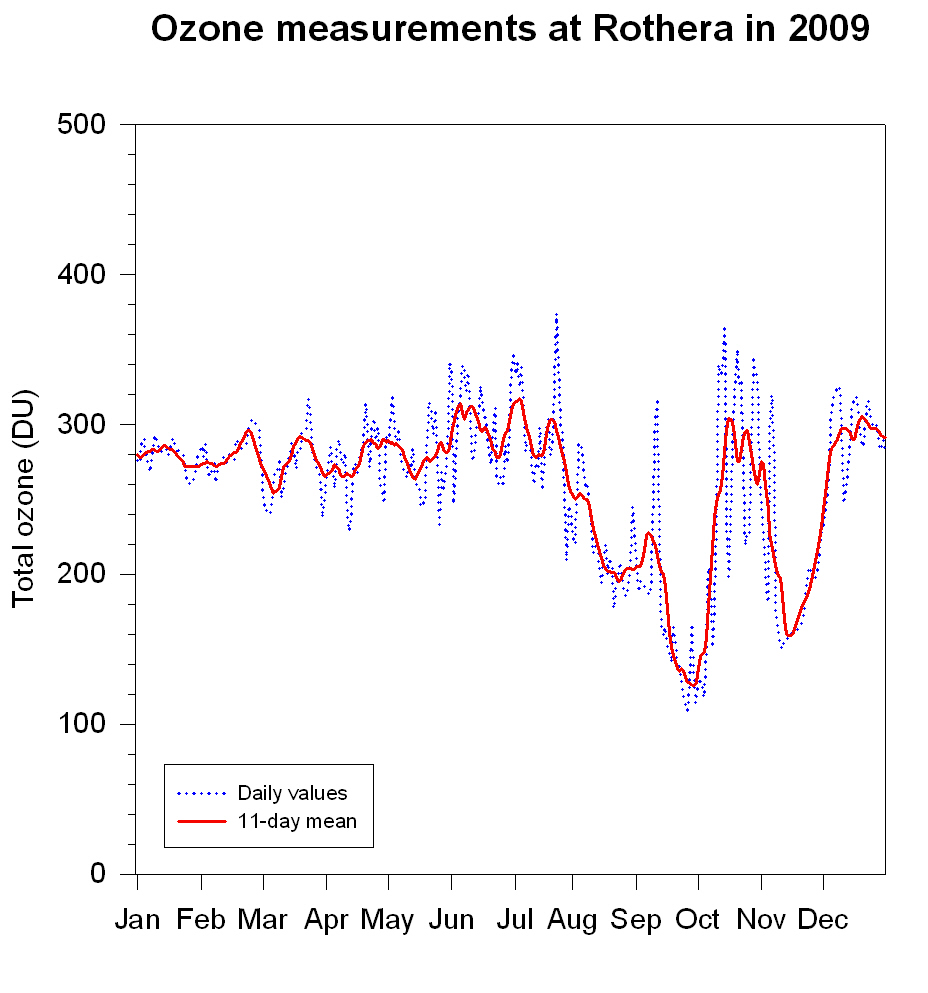
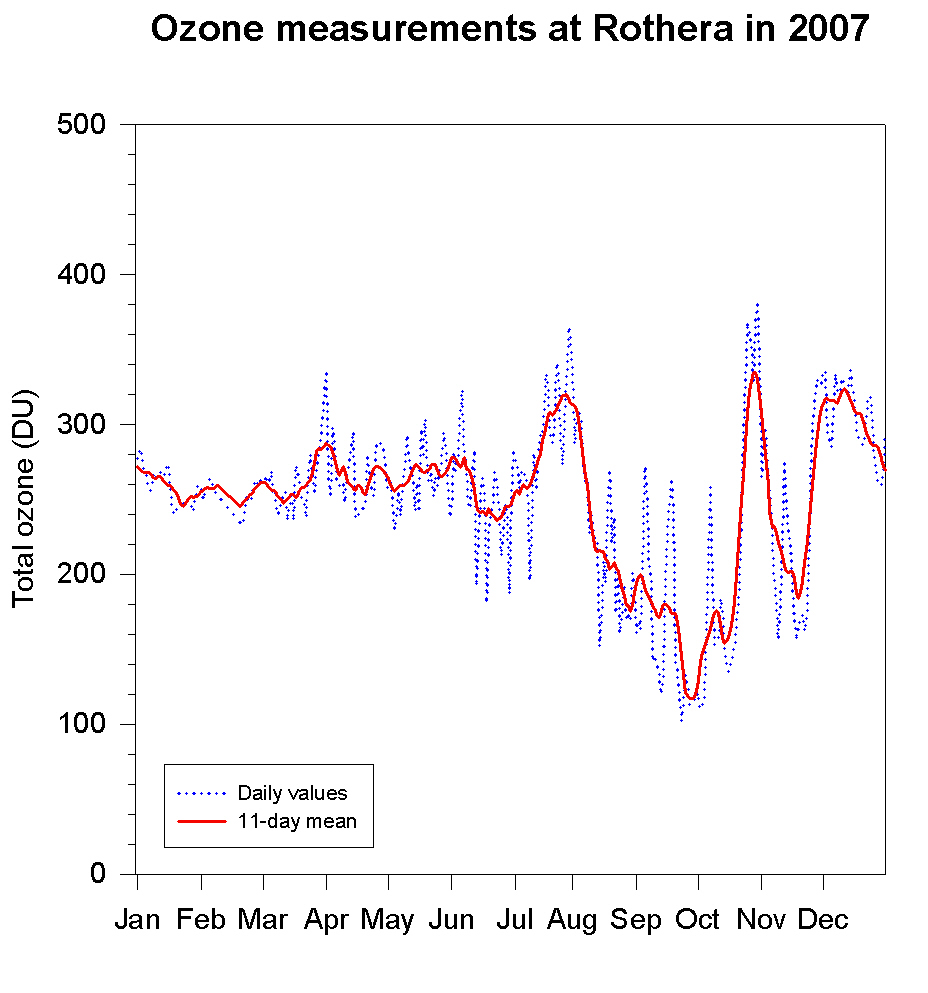
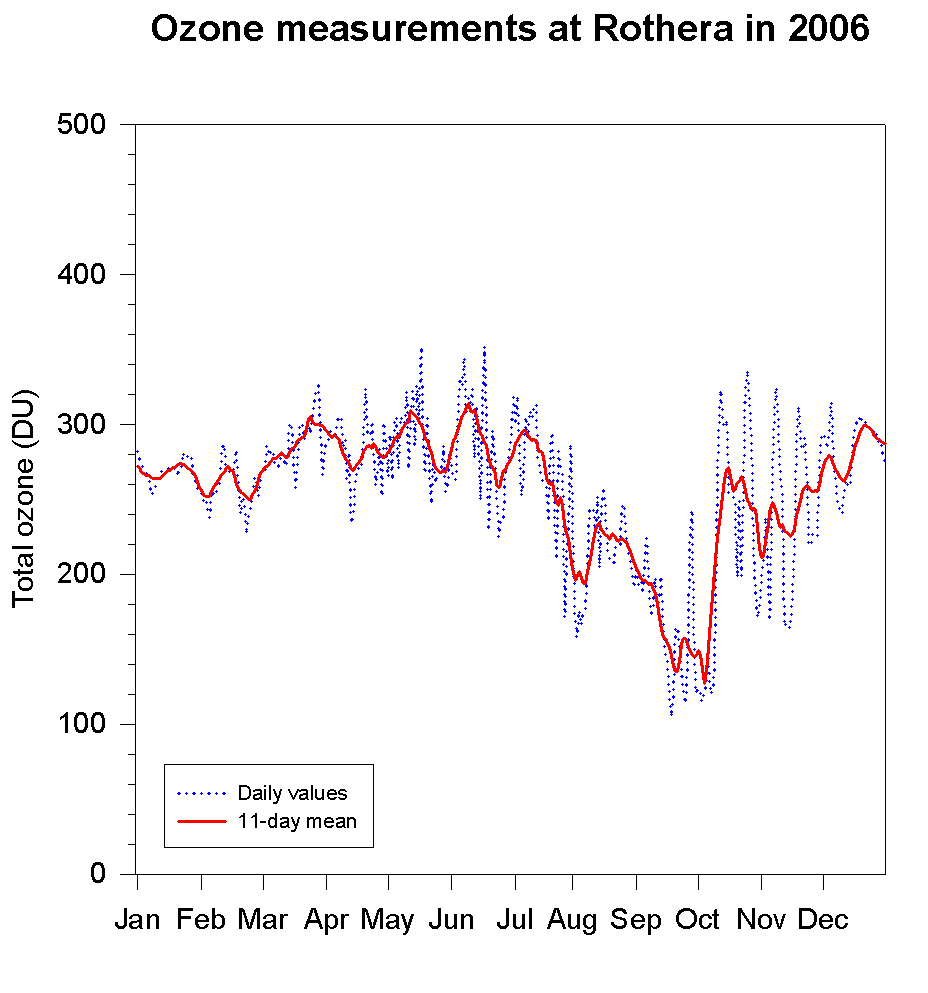
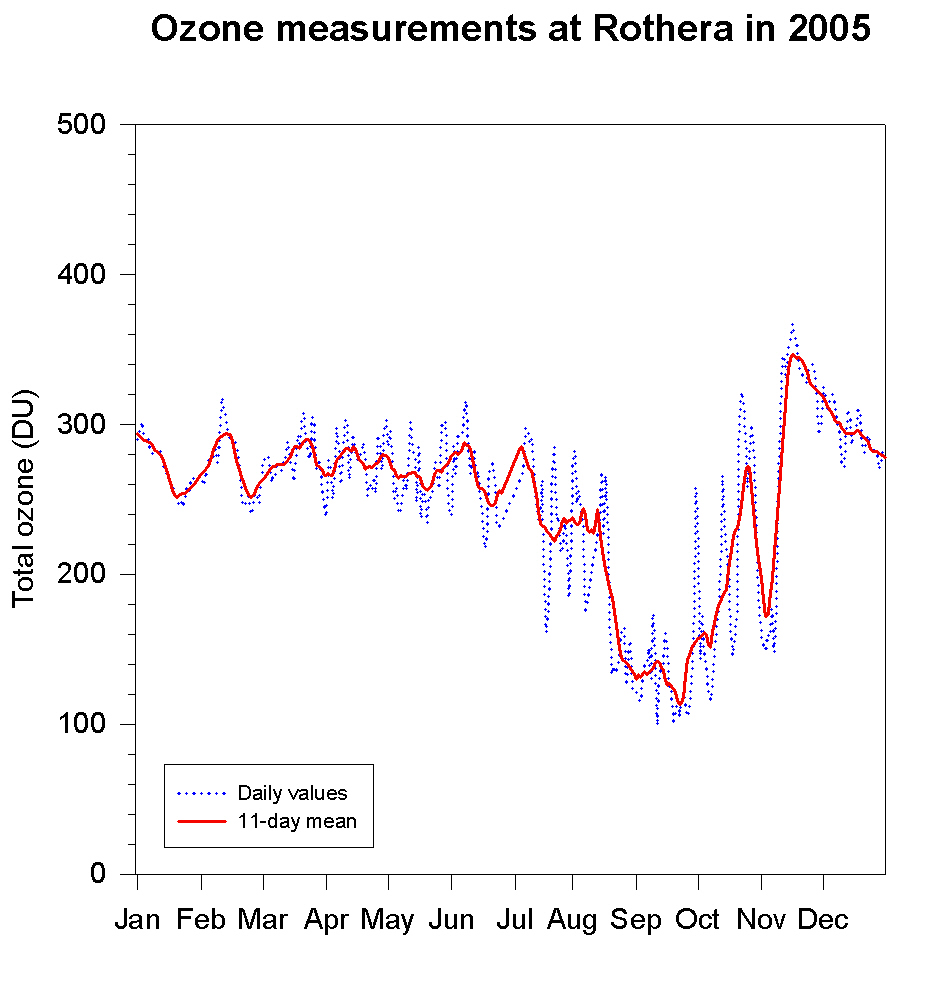
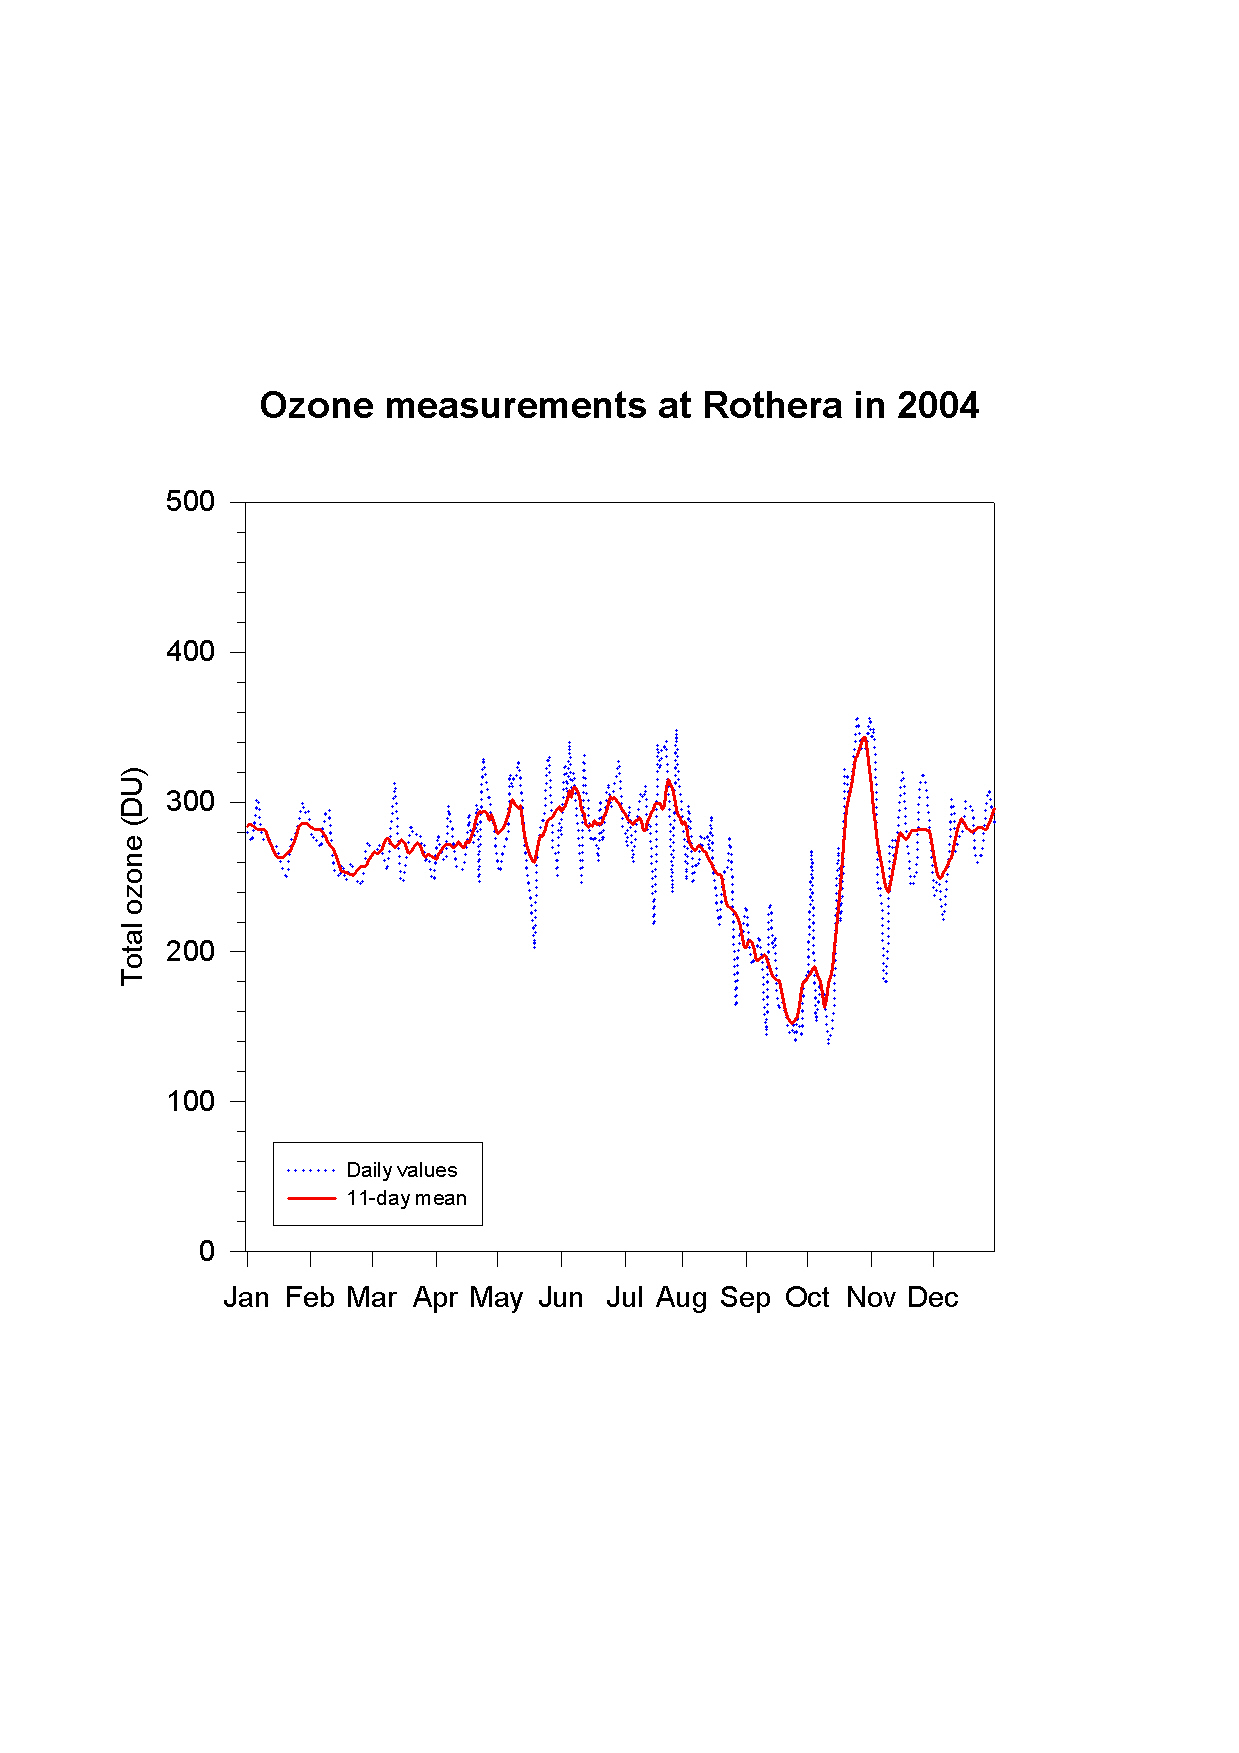
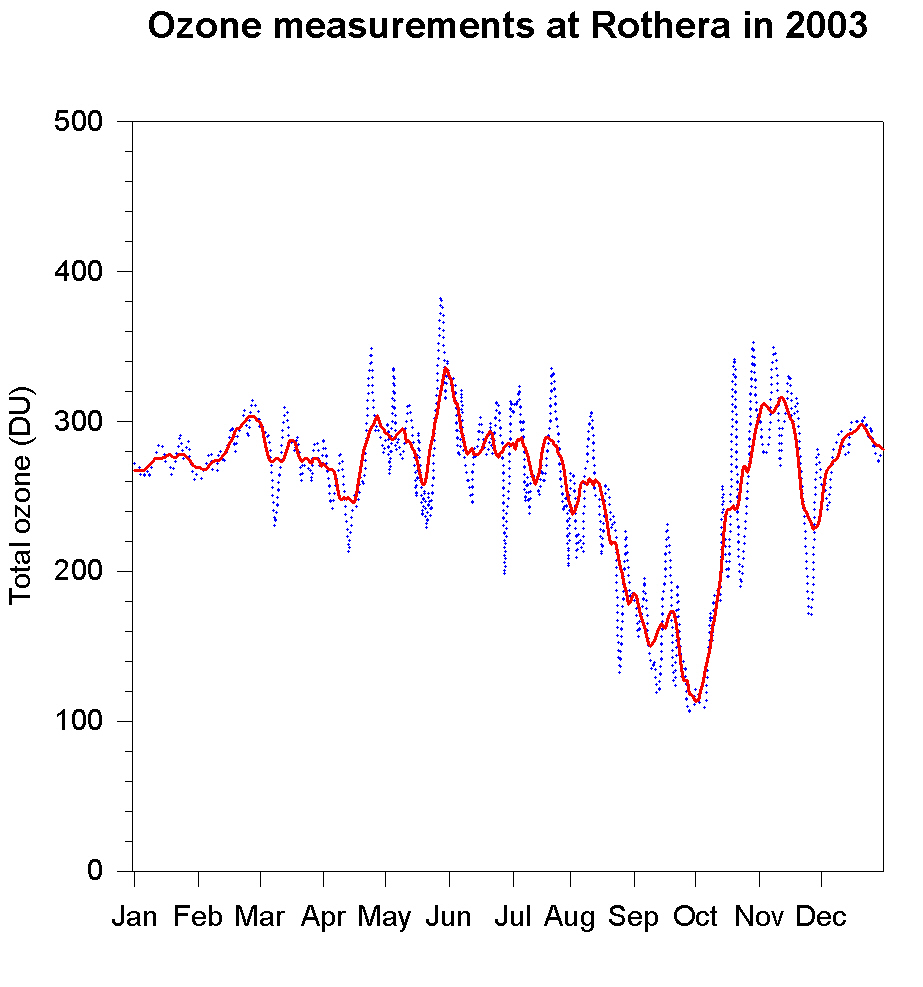
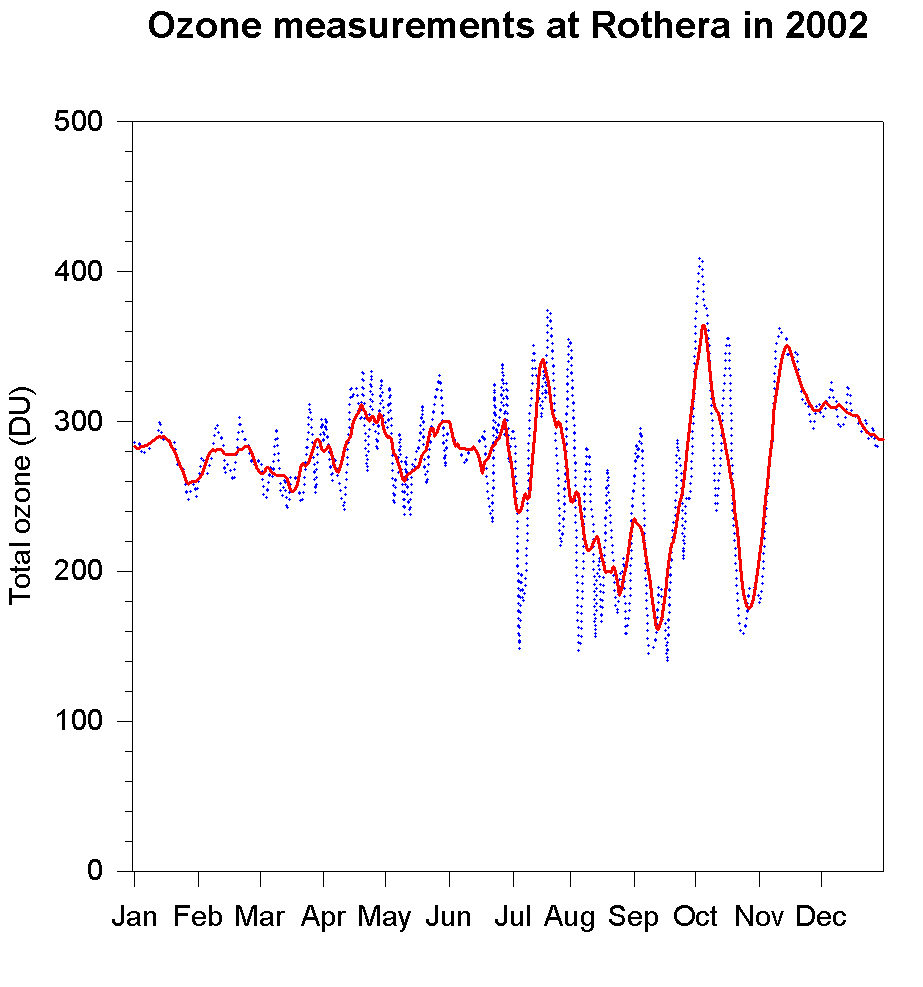
Rothera SAOZ ozone
2021,
2020,
2019,
2018,
2017,
2016,
2015,
2014,
2013,
2012,
2011,
2010,
2009,
2008,
2007,
2006,
2005,
2004,
2003,
2002
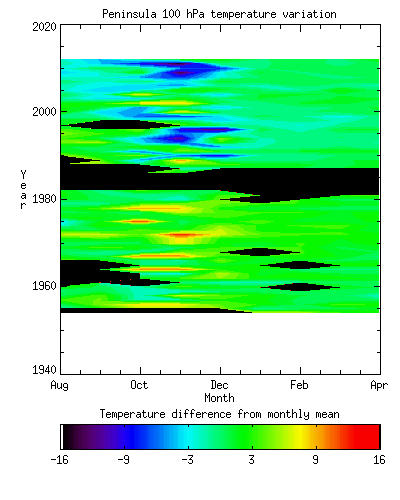
Antarctic Peninsula
Graphs for 100 hPa covering the full year.
Page maintained by J. Shanklin.