
|
|
|
| [Science] [BAS home] [Met home] | Meteorology and Ozone Monitoring Unit |
ANTARCTIC OZONE
This page gives information about ozone at Halley, Rothera and Vernadsky/Faraday stations. It was either updated or new data was added on 2006 June 28.
Generally Antarctic ozone levels are past their autumn minimum, but the polar vortex is spinning up giving a range between 250 DU and 350 DU across the continent.
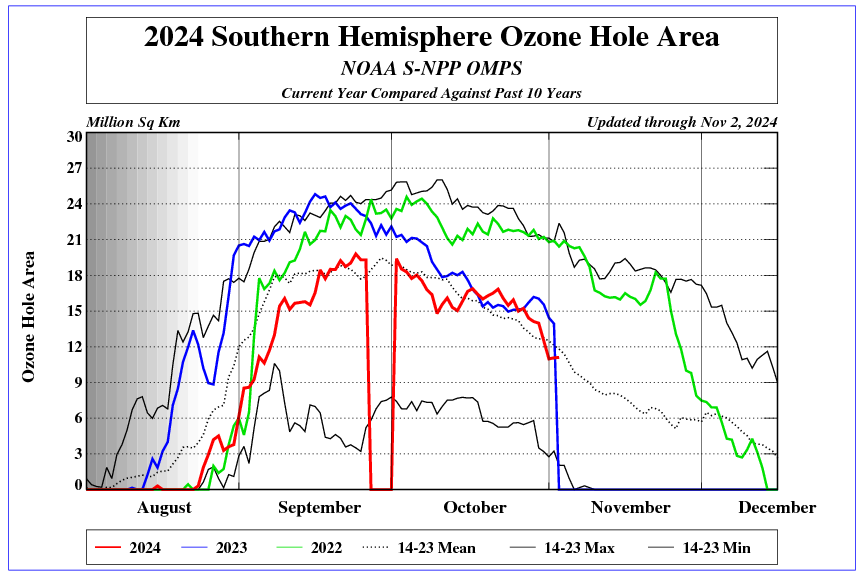
The 2005 ozone hole was one of the deepest and largest recorded, with a peak of 25 million square kilometres in early September. Ozone values at Rothera in September were among the lowest recorded at this time of year, and values around 110 DU were reached on September 11, 19 and 20. Both Halley and Vernadsky recorded their second lowest values ever during September. The tip of South America and the Falkland Islands were affected by the edges of the ozone hole between August 30 and September 2; September 10 and 12; September 16 and 18; September 25 and 27. During these periods values dropped to over 20% below the normal for the time of year, and in the end of September event were over 30% down, with values below 200 DU. The region was affected by severe ozone depletion from October 7 to 10, when ozone amounts dropped 50% below the normal levels. South Georgia experienced low ozone values from October 9 to October 22. Stratospheric temperatures rose rapidly in November and the 2005 ozone hole season ended in December.
Note: The Antarctic ozone hole is usually largest in early September and deepest in late September to early October. September 16 is world ozone day. Prior to the formation of ozone holes, Antarctic ozone values were normally at their lowest in the autumn (ie March).
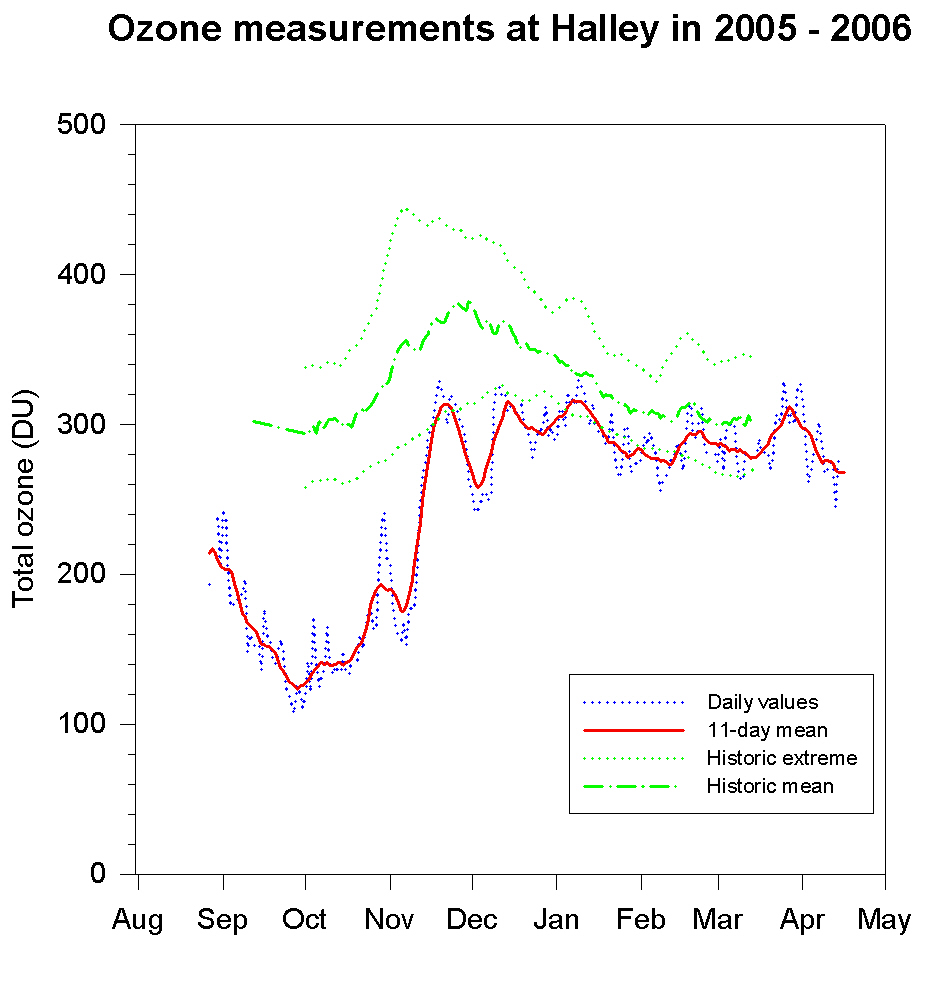
Halley - Total ozone: The observations show that ozone values
fell rapidly from late August, when observations started, and reached a minimum of around 120 DU, 60% below the normal for the time of
year, in late September. Daily values dropped to 107 DU on September 27, which is the second lowest value ever
recorded for the month. Values rose in October, with a short stratospheric
warming pushing daily values up to 240 DU at the end of the month. Values dropped, but
then rose rapidly and reached 320 DU (15% depletion) in late November. A
decline to 250 DU (35% depletion) occurred in early December, with a recovery to
320 DU a week later. Values slowly declined reaching 280 DU by the end of
March, however superimposed on this was significant wave activity with a period
of about a month. The end of season values were some 5% below the normal for the time of year. This figure
[updated 2006 May 5] shows the variation in 2005 - 2006 and the normal for 1957-72.
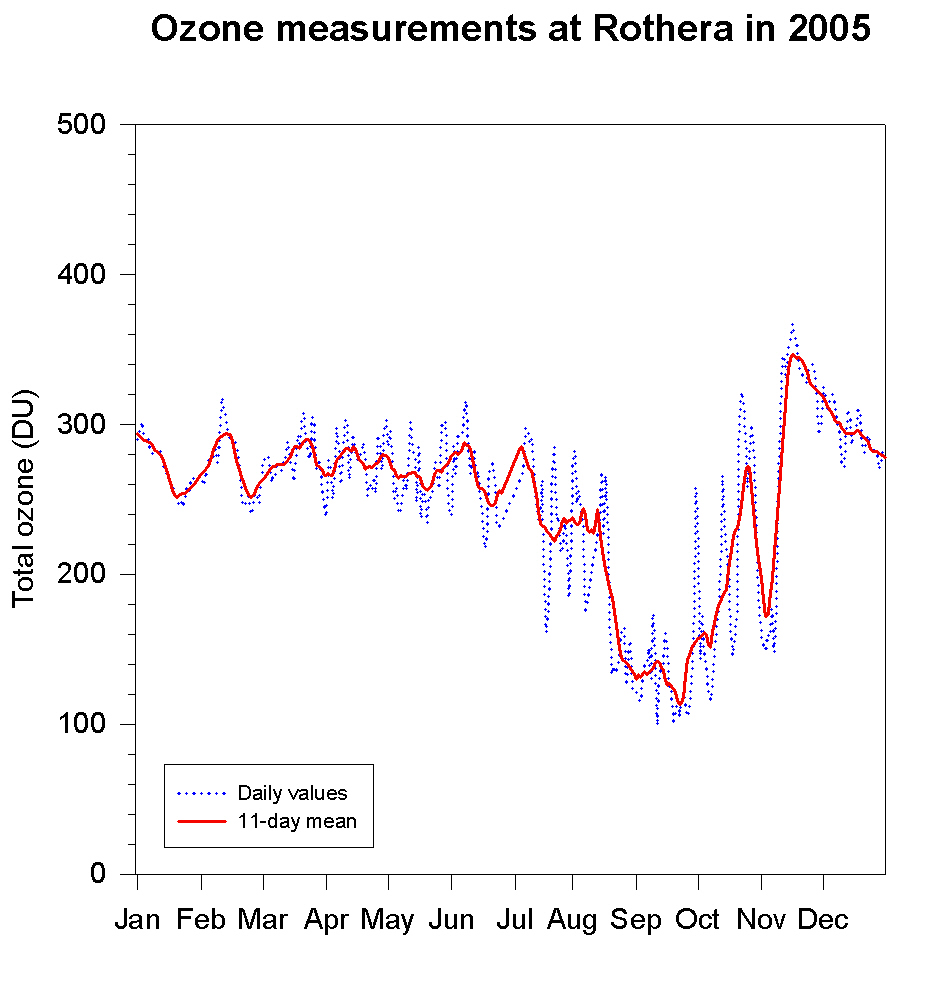
Rothera - Total ozone: Mean values in
2005 fell slowly from 285 DU
at the beginning of the year to 240 DU in mid August, with long
period variation of around 20 DU from the mean, and shorter period
variation of 30 DU. Values then fell rapidly, reaching a minimum
around 110 DU around the September equinox. The lowest value recorded was 99 DU on September 11, which
is the
earliest that such low values have been recorded and values around 100 DU were
also measured on September 19 and 20. The instrument
under reads by about 10%, so these are equivalent to a true reading of
110 DU. Values rose, to reach around 300 DU at the end of October, but
fell to around 190 DU in early November. Values rose to around 350
DU in mid November, then began the slow decline to the autumn minimum and
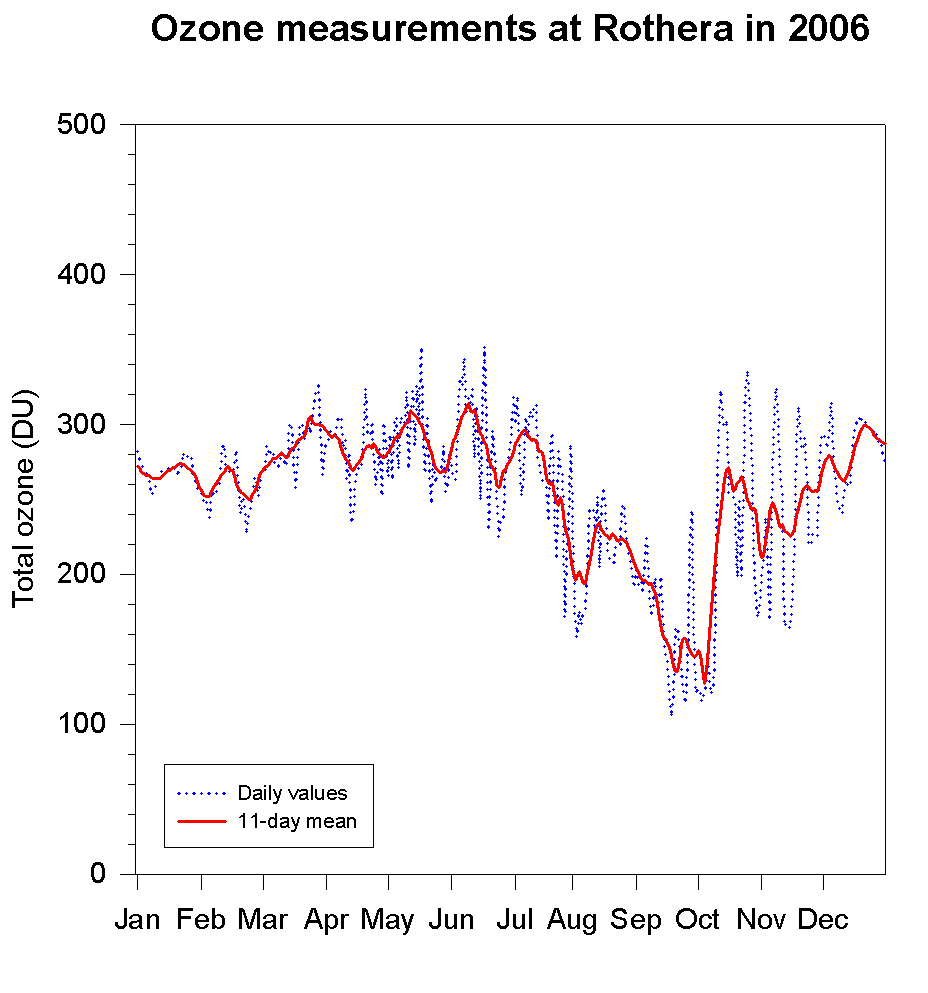
reached 280 DU by the end of the year. Ozone values for the first two
months of 2006 were around 270 DU, but have slowly increased to around 310 DU. This figure shows the variation
during 2005 and this figure [updated 2006 June 13] the variation during 2006.
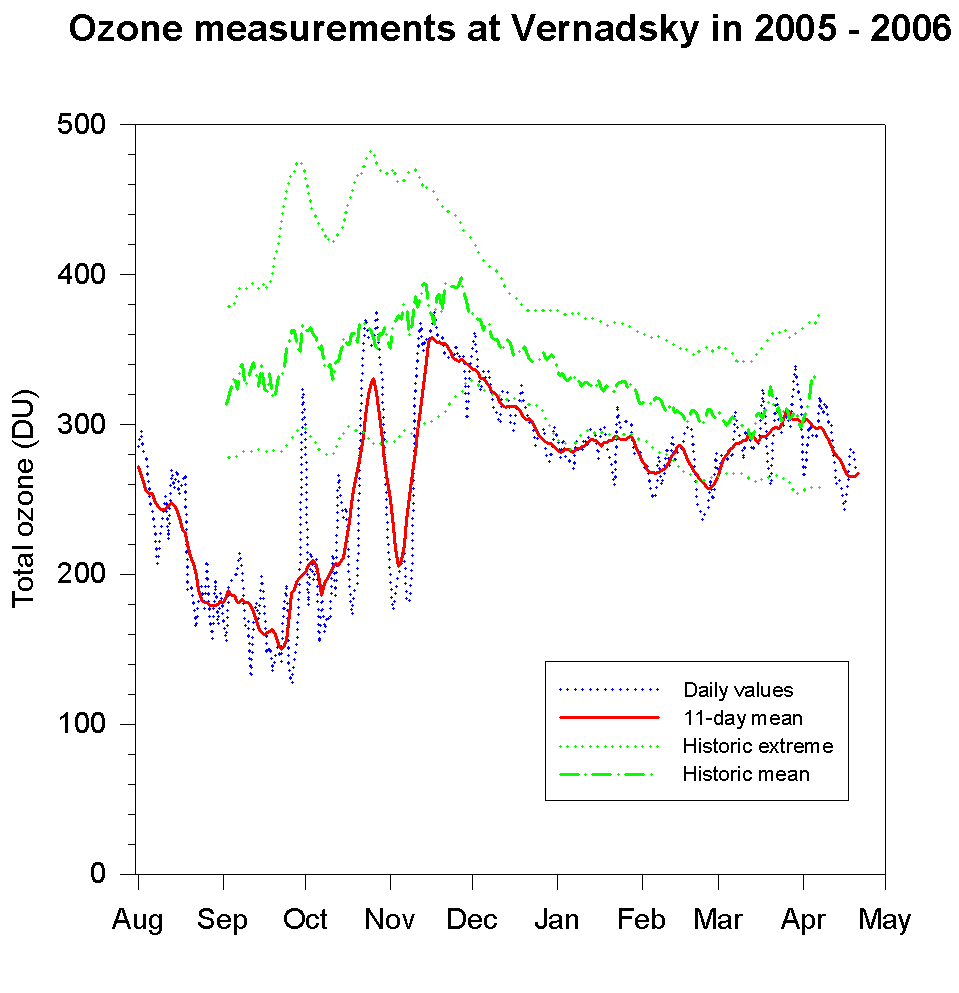
Vernadsky - Total ozone: Mean ozone levels declined from around 270 DU
(10% depletion) at the beginning of
August to 150 DU (55% depletion) in late September. Daily values dropped to 126 DU on September 26,
which is the second lowest value ever recorded during the month. Values
rose in October, peaking above 350 DU in a major stratospheric warming at the
end of the month, although this is still just below the normal for the time of
year. They fell back to around 210 DU (40% depletion) in early November, but
then rose to near normal levels around 360 DU by mid month. Values fell rapidly
to the end of the year to around 290 DU (10% depletion). Values generally
fell until March, reaching 280 DU, but then rose to around 300 DU. This figure [updated
2006 June 8]
shows the variation in 2005 - 2006 and the normal for 1957-72.
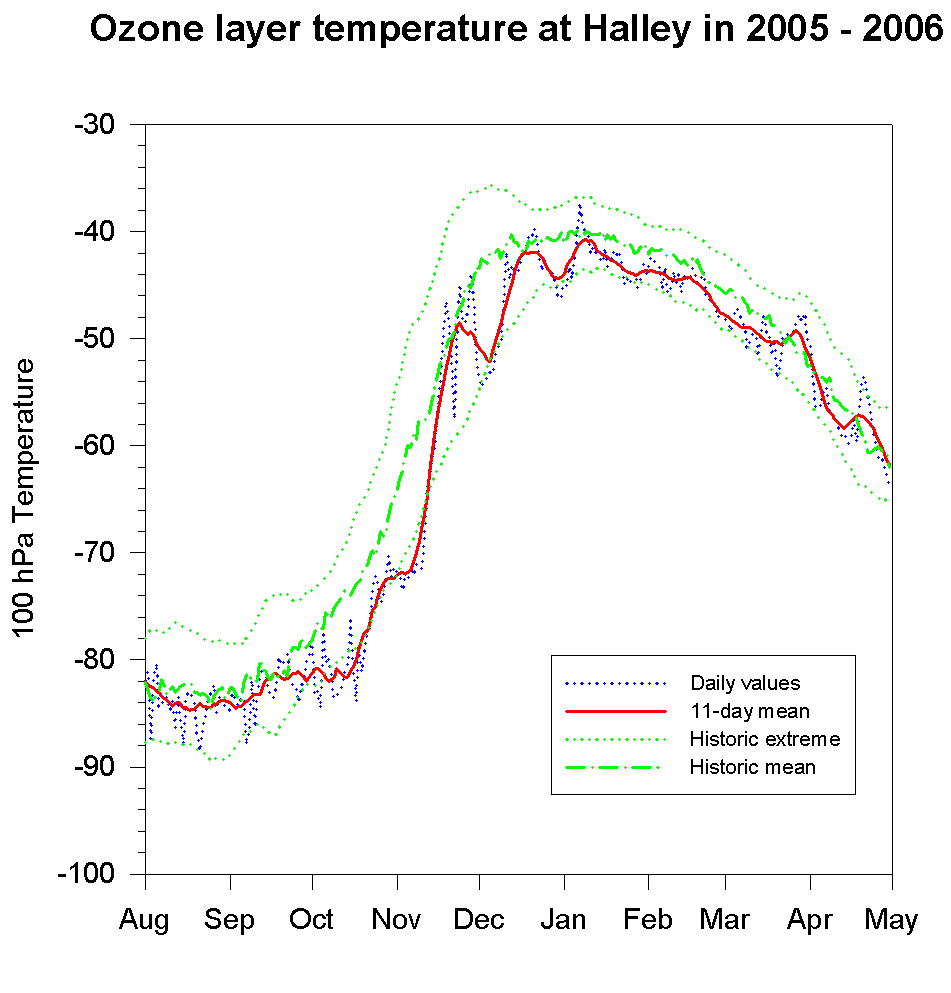
Temperature and PSCs: The 100 hPa pressure
level is near the base of the ozone layer, but is reached by most radiosonde
flights. The temperature at this height becomes sufficiently
cold that polar stratospheric clouds (PSCs) can exist widely during the winter. PSCs
were reported from Vernadsky on June 16 & 21, and were also seen at Rothera.
Halley - 100 hPa temperature: The 100 hPa temperature slowly
rose from
the winter minimum around -84°C in late August until mid October, when a rapid
rise pushed temperature up to -72°C, this was followed by a further rise in mid
November, but the temperature dropped back to -52°C at the beginning of
December. The temperature rose to -40°C in the final spring warming in
mid December, with a final peak in early January. Temperatures then
declined, generally keeping close to, but a little below the seasonal norm, with
significant wave
activity having a period of about a month. This figure [updated
2006 May 5] shows
the variation at Halley in 2005 - 2006 and the normal for 1957-72.
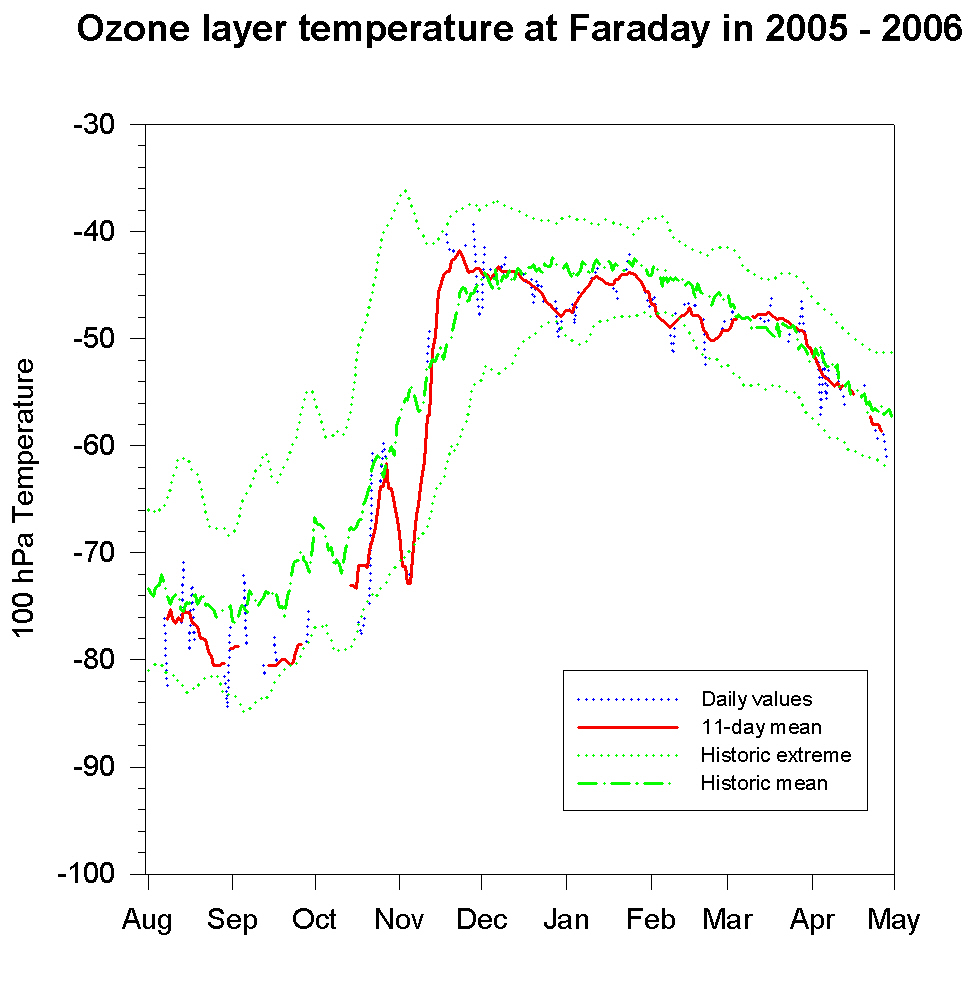
Peninsula - 100 hPa temperature: From the beginning of January
to early August the 100 hPa temperature was close to the long term
normal. From then until mid October it remained around -77°C, reaching around
7° below the normal. The temperature rose to near normal in late October,
fell back to -73°C in early November and then rose to -42°C in the final
spring warming in late November. The temperature stayed a little below the
normal for the remainder of the summer, but has been close to the normal since
March. This figure [updated
2006 June 8] (compiled
from flights from Marambio and Rothera) shows the
variation in 2005 - 2006 and the normal for 1957-72. There has been a radiosonde programme of
several flights per week
at Rothera since 2003 March, increasing to daily flights for the QUOBI project
from mid June to mid October 2003. Strong winds on 2004 October 2
& 3 damaged the hangar at Rothera and this has significantly restricted the conditions
under which sondes can be launched. The Polarstern was stationed in
the western Weddell Sea from early December 2004 to early January 2005 and launched one or two sondes each
day.
Satellite: Satellite imagery gives a global perspective on the ozone hole. TOVS (which can image during the polar night) and TOMS had significantly different calibrations, with TOVS showing lower readings than TOMS. TOMS values were close to ground-based values. Different satellite operators use slightly different criteria for defining the area of the ozone hole and hence give slightly different areas. TOMS images ceased to be available from the beginning of 2006 and are replaced by OMI images. Our 2005/2006 Antarctic ozone hole movie [updated 2006 March 31] is produced from OMI images. The NCEP and KNMI analyses shown on the Canadian Met Service daily ozone maps pages give a good analysis in the Southern Hemisphere but the NCEP forecasts tend to increase ozone amounts within the ozone hole. US NWS CPC plots from NOAA show the current area of the ozone hole.
Arctic: Ozone values generally range between 350 and 450 DU at the moment. Ozone values over the Arctic since June are shown in our Northern Hemisphere TOMS movie. Temperatures declined sufficiently during the northern winter of 2005/6 for stratospheric clouds to form and for chemical and dynamic ozone depletion to take place. "Ultra-cirrus" clouds, at heights above 20km were briefly visible after sunset on January 20 from the UK. These are likely to have been diffuse stratospheric clouds that are thinner but more widespread than the nacreous clouds. For more UK information see the DEFRA UK Stratospheric Ozone Measurements page.
Reports of a substantial Arctic ozone hole forming in response to a solar proton event in the spring of 2004 are somewhat exaggerated. Although this did lead to substantial depletion of up to 60% near the top of the ozone layer, less than 10% of the total ozone column is in this region. The event therefore had less effect than normal day to day changes and no ozone hole was formed. The spring of 2005 by contrast had much lower stratospheric temperatures and significant chemical ozone depletion did take place. Although the column ozone never quite dropped to "ozone hole" levels, the amount of ozone affected by chemical depletion is broadly comparable to that seen in the Antarctic ozone hole.
Equator: Ozone levels are normally lowest over the topics and OMI data shows nothing unusual. TOVS data has a calibration problem and shows values that are significantly lower than those that are measured by other means. The northern tropics are at their winter minimum, whilst the southern tropics are at their summer maximum.
The BAS ozone bulletins contained the actual ozone values reported together with an analysis of the situation. These were distributed by email on request, but are now superceded by this web site. The last ozone bulletin was issued on 2002 May 28. The final situation report of each season is archived for historical reference.
Some data is available on line, however please note that this is provisional and likely to change without warning. To help interpret the data you should to read this description. You must request permission to reproduce the data and I may be able to supply more suitable or more up to date material.
Provisional daily mean ozone values for 2005/2006 for
Halley [Updated 2006 May 5] and Vernadsky. [Updated 2006 June 8] The data sets commence on
August 1. Observations with Dobson 103 ceased at Halley on 2005 December
26 and observations with Dobson 73 commenced on 2005 December 24. Observations with Dobson 31 ceased at Vernadsky on 2005 March
29 and observations with Dobson 123 commenced on 2005 March 27. During the
overlap periods a mean of both instruments is given. Ozone values from
both the refurbished Dobsons are likely to undergo frequent revision until the instrument
constants are well determined. Ozone values from the old instruments are
also likely to undergo revisions following both the on-site intercomparisons,
and intercomparisons at Hoenpeissenberg.
Provisional daily mean ozone values for Faraday/Vernadsky and Halley between 1972 and 2004.
[Updated 2005 June 10]
Provisional monthly mean ozone values for Faraday/Vernadsky and Halley between 1956 and 2005.
Mean daily ozone values for the period 1957 - 1972 for
Faraday and Halley
.
Daily ozone values for the period 1957 - 1973 for Faraday and Halley .
Temperature and Ozone graphs for Halley and Vernadsky/Faraday. [Updated 2005 September 9]
Stratospheric Temperature - Radiosondes are released daily at Halley
and every other day at Rothera. The 100 hPa or 70
hPa pressure level is close to the height of the maximum ozone
concentration. Over the last 30 years the mean 100 hPa
temperature has declined in most months. The most notable change
is in November at Halley.
Monthly 100 hPa temperature means for Bellingshausen/Faraday/Rothera/Marambio/Polarstern and
Halley between 1954 and 2004.
[Updated 2005 June 10]
Rothera - Ozonesondes: During 2003 we carried out ozone sonde flights at Rothera as part of the QUOBI project. Data from these flights is available in NASA-AMES format. Animation of the ozonesonde flight results [note that although the ozone scale on these graphs reads nanobars, it should read mPa].
Rothera - Ozone: The SAOZ instrument at Rothera has measured total column
nitrogen dioxide and ozone since 1997. The values given here are
preliminary and only show general trends in ozone amounts. In particular,
the calibration of the instrument is such that it reads about 10% lower than a
Dobson at values around 100 DU.
Total column nitrogen dioxide 1997/1998.
Total column nitrogen dioxide and ozone 1998, 1999,
2000, 2001,
2002, 2003,
2004,
2005 and
2006.
[Updated 2006 June 28]
There is also a Bentham spectro-radiometer at Rothera.
Provisional values for 1997 / 1998 / 1999
/ 2000 / 2001
/ 2003 / 2004
are available [updated 2004 November 5 ]. The original instrument was
destroyed in a fire on 2001 September 28, however a replacement was commissioned
and became operational on 2003 March 3. For further information on this
data set and permission to use it please contact Paul Geissler at BAS. All
values have been updated to the TOMS 8 algorithm.
Some background information on Halley, Rothera and Faraday stations is available from BAS. Information about Vernadsky station is also available from the Ukrainian Antarctic Centre. Information about Vladimir Ivanovich Vernadsky
Some surface and upper air synoptic data is also available on line from our public data page.
Southern Hemisphere ozone hole movies for
1997/1998 ,
1998/1999 ,
1999/2000 ,
2000/2001 ,
2001/2002 ,
2002/2003 ,
2003/2004 ,
2004/2005,
2005 [TOMS] and
2005/2006
[OMI updated 2006 March 31]. A short sequence
of the 2001 hole.
Northern Hemisphere movies for 2000/2001 ,
2001/2002 ,
2002/2003 ,
2003/2004 ,
2004/2005,
2005 [TOMS] and
2005/2006
[OMI updated 2006 March 31] A short sequence of ozone depletion during the
2002/03 northern winter showing the difference
from the normal.
These annual movies are each about 8Mb and were compiled from daily TOMS images until the end of 2005; from
2005/06 they are compiled from OMI images. The movies begin
and end in June.
Today's
OMI global image
The current
area of the hole and other
latest details are available from the NOAA Climate Prediction
Center.
Environment Canada have an excellent set of daily maps showing
both northern and southern ozone levels from a variety of sources.
Requests for permission to use this data or for further information should be sent to Jon Shanklin who maintains these pages.
|
© Copyright Natural Environment Research Council - British Antarctic Survey 2006 |