|
|
|
| [Science] [BAS home] [Met home] | Meteorology and Ozone Monitoring Unit |
ANTARCTIC OZONE
This page gives information about ozone at Halley, Rothera and Vernadsky/Faraday stations. It was either updated or new data was added on 2008 July 4.
The ozone hole of 2007 ended at around the time of the summer solstice. The temperature of the ozone layer is now coolest over Antarctica and warmest in the circum-polar region. It is cold enough for polar stratospheric clouds (PSCs) to exist and they have already been seen from Rothera. Temperatures are dropping further as winter progresses. Ozone values are above 350 DU in parts of the circum-polar regions as the circum-polar vortex builds, dropping to around 250 DU towards the pole and equator. Ozone values are quite low in the Atlantic sector and it seems likely that some ozone depletion is already taking place.
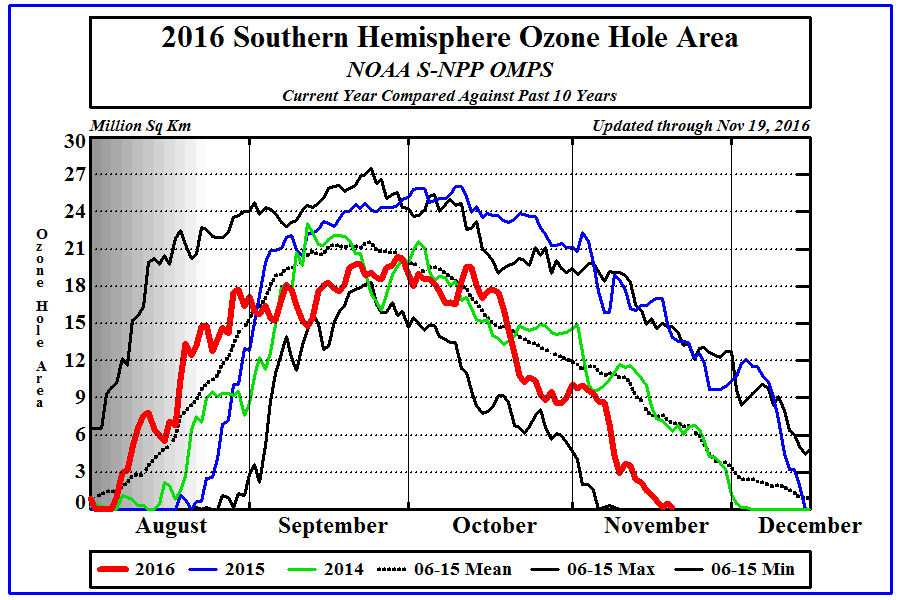
In general the circum-polar stratospheric vortex was more disturbed this year than it was last year, however there were also periods of stability. Some areas of Antarctica saw ozone values down to ozone hole levels (less than 220 DU) in mid June, suggesting the possibility of early chemical depletion, combined with some dynamic processes. In mid July the minimum temperature of the Antarctic stratosphere at 70 & 50 hPa was close to the normal, although that at 30 hPa was below the normal, and I suggested the likelihood of another strong ozone hole year. Early August saw the largest ozone hole recorded for this time of year, although at the same time very high ozone levels existed over the northern Antarctic Peninsula. The vortex was more circular in mid September but returned to an elliptical shape and initially warmed slowly. In mid September the ozone hole area reached a maximum of just over 24 million square kilometres, but it then slowly shrank as the vortex warmed further. A spring warming took place over the Pacific coast of Antarctica and the Antarctic Peninsula in late October, however this subsided as the ozone hole became more symmetric again. A second major warming took place towards the end of November, but subsided in early December. Around December 8 the ozone hole was briefly the largest on record for the date. The tip of South America and the Falkland Islands saw ozone levels below 250 DU on August 24, with South Georgia experiencing similar levels on September 4. The fringes of the ozone hole were over South Georgia on September 11. The area was intermittently affected from September 22 to October 22, with South Georgia particularly affected on September 25, when values dropped below 175 DU. The Falklands and South Georgia were affected for a final time between November 23 and 25.
See the final situation report for last year for information on the 2006 - 2007 season.
Notes: The Antarctic ozone hole is usually largest in early September and deepest in late September to early October. September 16 is world ozone day. 2007 was the International Year of the Ozone Layer. Prior to the formation of ozone holes, Antarctic ozone values were normally at their lowest in the autumn (ie March).
The September 27th edition of Nature has a news item that calls into question existing theories that explain the formation of the ozone hole. The note details research which shows that the rate of photolysis of the chlorine monoxide dimer may be an order of magnitude lower than previously thought. Whilst this needs further investigation and verification by other groups, it does not invalidate previous work which shows an unequivocal link between the abundance of chlorine monoxide and ozone depletion. The news note does not mention bromine monoxide, which also plays a significant part in ozone depletion.
Click on a thumbnail to get the latest graph.
Halley - Total ozone:
Some lunar observations made in late July suggest that ozone levels were near
normal. The first zenith observations, of low 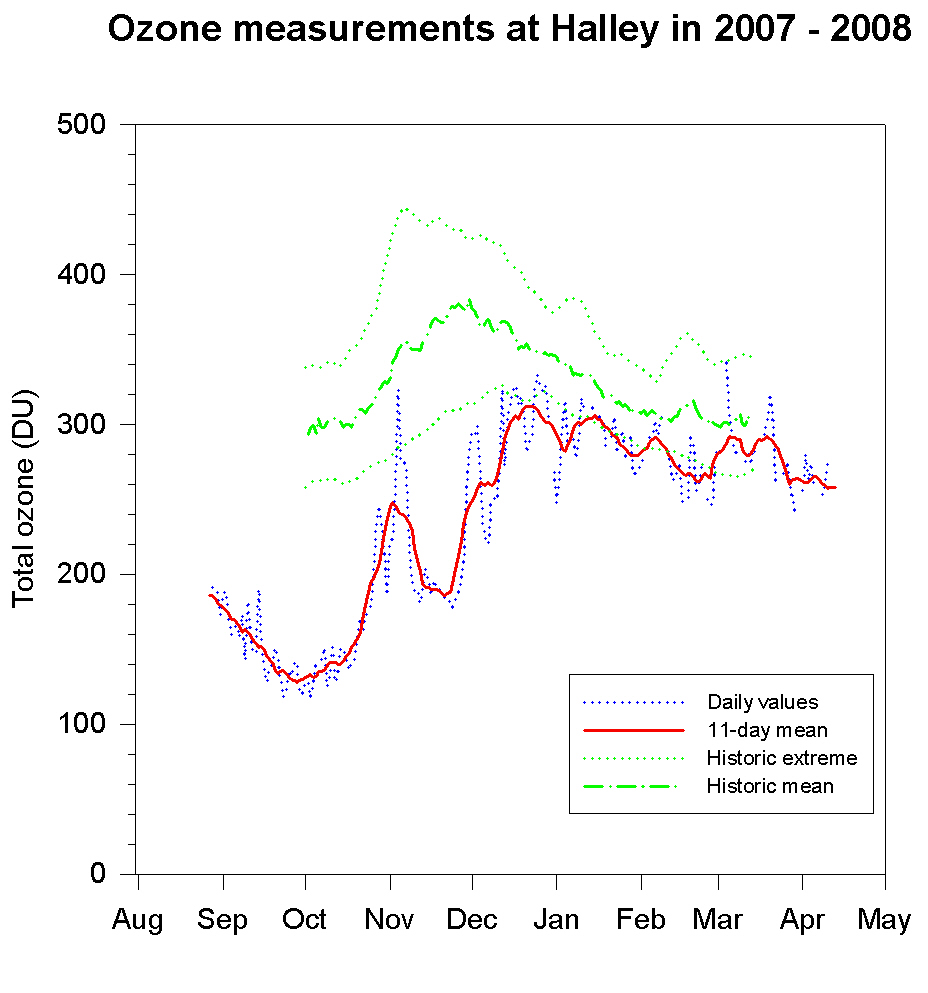 accuracy, made in late August show that mean ozone values were around
190 DU (35% depletion), and they had dropped to around 130 DU (55% depletion)
by the end of September. Mean values had risen to around 140 DU (55% depletion)
by mid October and then rose more quickly to reach 250 DU (25% depletion) by
early November. By mid month values had dropped back to 180 DU (50% depletion),
but had climbed to 260 DU (30% depletion) in early December. Values
again fell, with the daily value below 220 DU (40% depletion) on December 7,
however mean values then rose to a maximum of around 310 DU (10% depletion)
in mid month. Values slowly fell to the autumn minimum and had reached
260 DU (15% depletion) by mid April. Day to day variation rose when
the station was closer to the edge of the polar vortex. The lowest value
recorded was 118 DU on October 3. A daily mean of 323 DU was recorded
on November 4 and 333 DU on December 25. The ozone observation season
has now ended.
accuracy, made in late August show that mean ozone values were around
190 DU (35% depletion), and they had dropped to around 130 DU (55% depletion)
by the end of September. Mean values had risen to around 140 DU (55% depletion)
by mid October and then rose more quickly to reach 250 DU (25% depletion) by
early November. By mid month values had dropped back to 180 DU (50% depletion),
but had climbed to 260 DU (30% depletion) in early December. Values
again fell, with the daily value below 220 DU (40% depletion) on December 7,
however mean values then rose to a maximum of around 310 DU (10% depletion)
in mid month. Values slowly fell to the autumn minimum and had reached
260 DU (15% depletion) by mid April. Day to day variation rose when
the station was closer to the edge of the polar vortex. The lowest value
recorded was 118 DU on October 3. A daily mean of 323 DU was recorded
on November 4 and 333 DU on December 25. The ozone observation season
has now ended.
Rothera - Total ozone: At the
beginning of 2007 ozone values had commenced the decline to the autumn minimum
and reached around 250 DU in mid March. Daily values rose above 300 DU at the beginning of April,
but were generally around 270 DU until early June, with variation due to planetary
wave activity. Very low values were recorded in the second half of June,
falling below 220 DU at times. Values then rose as the mid latitude high
ozone belt extended further south, reaching over 360 DU in late July, before
falling to ozone hole levels by mid August. The station is often
near the edge region of the ozone hole and values can change dramatically from
one day to the next. Mean values dropped to around 120 DU in late September,
but then slowly rose, followed by a rapid rise to around 350 DU in late October.
By mid November they had dropped back to below 200 DU but thereafter rose to
reach summer values around 320 DU by the end of the month. Total ozone
levels then fell towards the autumn minimum, and had dropped to around 280 DU
at the end of 2007. The lowest value recorded was 102 DU on September
23. The new SAOZ became the operational instrument from January 1 and
produces real-time
graphs showing current ozone and NO2 levels. Values dropped a little,
with a broad autumnal minimum of around 270 DU between mid January and mid March.
Values rose a little to reach around 290 DU in early April. They are now
around 270 DU.
March. Daily values rose above 300 DU at the beginning of April,
but were generally around 270 DU until early June, with variation due to planetary
wave activity. Very low values were recorded in the second half of June,
falling below 220 DU at times. Values then rose as the mid latitude high
ozone belt extended further south, reaching over 360 DU in late July, before
falling to ozone hole levels by mid August. The station is often
near the edge region of the ozone hole and values can change dramatically from
one day to the next. Mean values dropped to around 120 DU in late September,
but then slowly rose, followed by a rapid rise to around 350 DU in late October.
By mid November they had dropped back to below 200 DU but thereafter rose to
reach summer values around 320 DU by the end of the month. Total ozone
levels then fell towards the autumn minimum, and had dropped to around 280 DU
at the end of 2007. The lowest value recorded was 102 DU on September
23. The new SAOZ became the operational instrument from January 1 and
produces real-time
graphs showing current ozone and NO2 levels. Values dropped a little,
with a broad autumnal minimum of around 270 DU between mid January and mid March.
Values rose a little to reach around 290 DU in early April. They are now
around 270 DU.
Vernadsky - Total ozone: 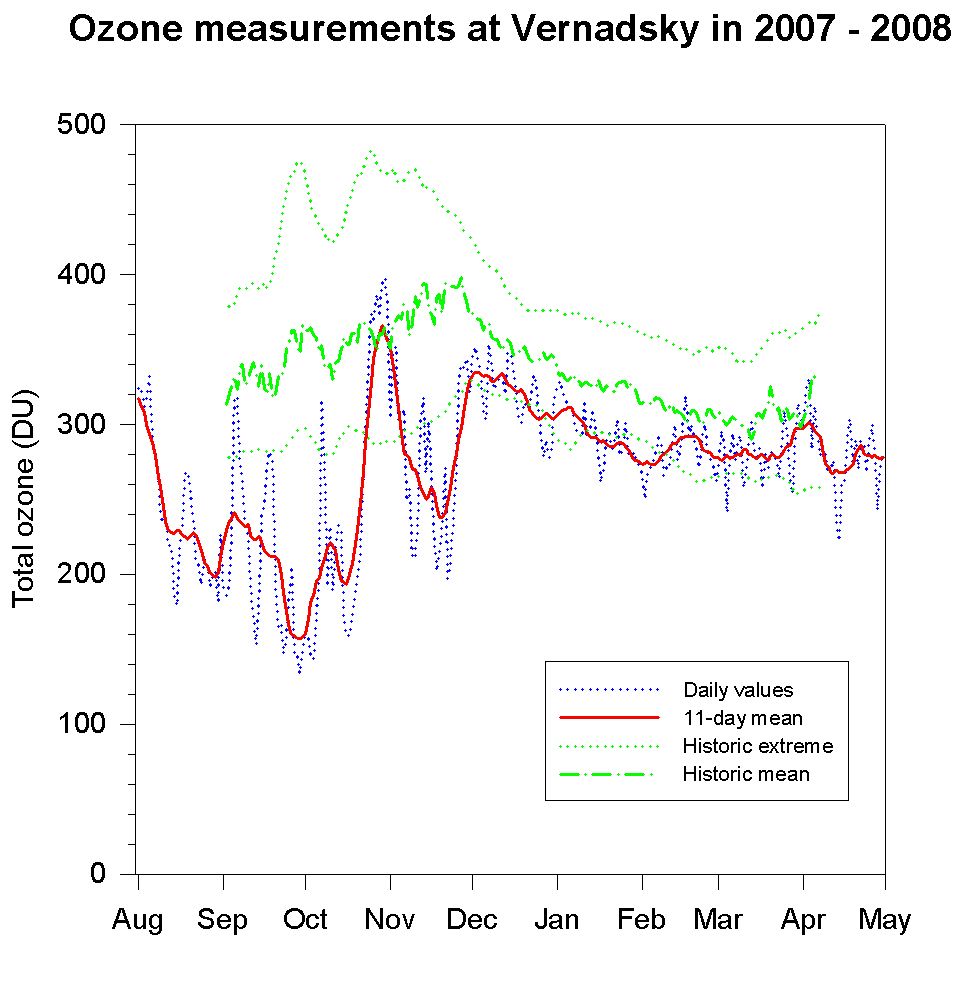 Vernadsky
station is run by the National Antarctic Scientific Centre of Ukraine.
Early observations showed that ozone levels rose at the end of July to reach
over 350 DU. By the beginning of August they had returned to near the
normal of 320 DU and were declining rapidly; they reached 200 DU (40% depletion)
by the end of the month. During the first week of September values rose
to 240 DU (25% depletion), with near normal values on some days, but dropped
during the rest of the month. Late in the month mean values bottomed out
at around 160 DU (50% depletion). In early November they had risen to
around 370 DU, close to the normal for this time of year, however they dropped
back to 240 DU (40% depletion) in the second half of the month, before rising
to summer values around 330 DU (10% depletion) at the end of the month.
By late March they were near the autumn minimum, at around 280 DU (10% depletion),
and remained around this level into May. The lowest
daily value was 134 DU on September 29. The station is often near the
edge region of the ozone hole and values can change dramatically from one day
to the next.
Vernadsky
station is run by the National Antarctic Scientific Centre of Ukraine.
Early observations showed that ozone levels rose at the end of July to reach
over 350 DU. By the beginning of August they had returned to near the
normal of 320 DU and were declining rapidly; they reached 200 DU (40% depletion)
by the end of the month. During the first week of September values rose
to 240 DU (25% depletion), with near normal values on some days, but dropped
during the rest of the month. Late in the month mean values bottomed out
at around 160 DU (50% depletion). In early November they had risen to
around 370 DU, close to the normal for this time of year, however they dropped
back to 240 DU (40% depletion) in the second half of the month, before rising
to summer values around 330 DU (10% depletion) at the end of the month.
By late March they were near the autumn minimum, at around 280 DU (10% depletion),
and remained around this level into May. The lowest
daily value was 134 DU on September 29. The station is often near the
edge region of the ozone hole and values can change dramatically from one day
to the next.
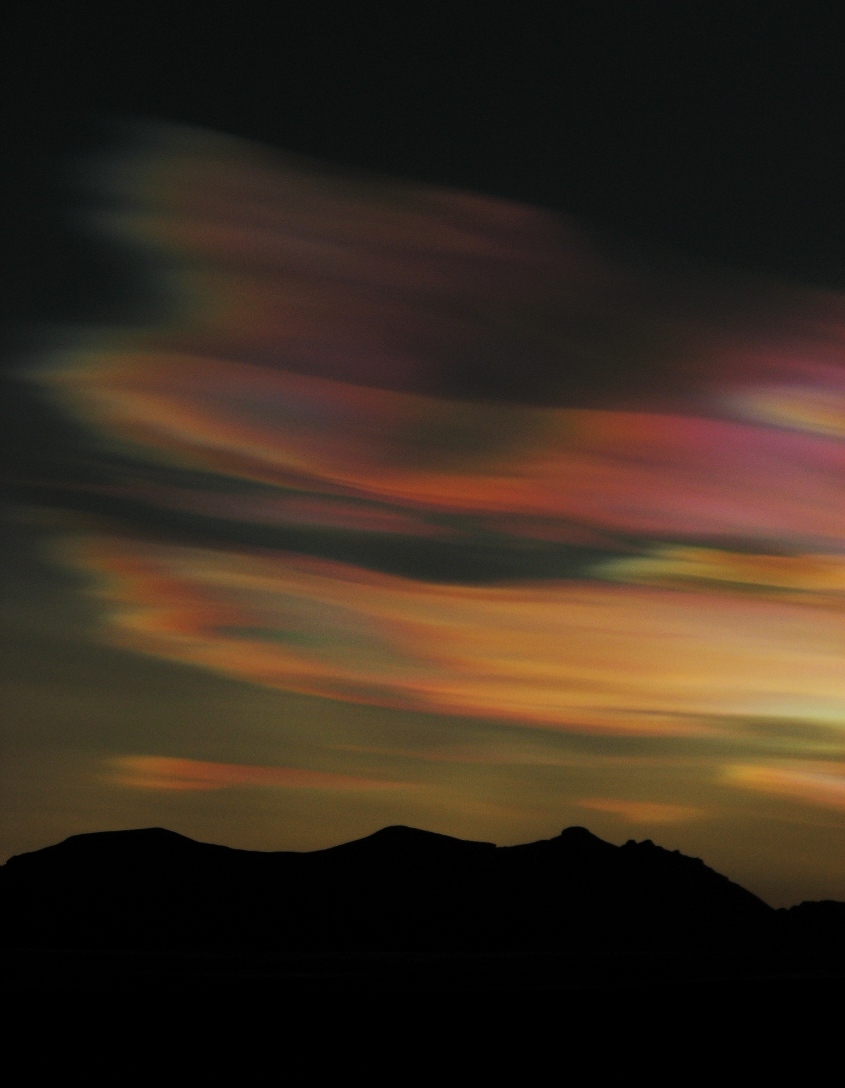
 Temperature
and PSCs: The 100 hPa pressure level is near the base of
the ozone layer, but is reached by most radiosonde flights. The
temperature at this height is sufficiently cold from July to October that polar
stratospheric clouds (PSCs) can form. Rothera saw this
spectacular display of these clouds on 2007 July 12, and also so them on August 12,
14, 15 and 17. The Antarctic stratosphere
temperature is now cooling and PSCs have already formed, as is shown in
this time lapse sequence taken
by Rob Webster at Rothera on June 3.
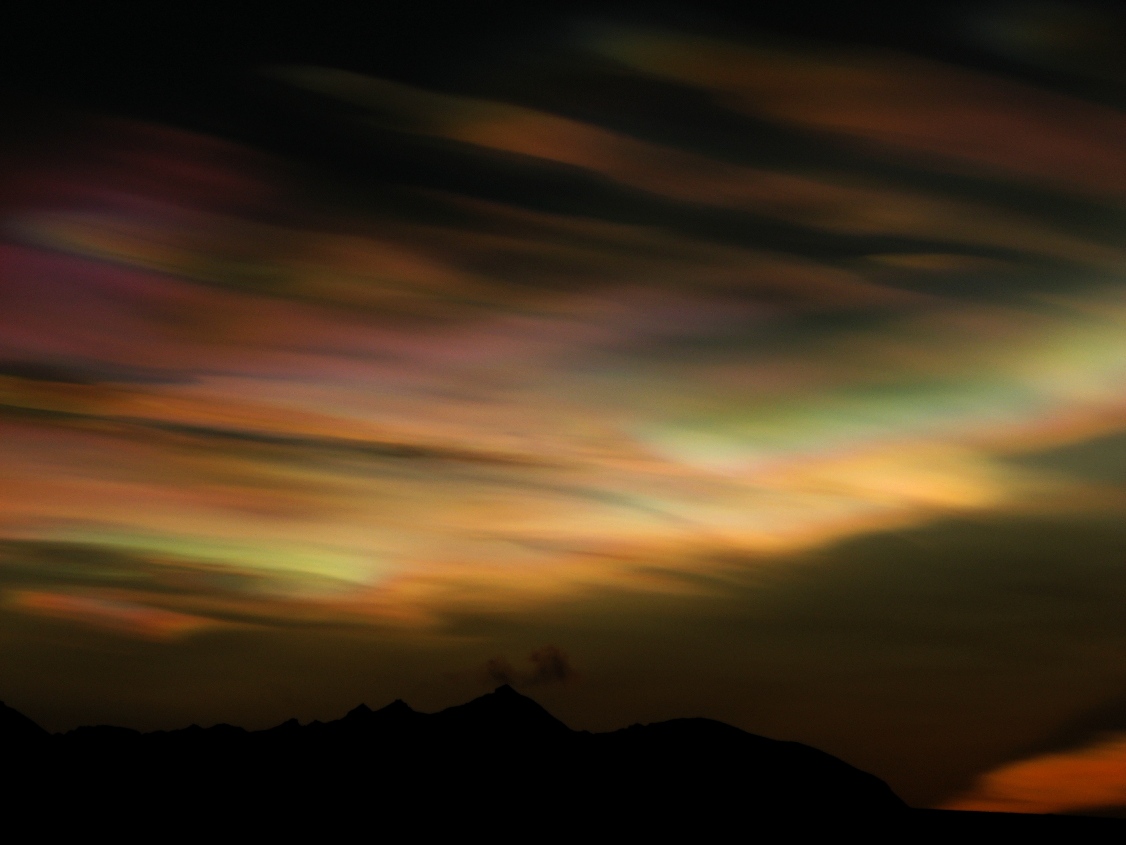
Temperature
and PSCs: The 100 hPa pressure level is near the base of
the ozone layer, but is reached by most radiosonde flights. The
temperature at this height is sufficiently cold from July to October that polar
stratospheric clouds (PSCs) can form. Rothera saw this
spectacular display of these clouds on 2007 July 12, and also so them on August 12,
14, 15 and 17. The Antarctic stratosphere
temperature is now cooling and PSCs have already formed, as is shown in
this time lapse sequence taken
by Rob Webster at Rothera on June 3.
Halley - 100 hPa temperature: 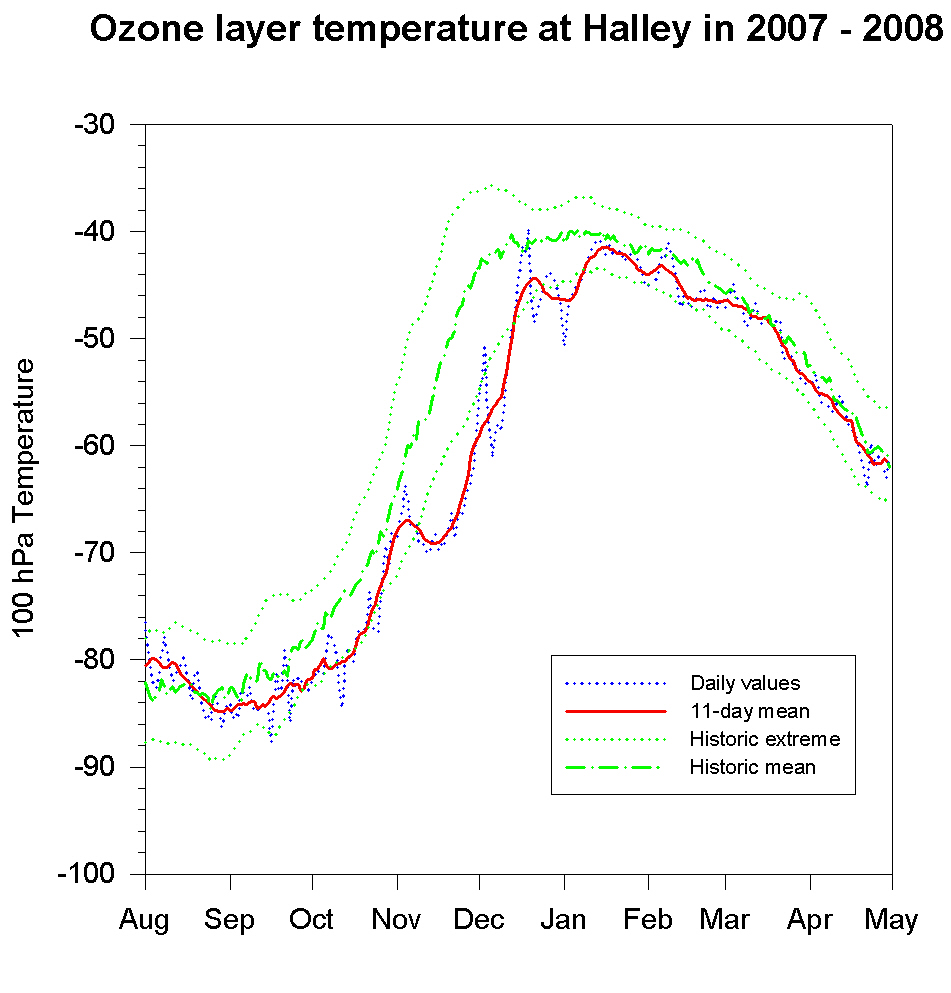 The
100 hPa temperature at Halley reached the late winter minimum at around -85°C
in late August and then rose slowly to reach -80°C in mid October. More
rapid warming then took place, and the temperature had reached -66°C by early
November, but then fell back to -70° by mid month. After that, the temperature
generally rose to a peak of -44°C in mid December, but then dropped and was
significantly below the normal into the new year. Maximum temperatures
of around -42°C were reached in mid January, and since then slow cooling has
taken place, reaching -61°C by the end of April. In general the temperature
has remained a little below the normal.
The
100 hPa temperature at Halley reached the late winter minimum at around -85°C
in late August and then rose slowly to reach -80°C in mid October. More
rapid warming then took place, and the temperature had reached -66°C by early
November, but then fell back to -70° by mid month. After that, the temperature
generally rose to a peak of -44°C in mid December, but then dropped and was
significantly below the normal into the new year. Maximum temperatures
of around -42°C were reached in mid January, and since then slow cooling has
taken place, reaching -61°C by the end of April. In general the temperature
has remained a little below the normal.
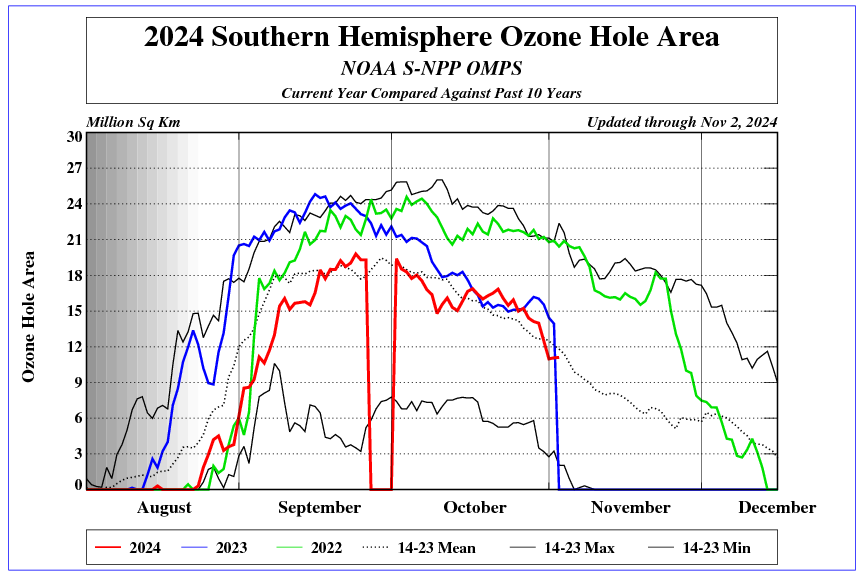
Satellite: Satellite
imagery gives a global perspective on the ozone hole. In general the
2007 ozone hole has been close to the average of the last decade. Our
2007/2008 Antarctic ozone hole movie [updated
2008 July 4] is produced from OMI images, which are generally well calibrated
with respect to ground based measurements. The NCEP and KNMI analyses
shown on the Canadian
Met Service daily ozone maps pages give a good analysis in the Southern
Hemisphere, although the KNMI model is generally better at forecasting.
The SMOBA and TOAST analyses both use SBUV and TOVS data, but the TOAST algorithm
frequently over-estimates ozone depletion. US NWS CPC
plots from NOAA show the current
area of the ozone hole. The Sciamachy uv
index from the ESA Tropospheric Emission Monitoring Internet Service
shows the exposure risk at any location. Arctic: Temperatures
were occasionally below the PSC threshold in January and February 2008.
A small ozone hole was over the UK between February 17 and 21. Ozone values
across much of the northern hemisphere are above 300 DU. Ozone values over the
Arctic during 2007/8 are shown in our Northern Hemisphere TOMS movie. For more
UK information see the DEFRA UK
Stratospheric Ozone Measurements page. Reports of a substantial Arctic ozone
hole forming in response to a solar proton event in the spring of 2004 are somewhat
exaggerated. Although this did lead to substantial depletion of up to
60% near the top of the ozone layer, less than 10% of the total ozone column
is in this region. The event therefore had less effect than normal day
to day changes and no ozone hole was formed. The spring of 2005 by contrast
had much lower stratospheric temperatures and significant chemical ozone depletion
did take place. Although the column ozone never quite dropped to "ozone
hole" levels, the amount of ozone affected by chemical depletion was broadly
comparable to that seen in the Antarctic ozone hole. Equator: Ozone
levels are normally lowest over the topics and OMI data shows nothing unusual. Measurements reported here refer
to ozone in the "ozone layer", where most of the ozone in the atmosphere
is found. This "layer" stretches from roughly 10 to 40km above
the Earth's surface, with a peak at around 20km. Bringing all the ozone
in the "layer" down to ground level would give a thickness of around
3cm of pure ozone, which reduces to around 1cm at the height of the ozone hole.
A little ozone also exists closer to the Earth's surface and recent
research shows that natural halogens in Antarctica can produce depletion
in this near surface layer. The BAS ozone
bulletins contained the actual ozone values reported together with an analysis
of the situation. These were distributed by email on request, but are now superceded
by this web site. The last ozone bulletin
was issued on 2002 May 28. The final situation report
of each season is archived for historical reference. Some data is available on line, however
please note that this is provisional and likely to change without warning. To
help interpret the data you should to read this metadata
description [updated 2008 March 20]. You must request permission to reproduce
the data and I may be able to supply more suitable or more up to date material.
If data from Halley is used you must give the station name as Halley;
Halley Bay was a geographical feature that no longer exists. Provisional daily mean ozone
values for 2007/2008 for Halley
[Updated 2008 May 2] and Vernadsky. [Updated 2008 May 27] Temperature
and Ozone graphs for Halley and Vernadsky/Faraday. [Updated 2008 April 11].
The historic period shown in the inline graphs is for 1957 - 1972. Stratospheric Temperature
Rothera - Ozonesondes:
During 2003 we carried out ozone sonde flights at Rothera as part of the
QUOBI project. Data from these flights
is available in NASA-AMES format. Animation
of the ozonesonde flight results [note that although the ozone scale on these
graphs reads nanobars, it should read mPa]. Rothera - Ozone & nitrogen
dioxide: Some background information on Halley,
Rothera
and Faraday
stations is available from BAS. Information about Vernadsky station is also available
from the Ukrainian Antarctic Centre. Information about Vladimir Ivanovich
Vernadsky Some surface and upper air synoptic
data is also available on line from our public
data page. Southern Hemisphere ozone
hole movies for 1997/1998 , 1998/1999
, 1999/2000 , 2000/2001
, 2001/2002 , 2002/2003
, 2003/2004 , 2004/2005
, 2005 [TOMS], 2005/2006,
2006/2007 and 2007/2008
[OMI, updated 2008 July 4]. A short sequence of the 2001
ozone hole. Requests for permission to use this data or for further
information should be sent to Jon Shanklin who maintains
these pages.
© Copyright Natural Environment Research Council - British Antarctic Survey
2008
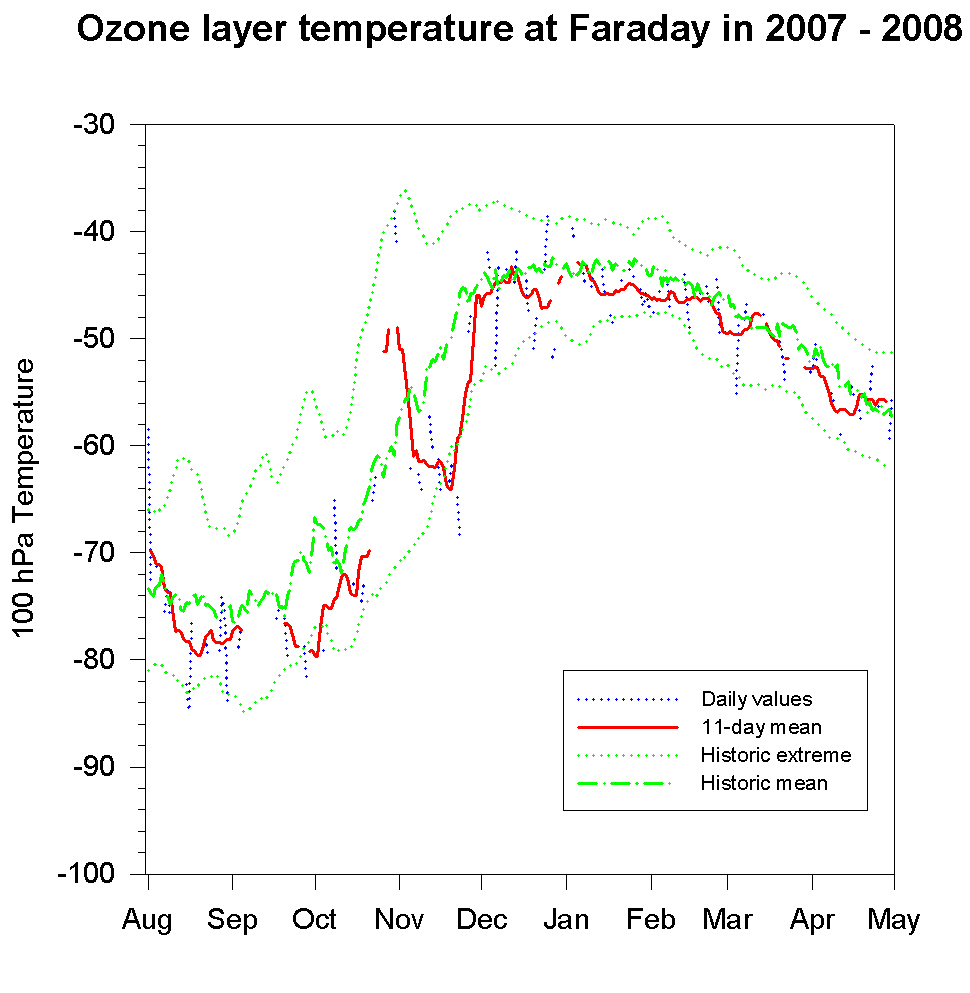
Peninsula - 100 hPa temperature: The 100 hPa temperature in the
Antarctic Peninsula area reached minimum values below -80°C during August, September
and early October. The temperature rose rapidly in late October to well
above the normal in a relatively early spring warming event. As the vortex
relaxed to a more circular form temperatures fell and in mid November were significantly
below the seasonal normal of -52°C, but recovered by the end of the month
to near normal values around -45°C, where they remained into the New Year.
The temperature is now slowly falling, and was around -56°C
at the end of
April.
In general the temperature has been a little below the normal over the past three
months.
Background and related material
Ozone bulletins
Ozone data
Provisional daily mean ozone values for Faraday/Vernadsky and Halley between 1972 and 2007. [Updated 2007 May 25]
Provisional monthly mean ozone values for Faraday/Vernadsky and Halley between 1956 and 2007.
Mean daily ozone values for the period 1957 - 1972 for Faraday
and Halley. [NB: not corrected to Bass-Pauer]
Daily ozone values for the period 1957 - 1973 for Faraday and Halley. [Revised to Bass-Pauer]
Monthly 100 hPa temperature means for The Antarctic Peninsula and Halley
between 1954 and 2008. [Updated 2008 May 7]
SAOZ total column nitrogen dioxide and ozone: 1996,
1997, 1998, 1999,
2000, 2001, 2002,
2003, 2004, 2005,
2006, 2007 and 2008
[to 2008 January 22].
"New" SAOZ total column nitrogen dioxide and ozone:
2008 [updated 2008 July 4] and as real-time
graphs showing current ozone and NO2 levels.
Bentham ozone. Provisional values for 1997
/ 1998 / 1999 / 2000
/ 2001 / 2003 /
2004 [updated 2004 November 5 ].
Northern Hemisphere movies for 2000/2001 , 2001/2002
, 2002/2003 , 2003/2004
, 2004/2005 , 2005
[TOMS], 2005/2006, 2006/2007
and 2007/2008 [OMI updated 2008 July 4]
A short sequence of ozone depletion during the 2002/03
northern winter showing the difference from the normal.
These annual movies are now about 4Mb and were compiled from daily TOMS images until the end of 2005; from
2005/06 they are compiled from OMI images. The movies begin and end in June.
Today's
OMI global image
The current
area of the hole and other
latest details are available from the NOAA Climate Prediction Center.
Environment Canada have an excellent set of daily
maps showing both northern and southern ozone levels from a variety of sources.
The Sciamachy uv index
from the ESA Tropospheric Emission Monitoring Internet Service.
Note that west longitude is negative when entering co-ordinates.
Contacts