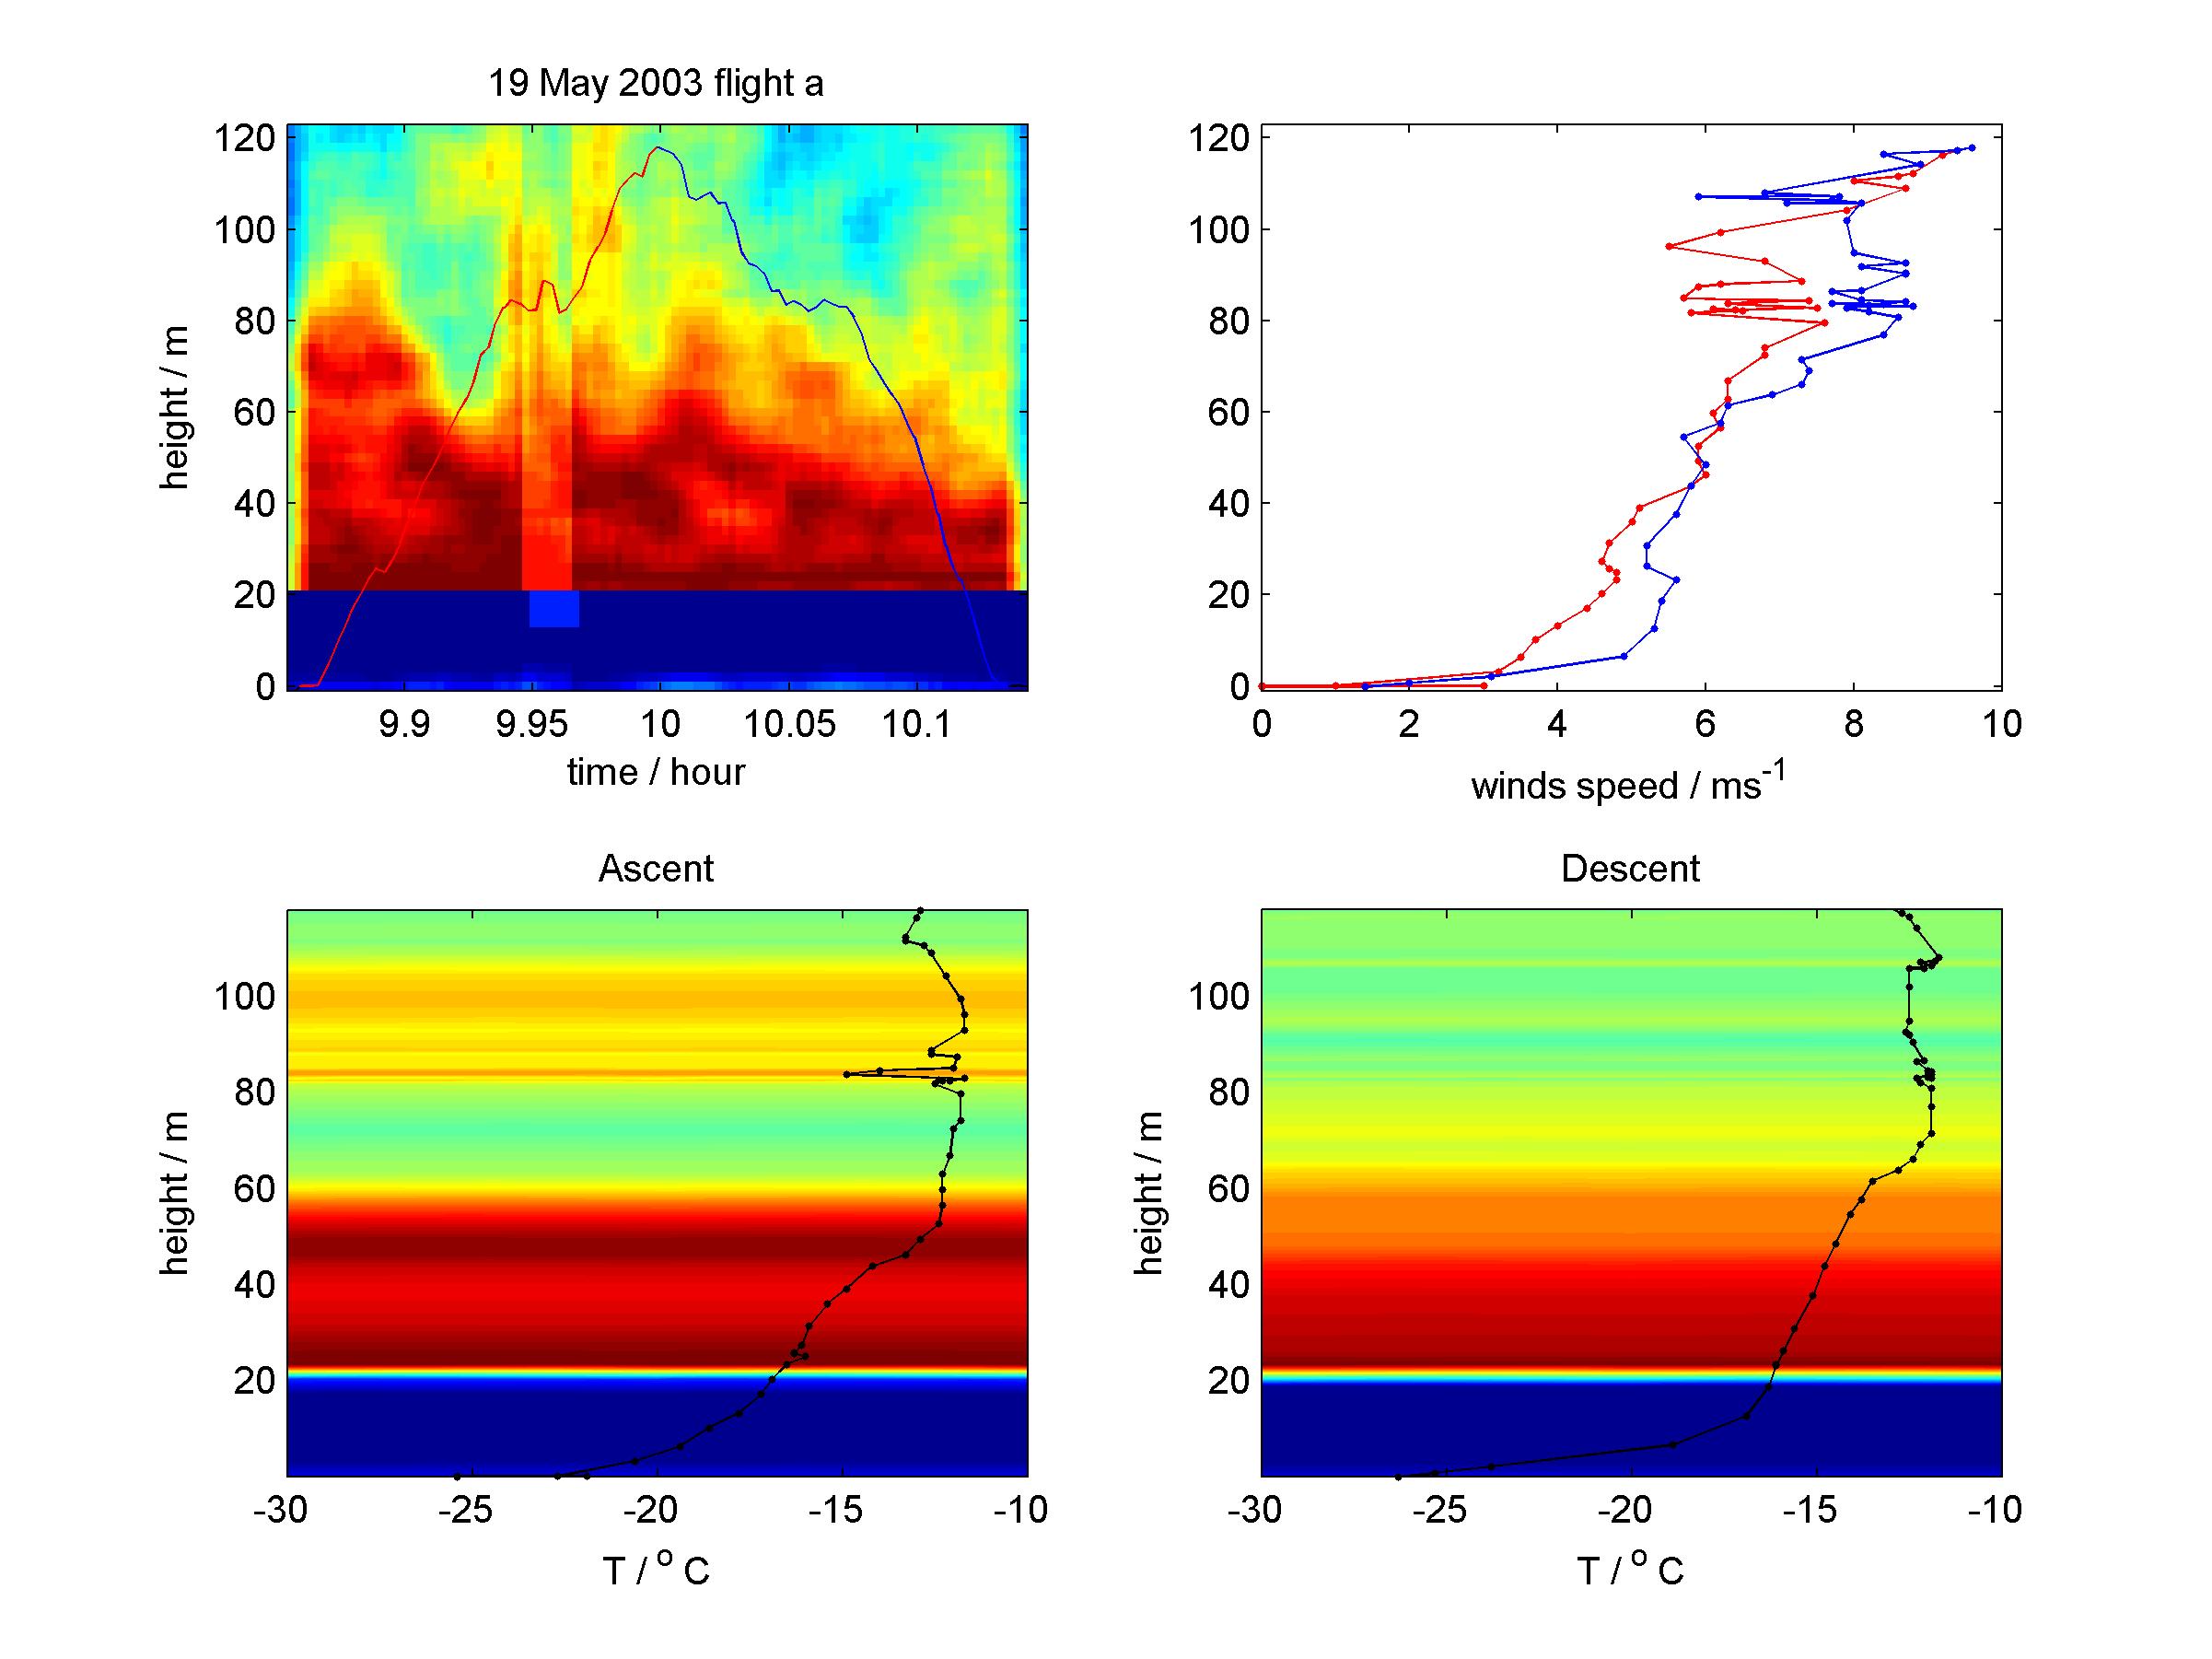
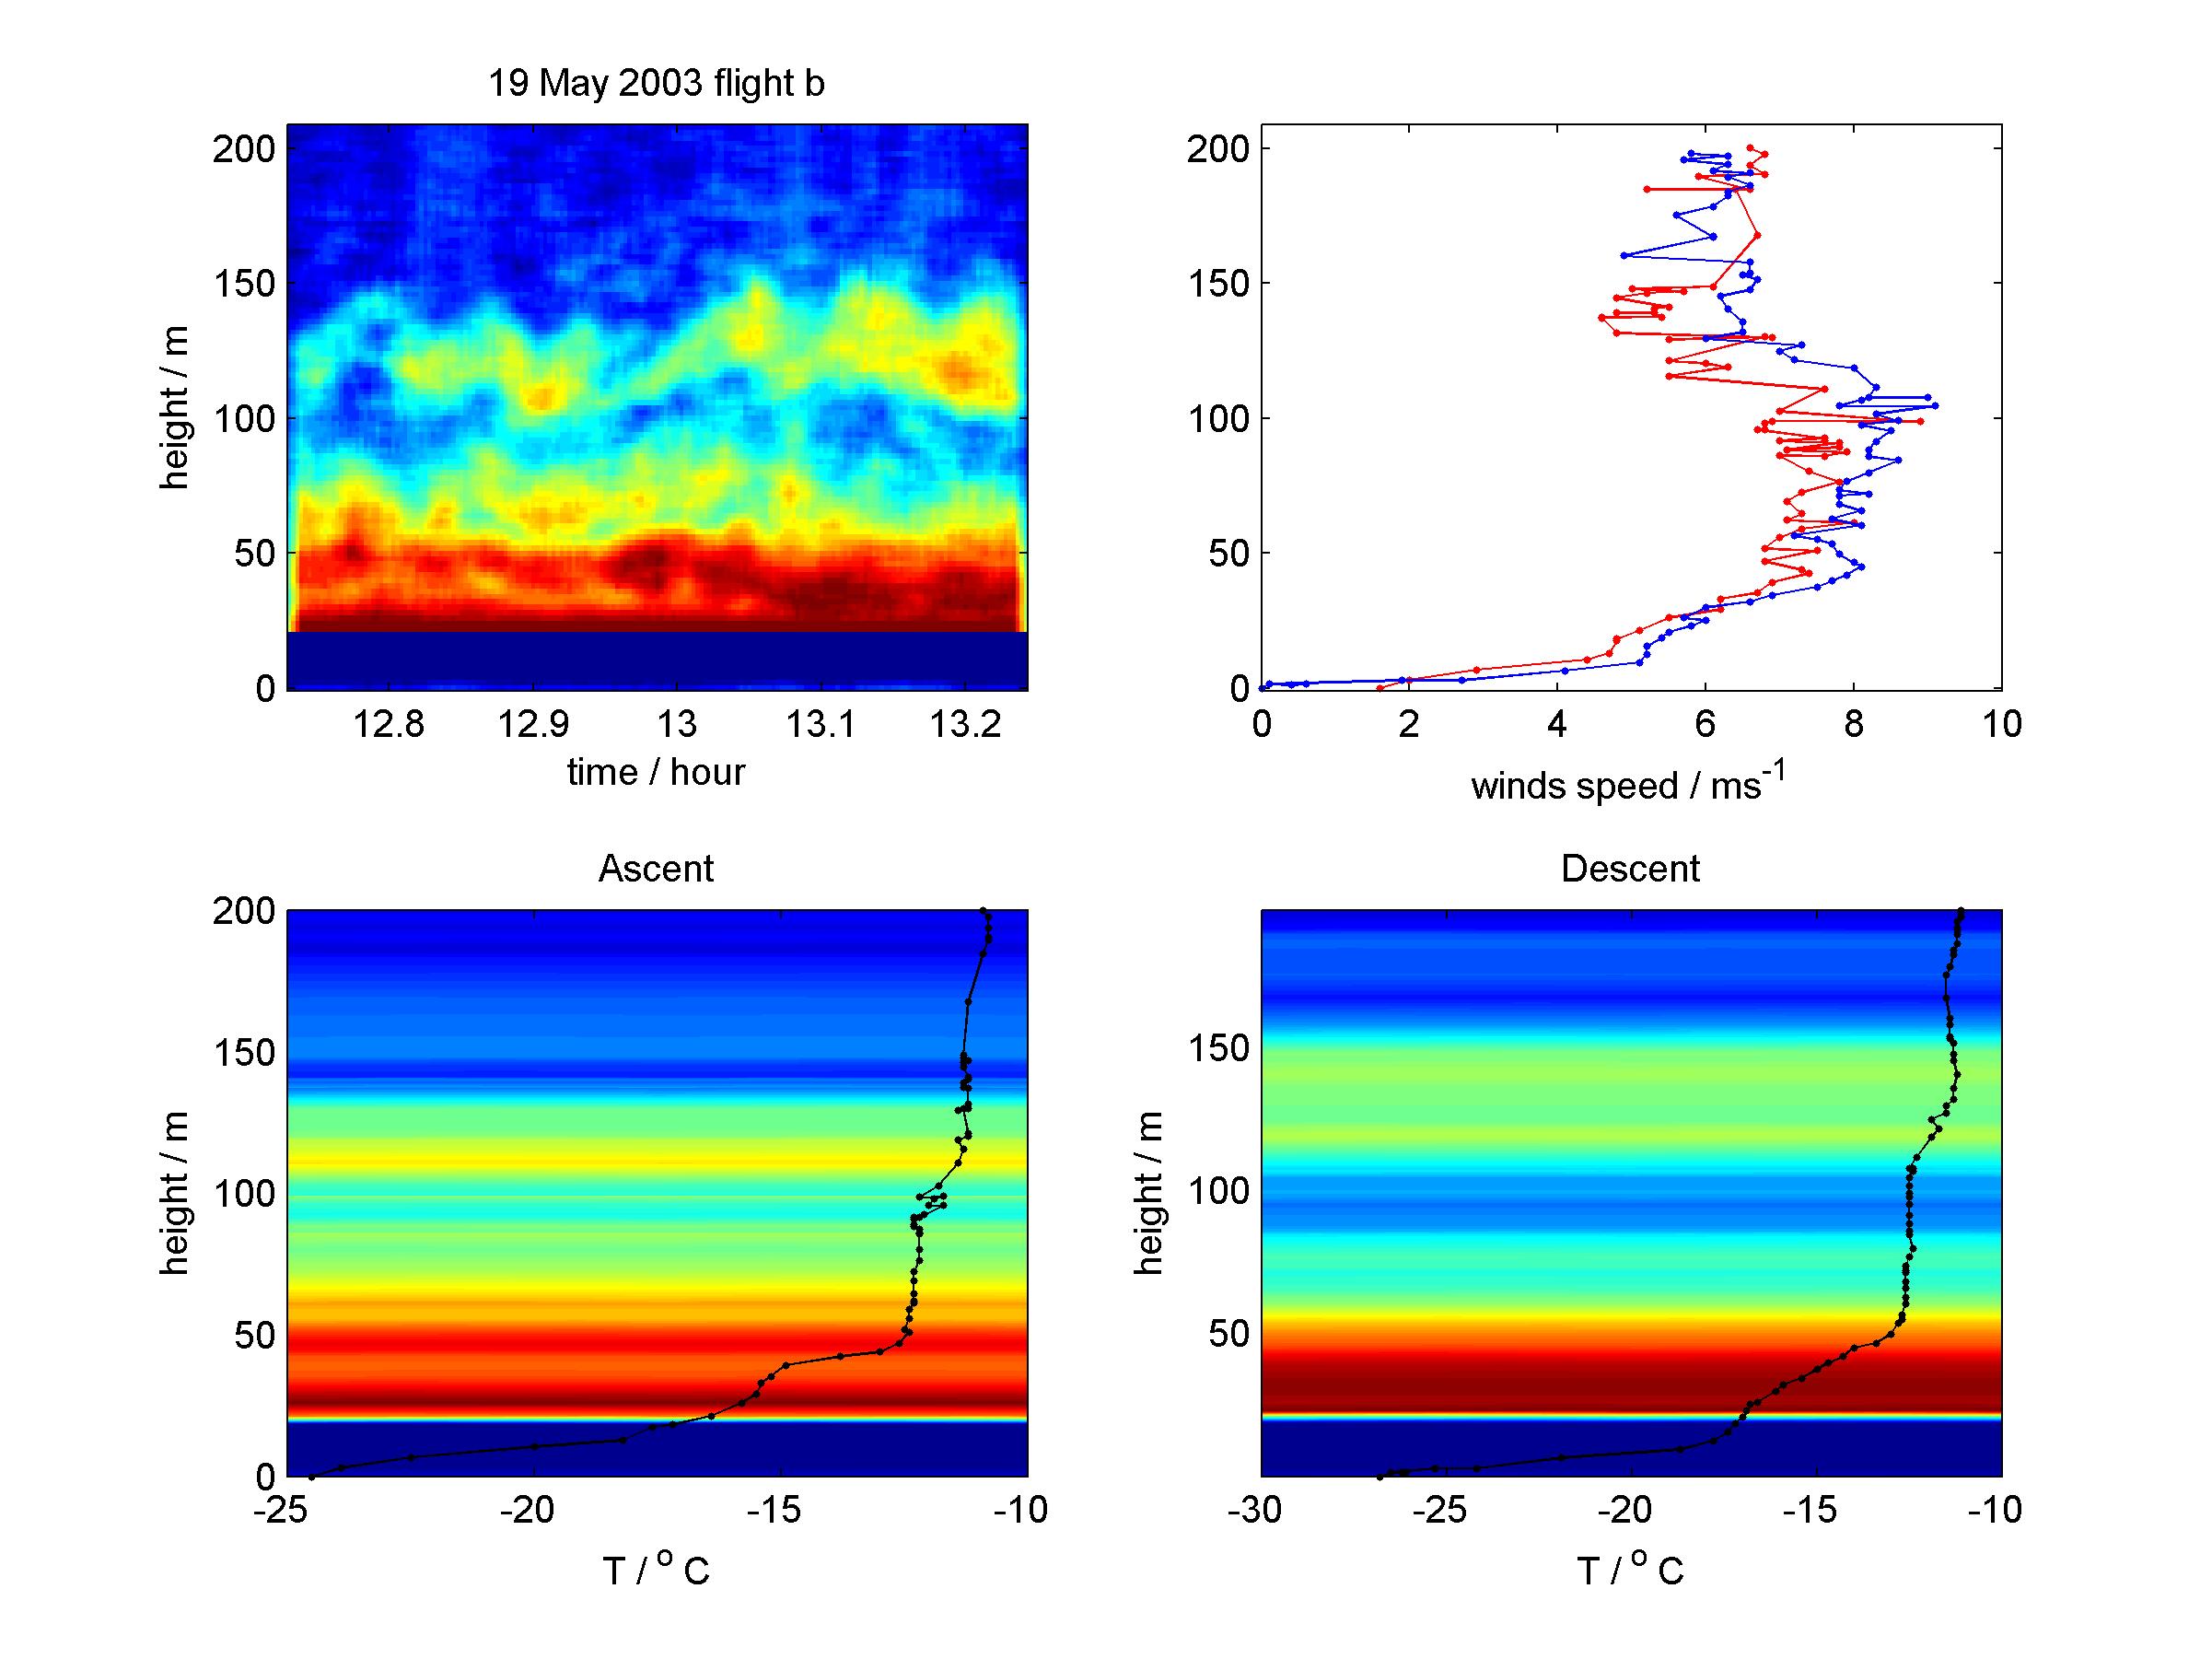
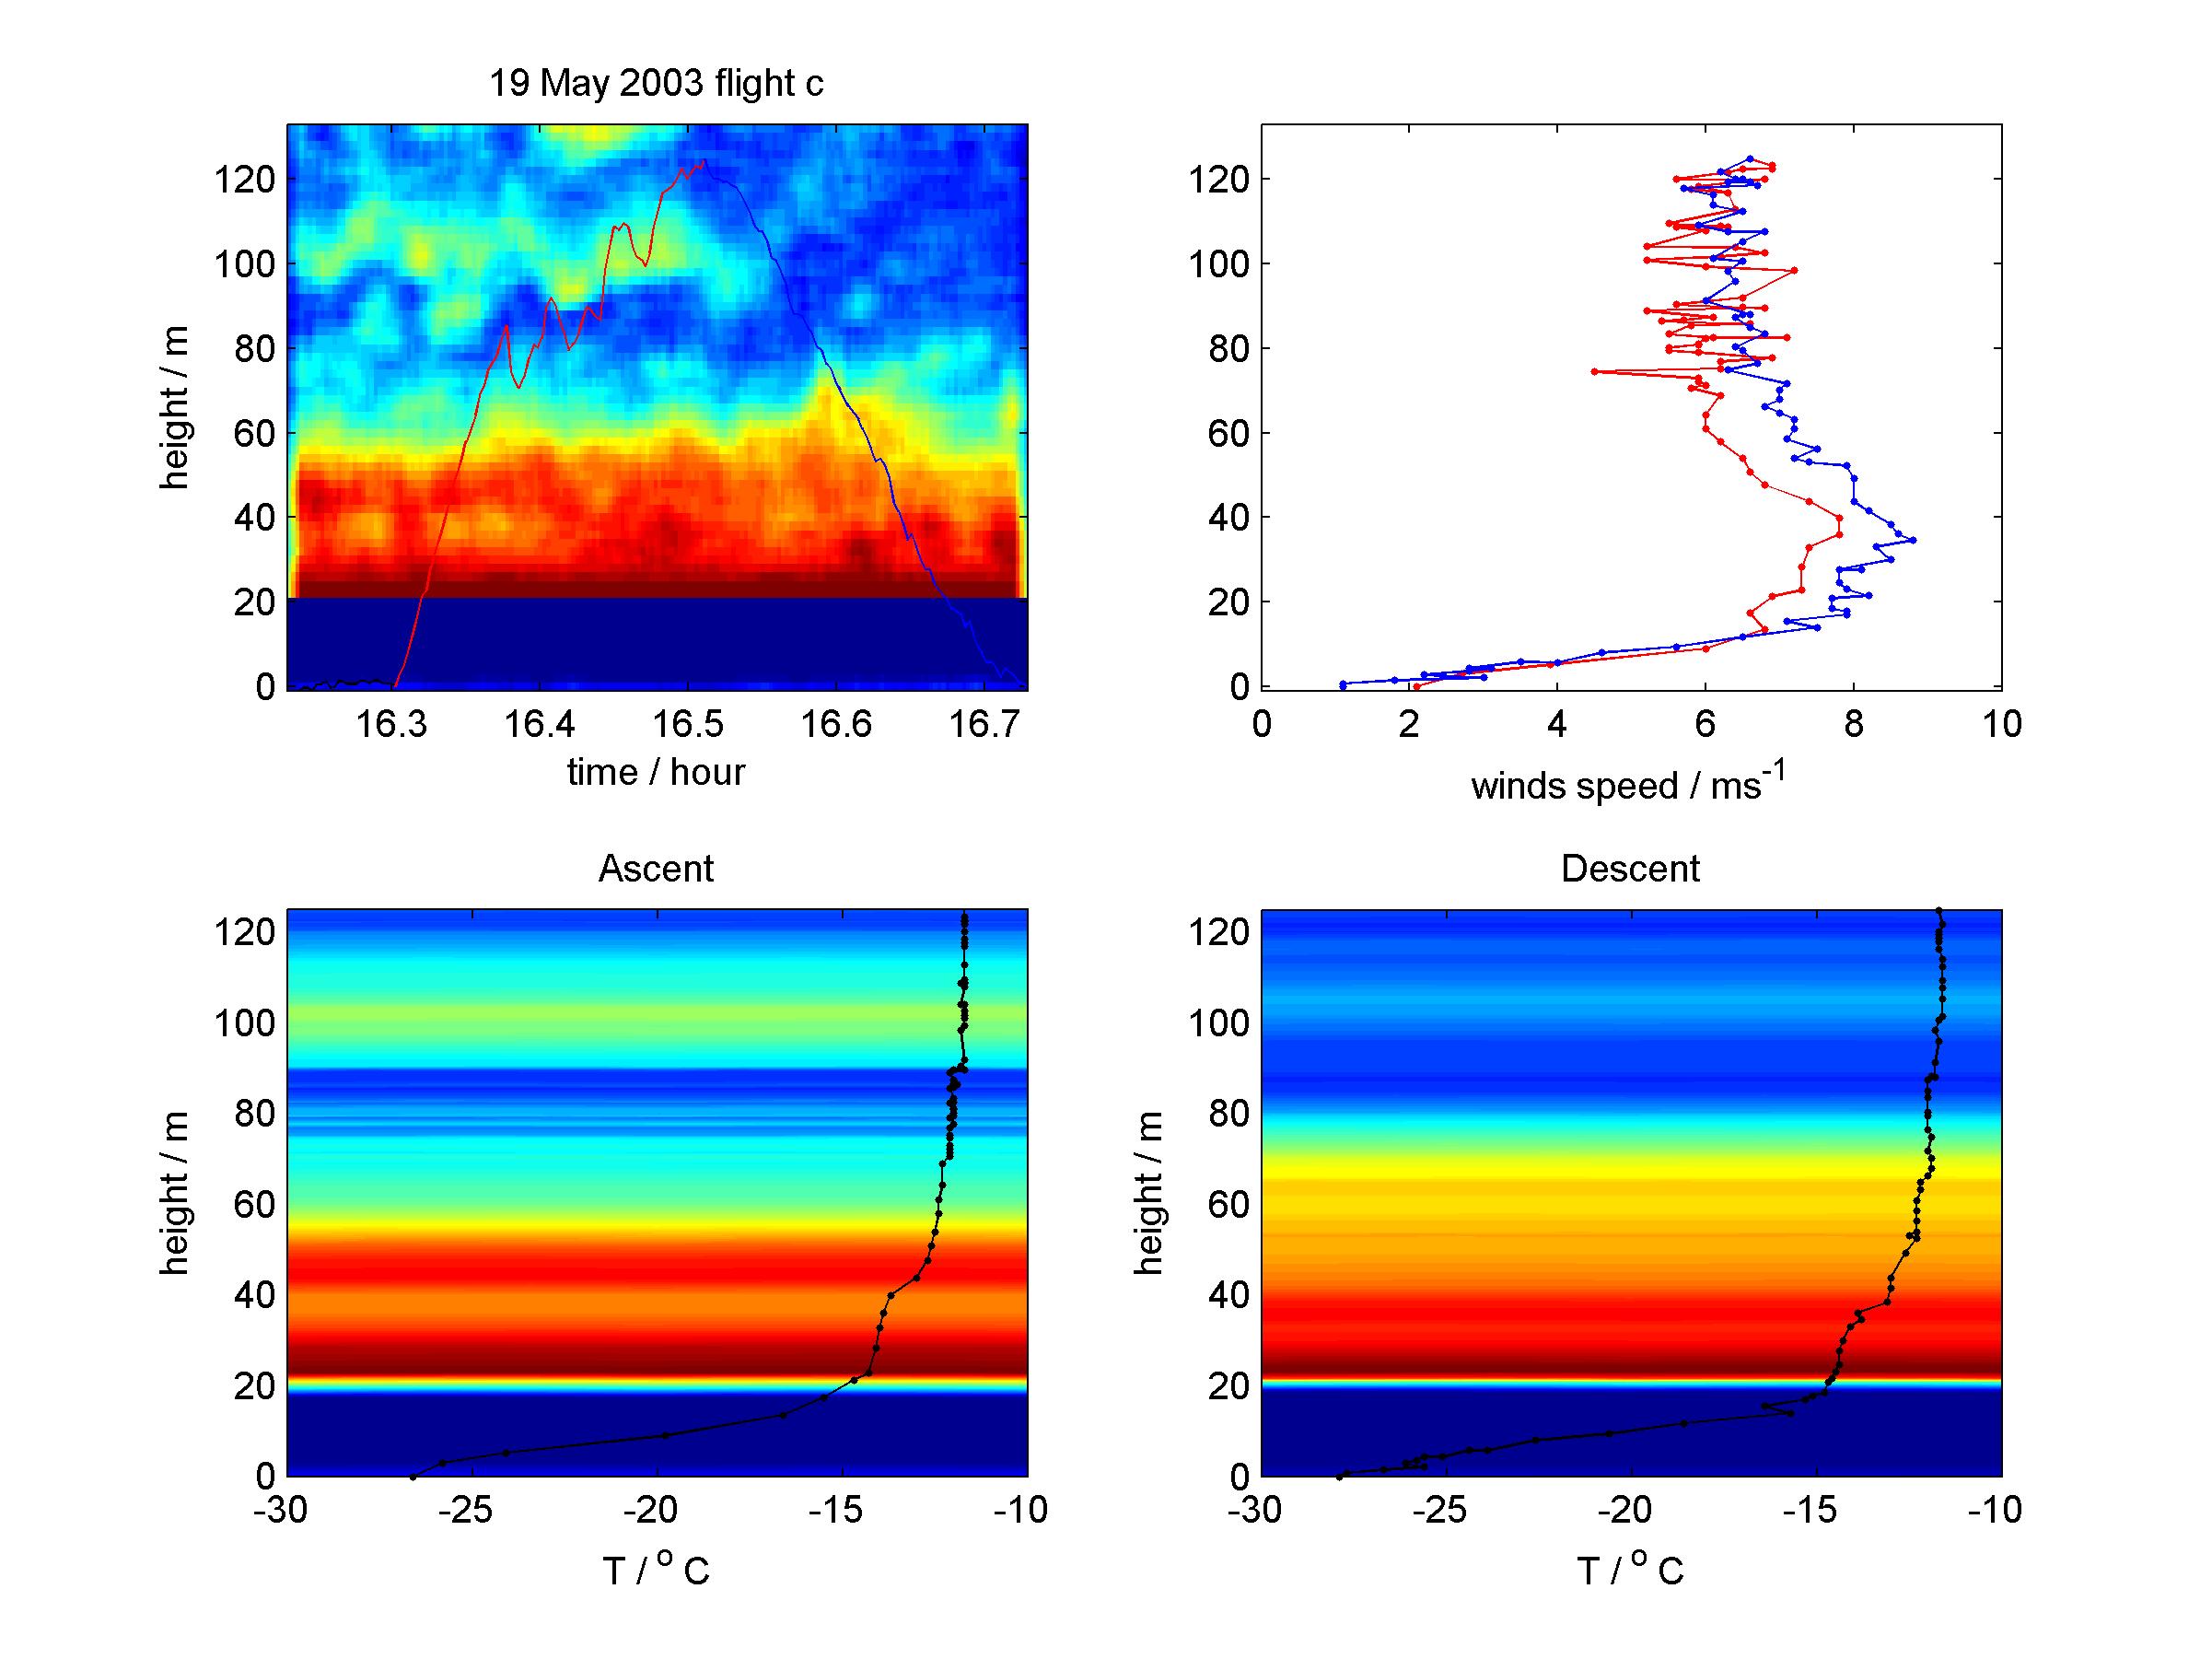
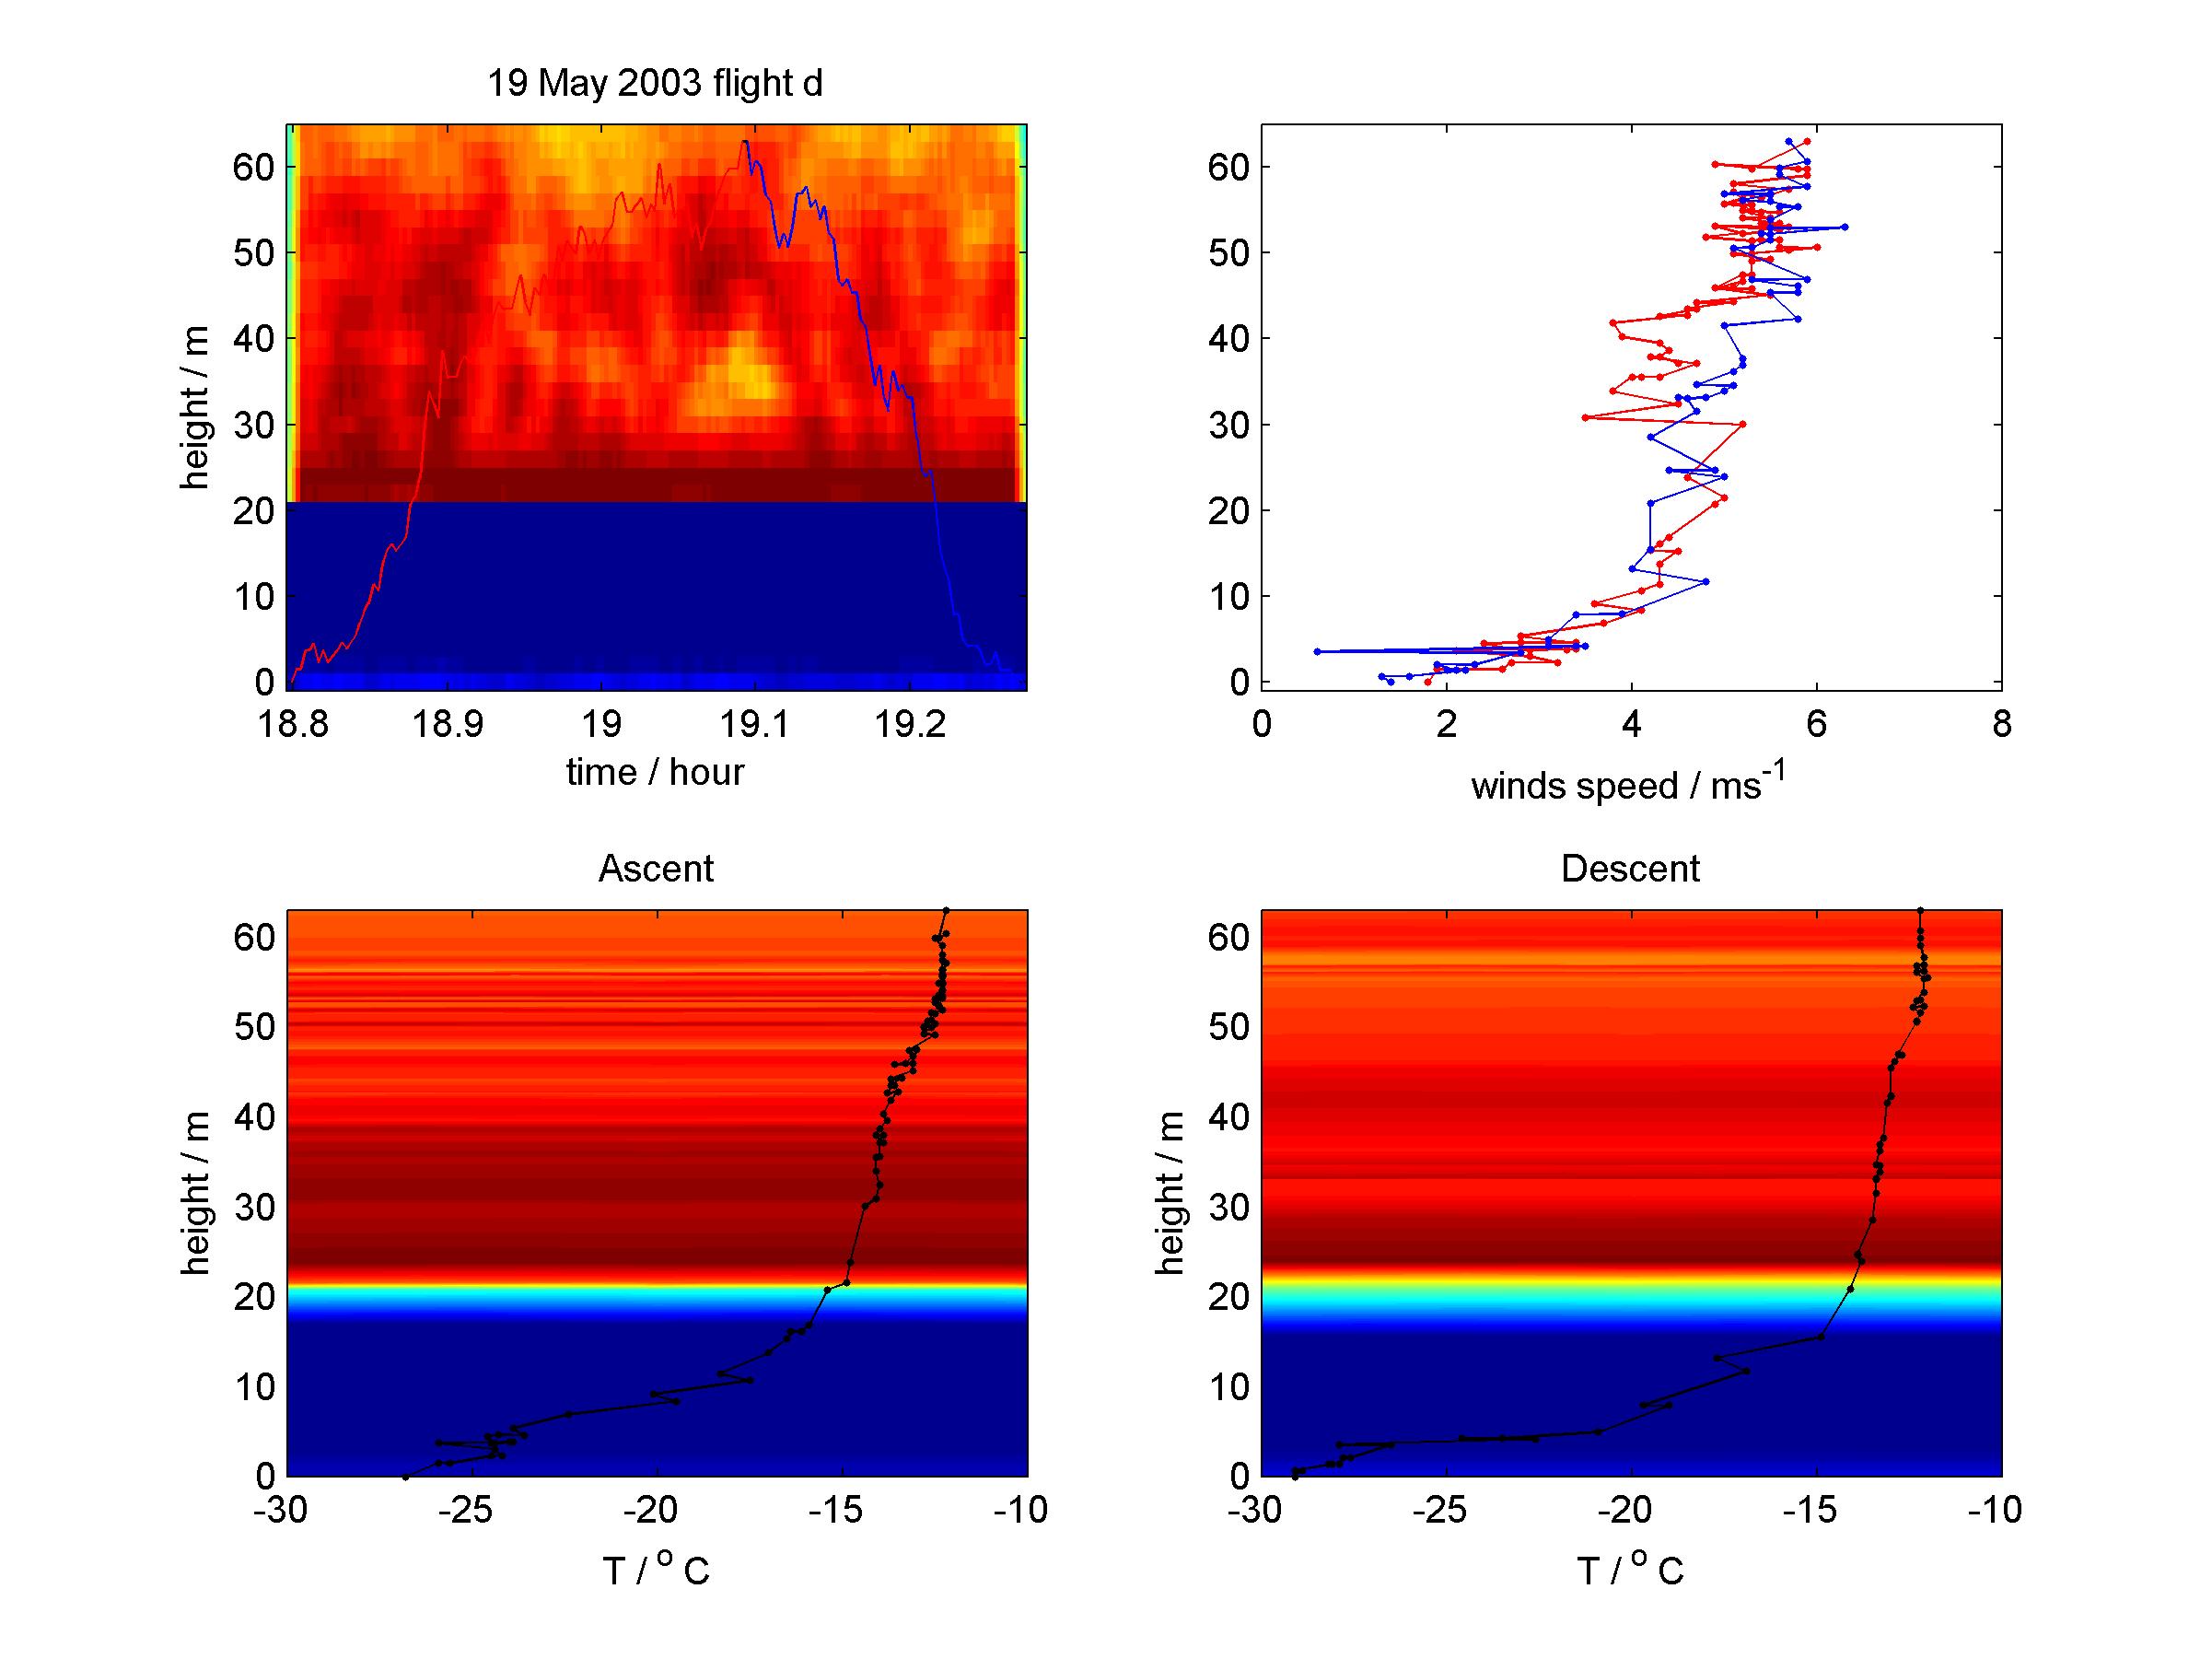
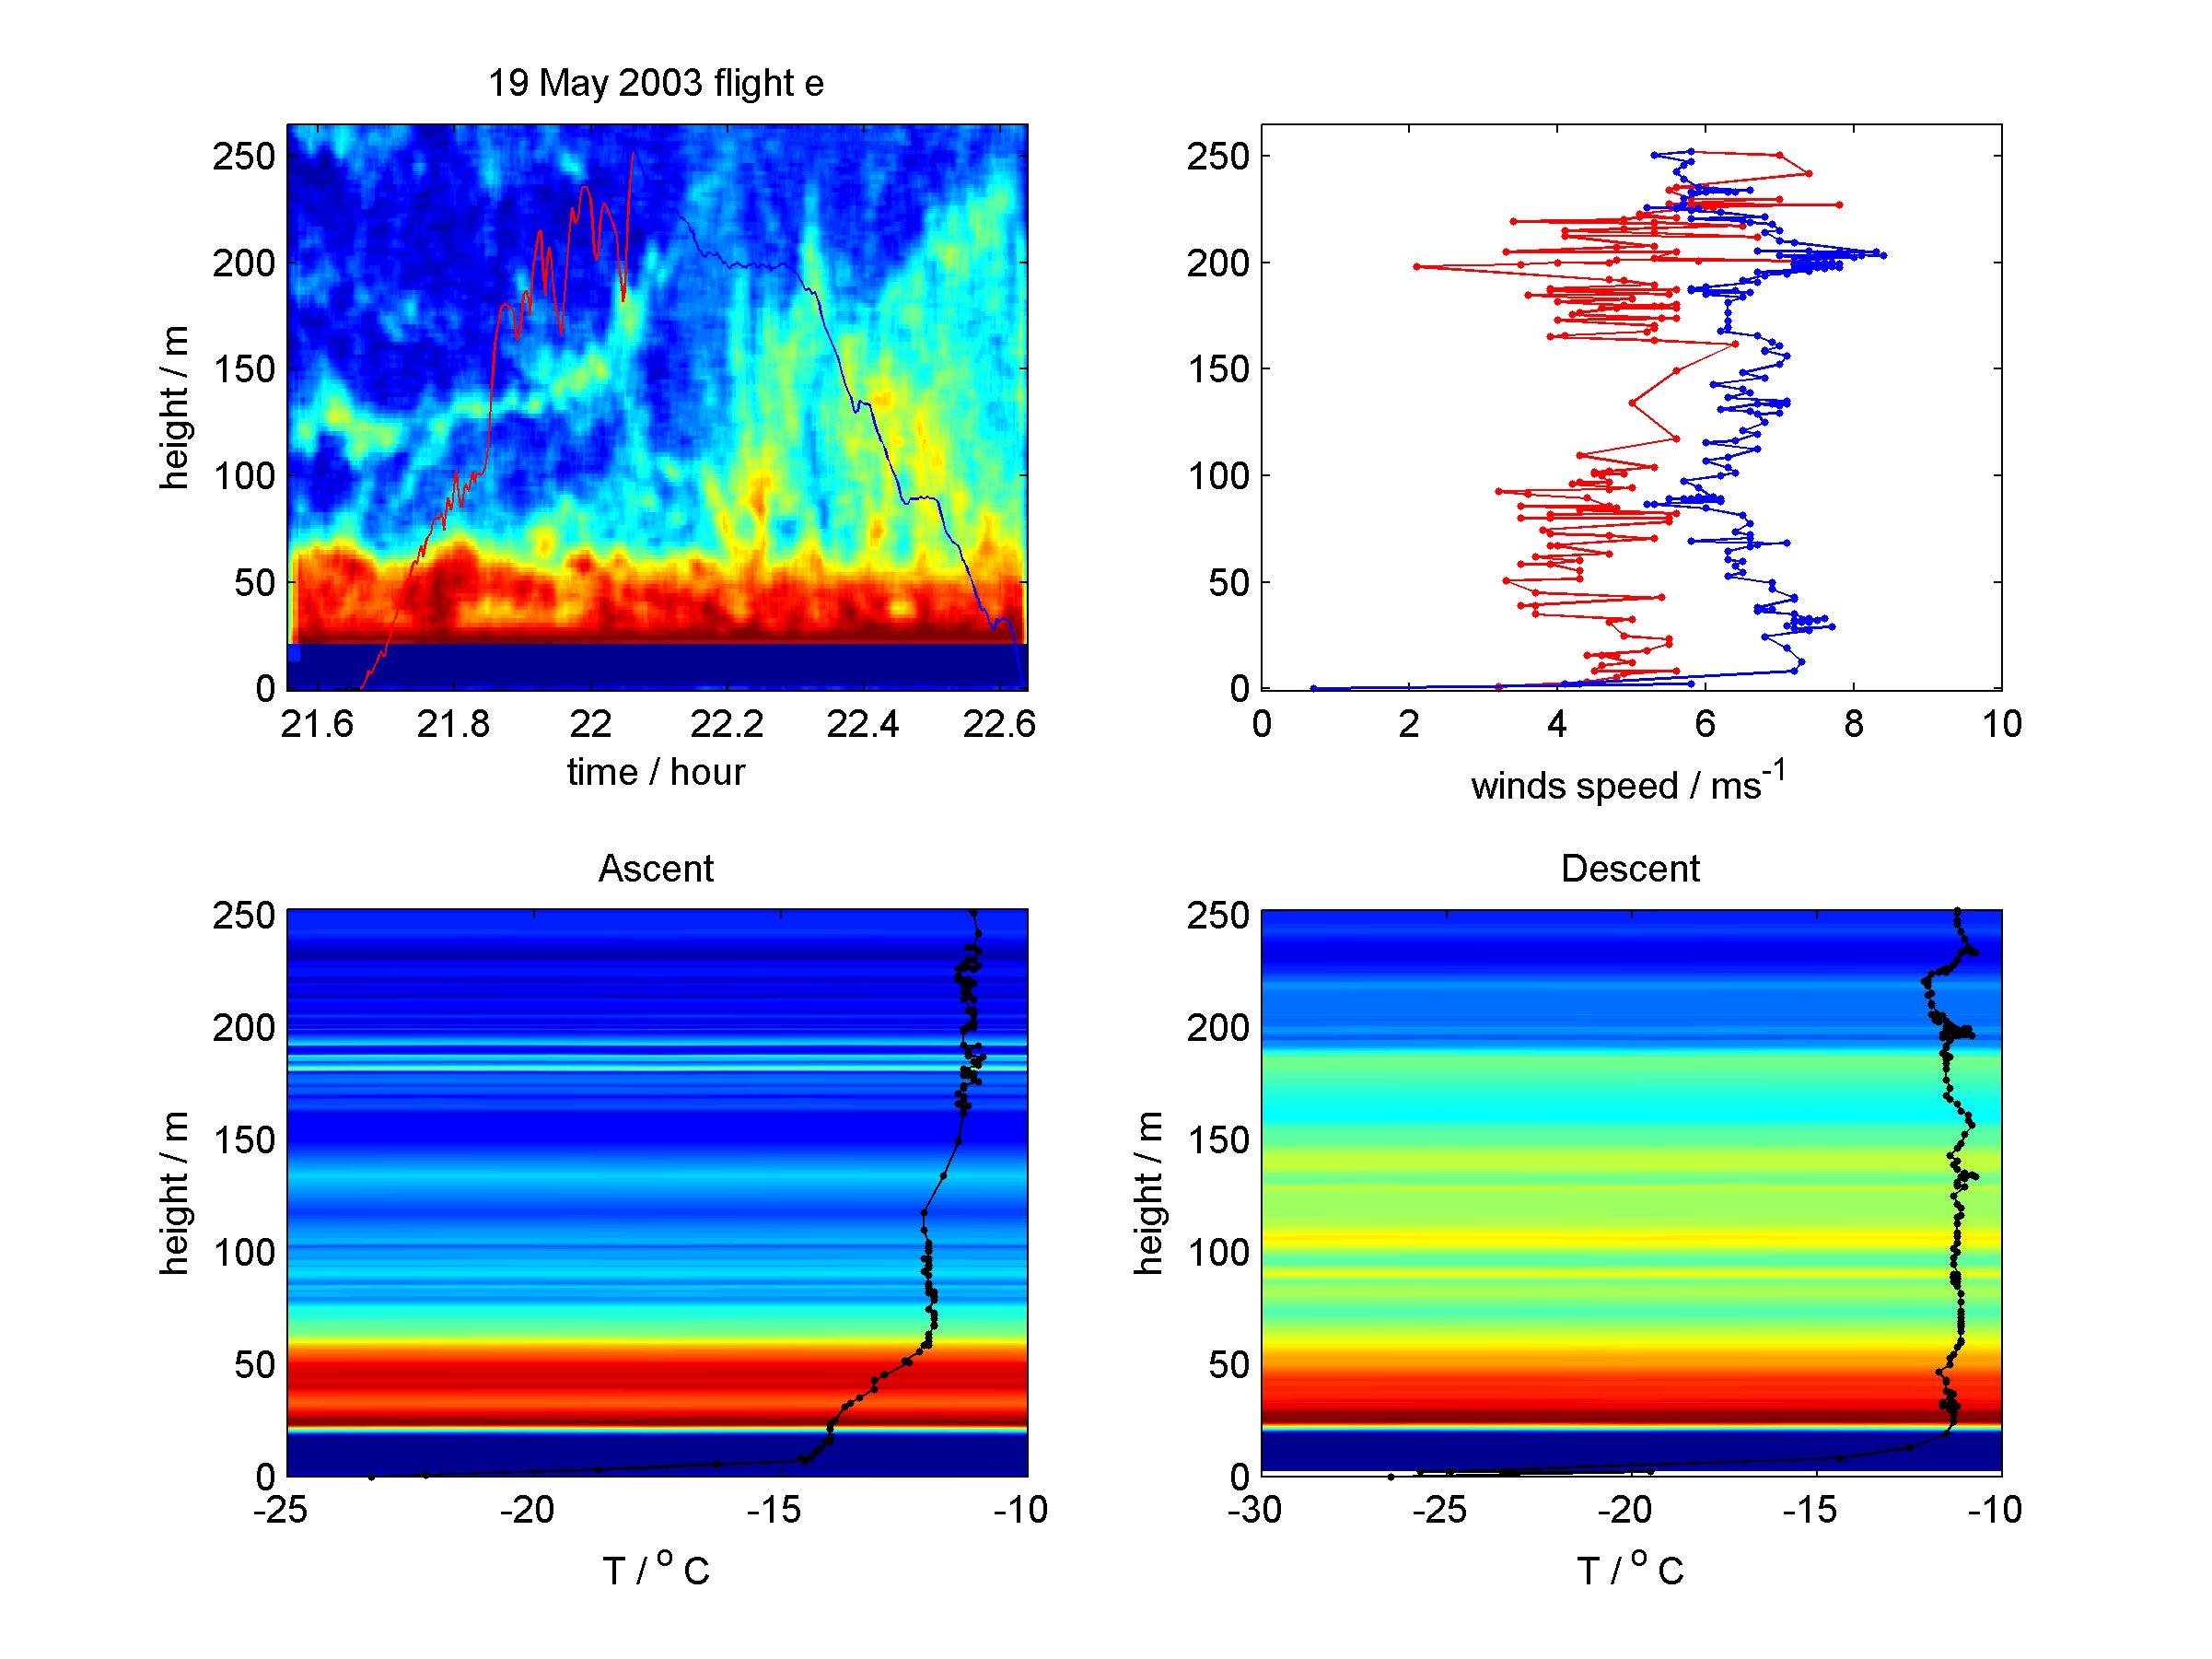
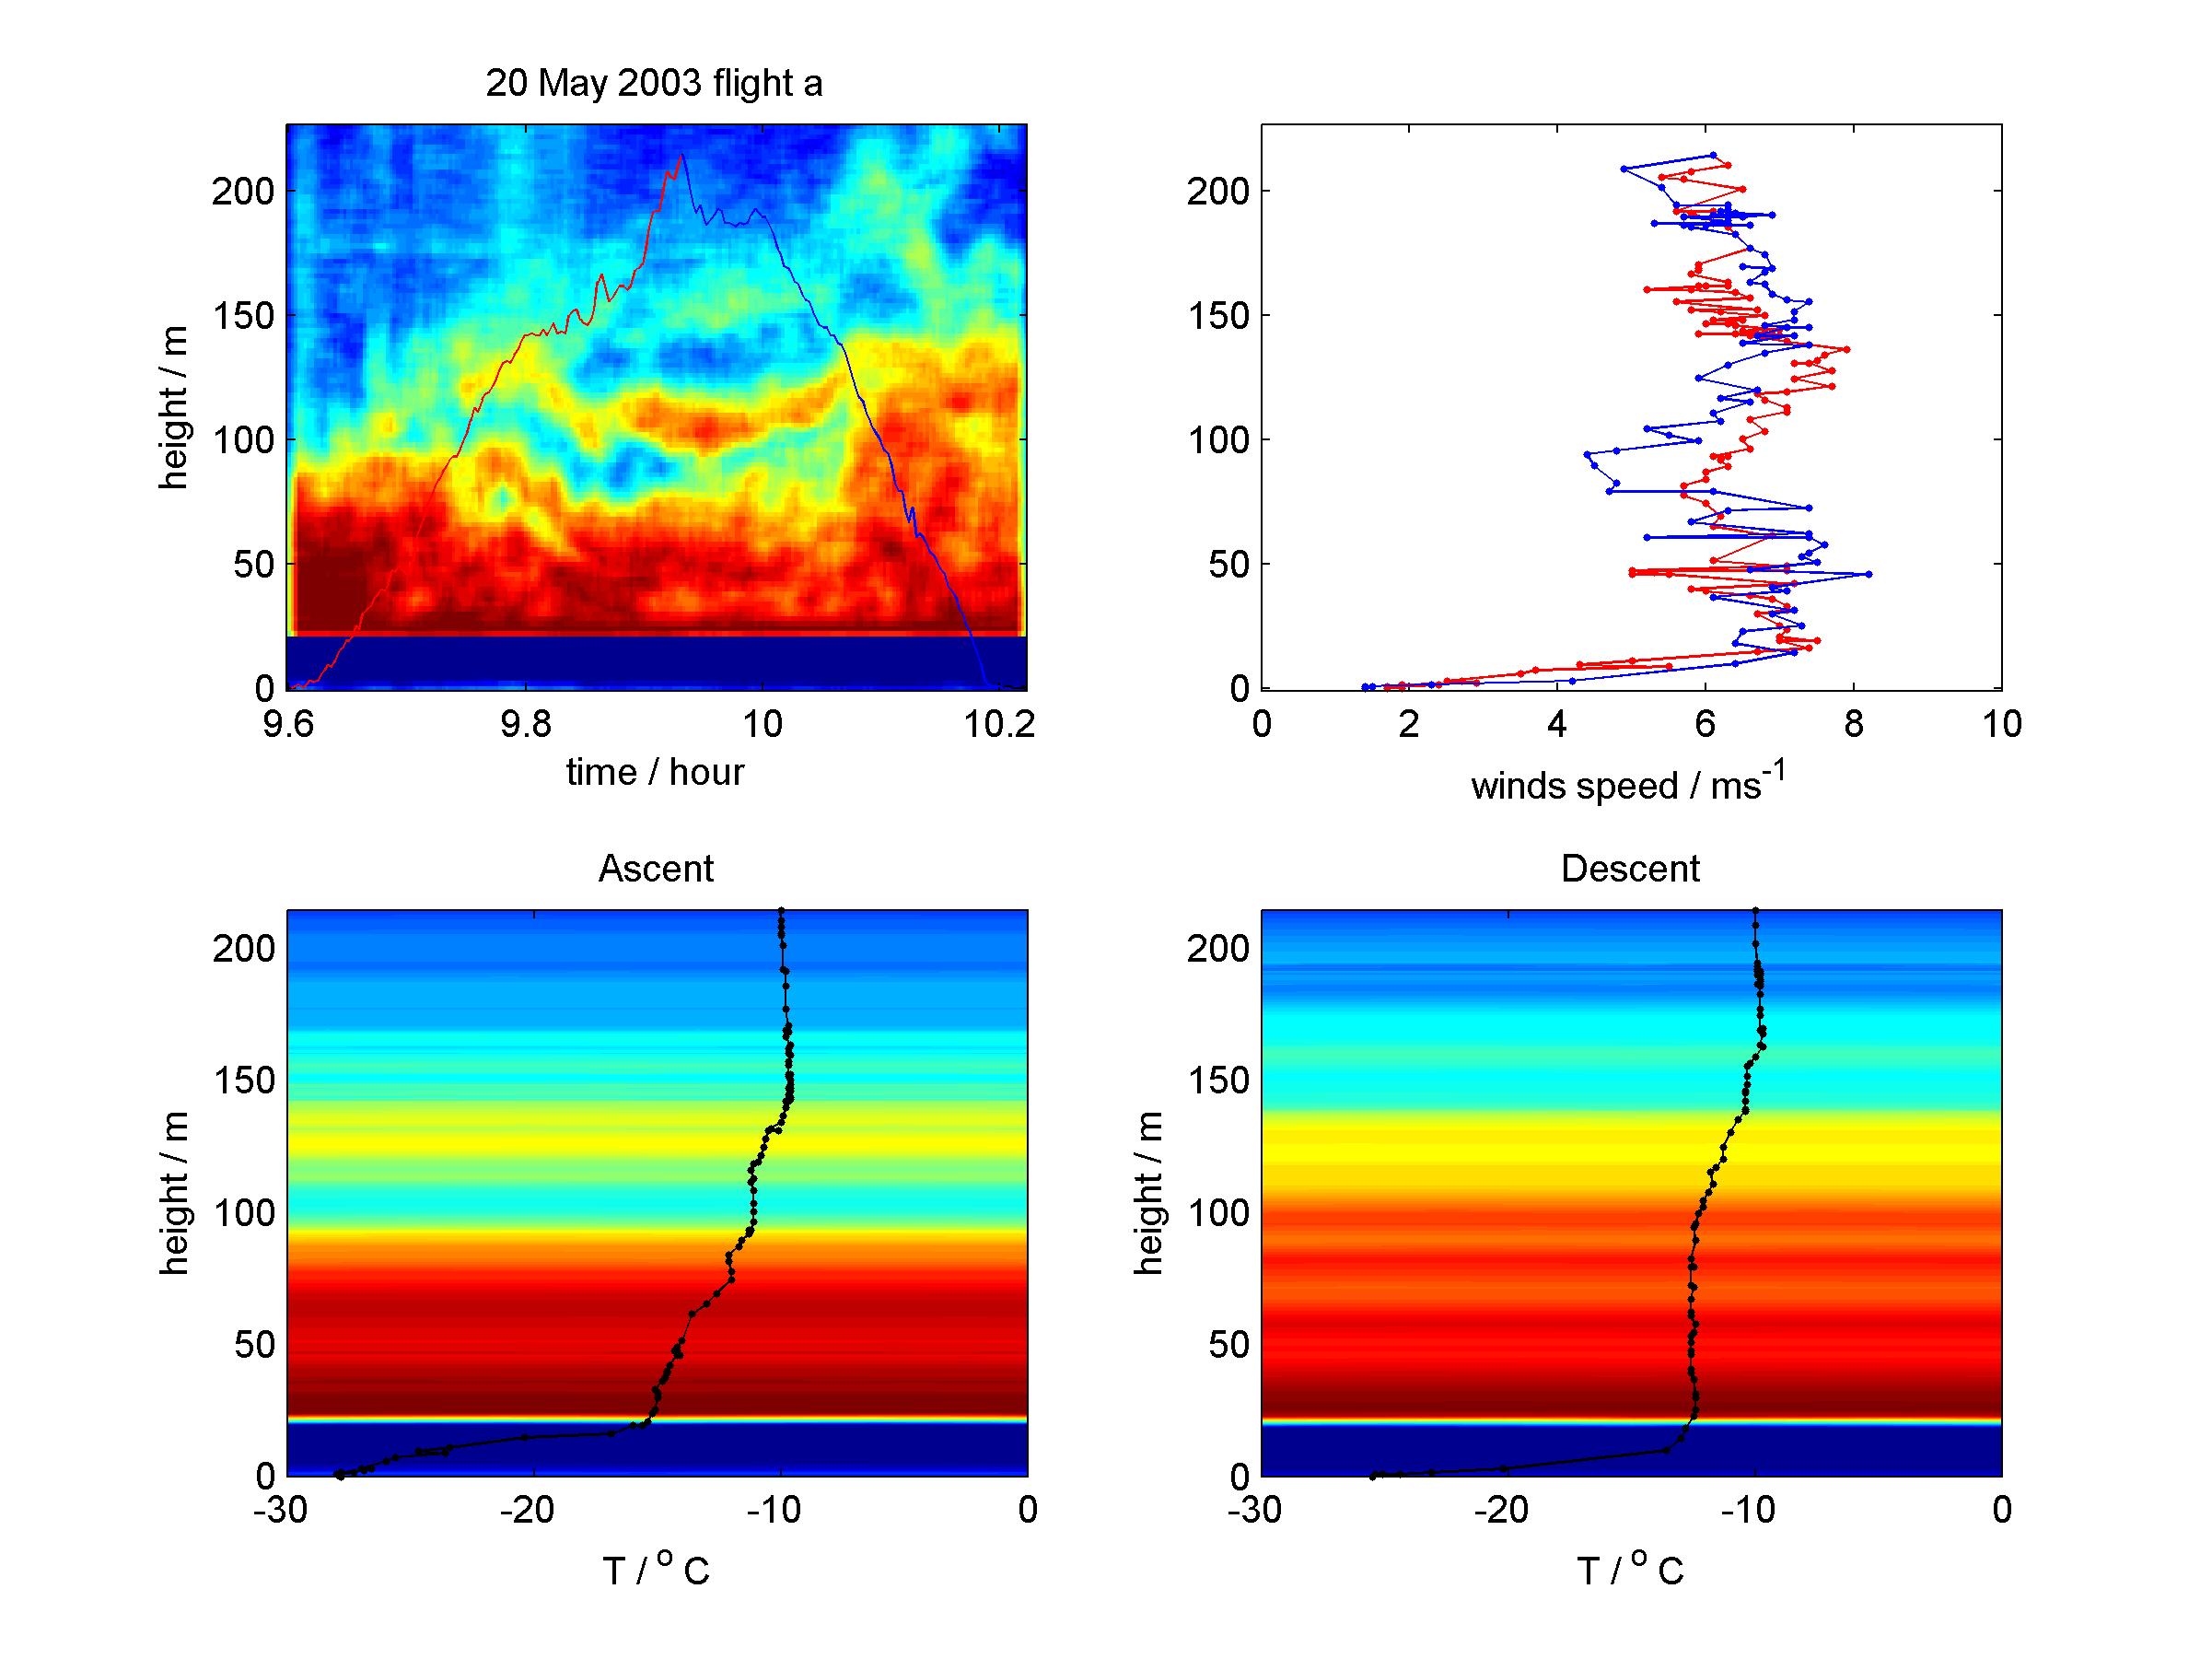
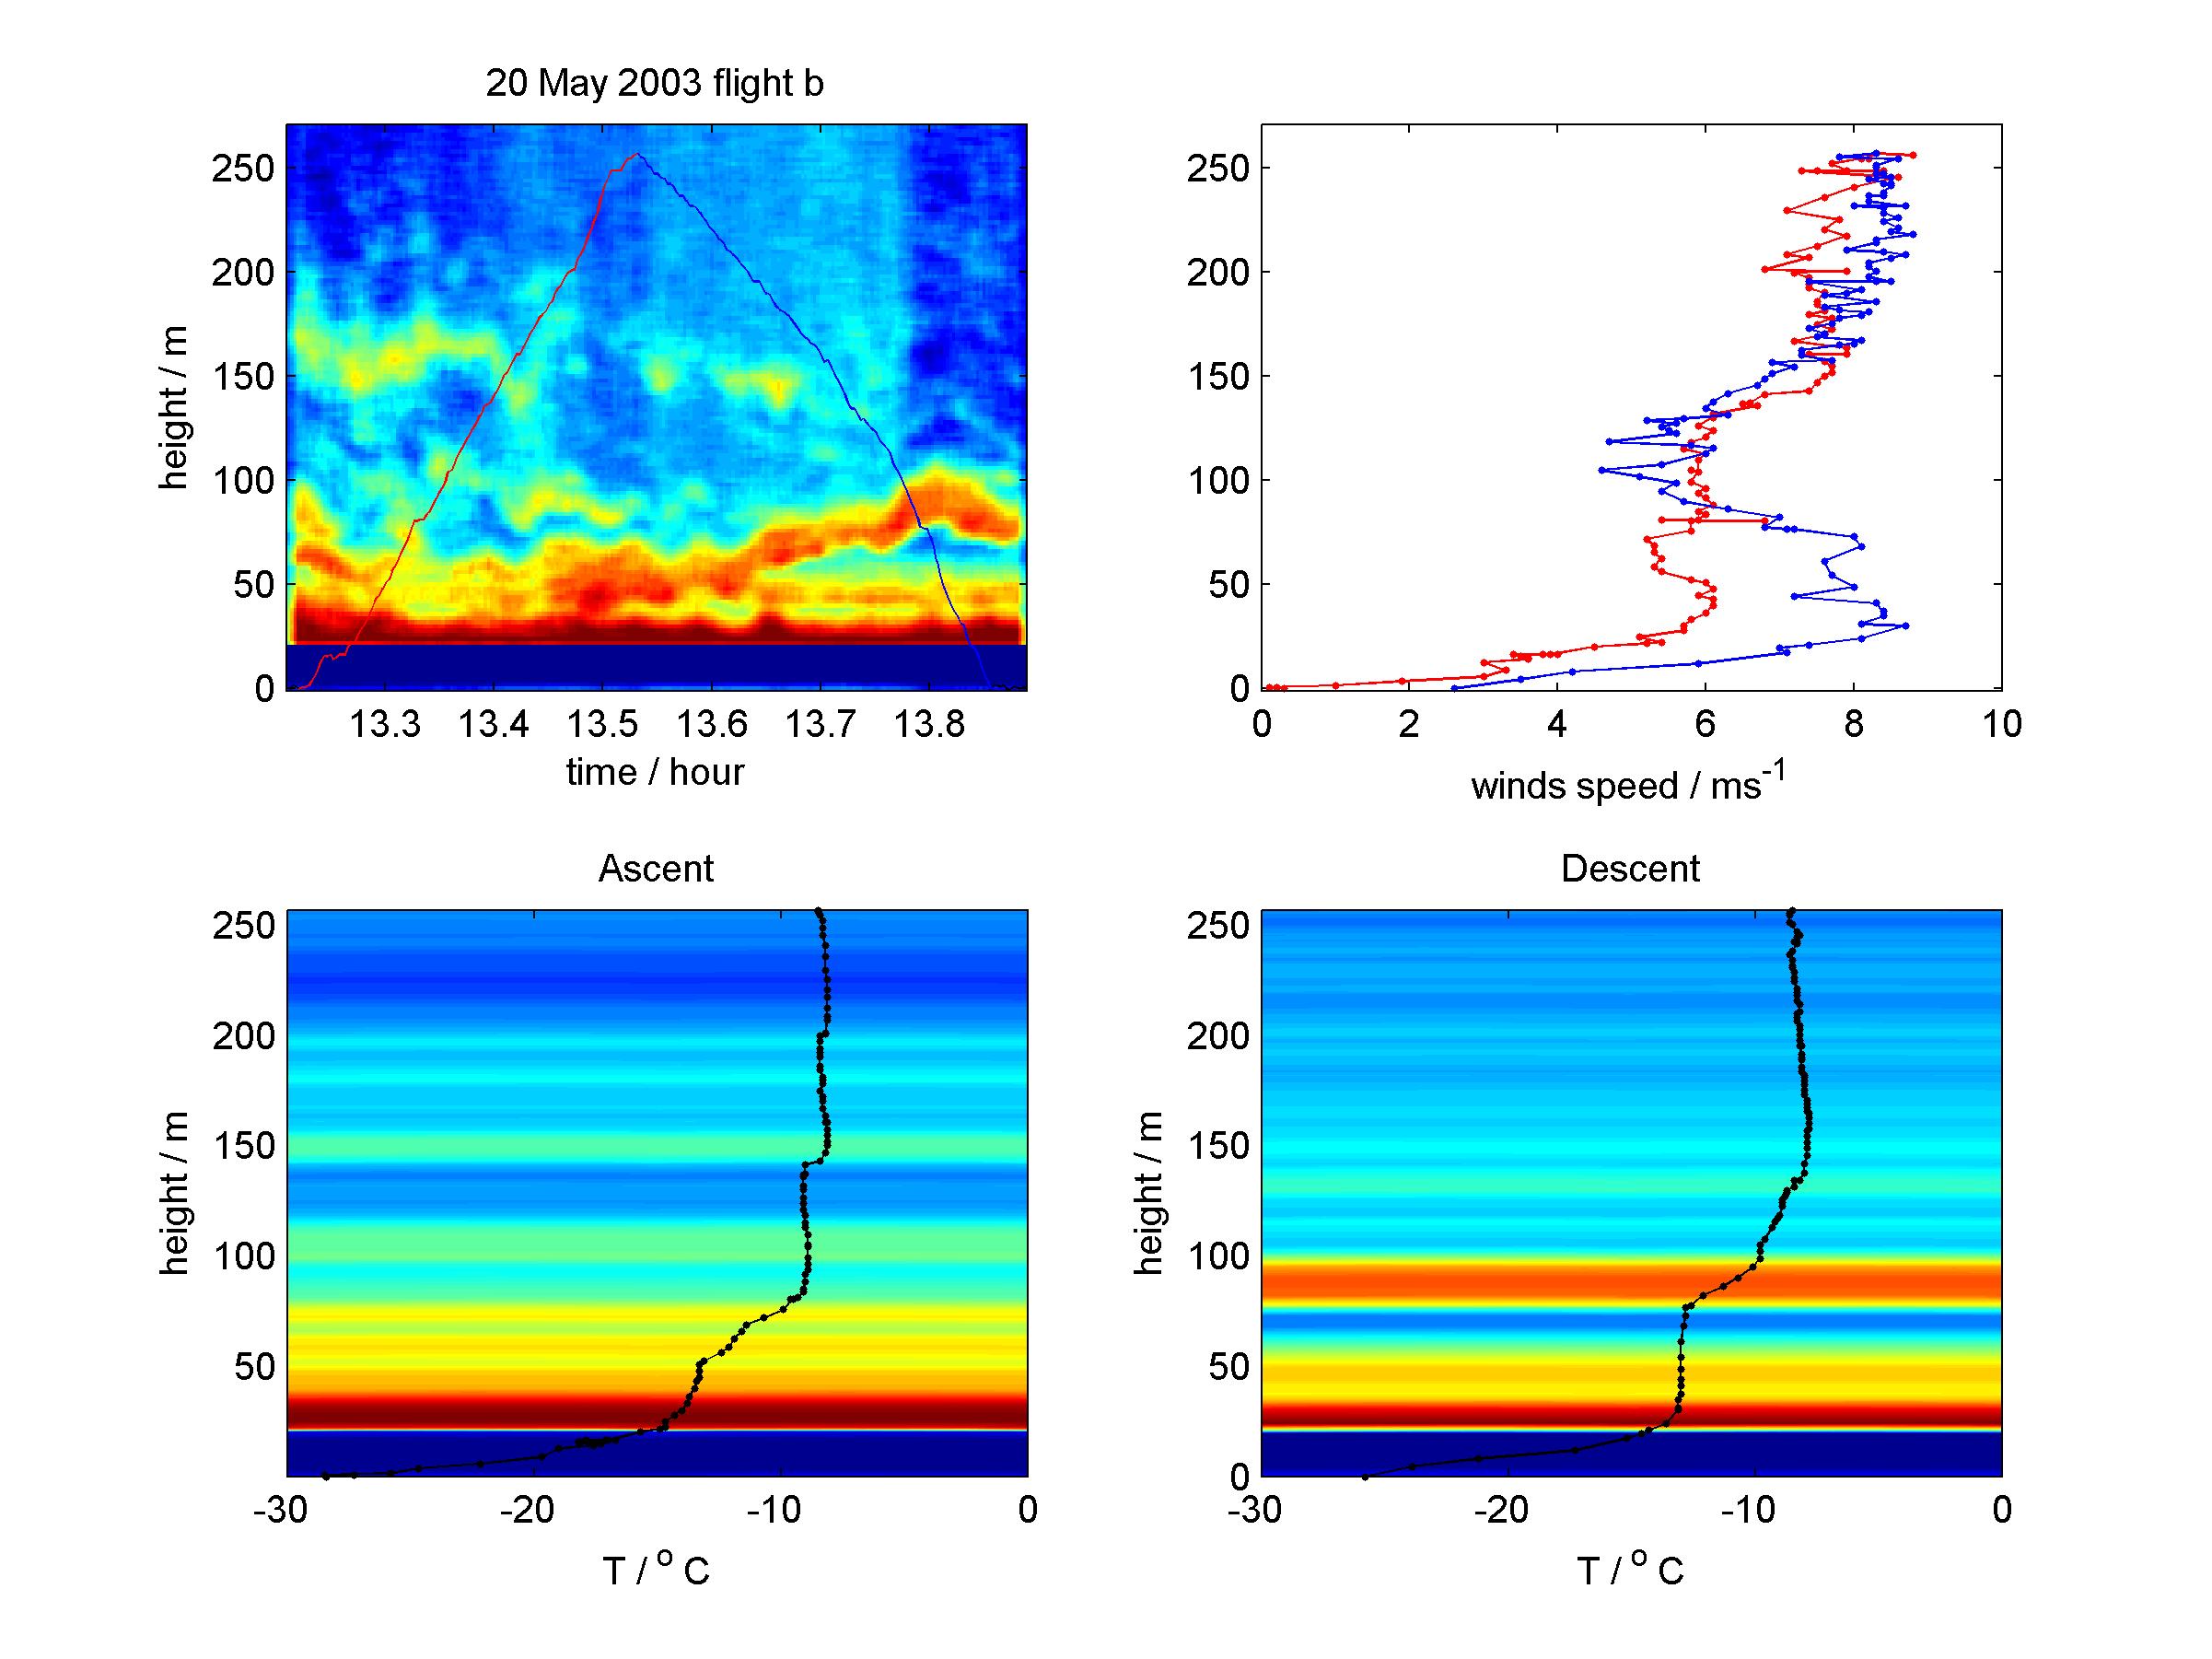
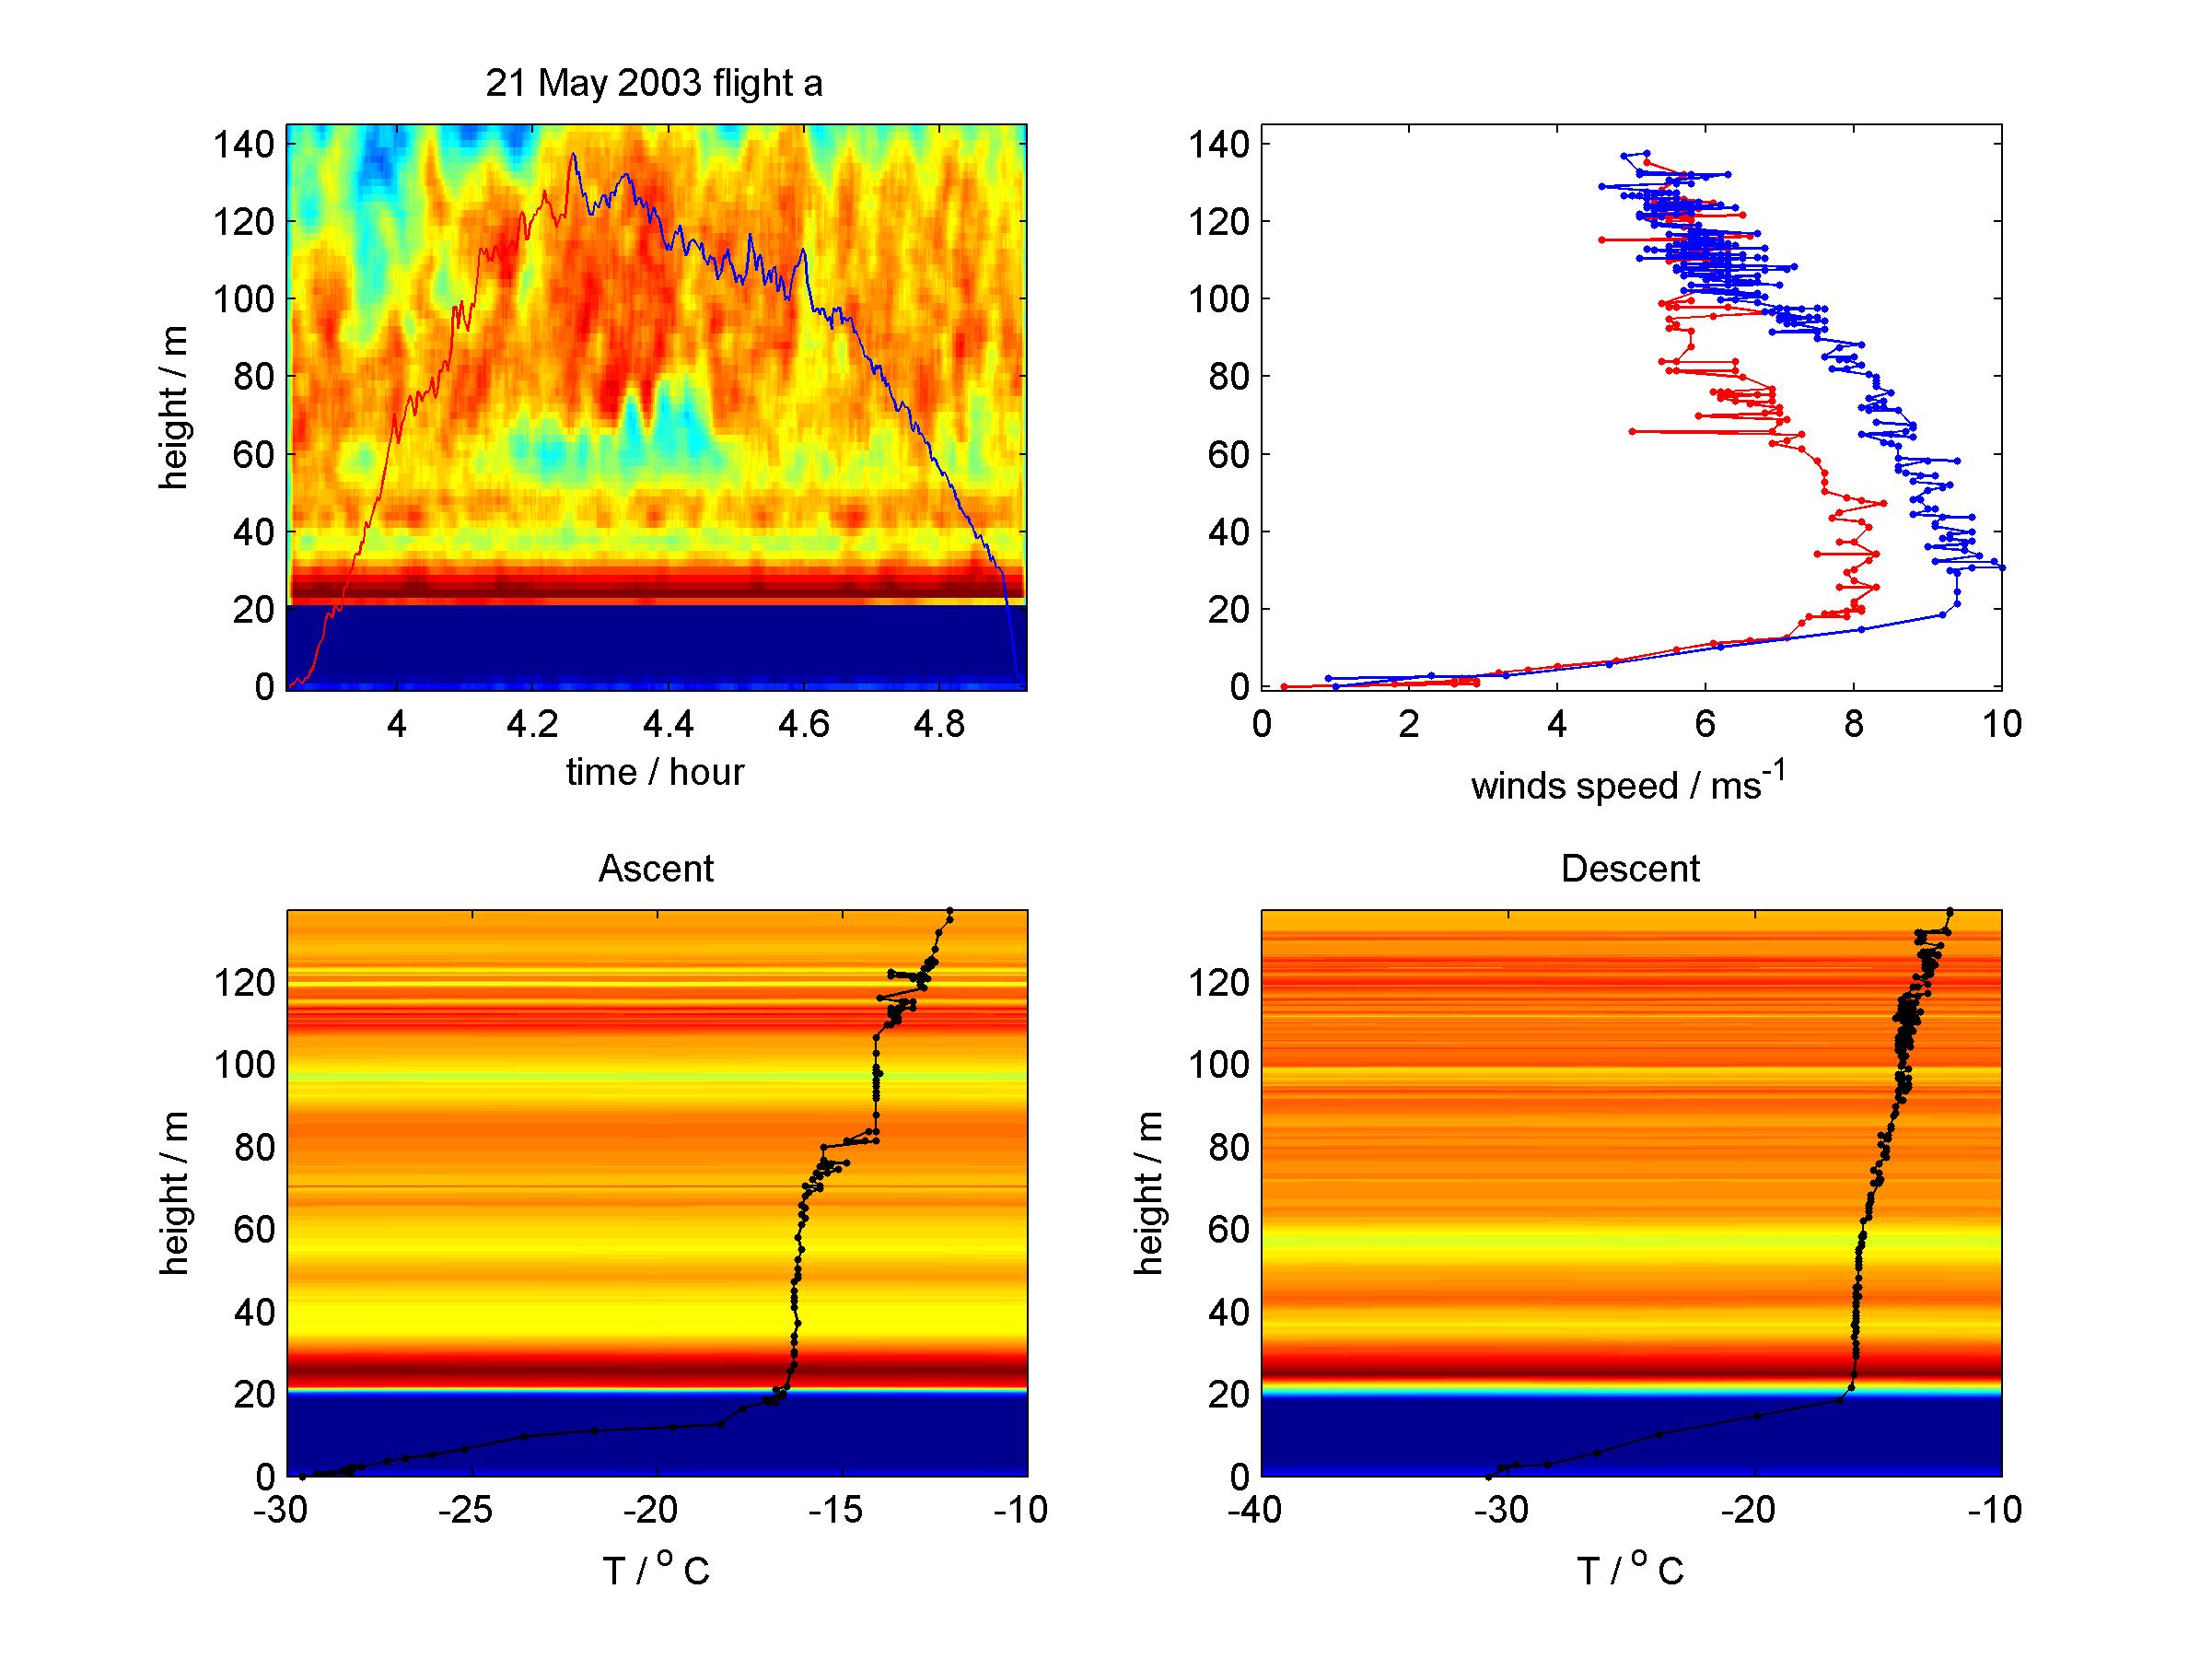
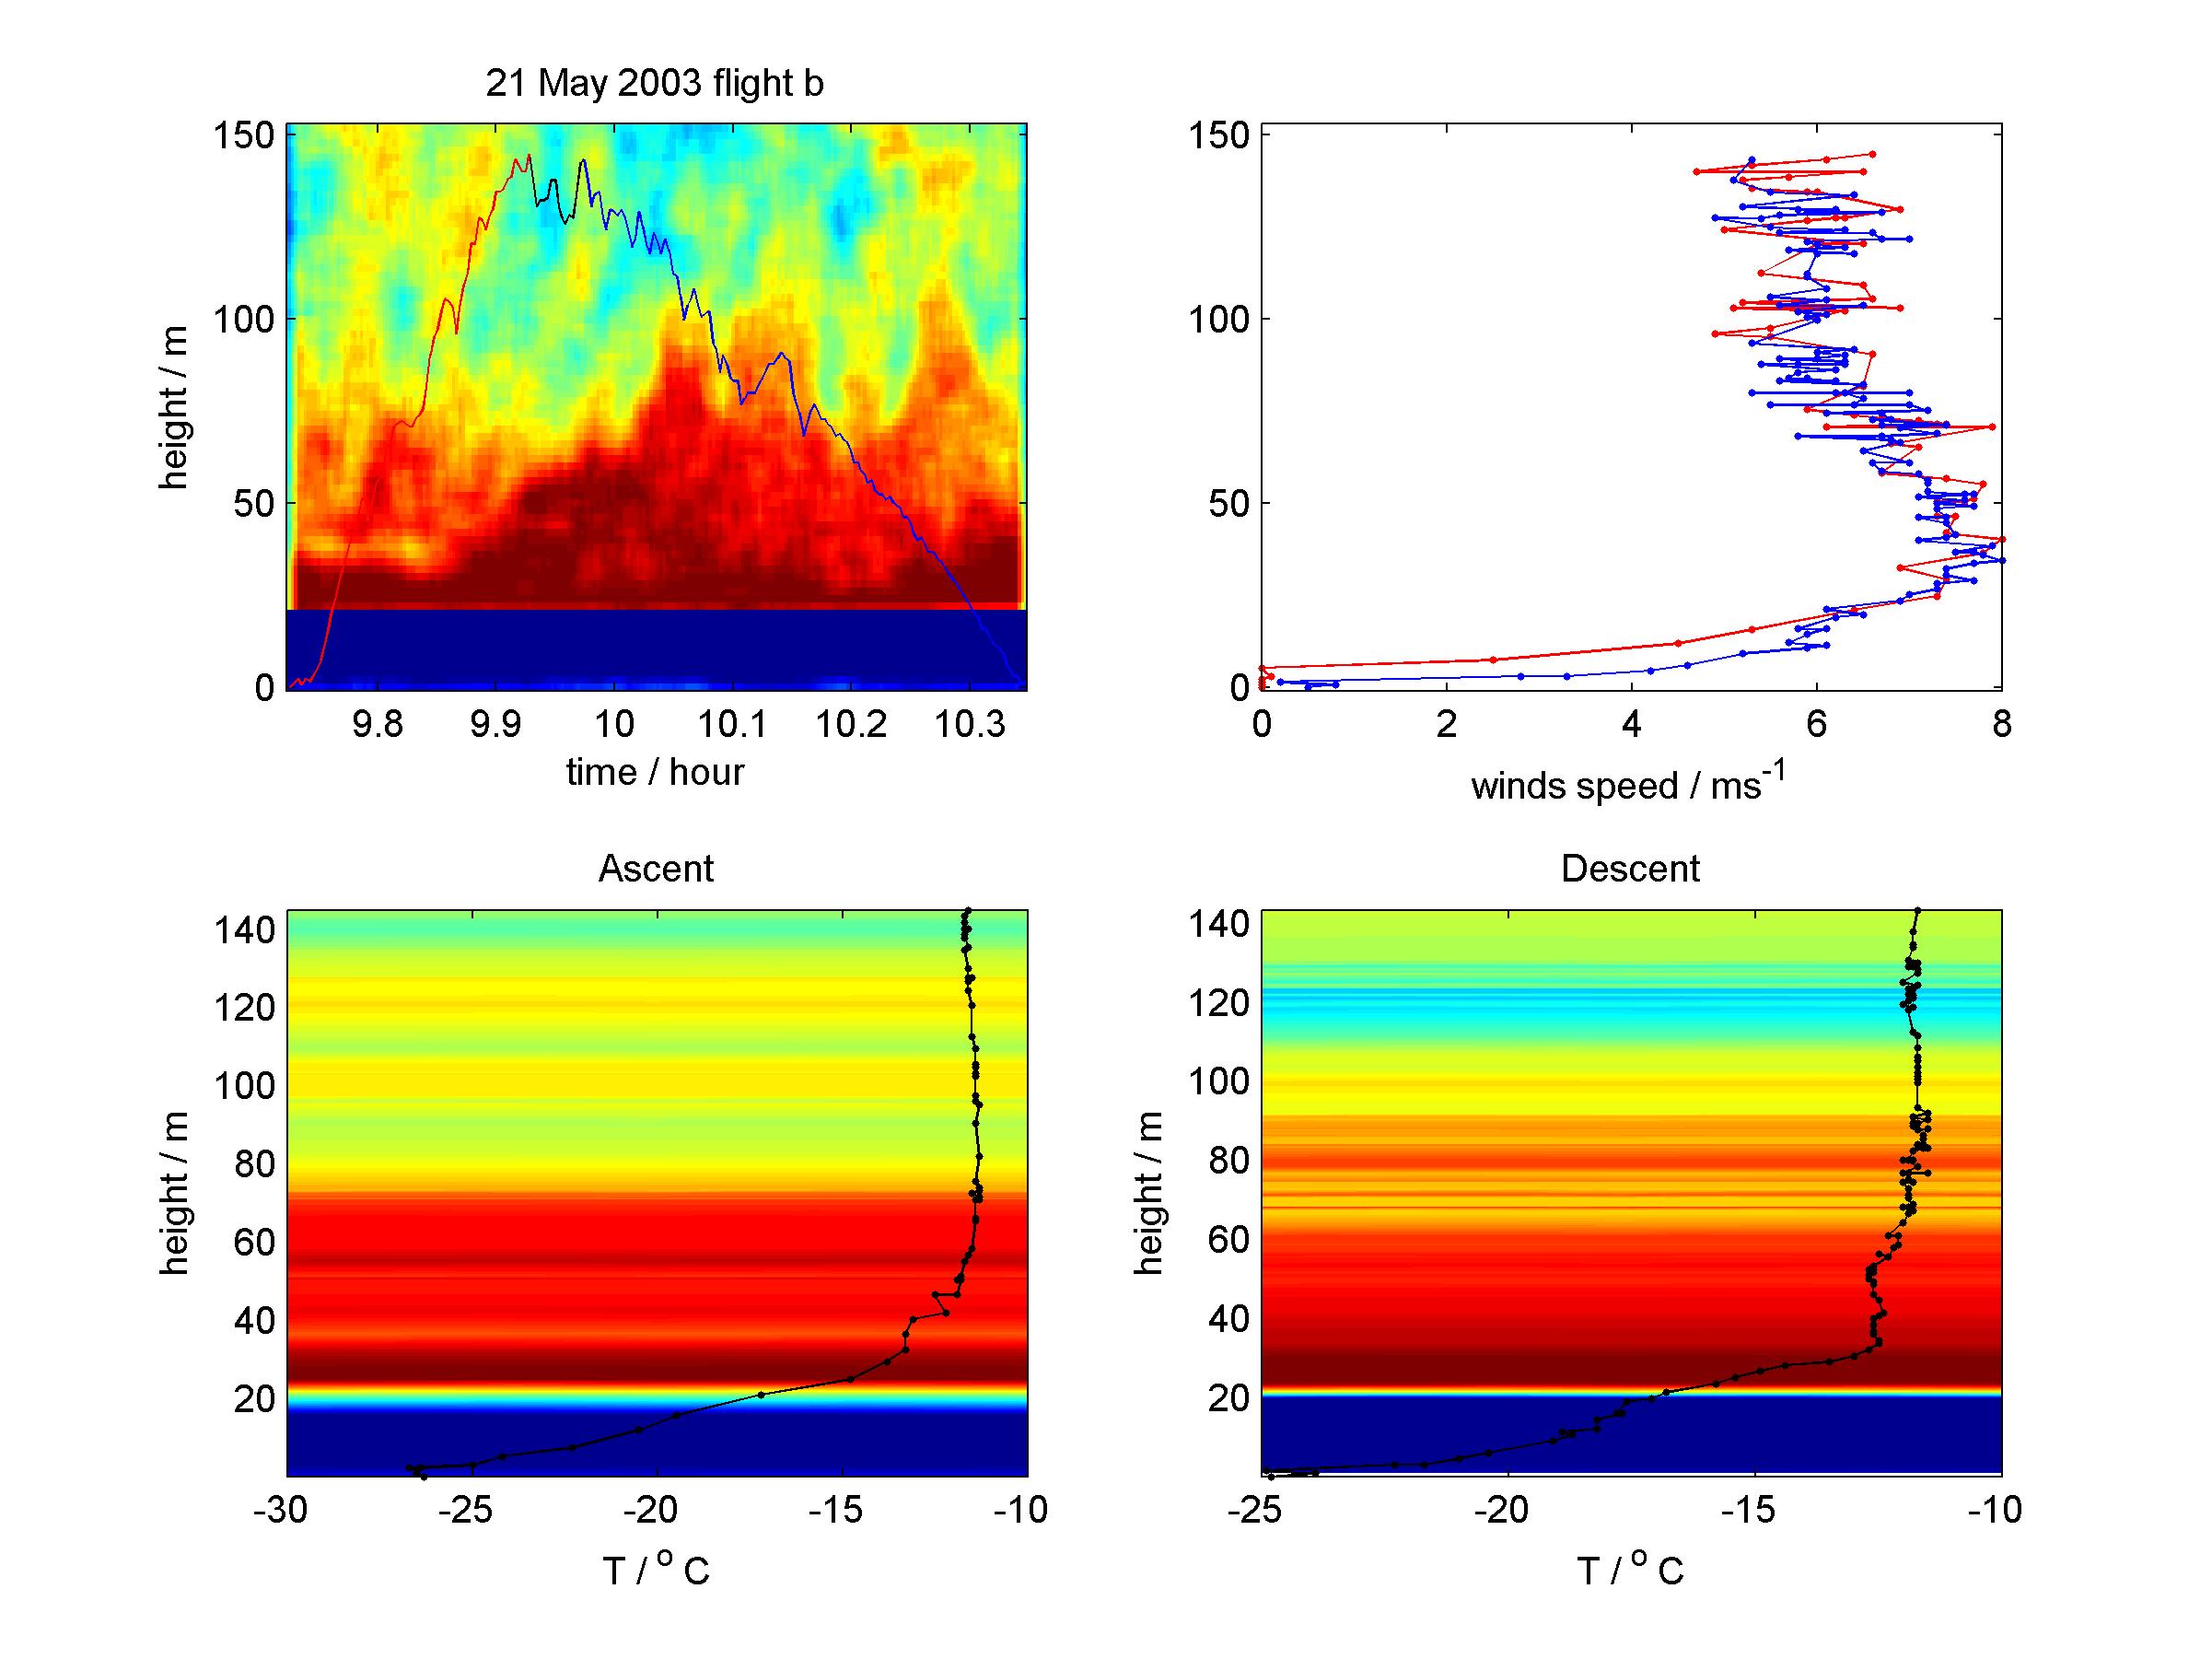
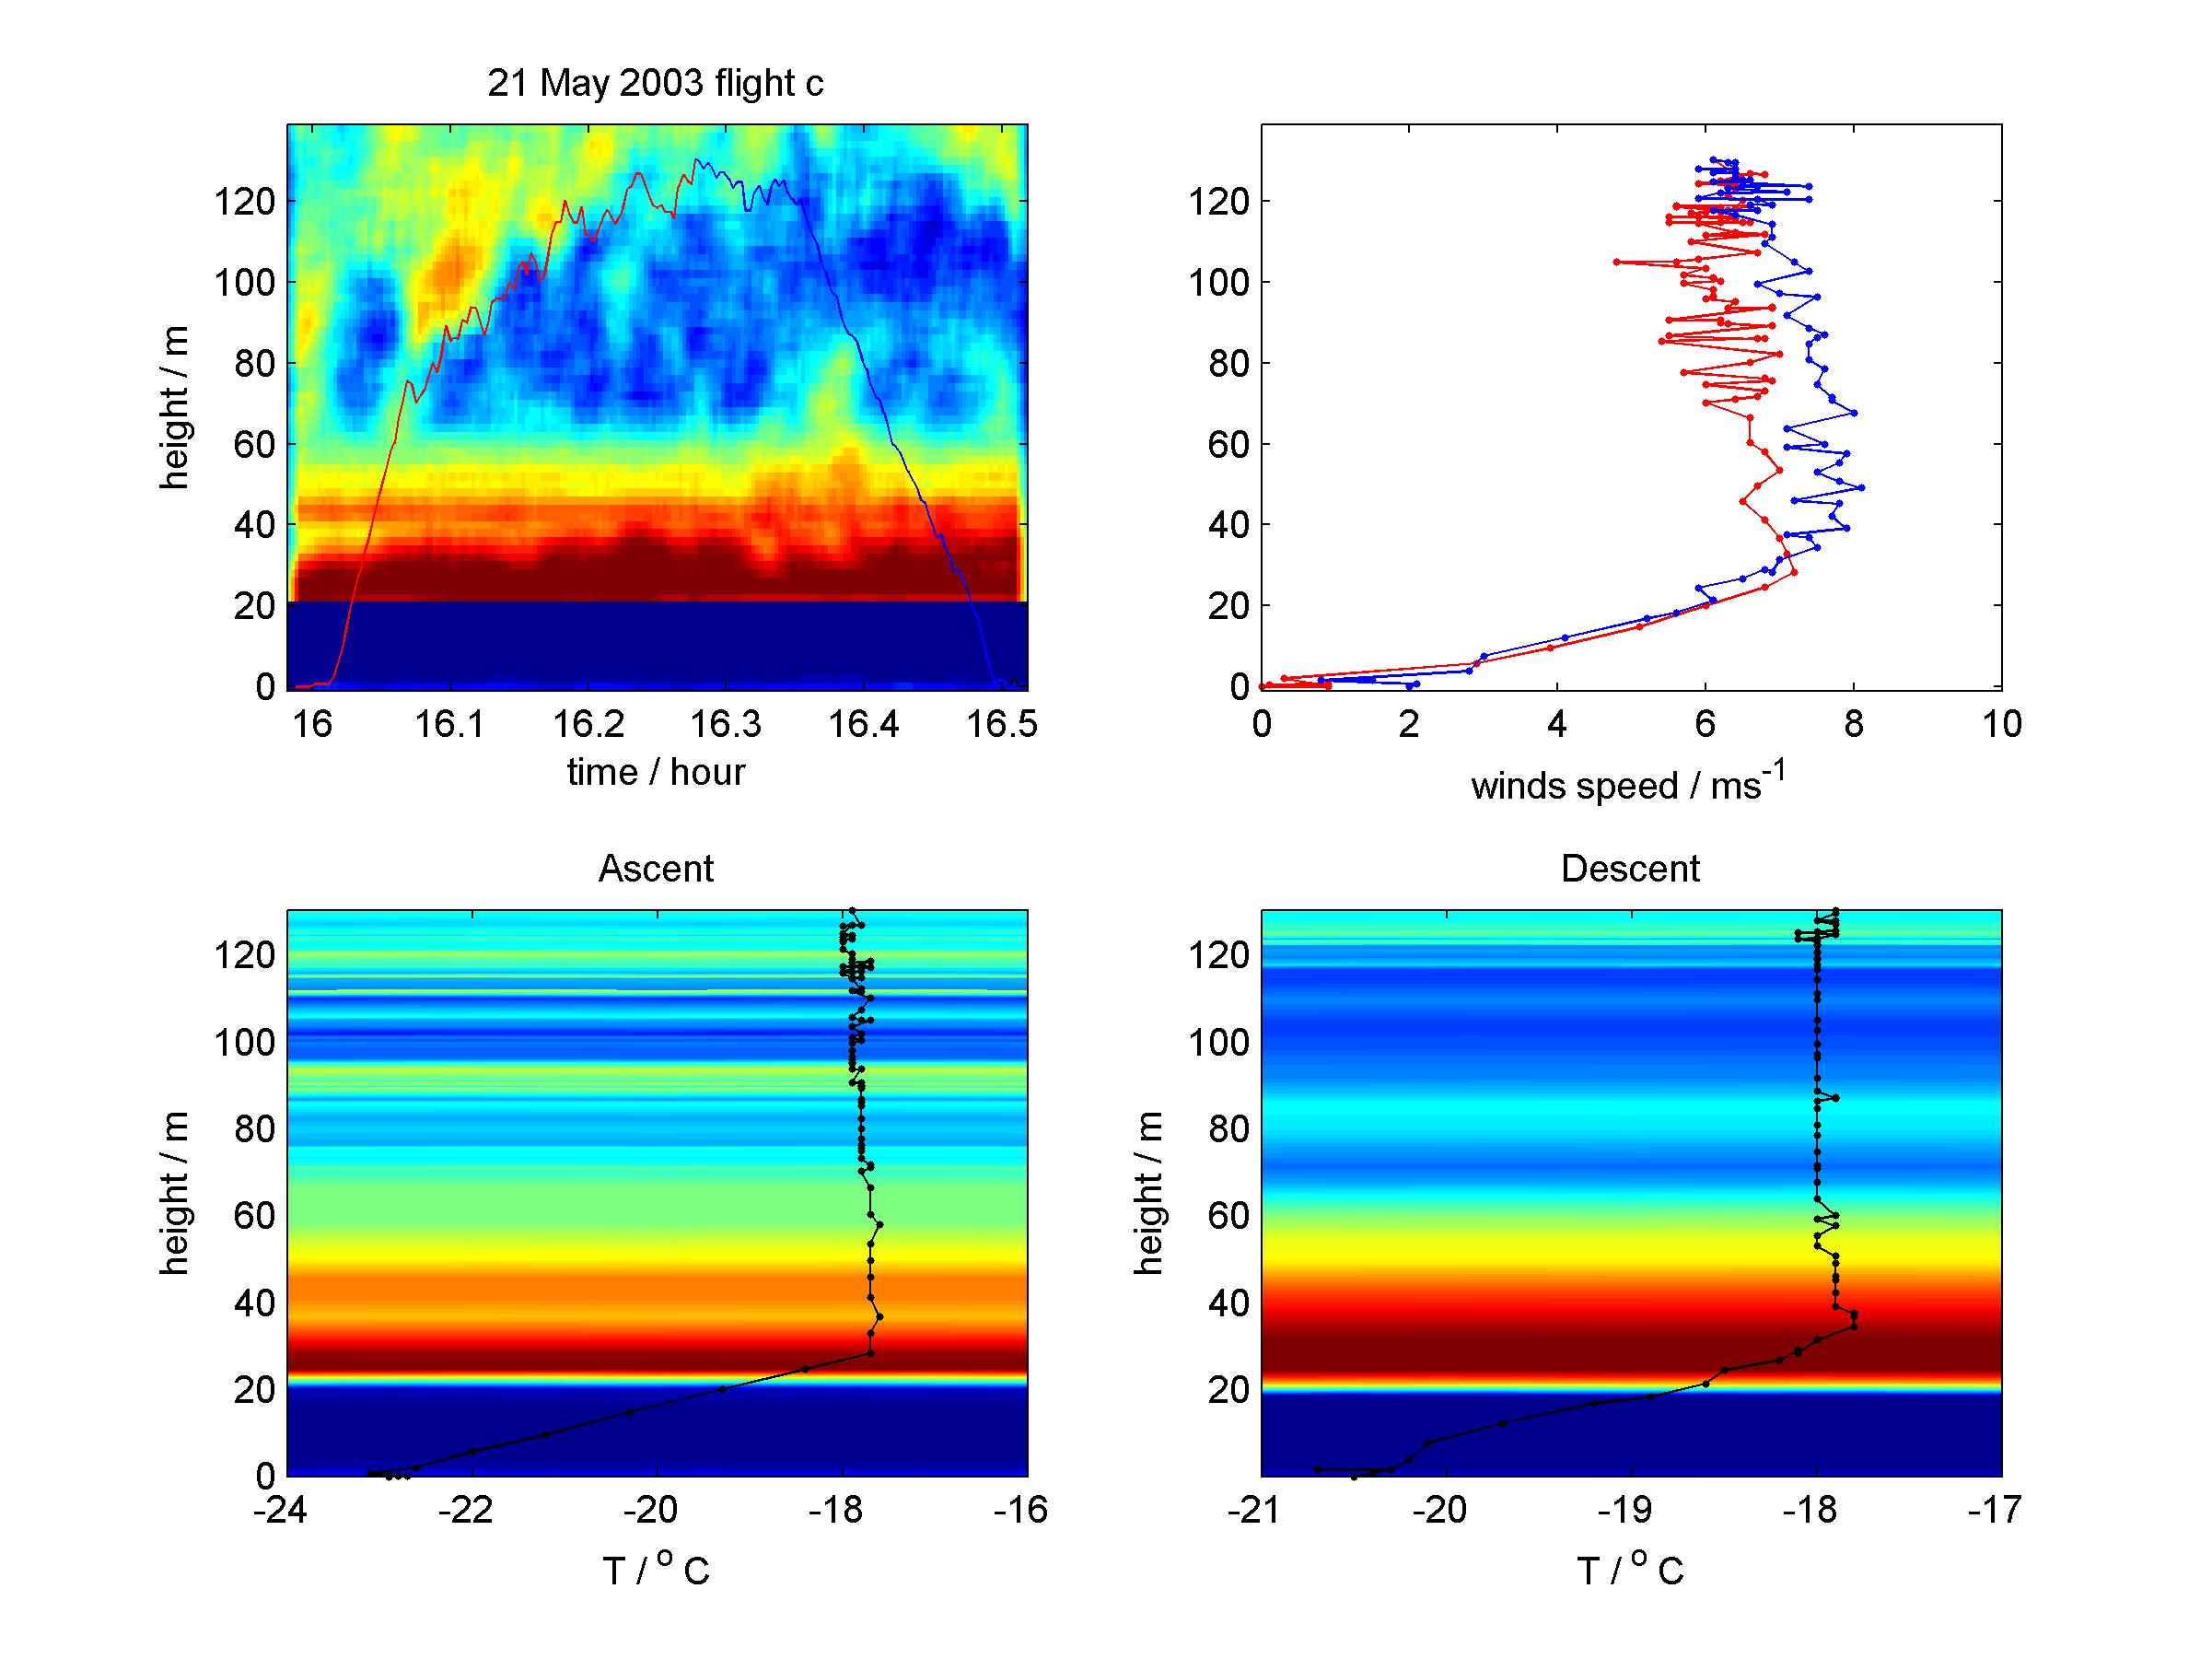
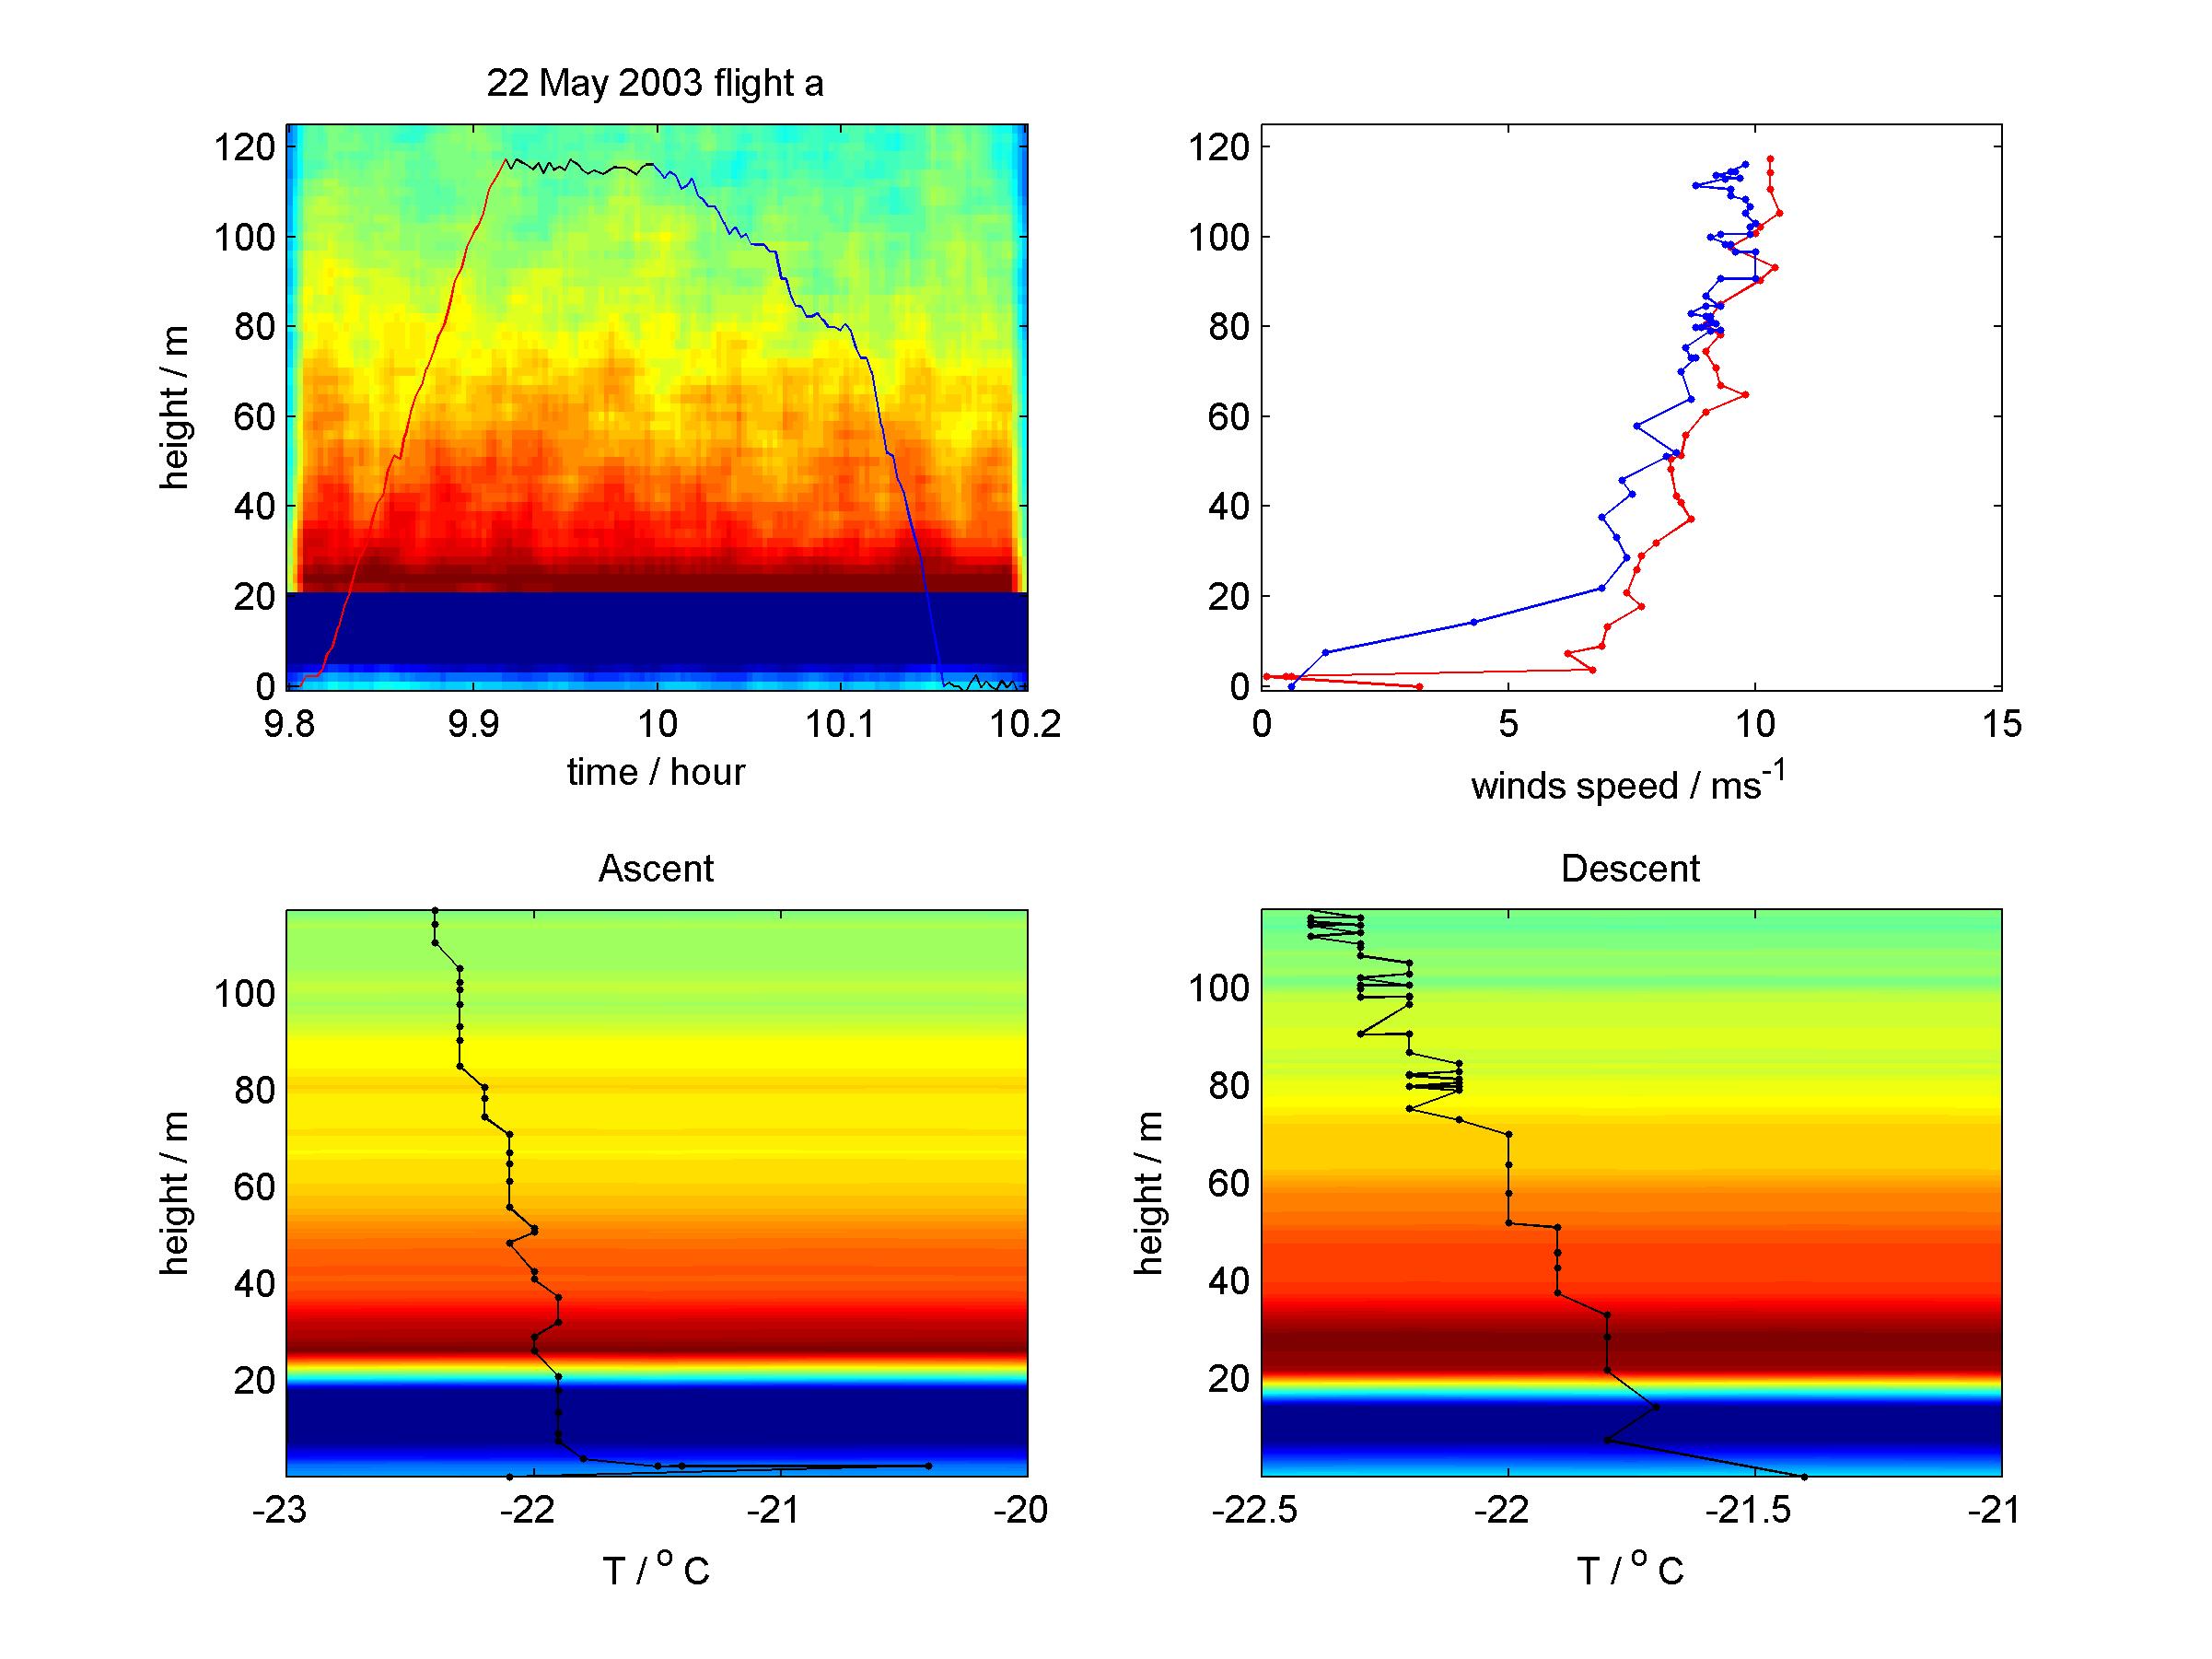
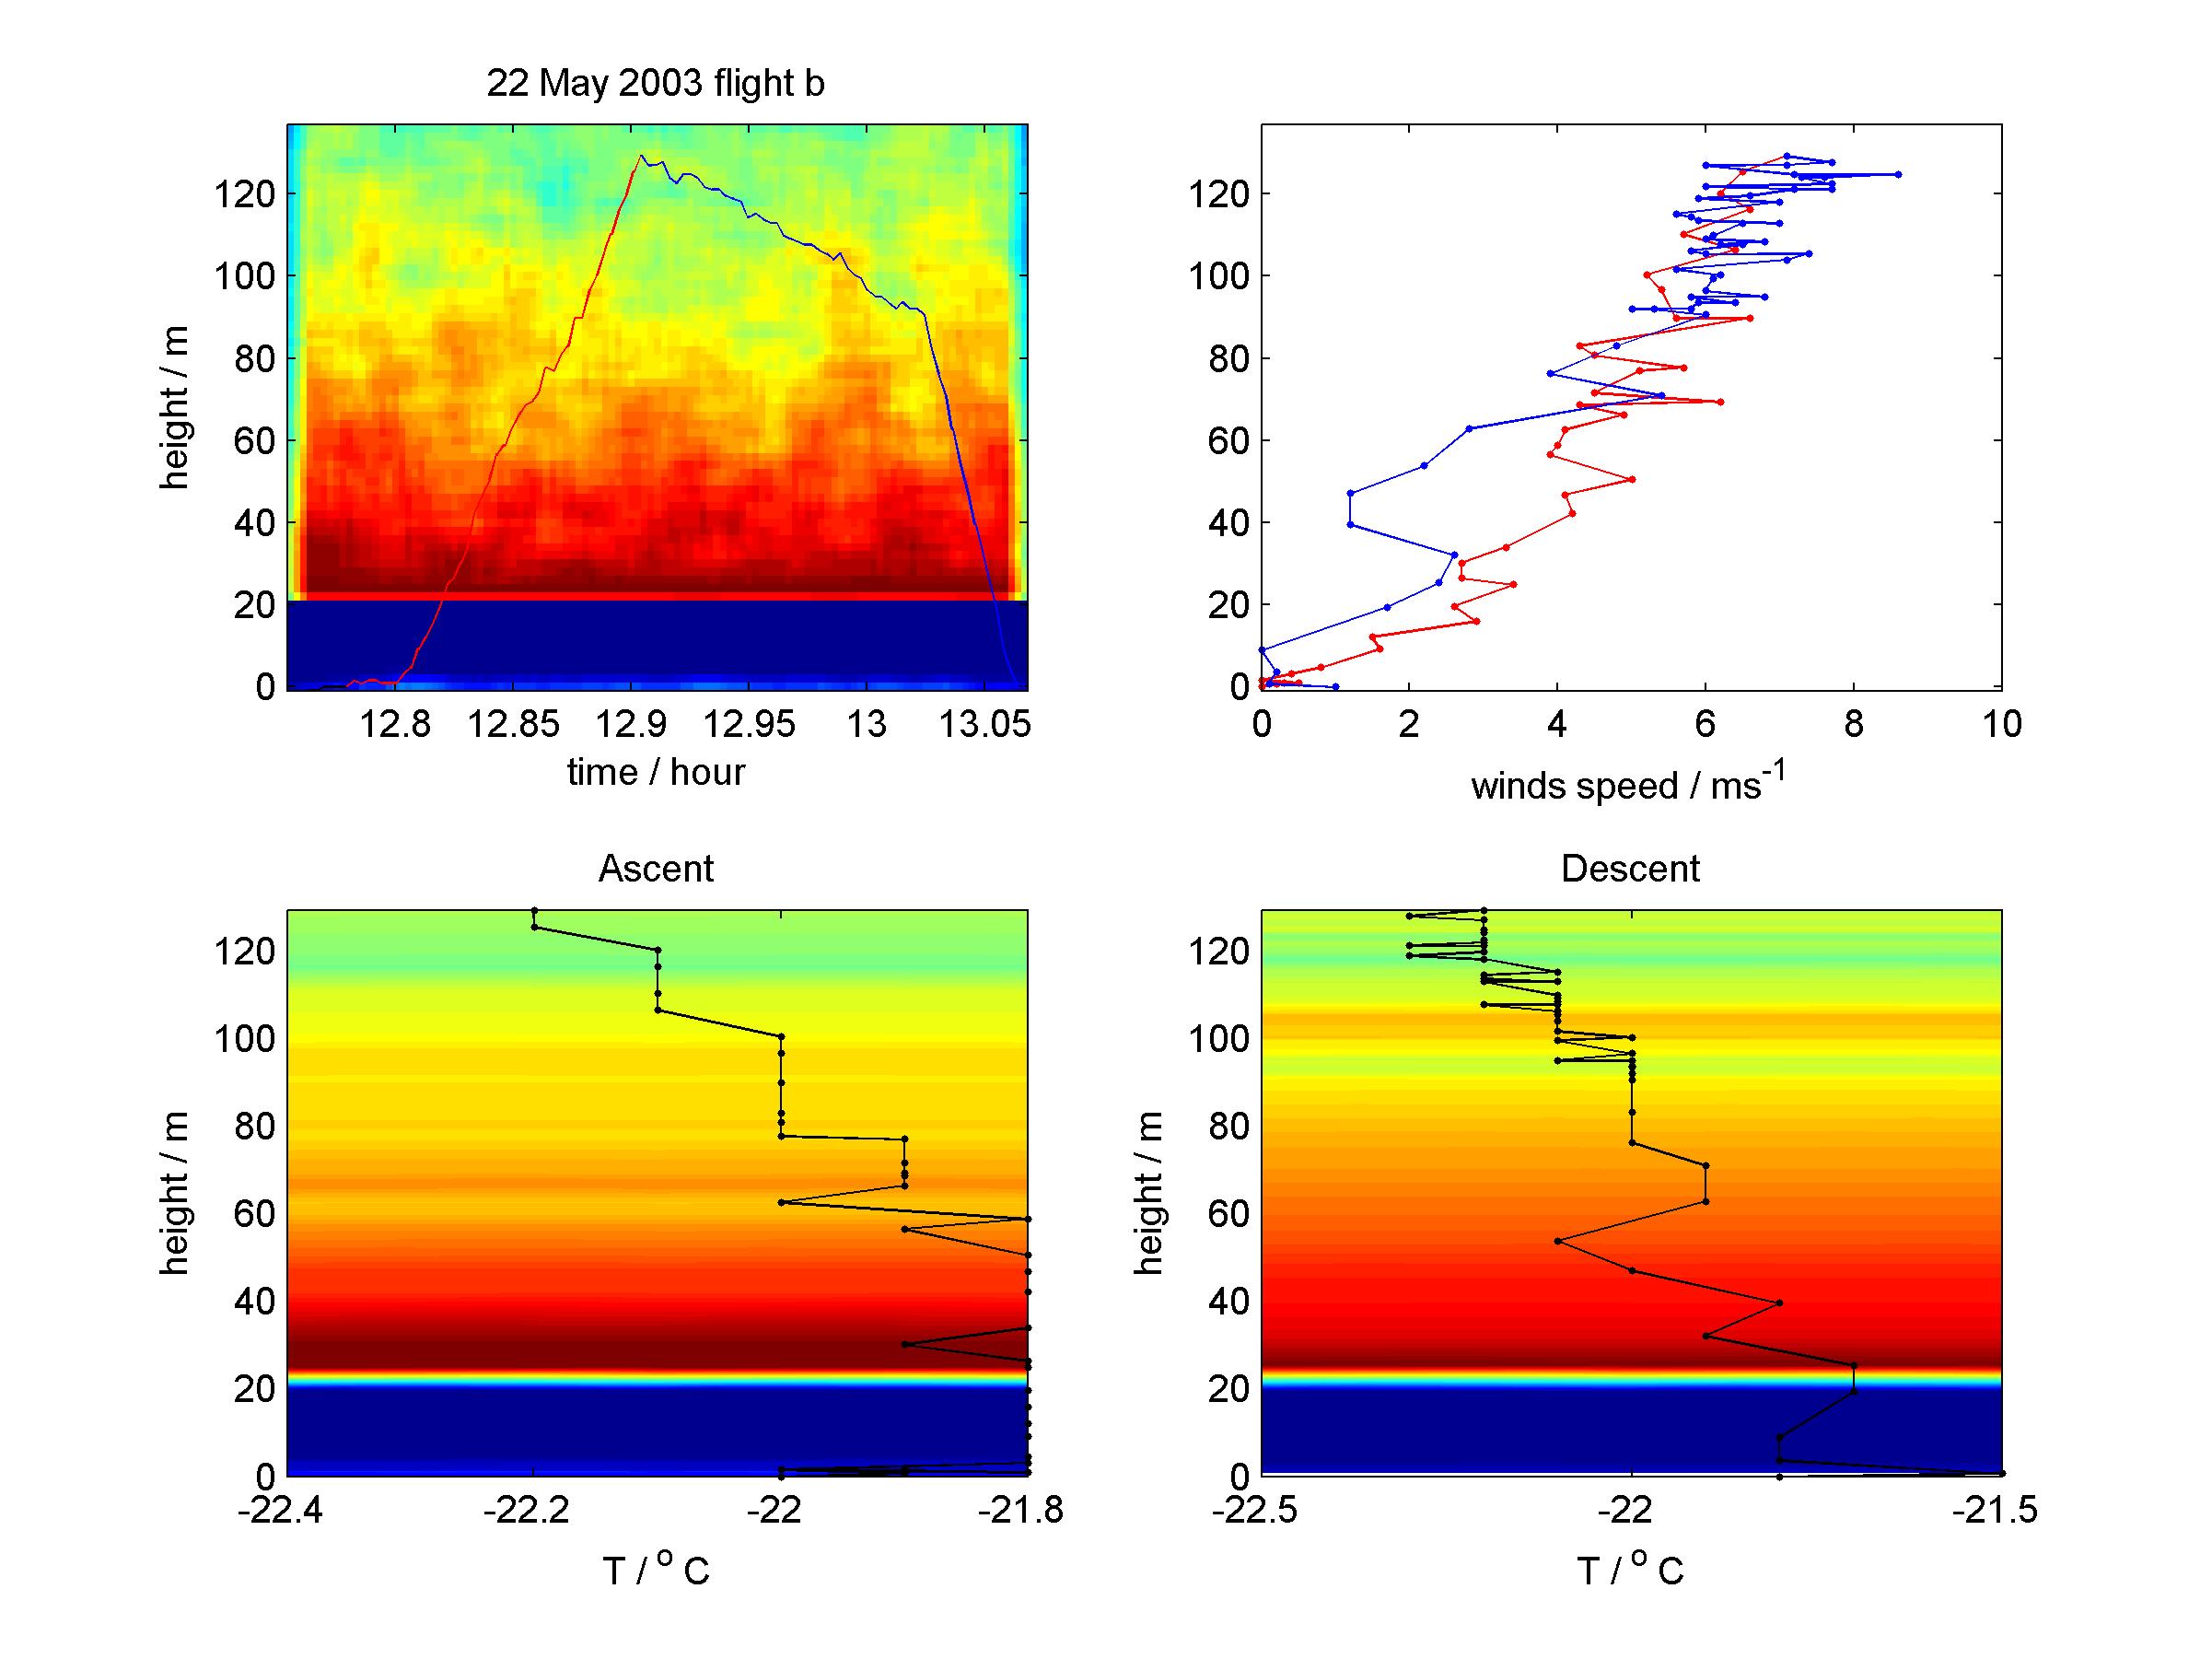
Individual flights with Sodar backscatter levels (echogramme) as background.
In each image, upper left: altitude vs. time overlaid on echogramme.
Upper right: wind speed vs. height for ascent (red) and decent (blue)
Lower left: temperature profile (ascent) with backscatter value
as background
Lower right: temperature profile decent.
1st row flights on 19th May, 2nd row 20th May, etc
|
|
|
|
|
|
|
|
|
|||
|
|
|
|
||
|
|
|
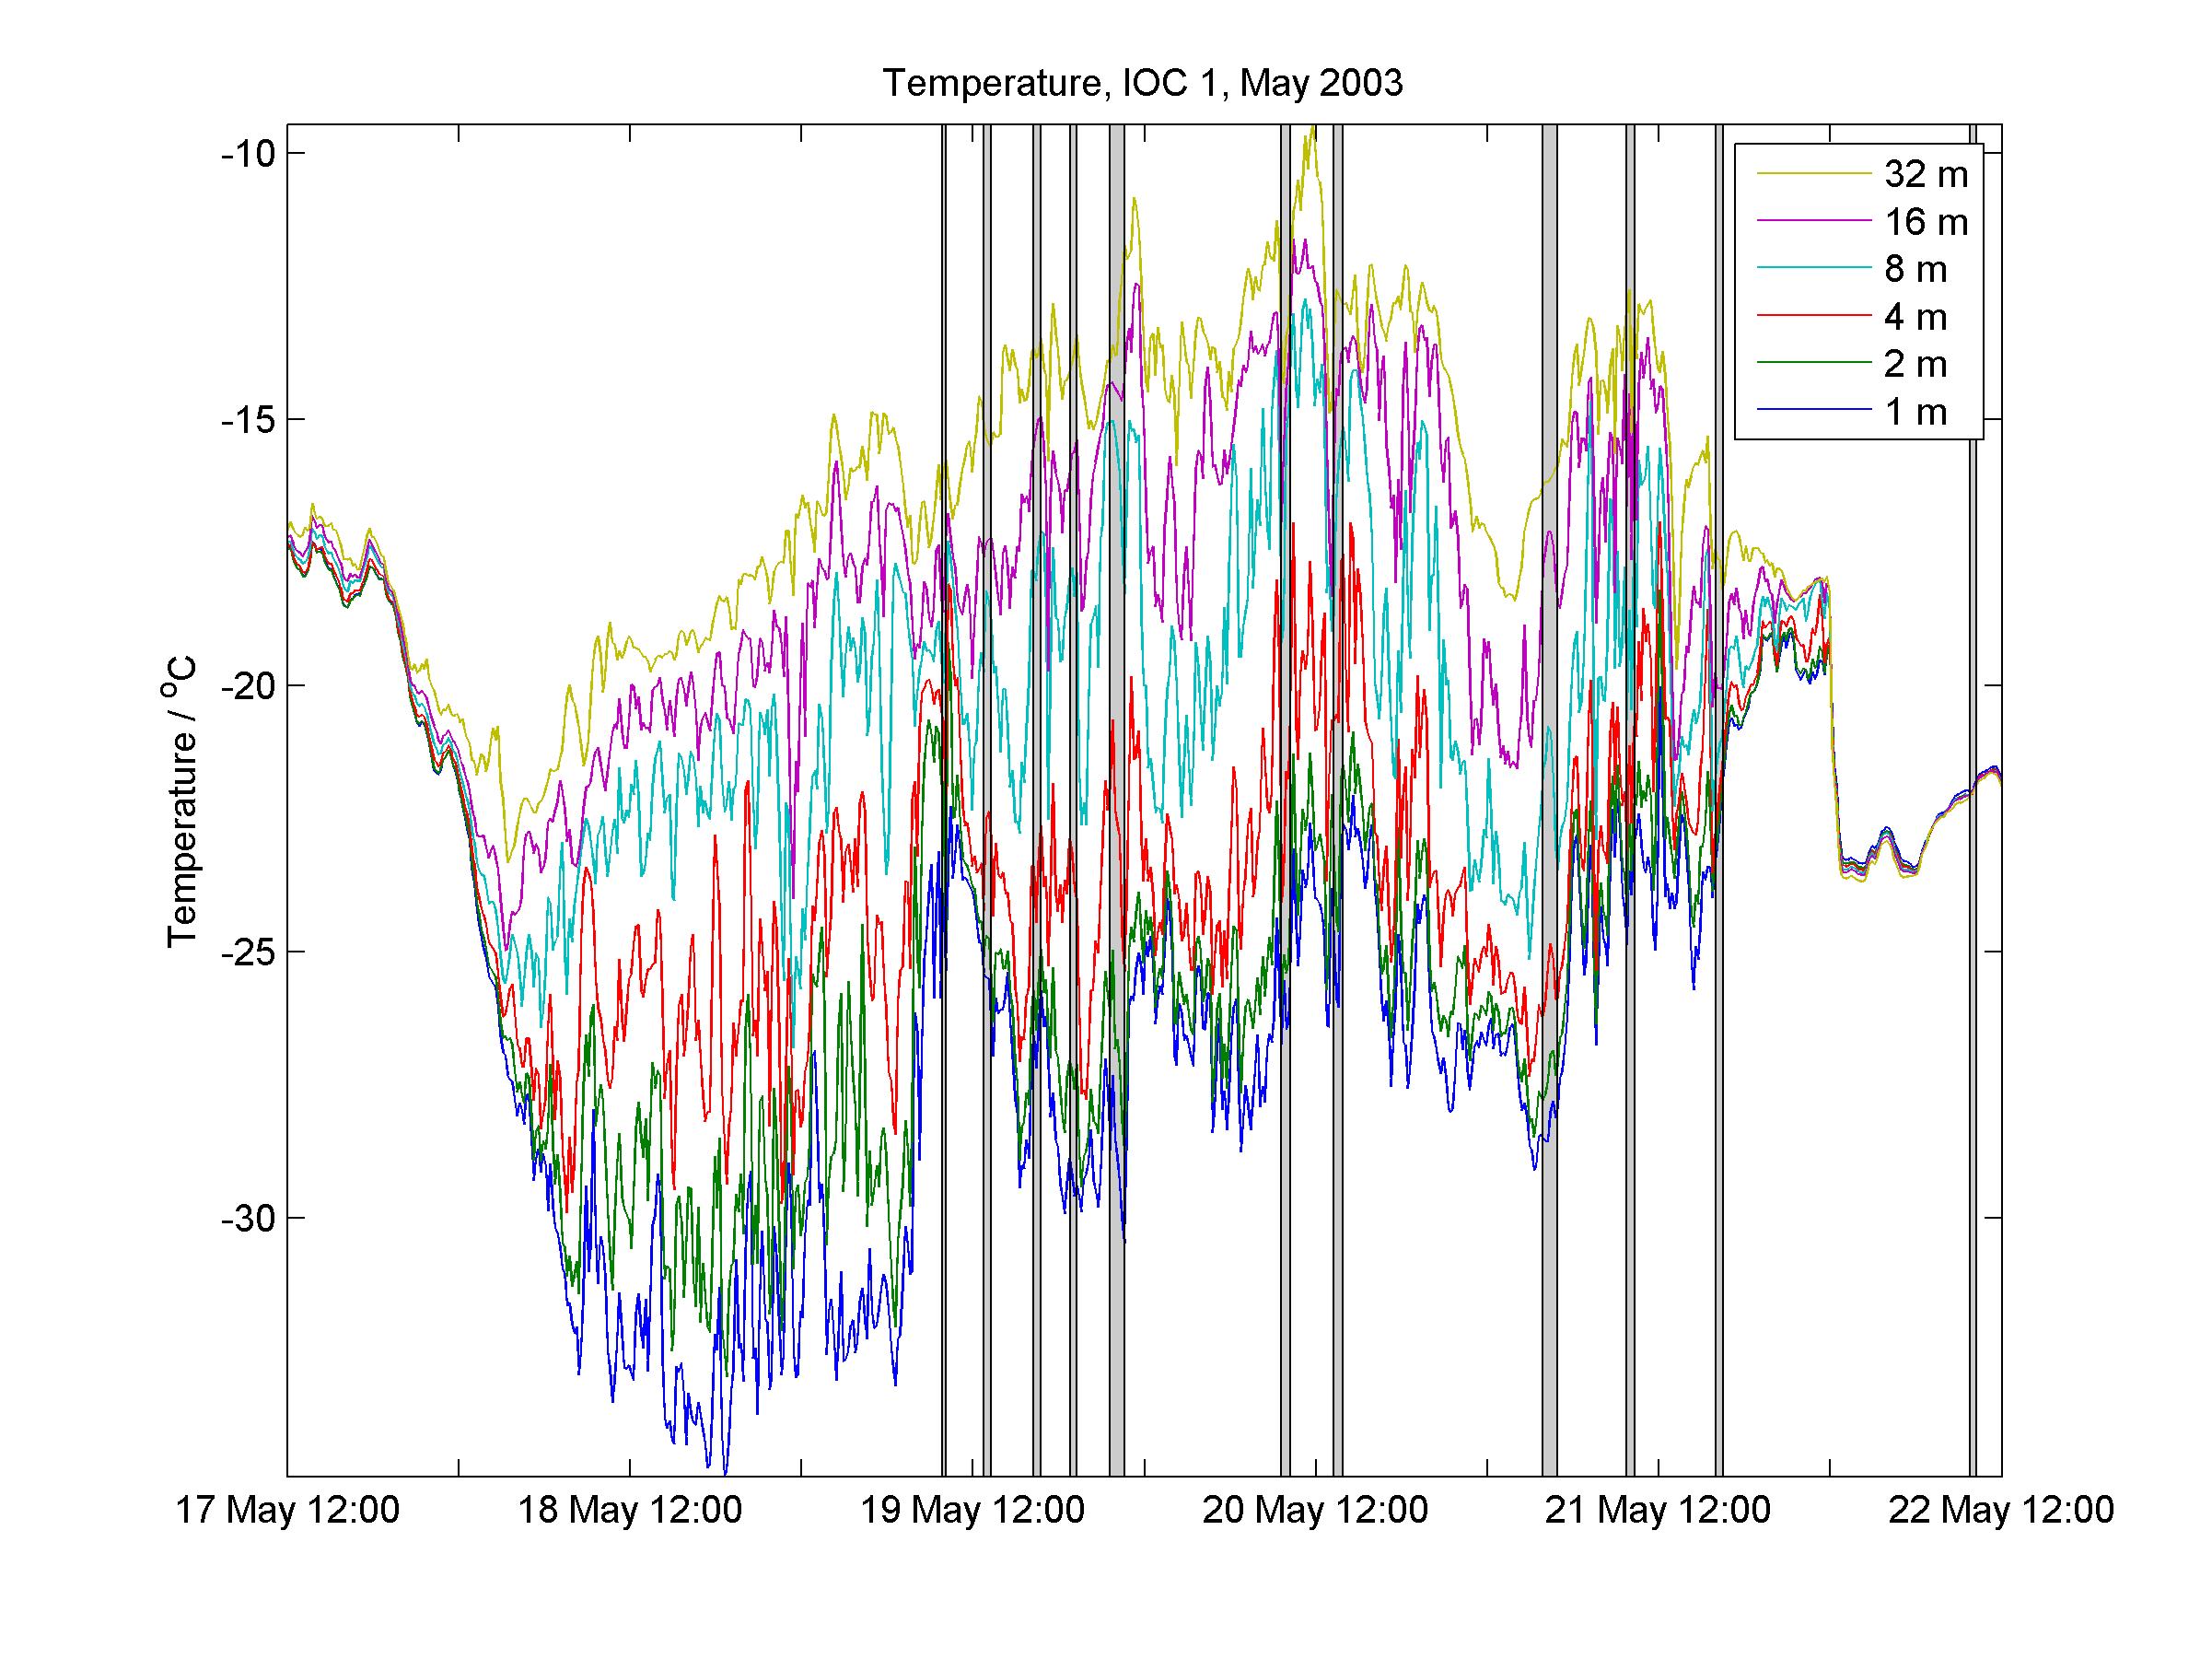
Temperatures at 1m, 2m, 4m, 8m, 16m and 32m.
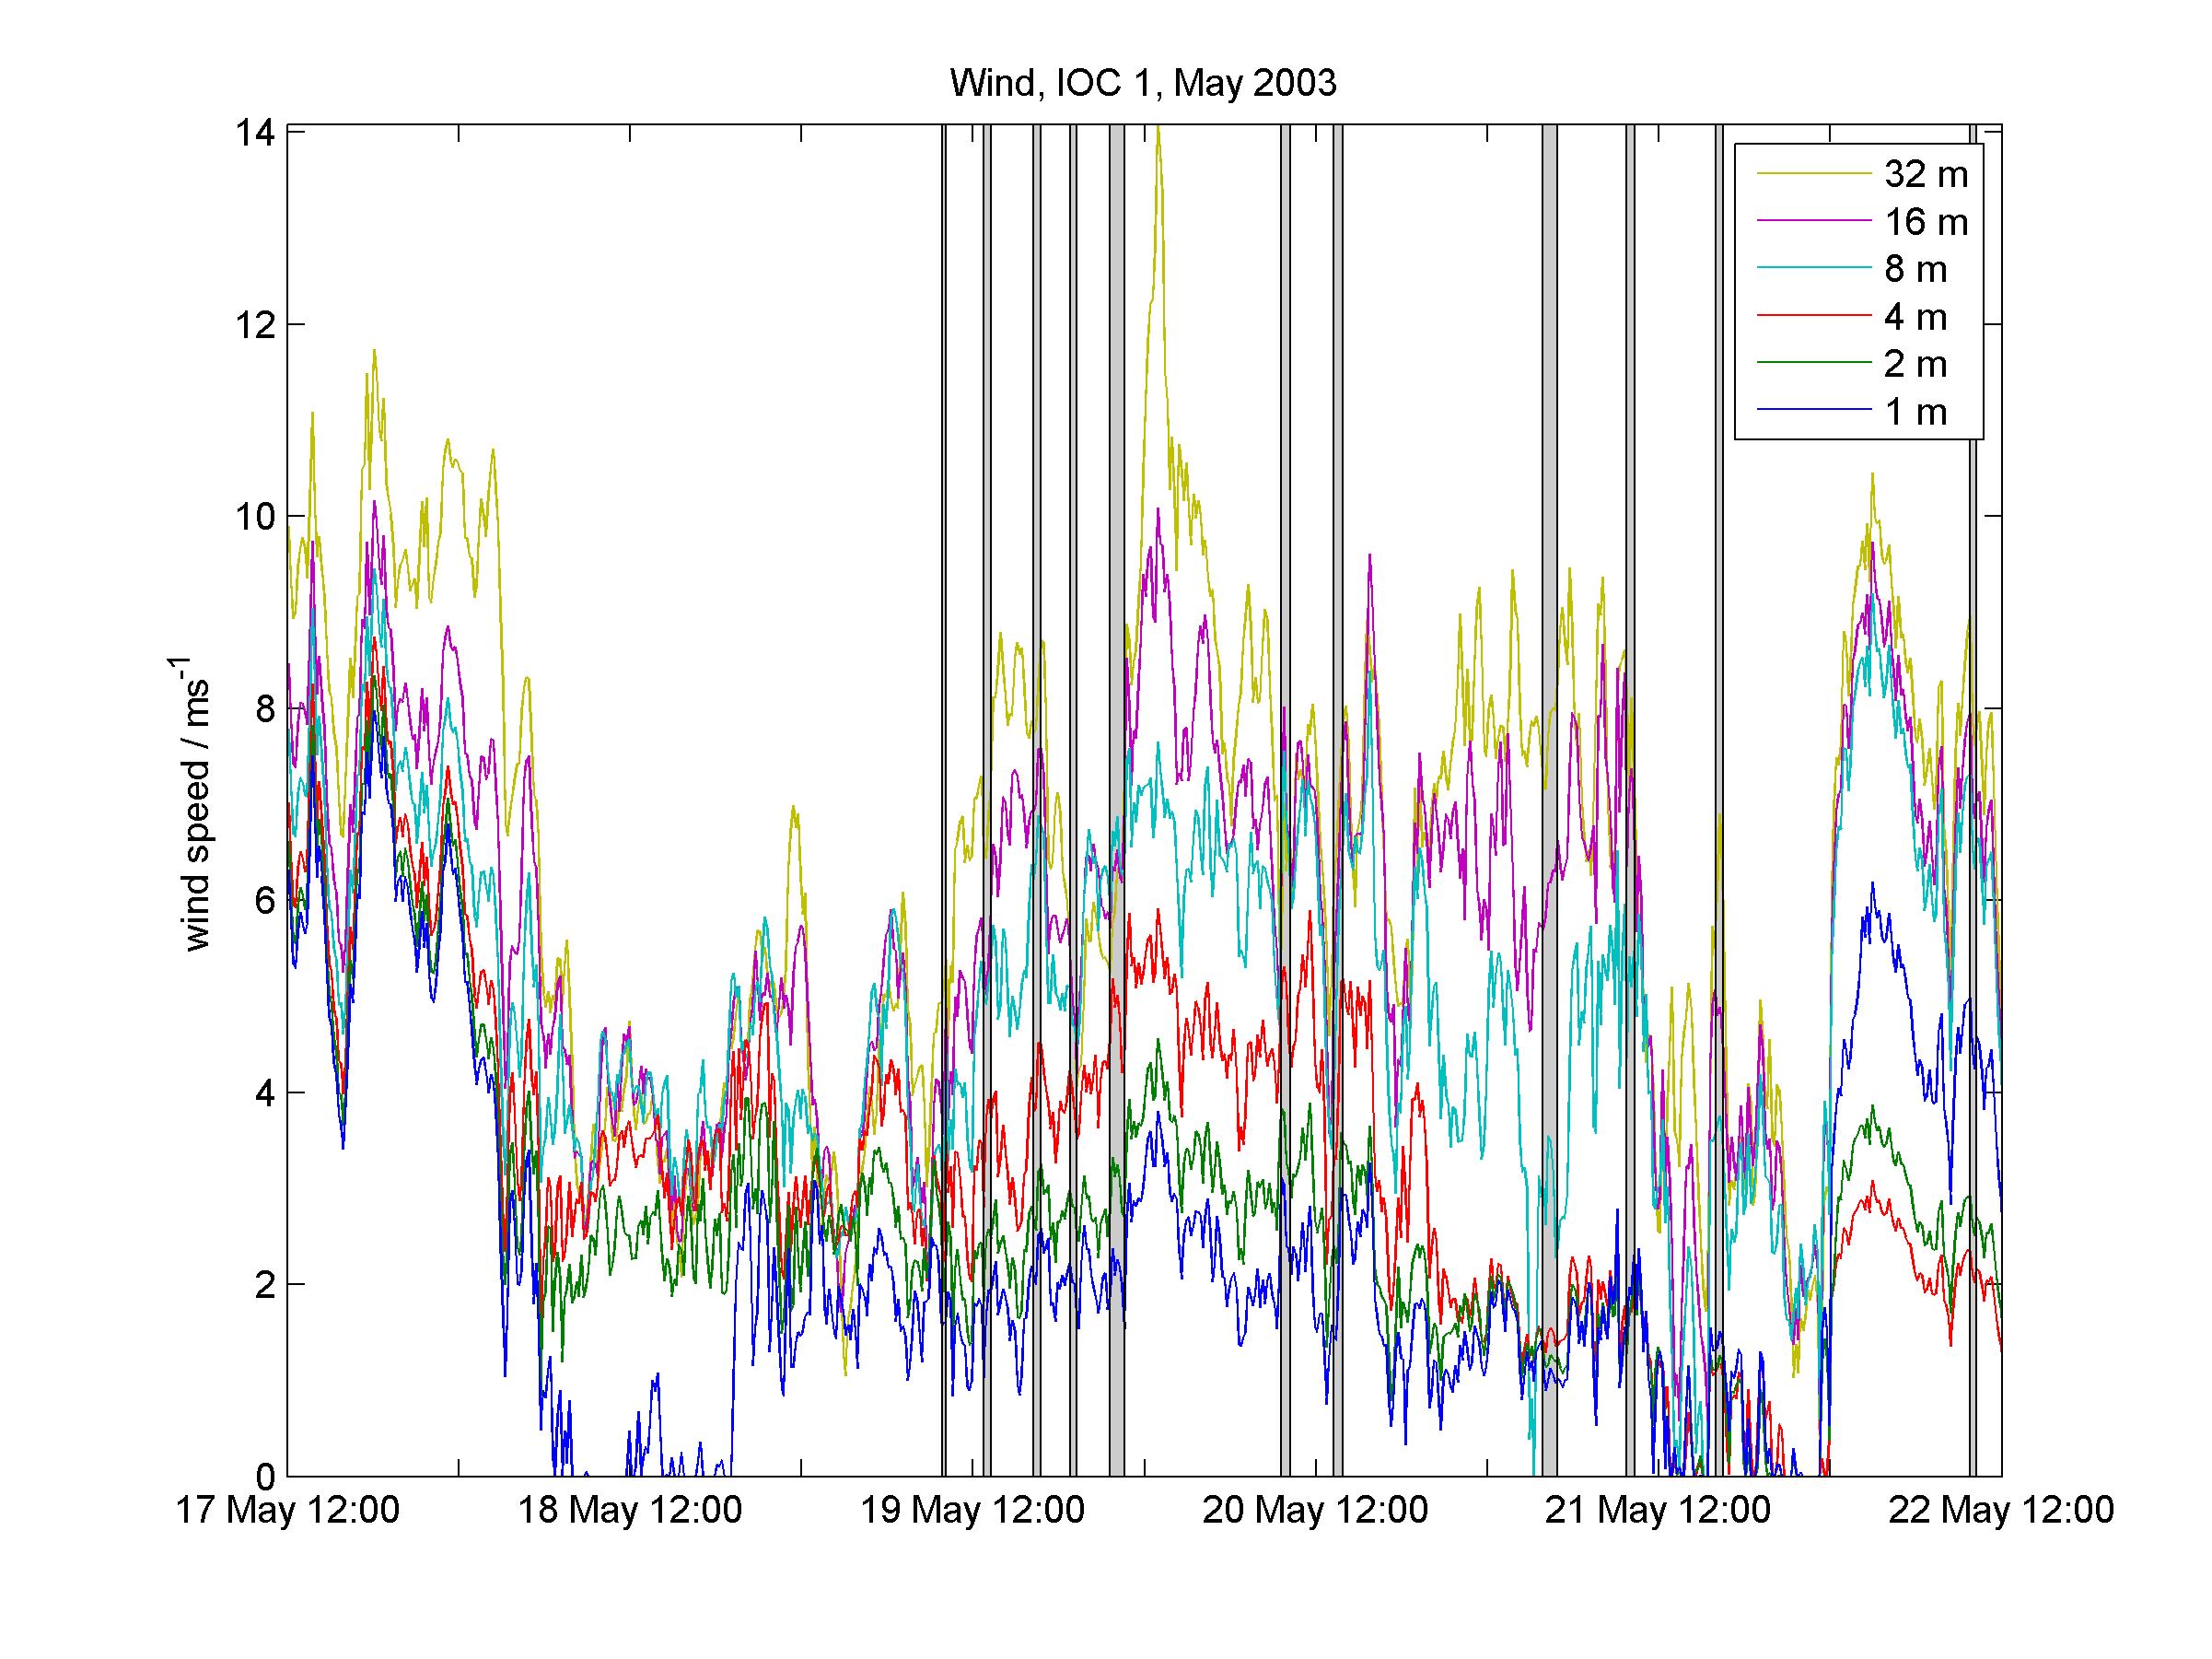
Bars indicate when a successful (if limited altitude) tethersonde flight took place.
Colour coding is given in the legend.
Winds at 1m, 2m, 4m, 8m, 16m and 32m.
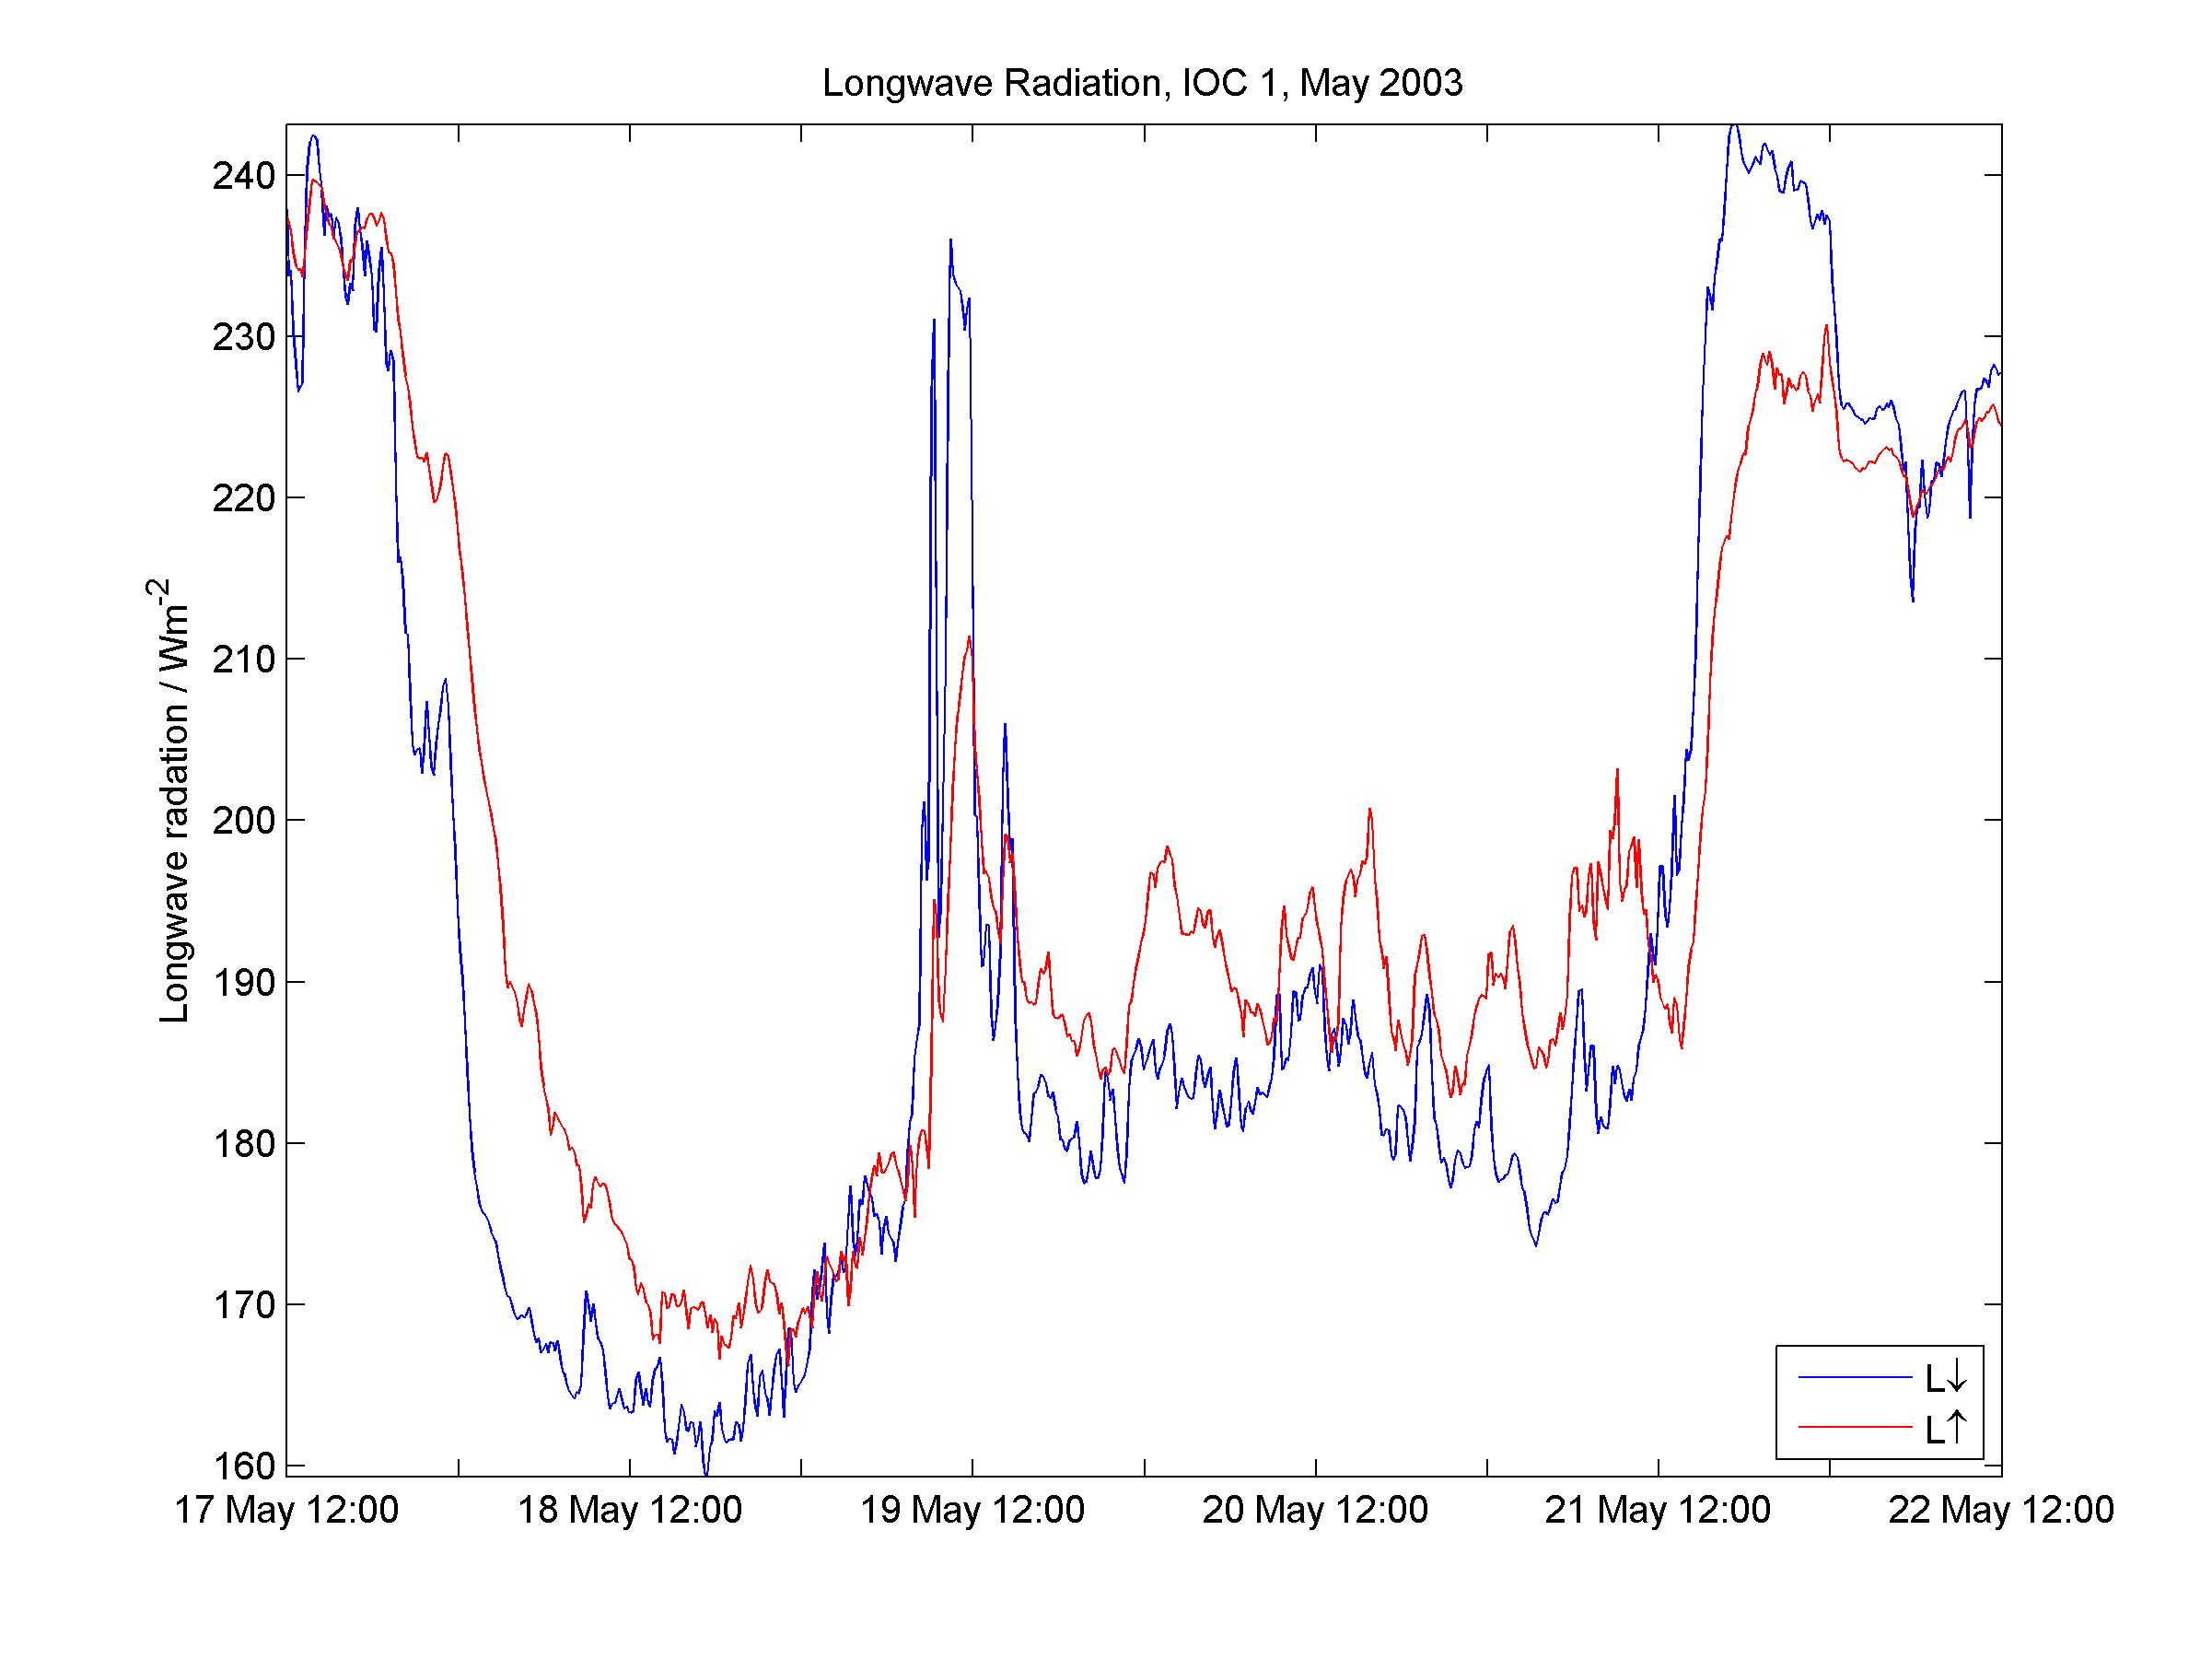
Near-surface longwave radiation.
Halley radiosonde data for May 2003 are here
Temperature data for May 2003 are here: 1,2,4,8 16 32 m.
Wind speed data for May 2003 are here: 1,2,4,8 16 32 m.
Radiation data for May 2003 are here: S down S up, L down L up.