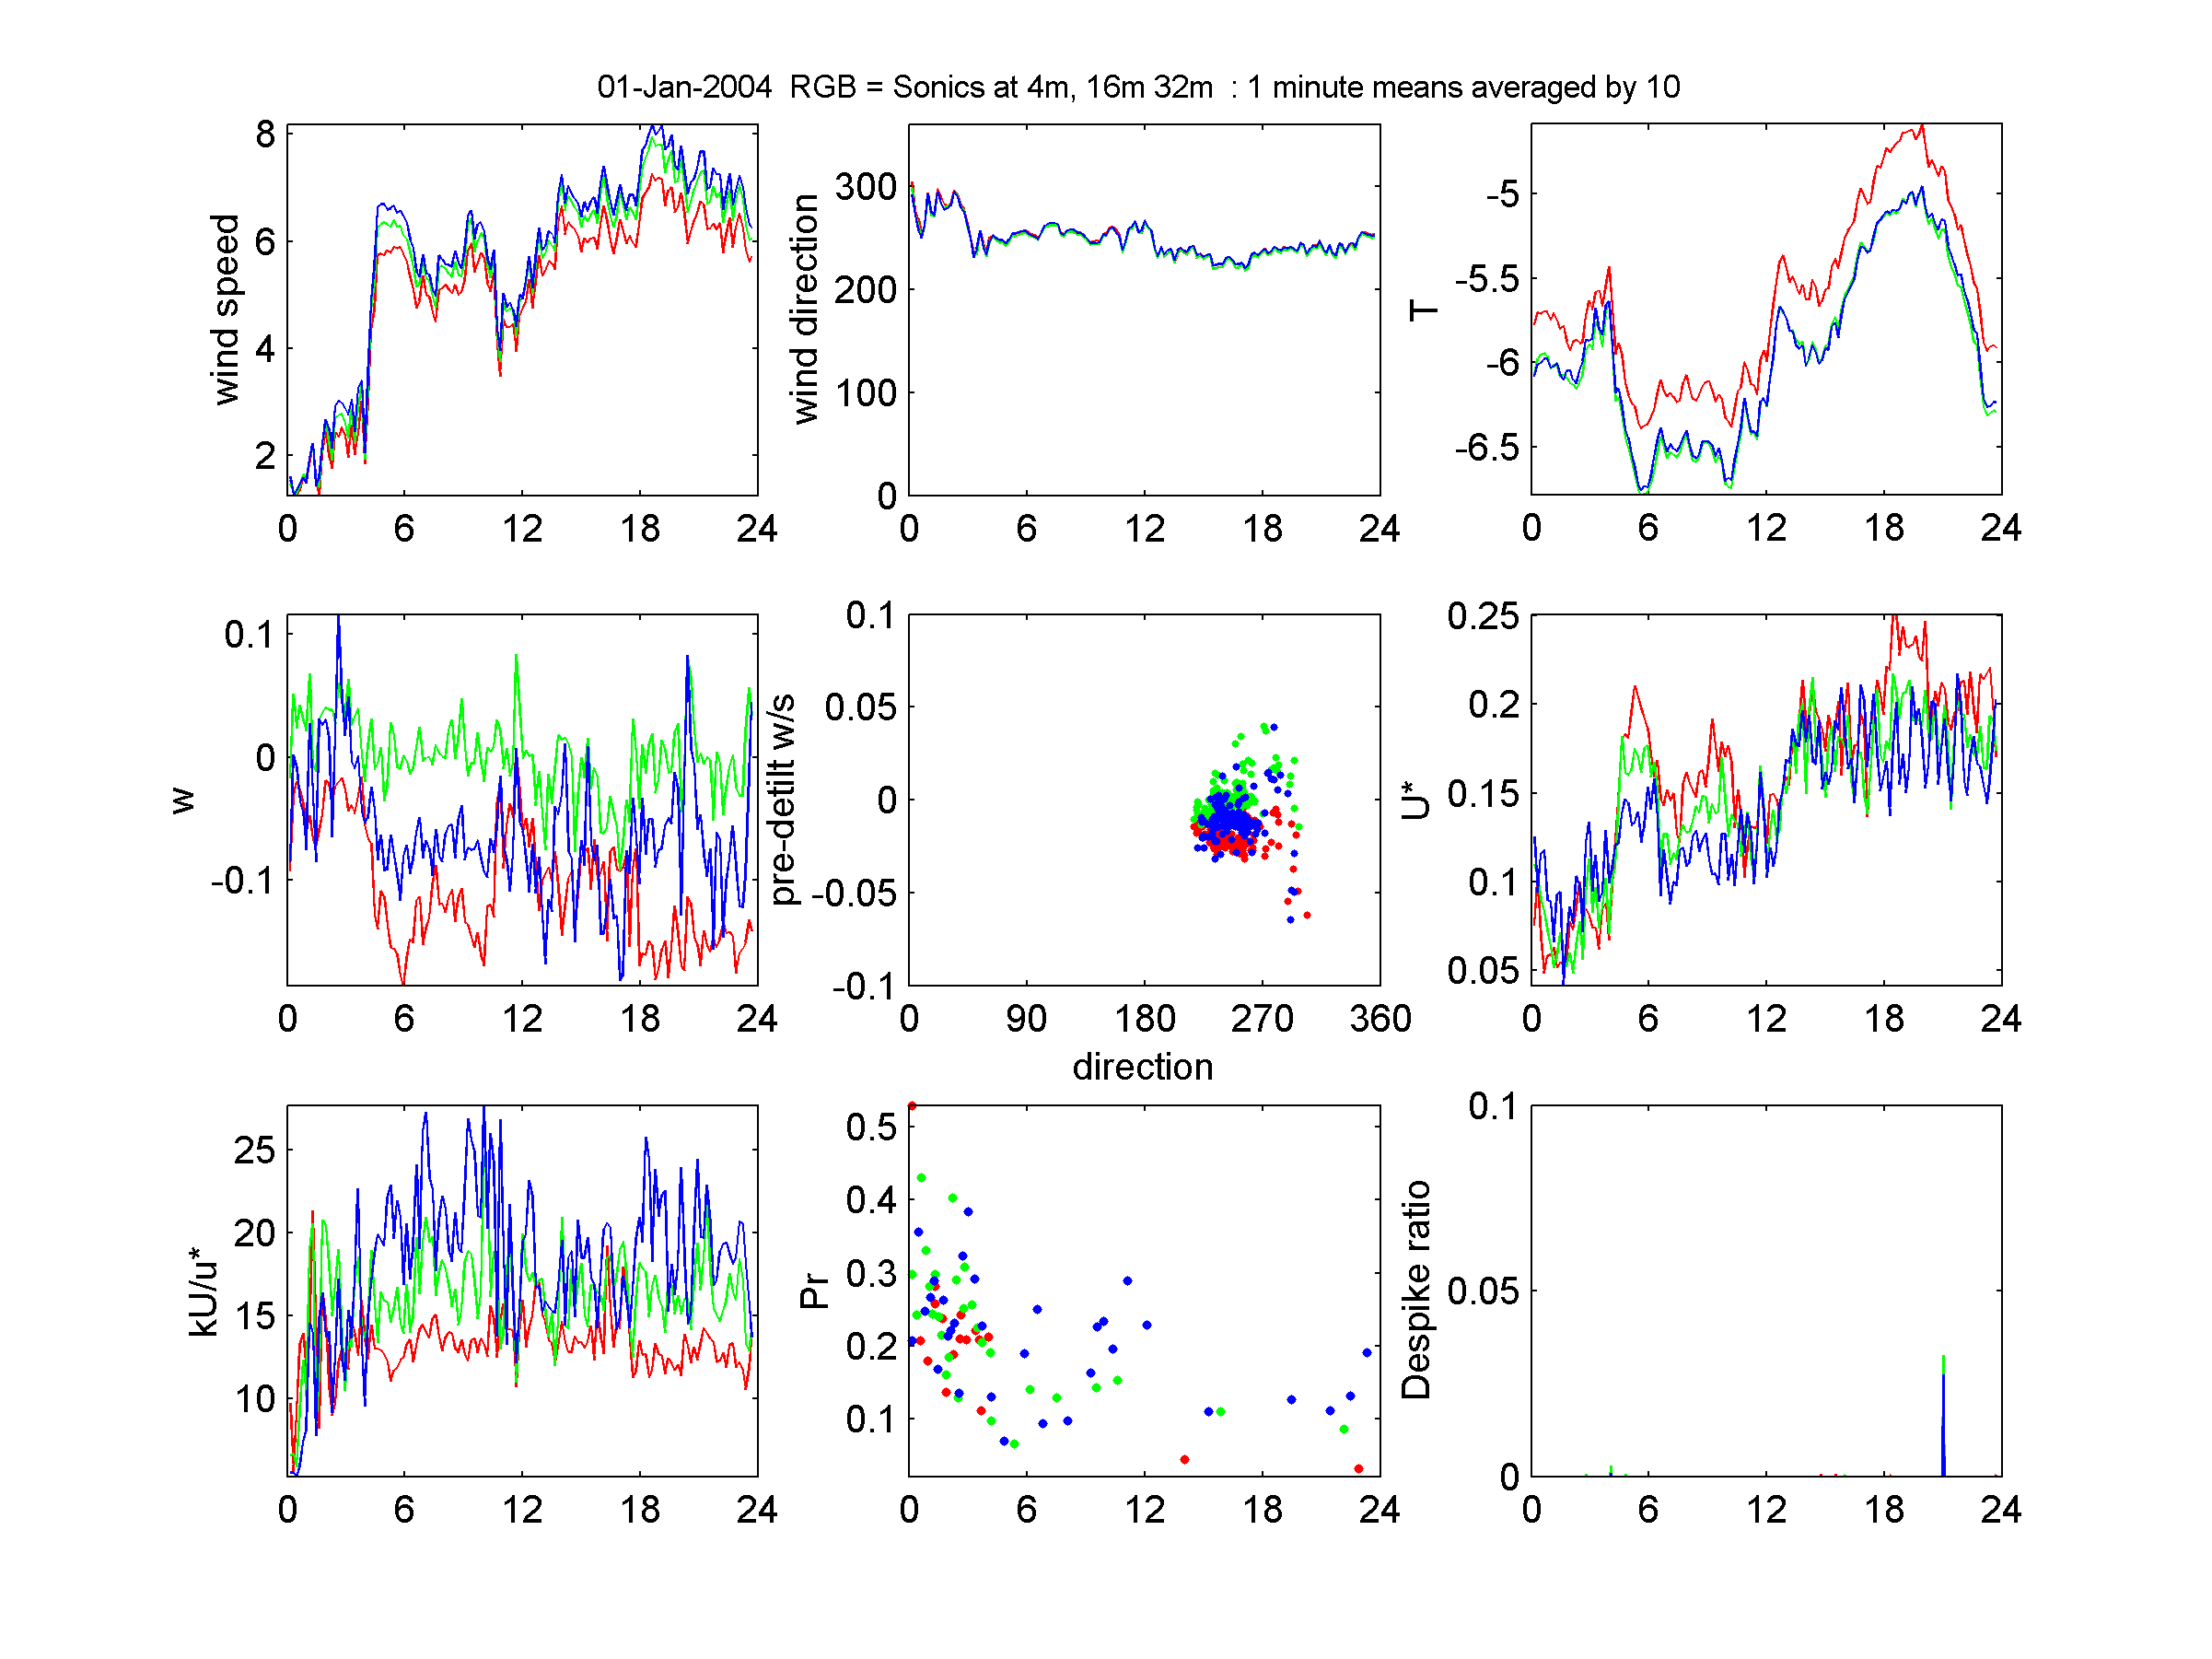
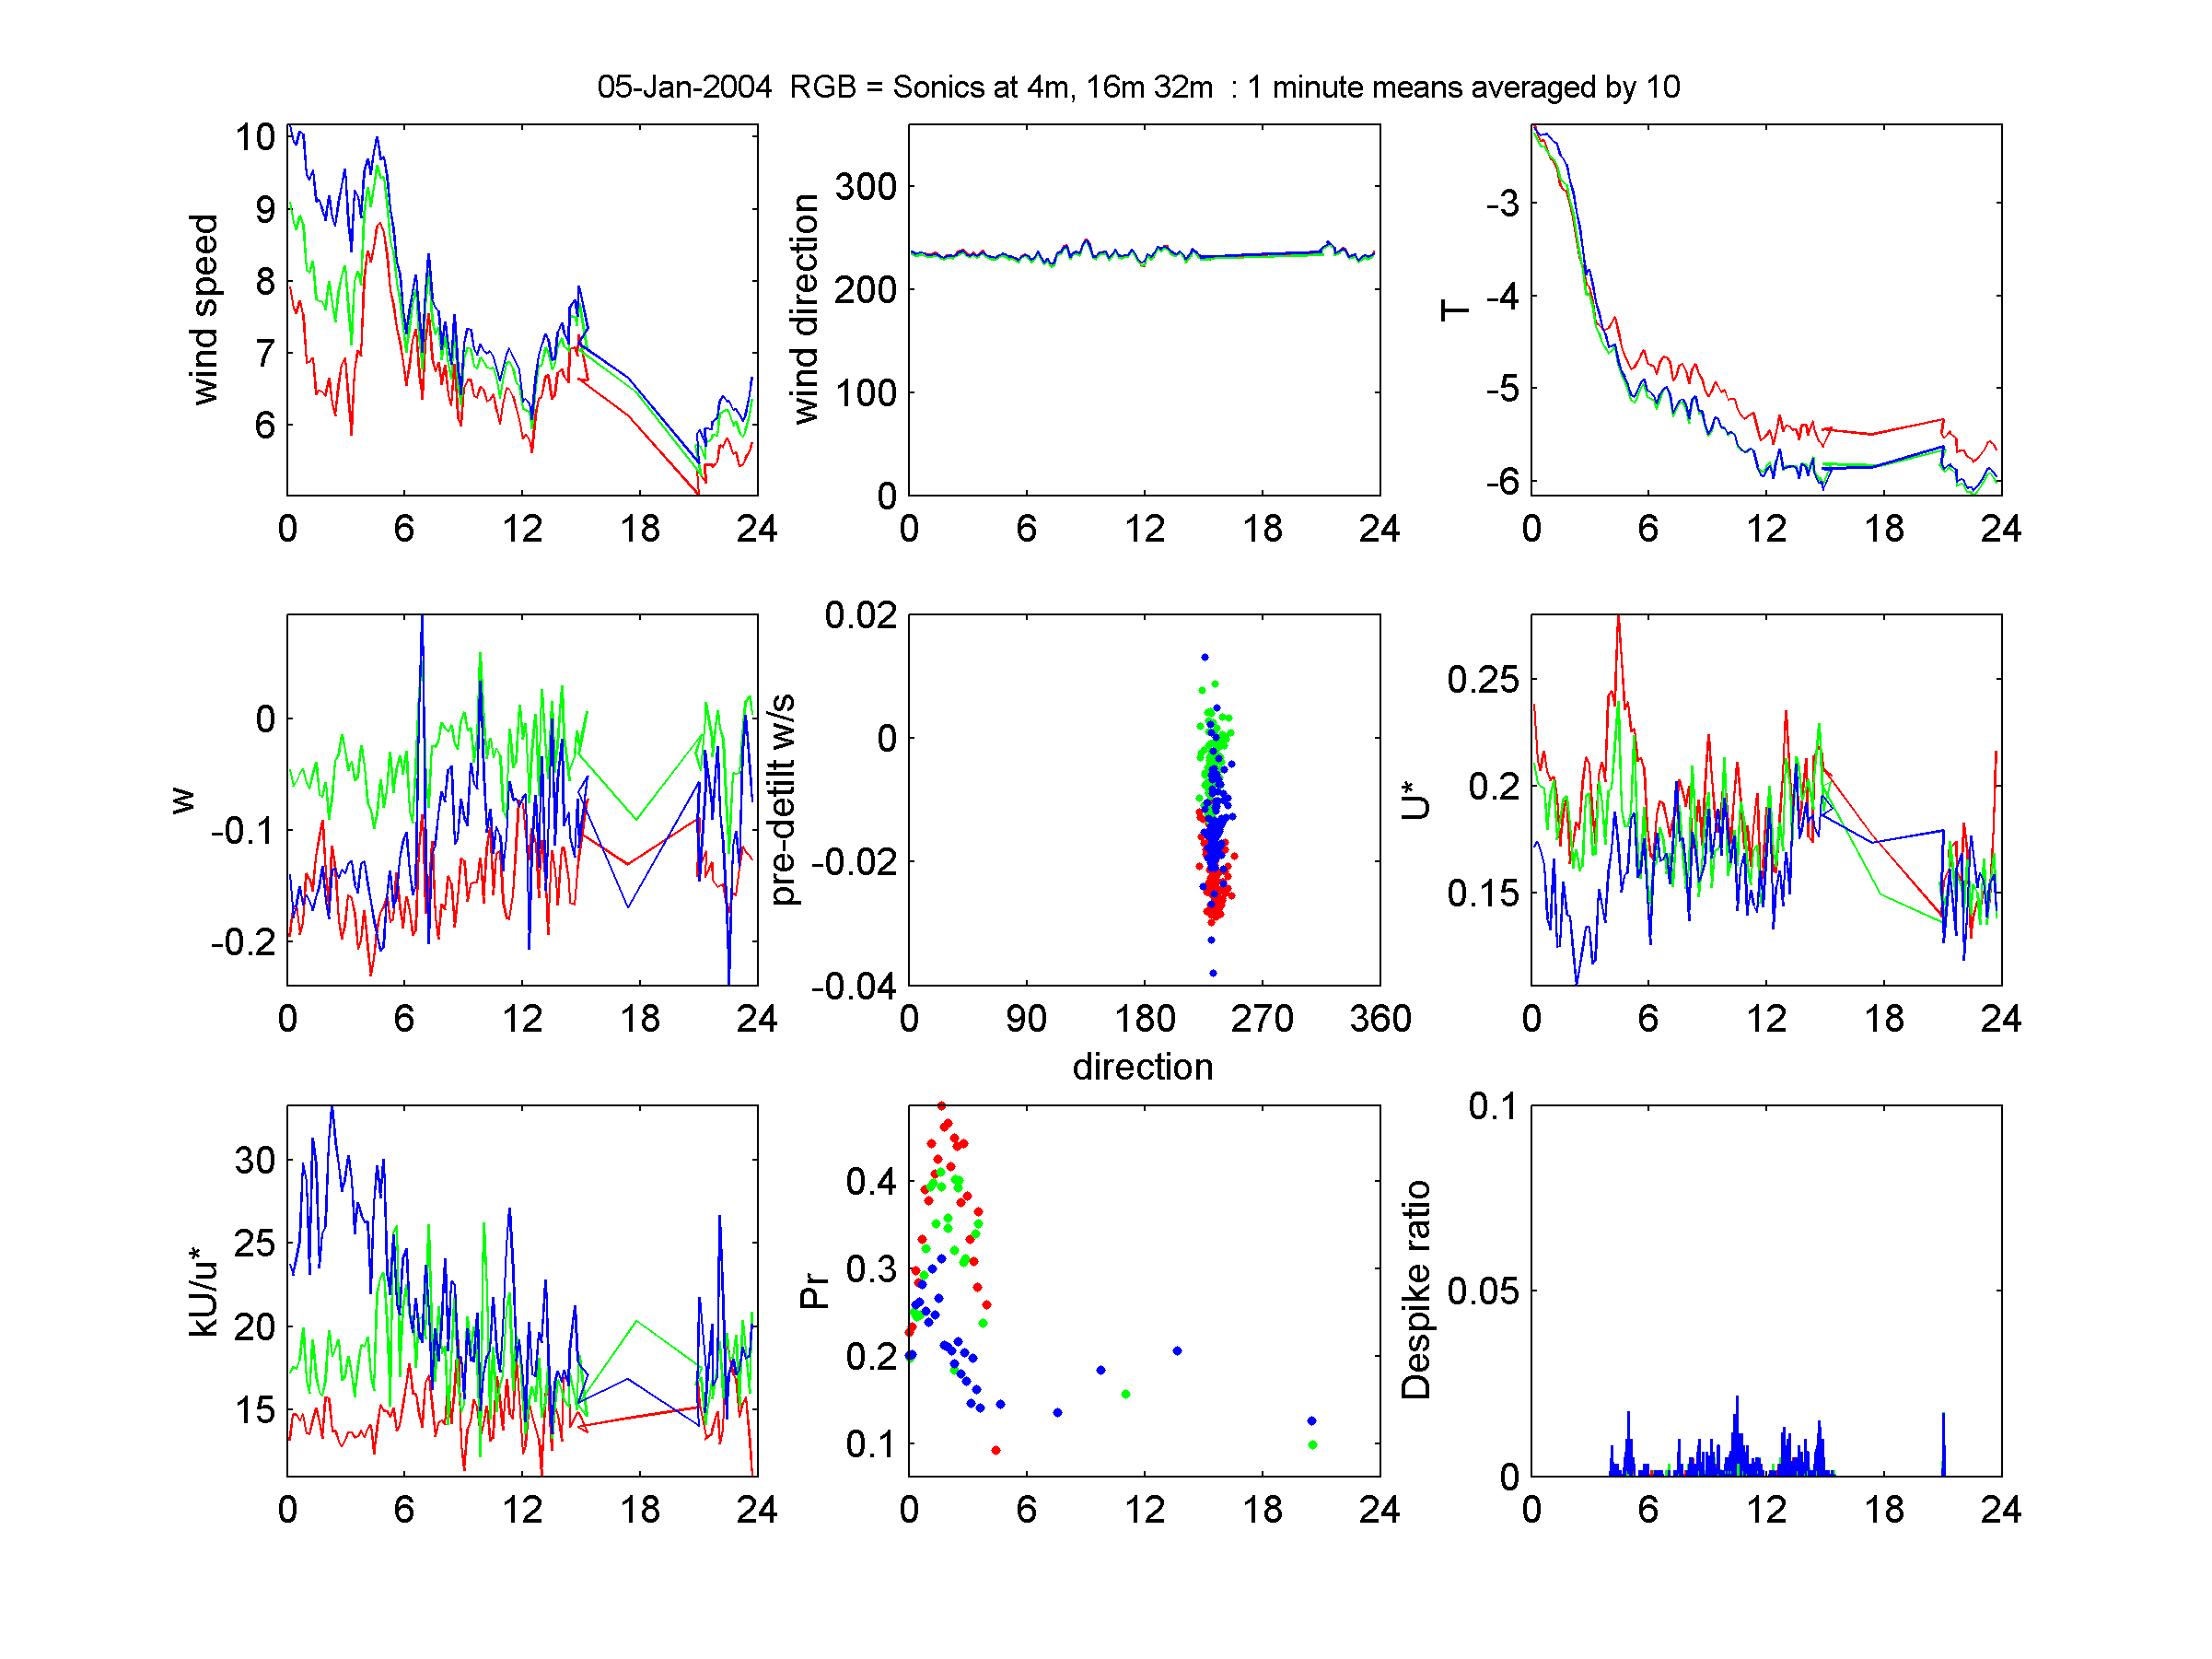
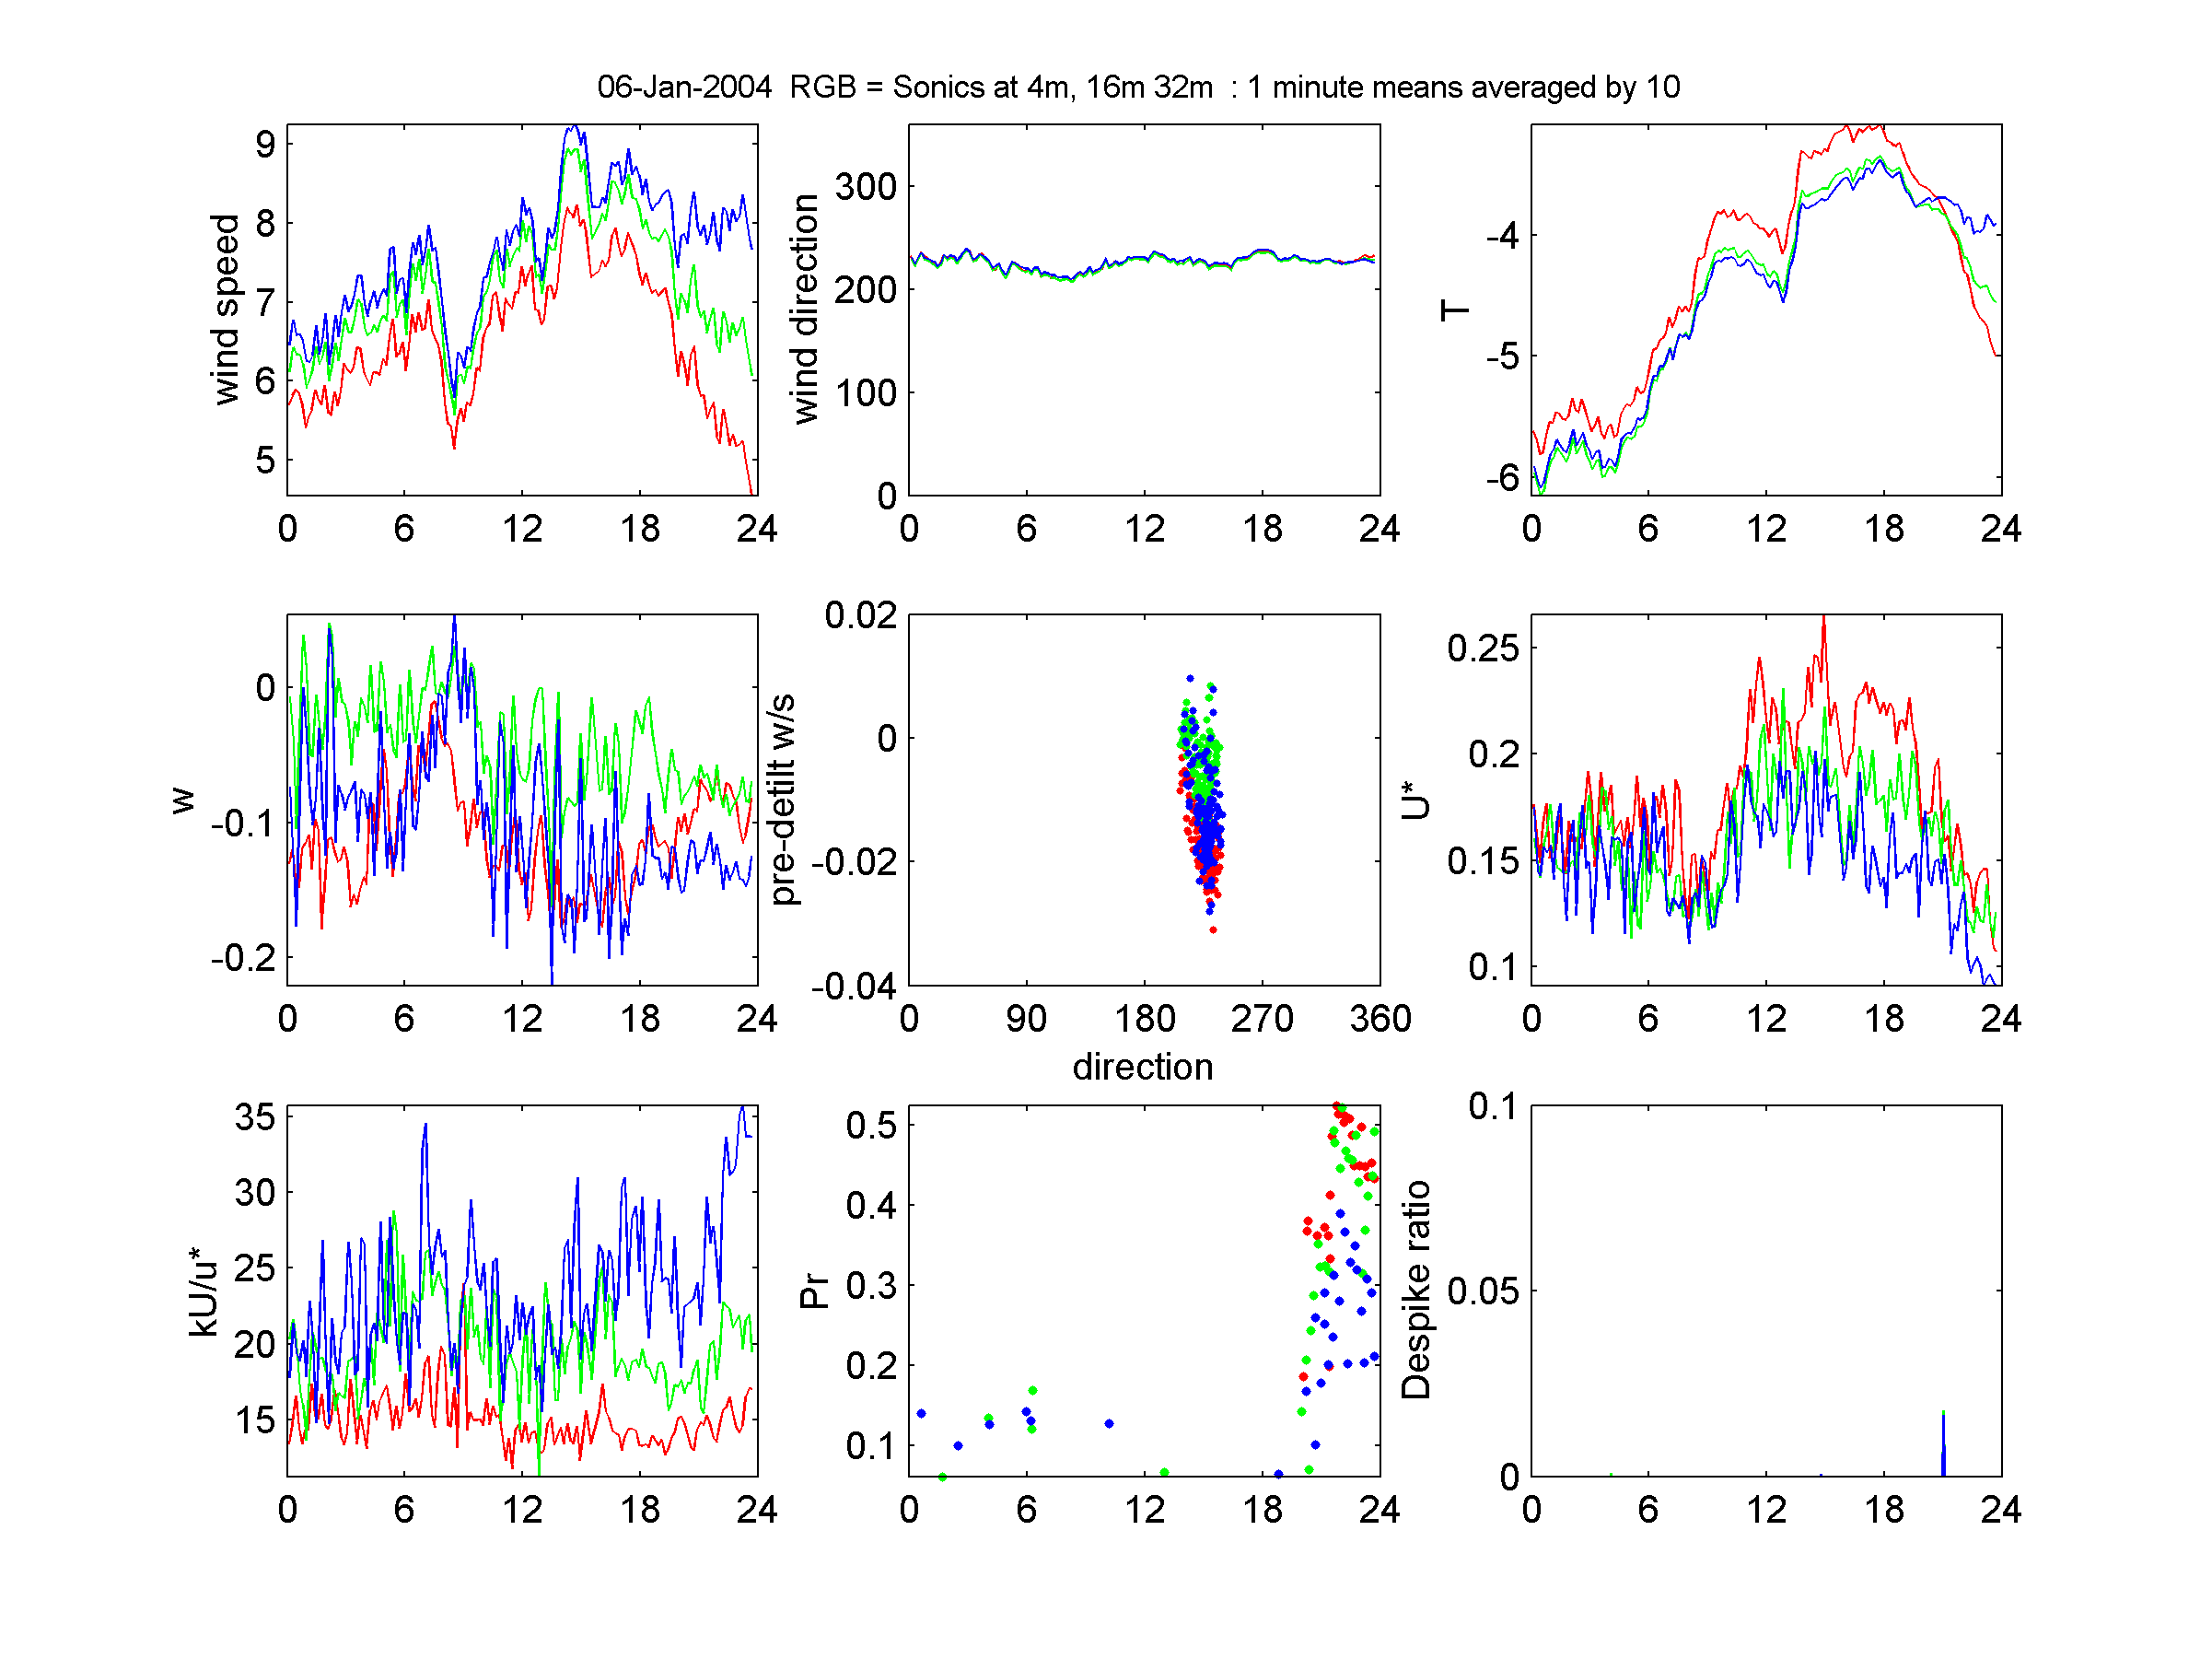
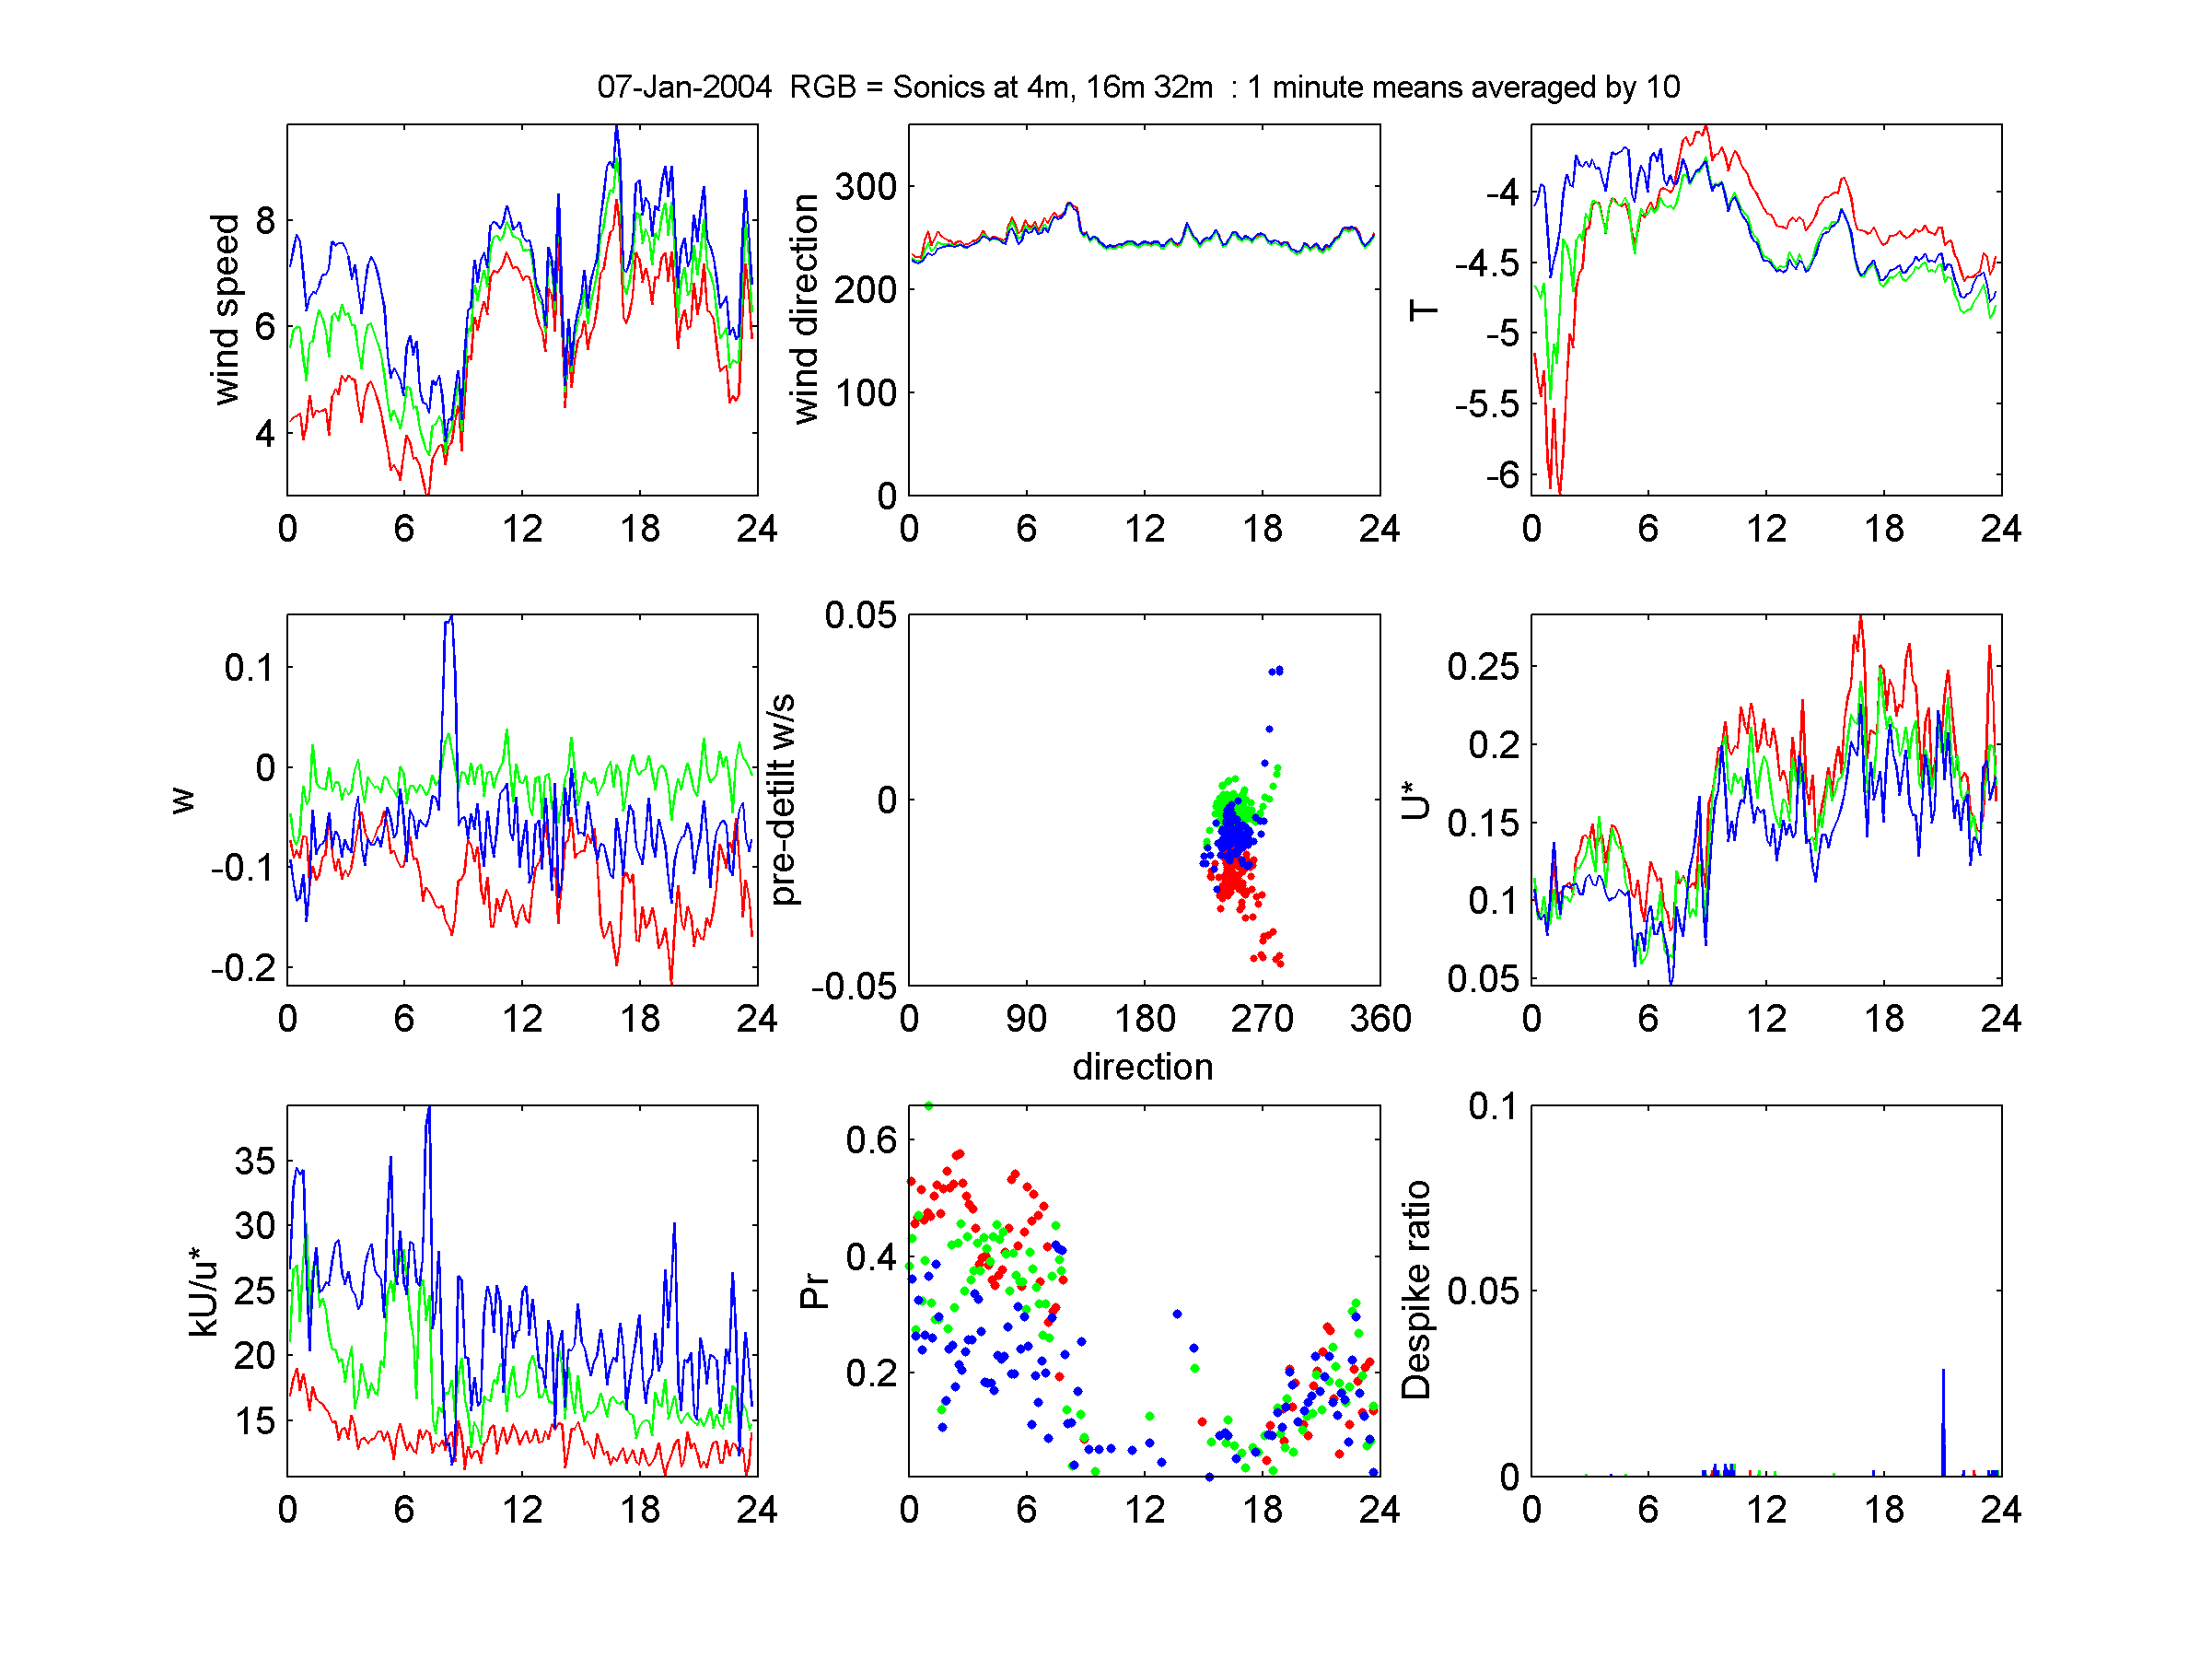
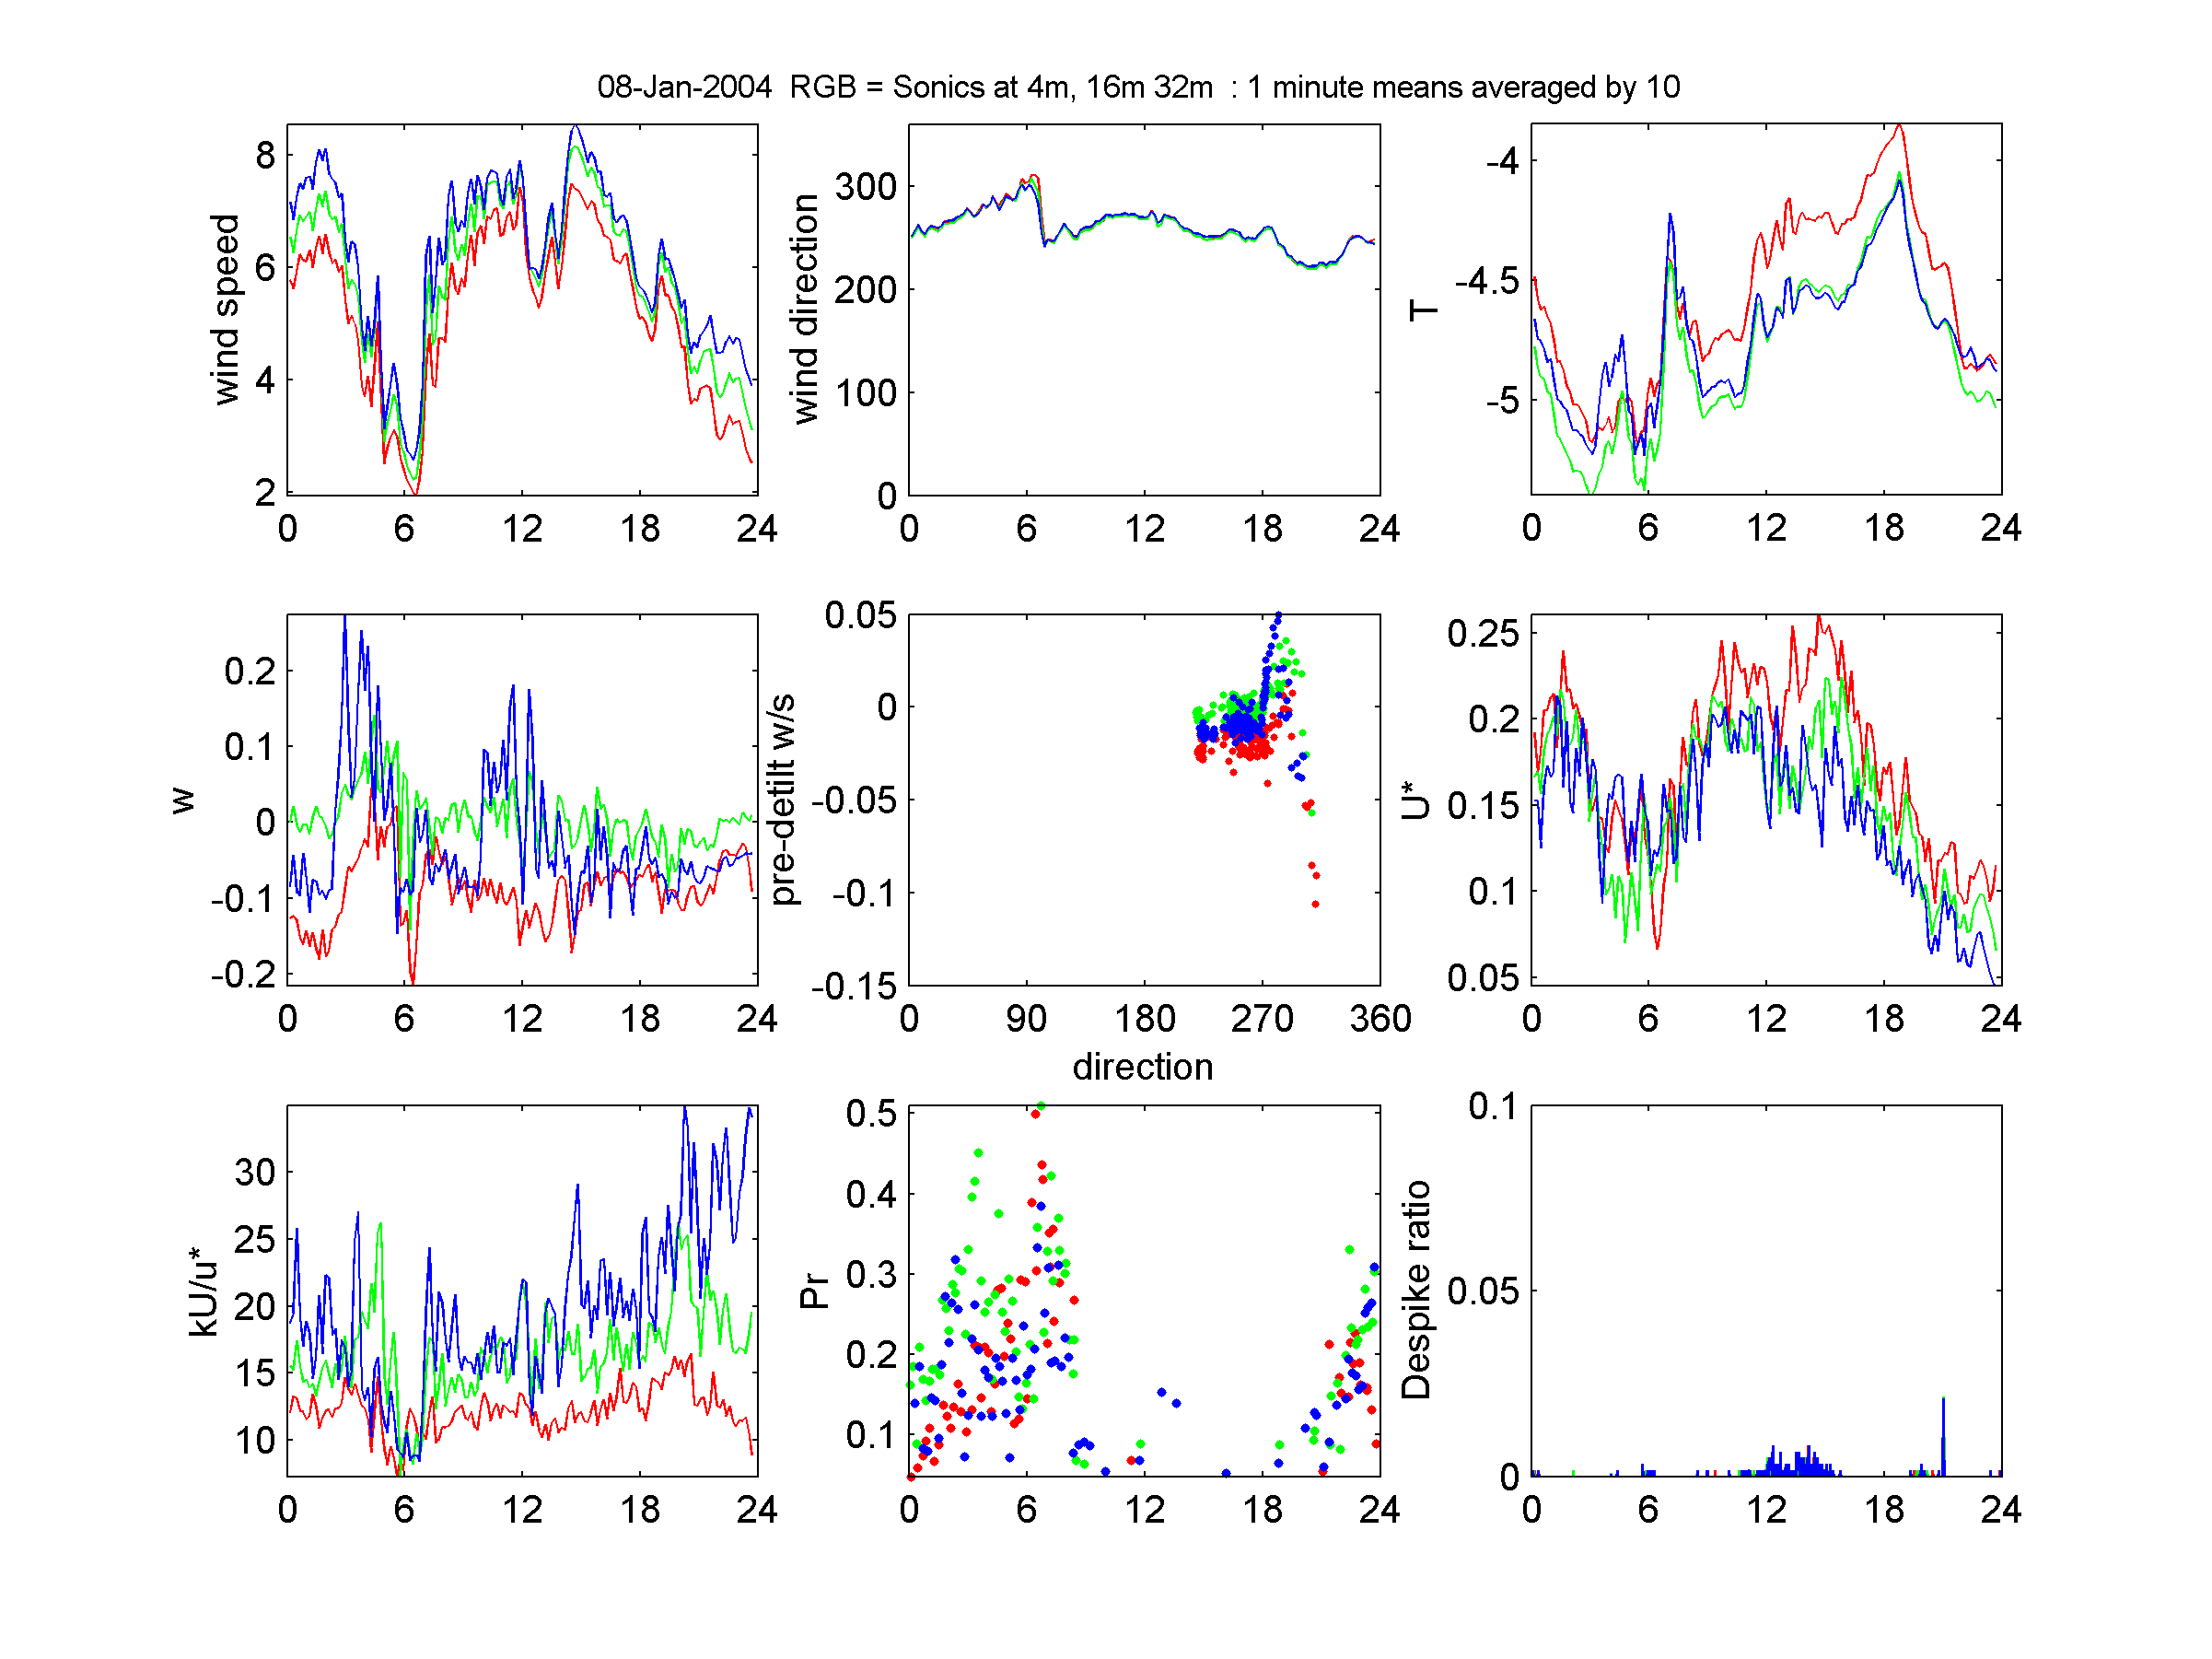
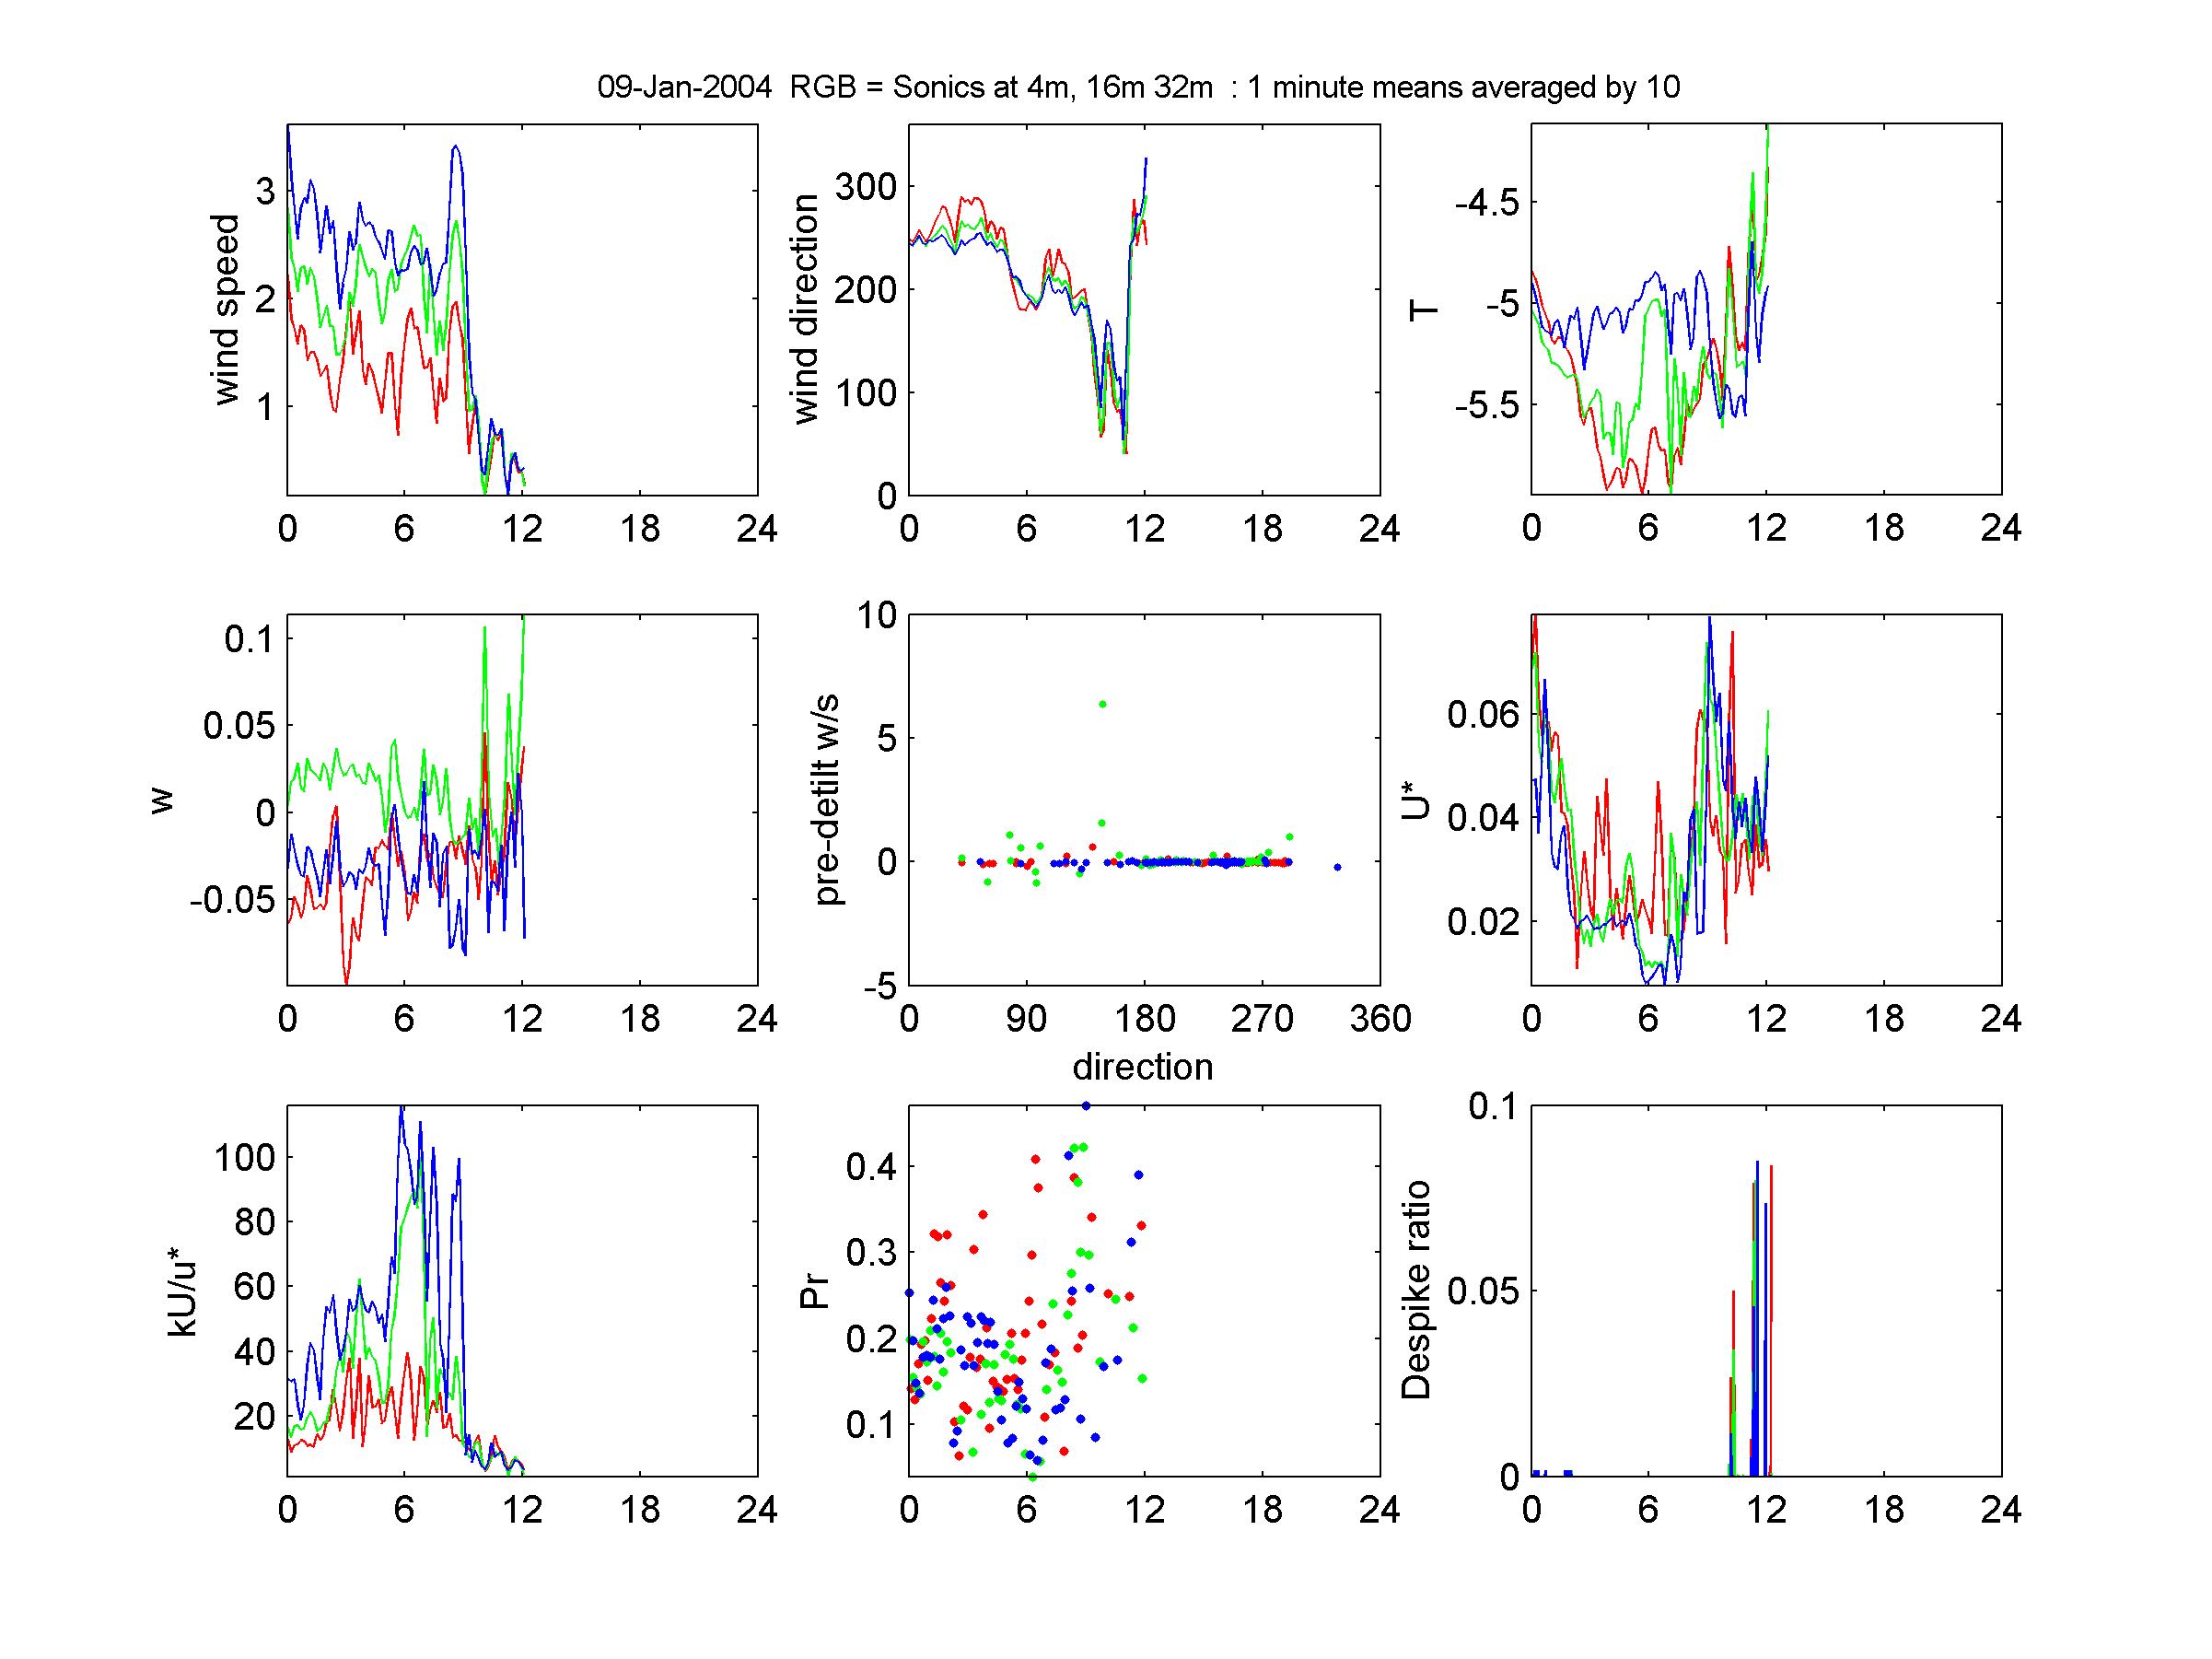
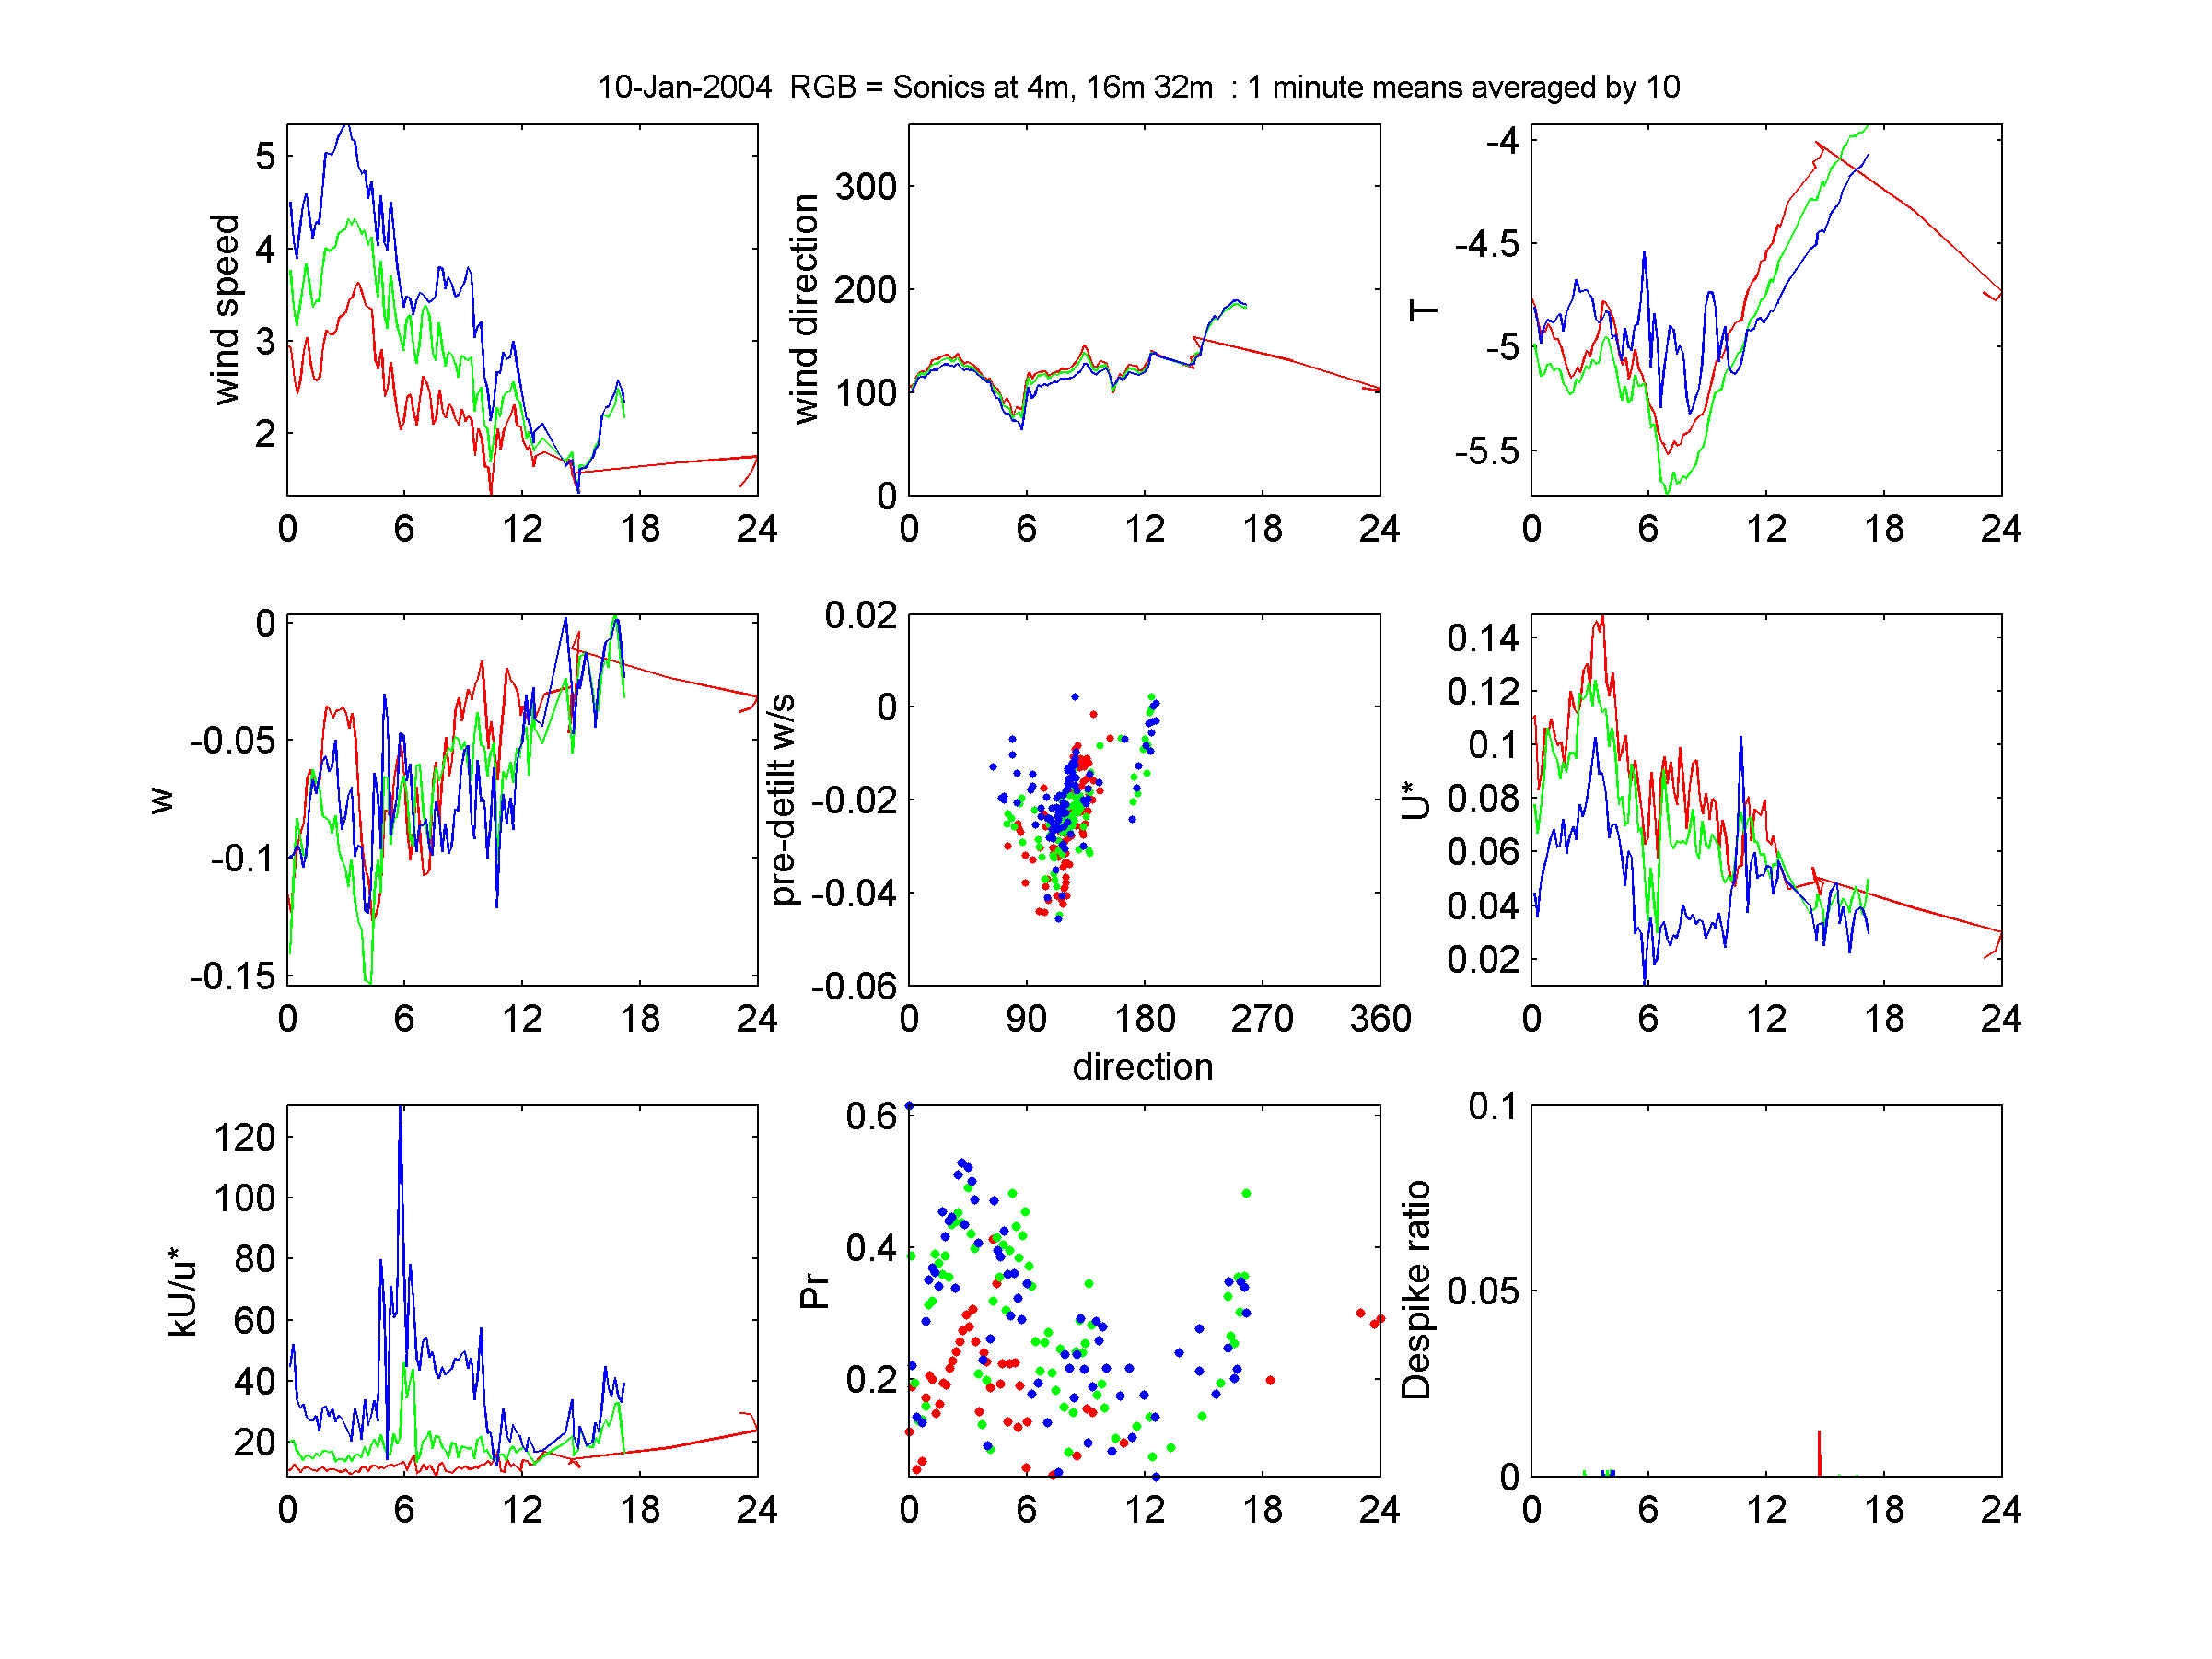
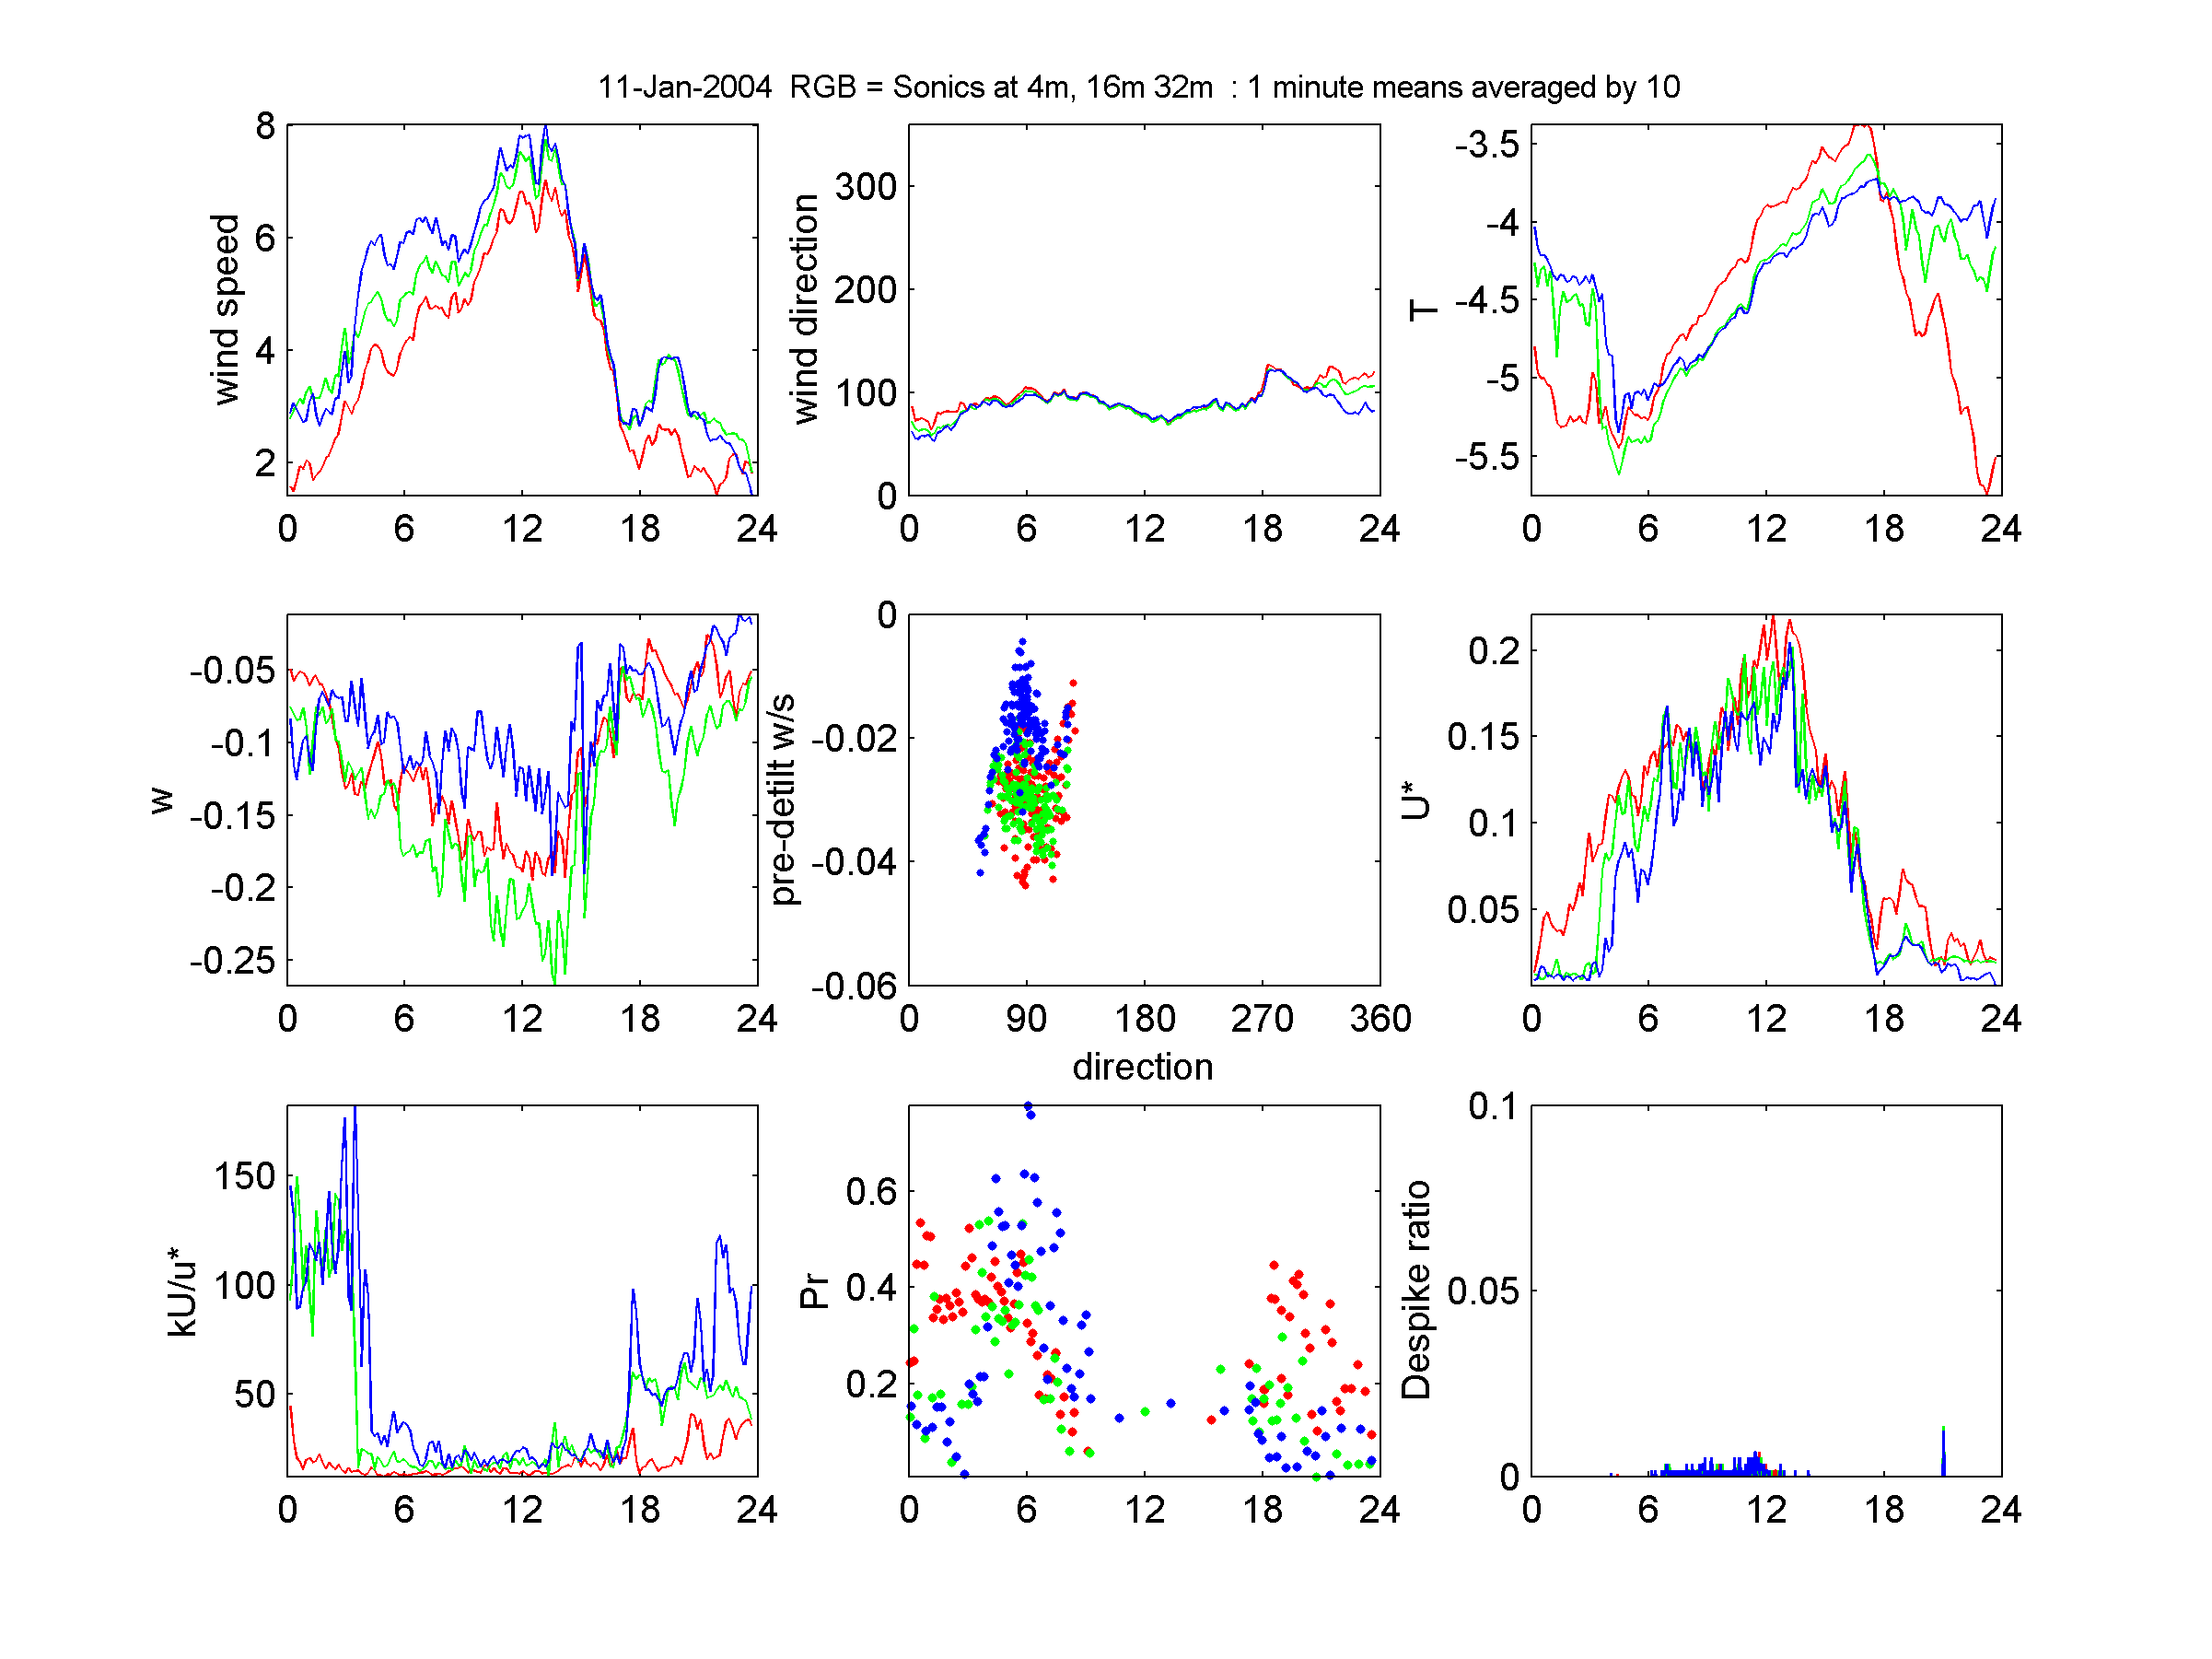
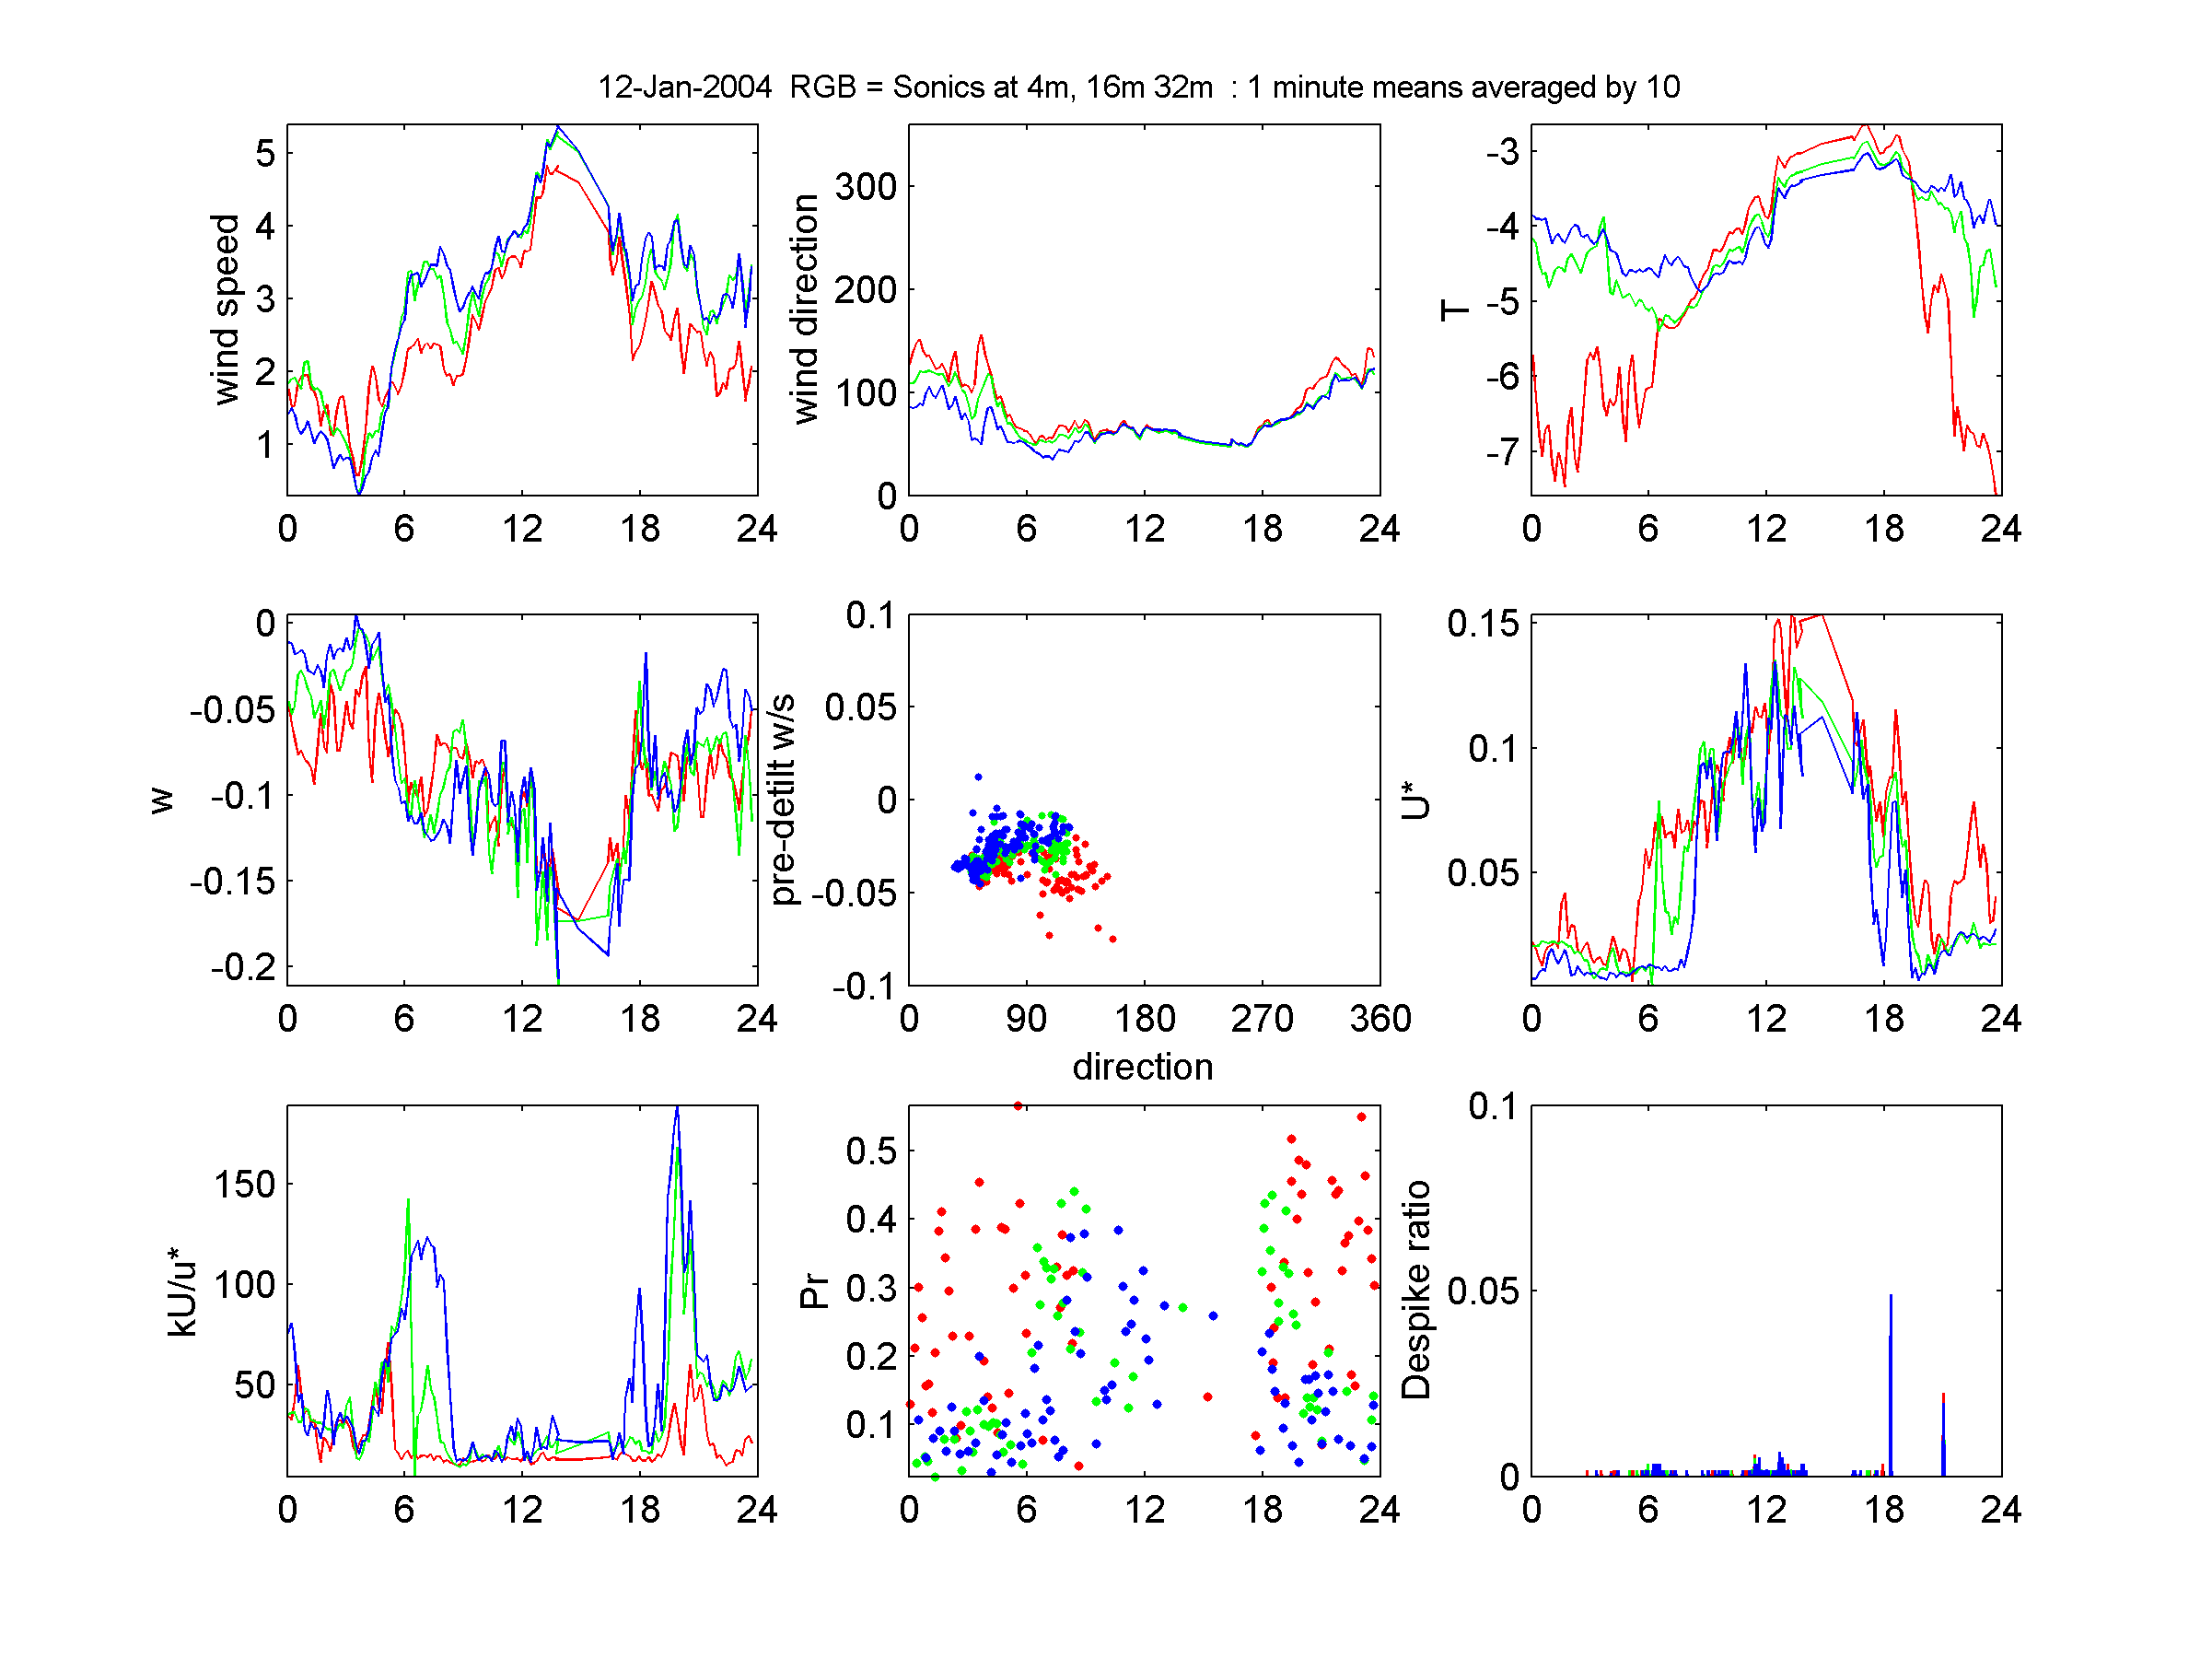
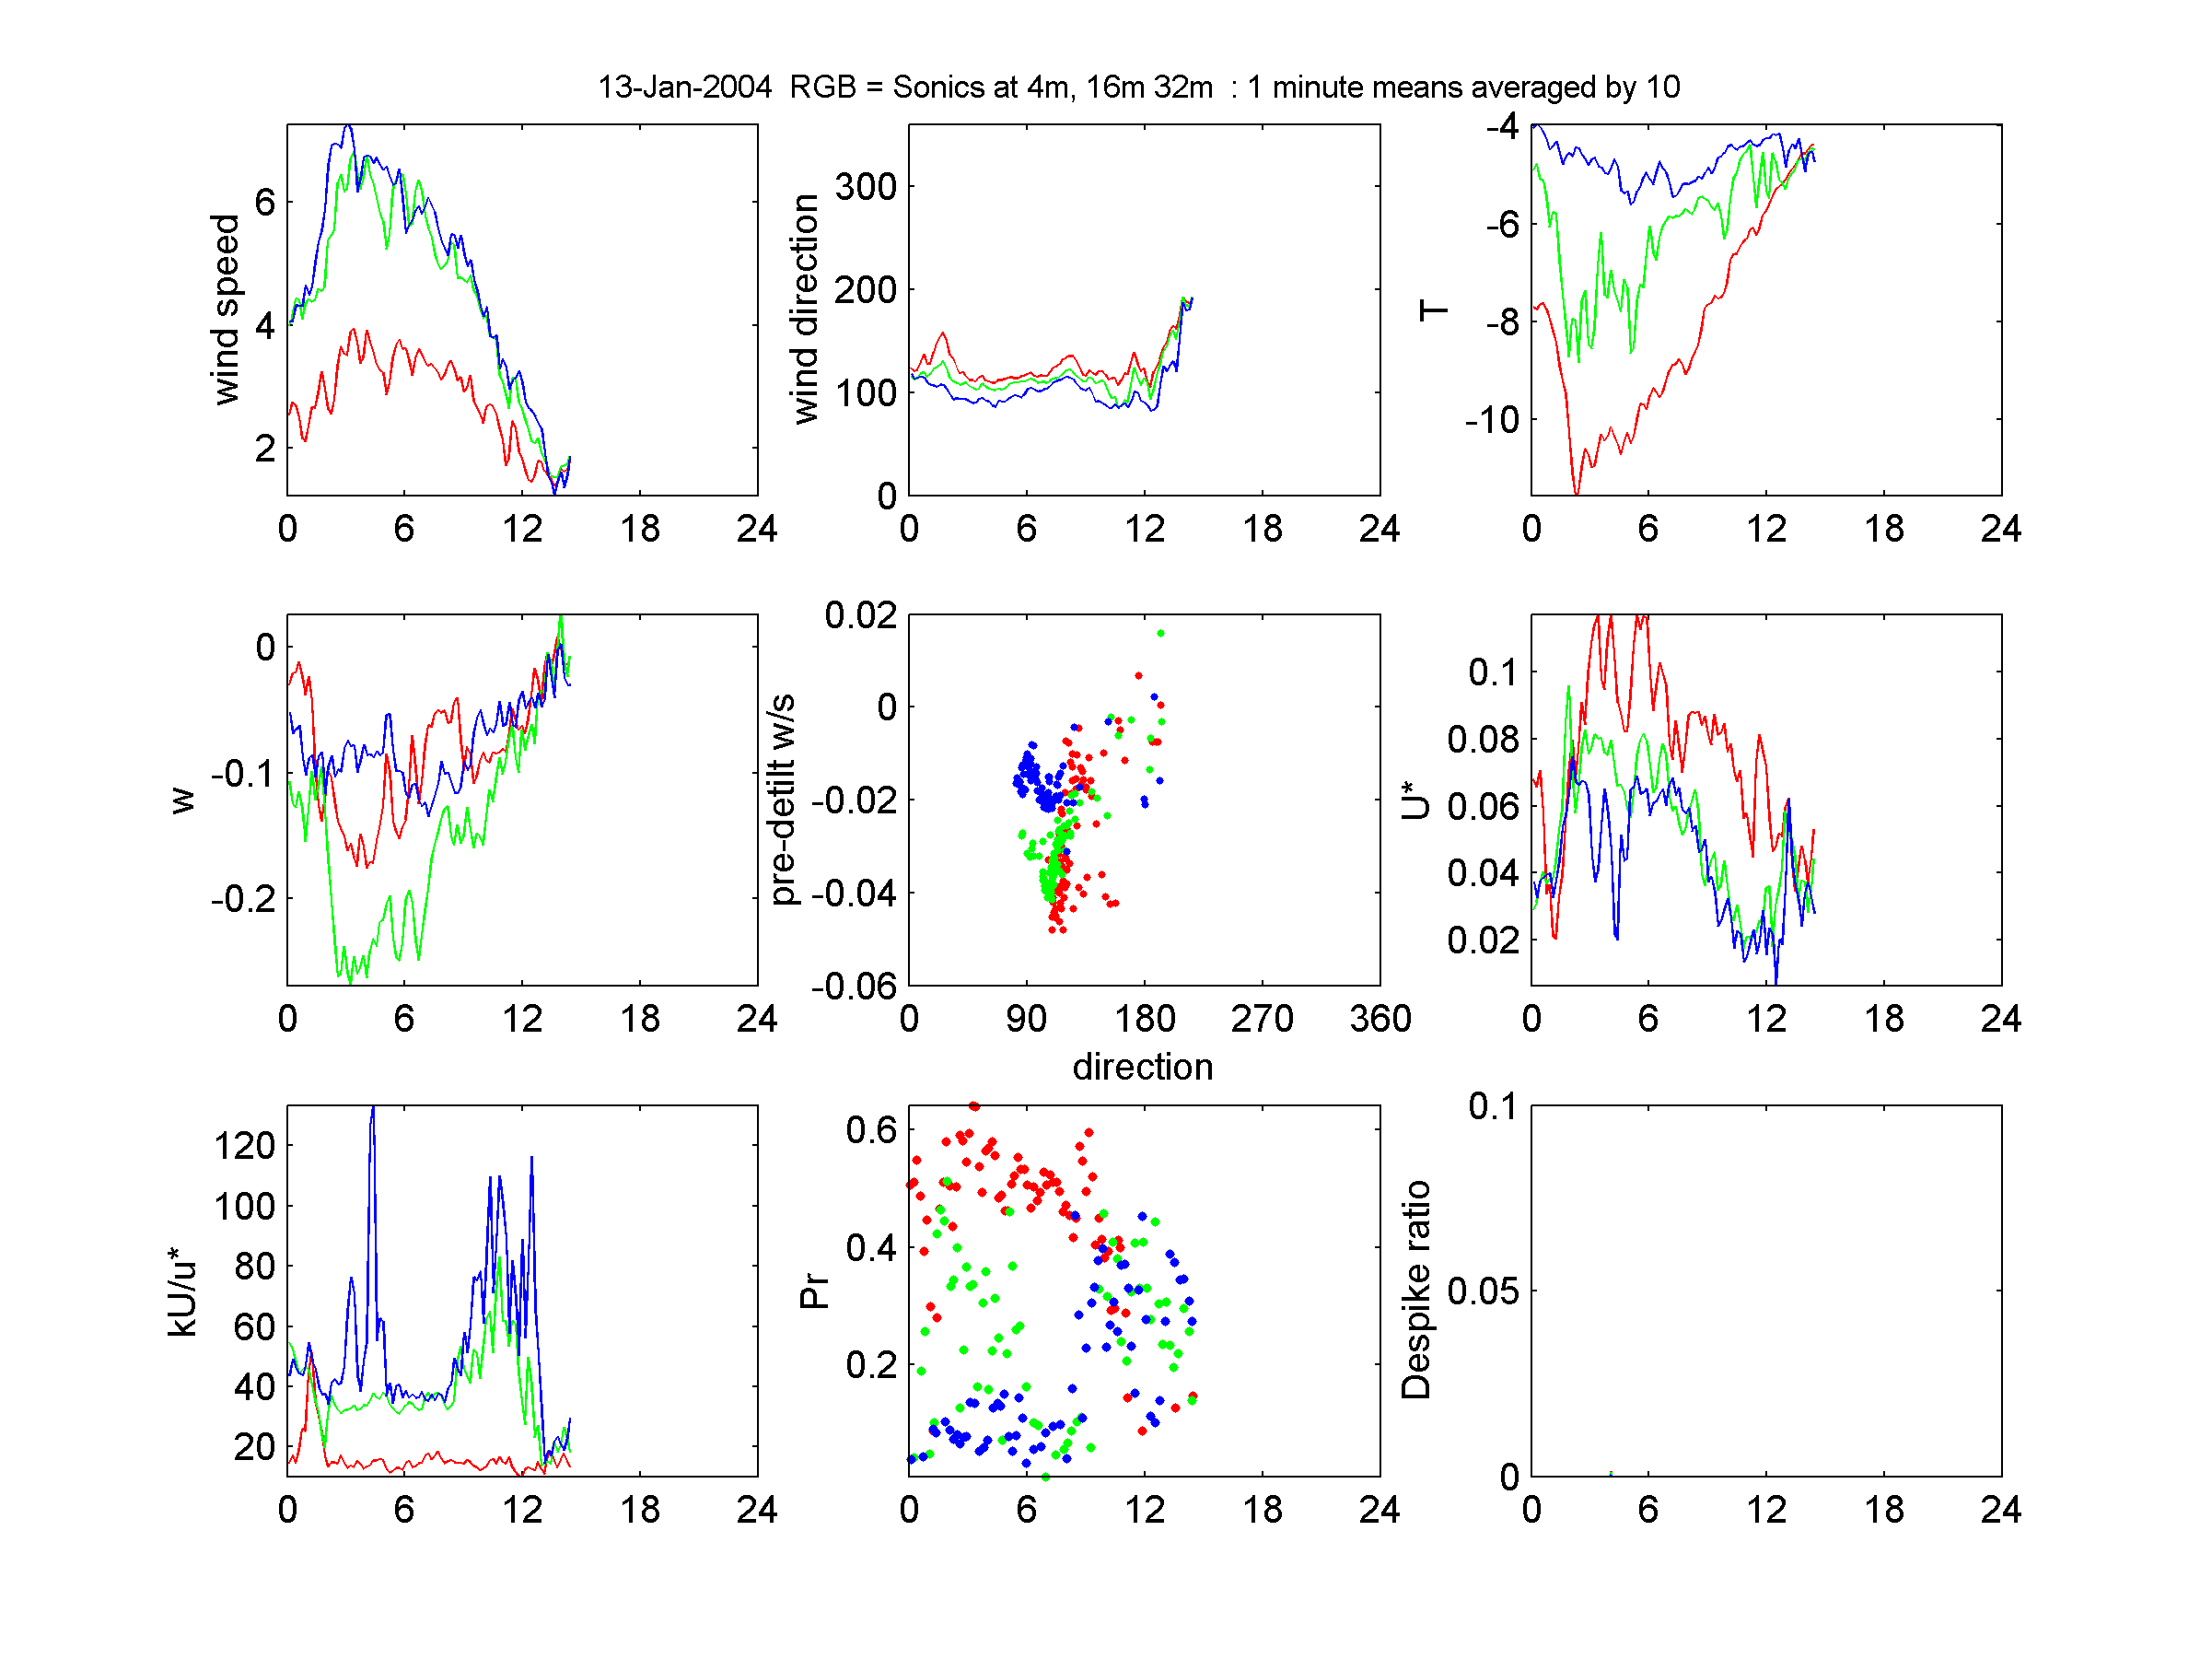
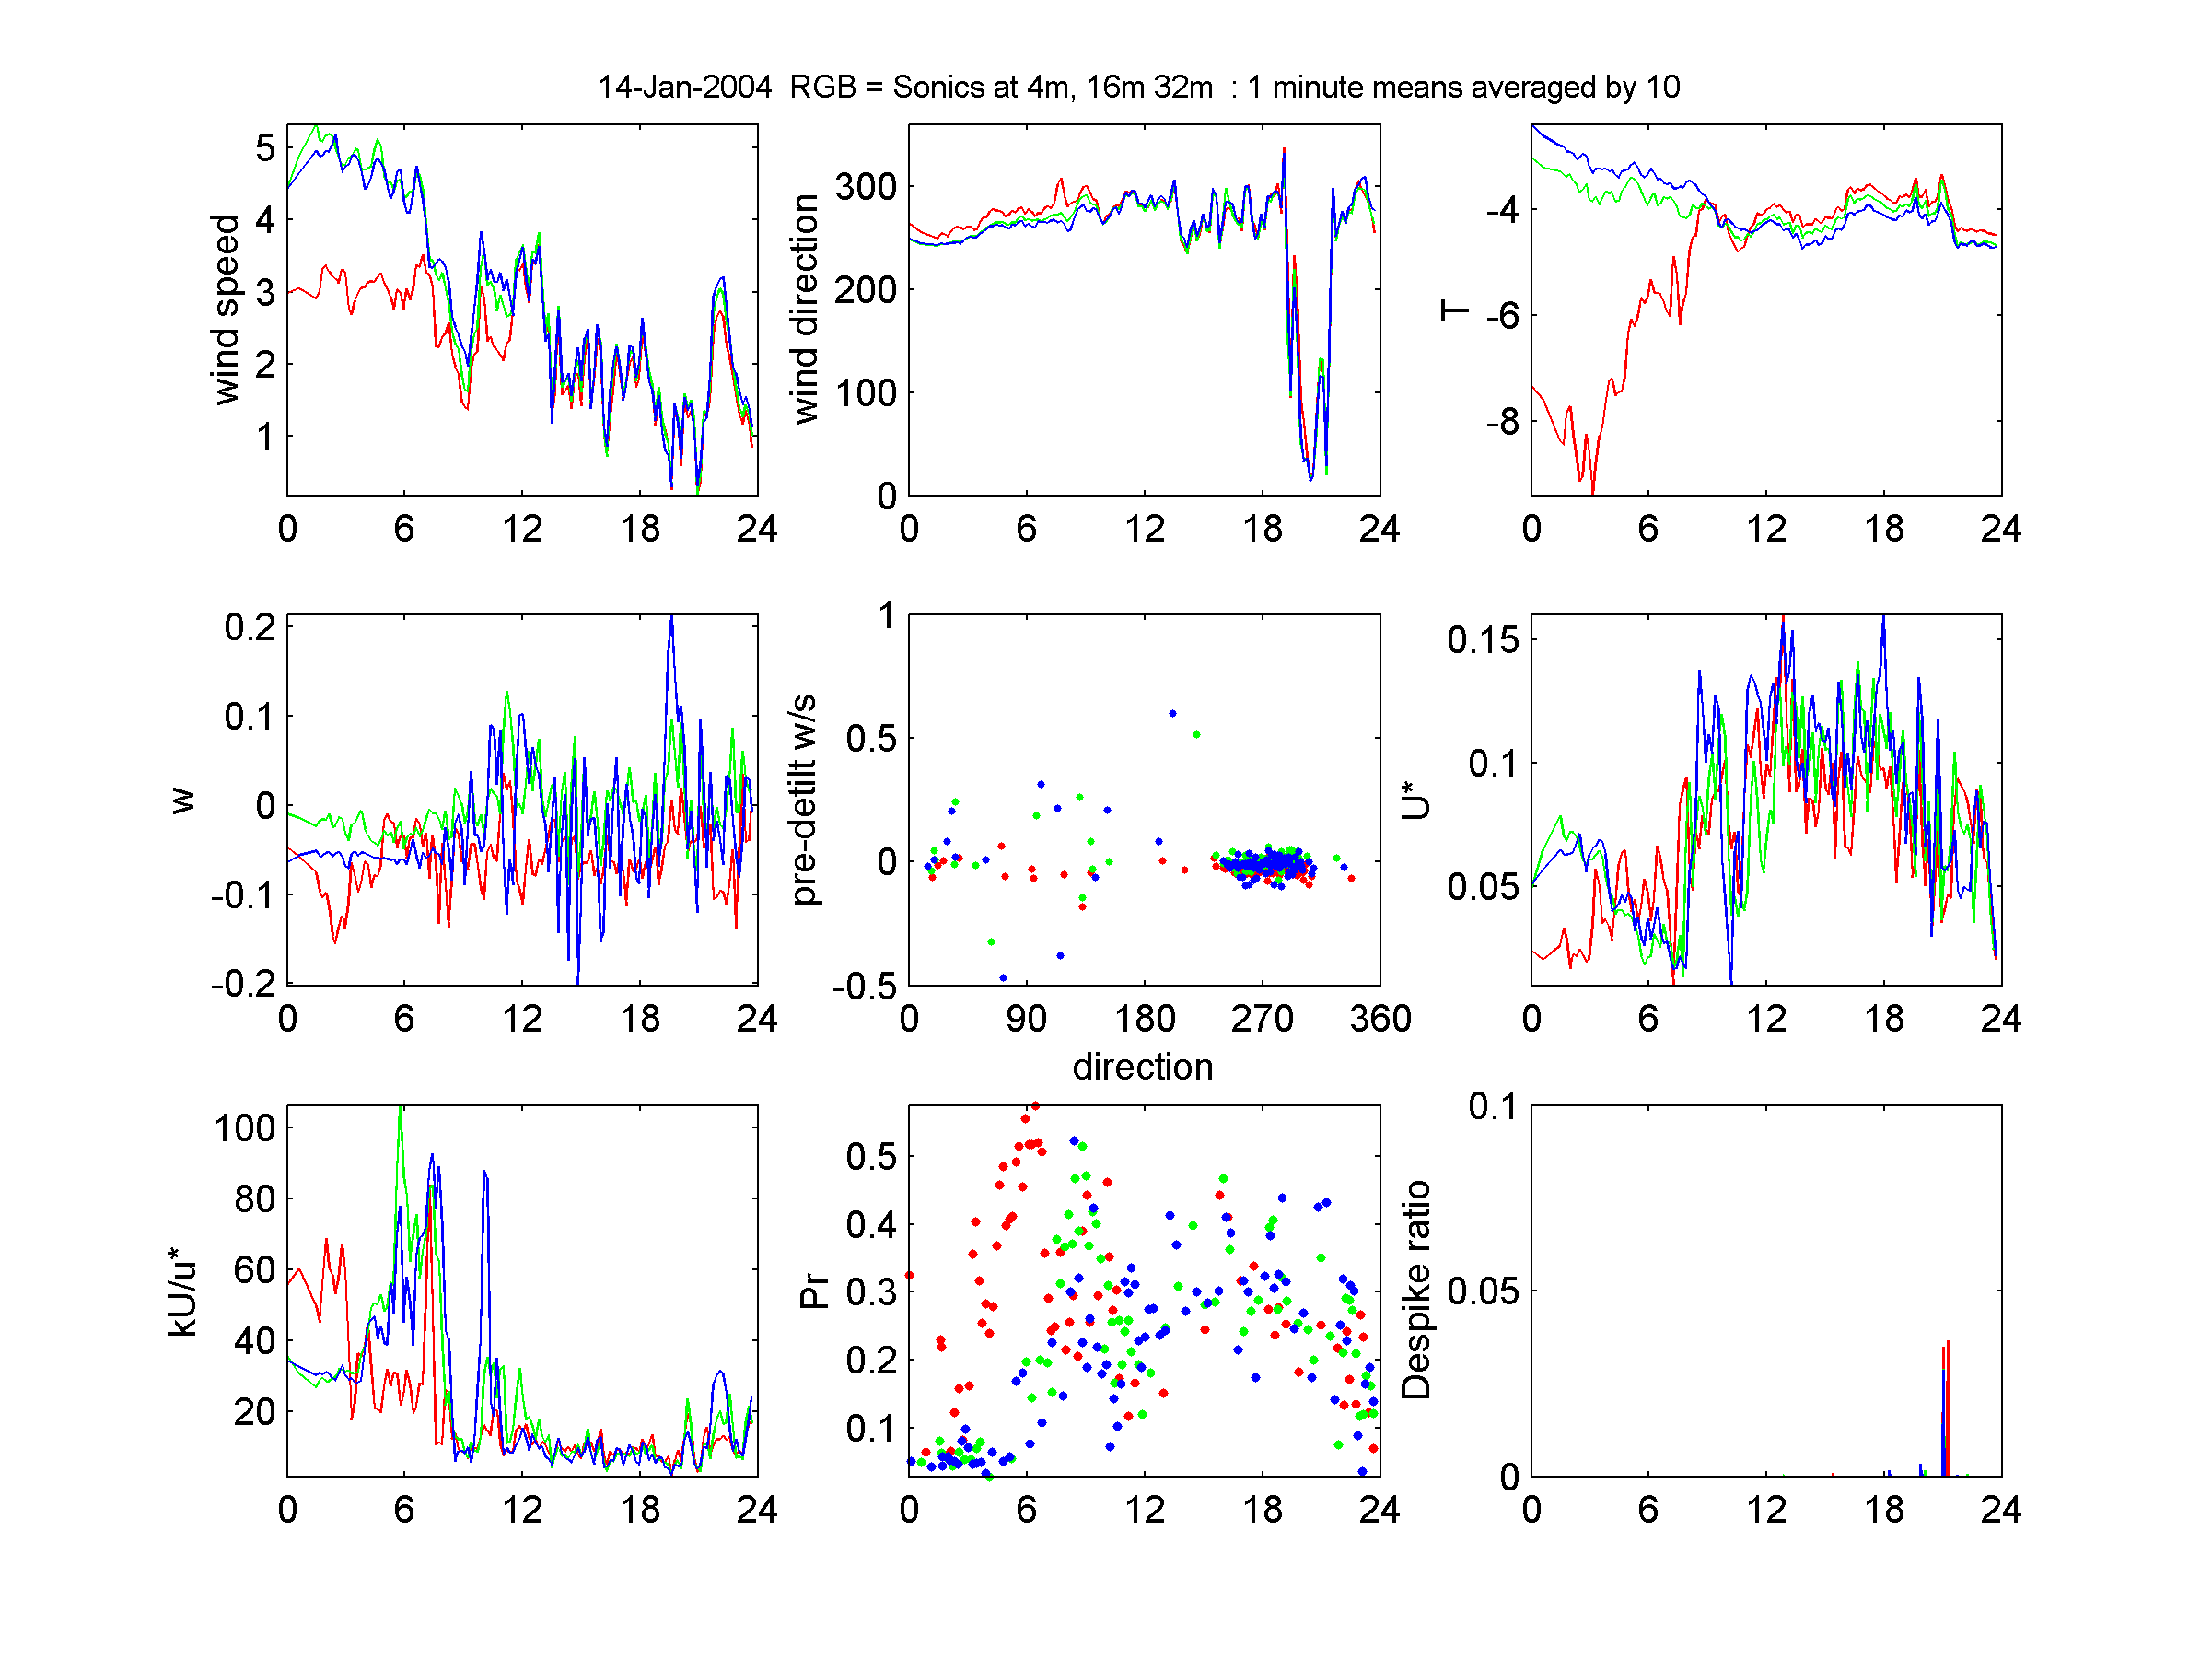
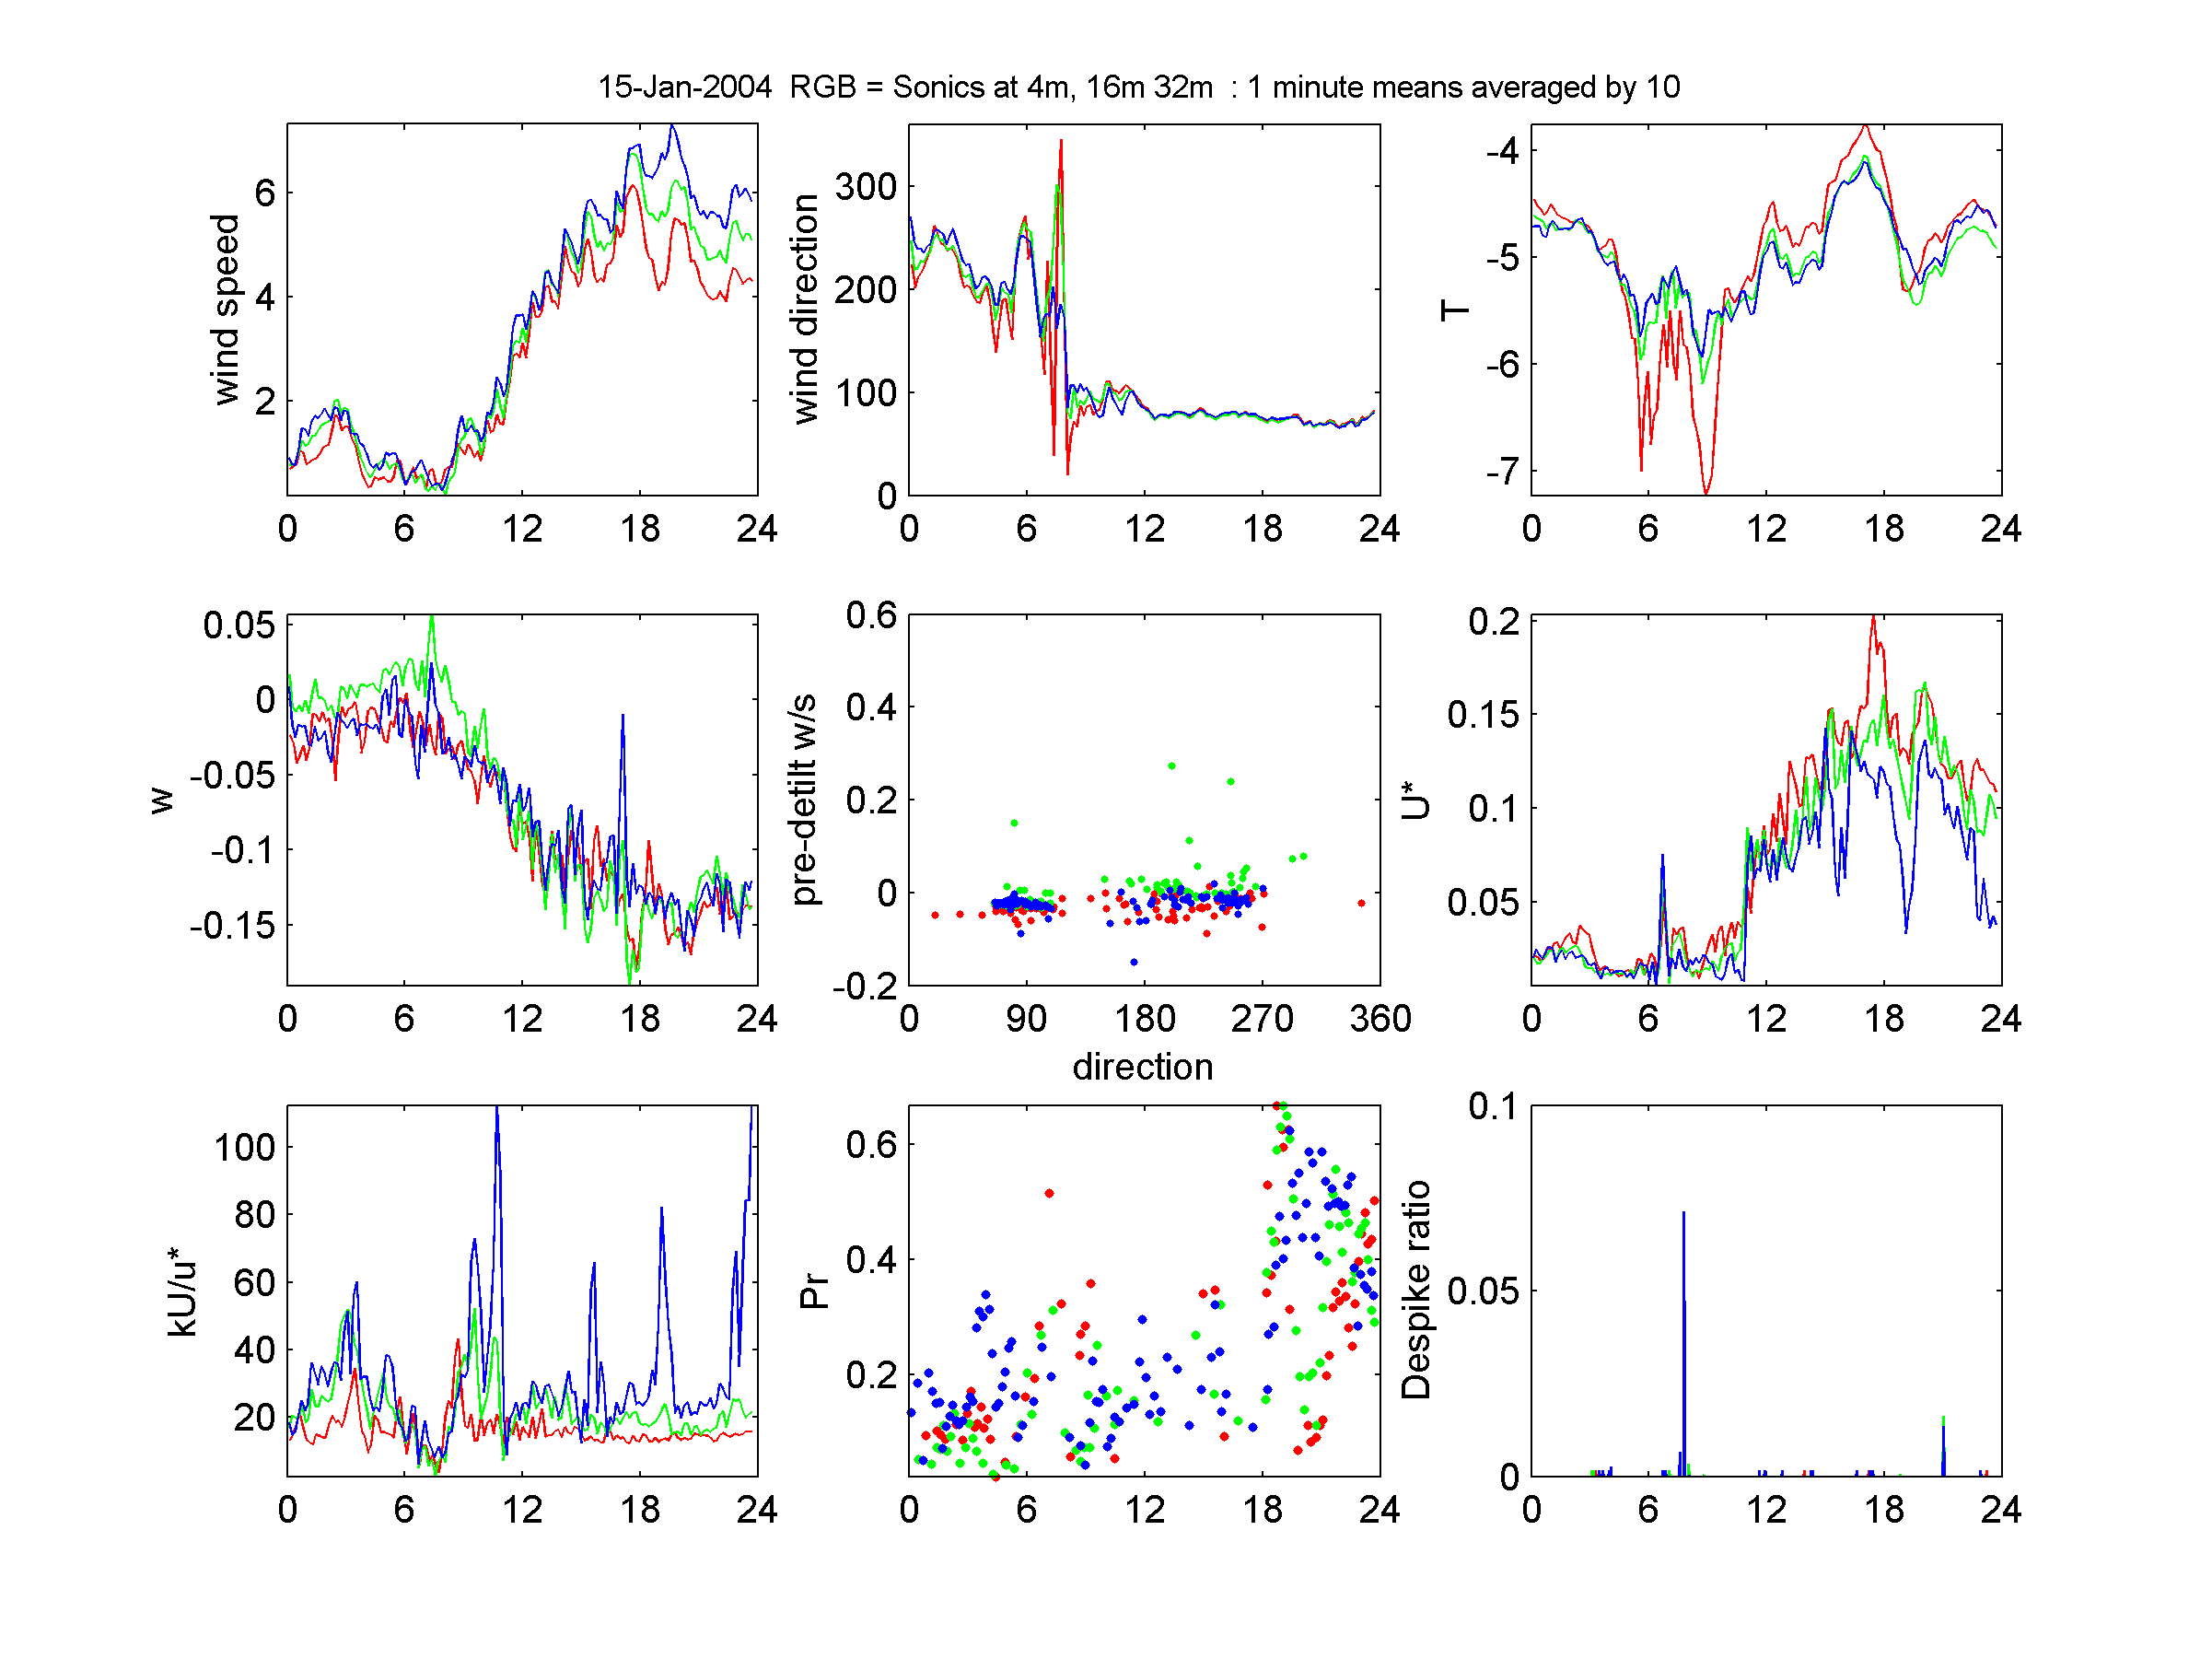
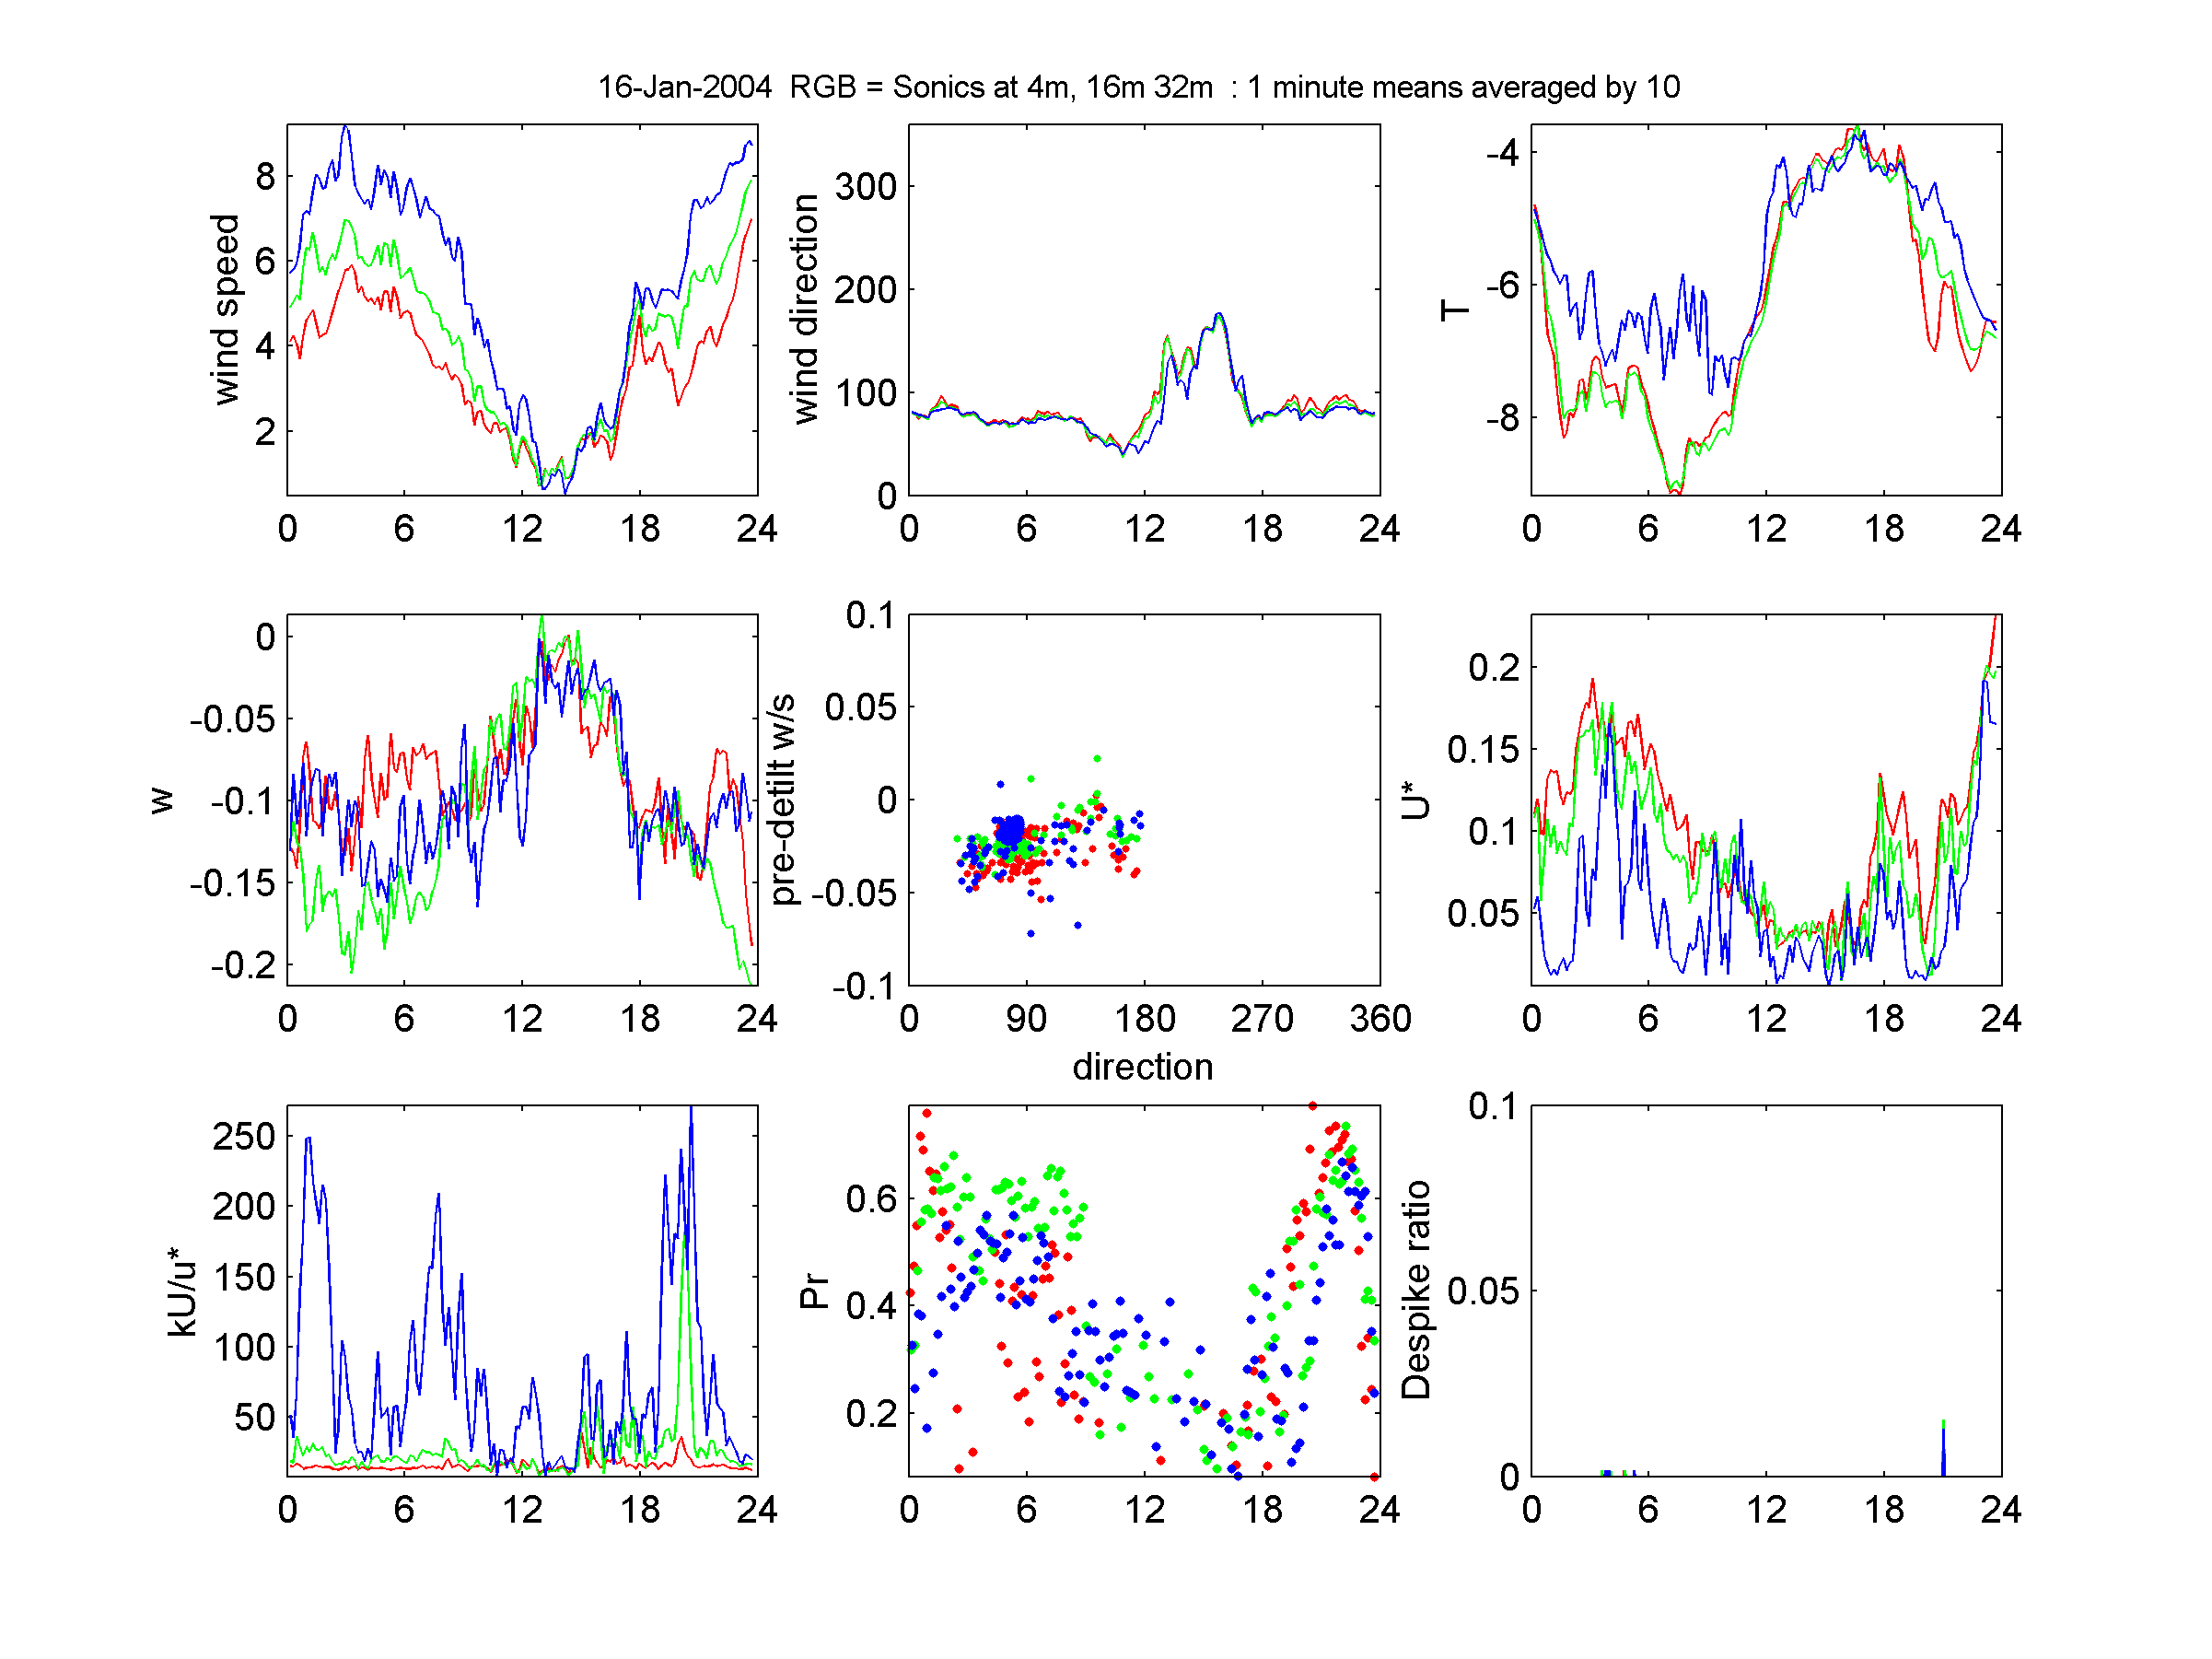
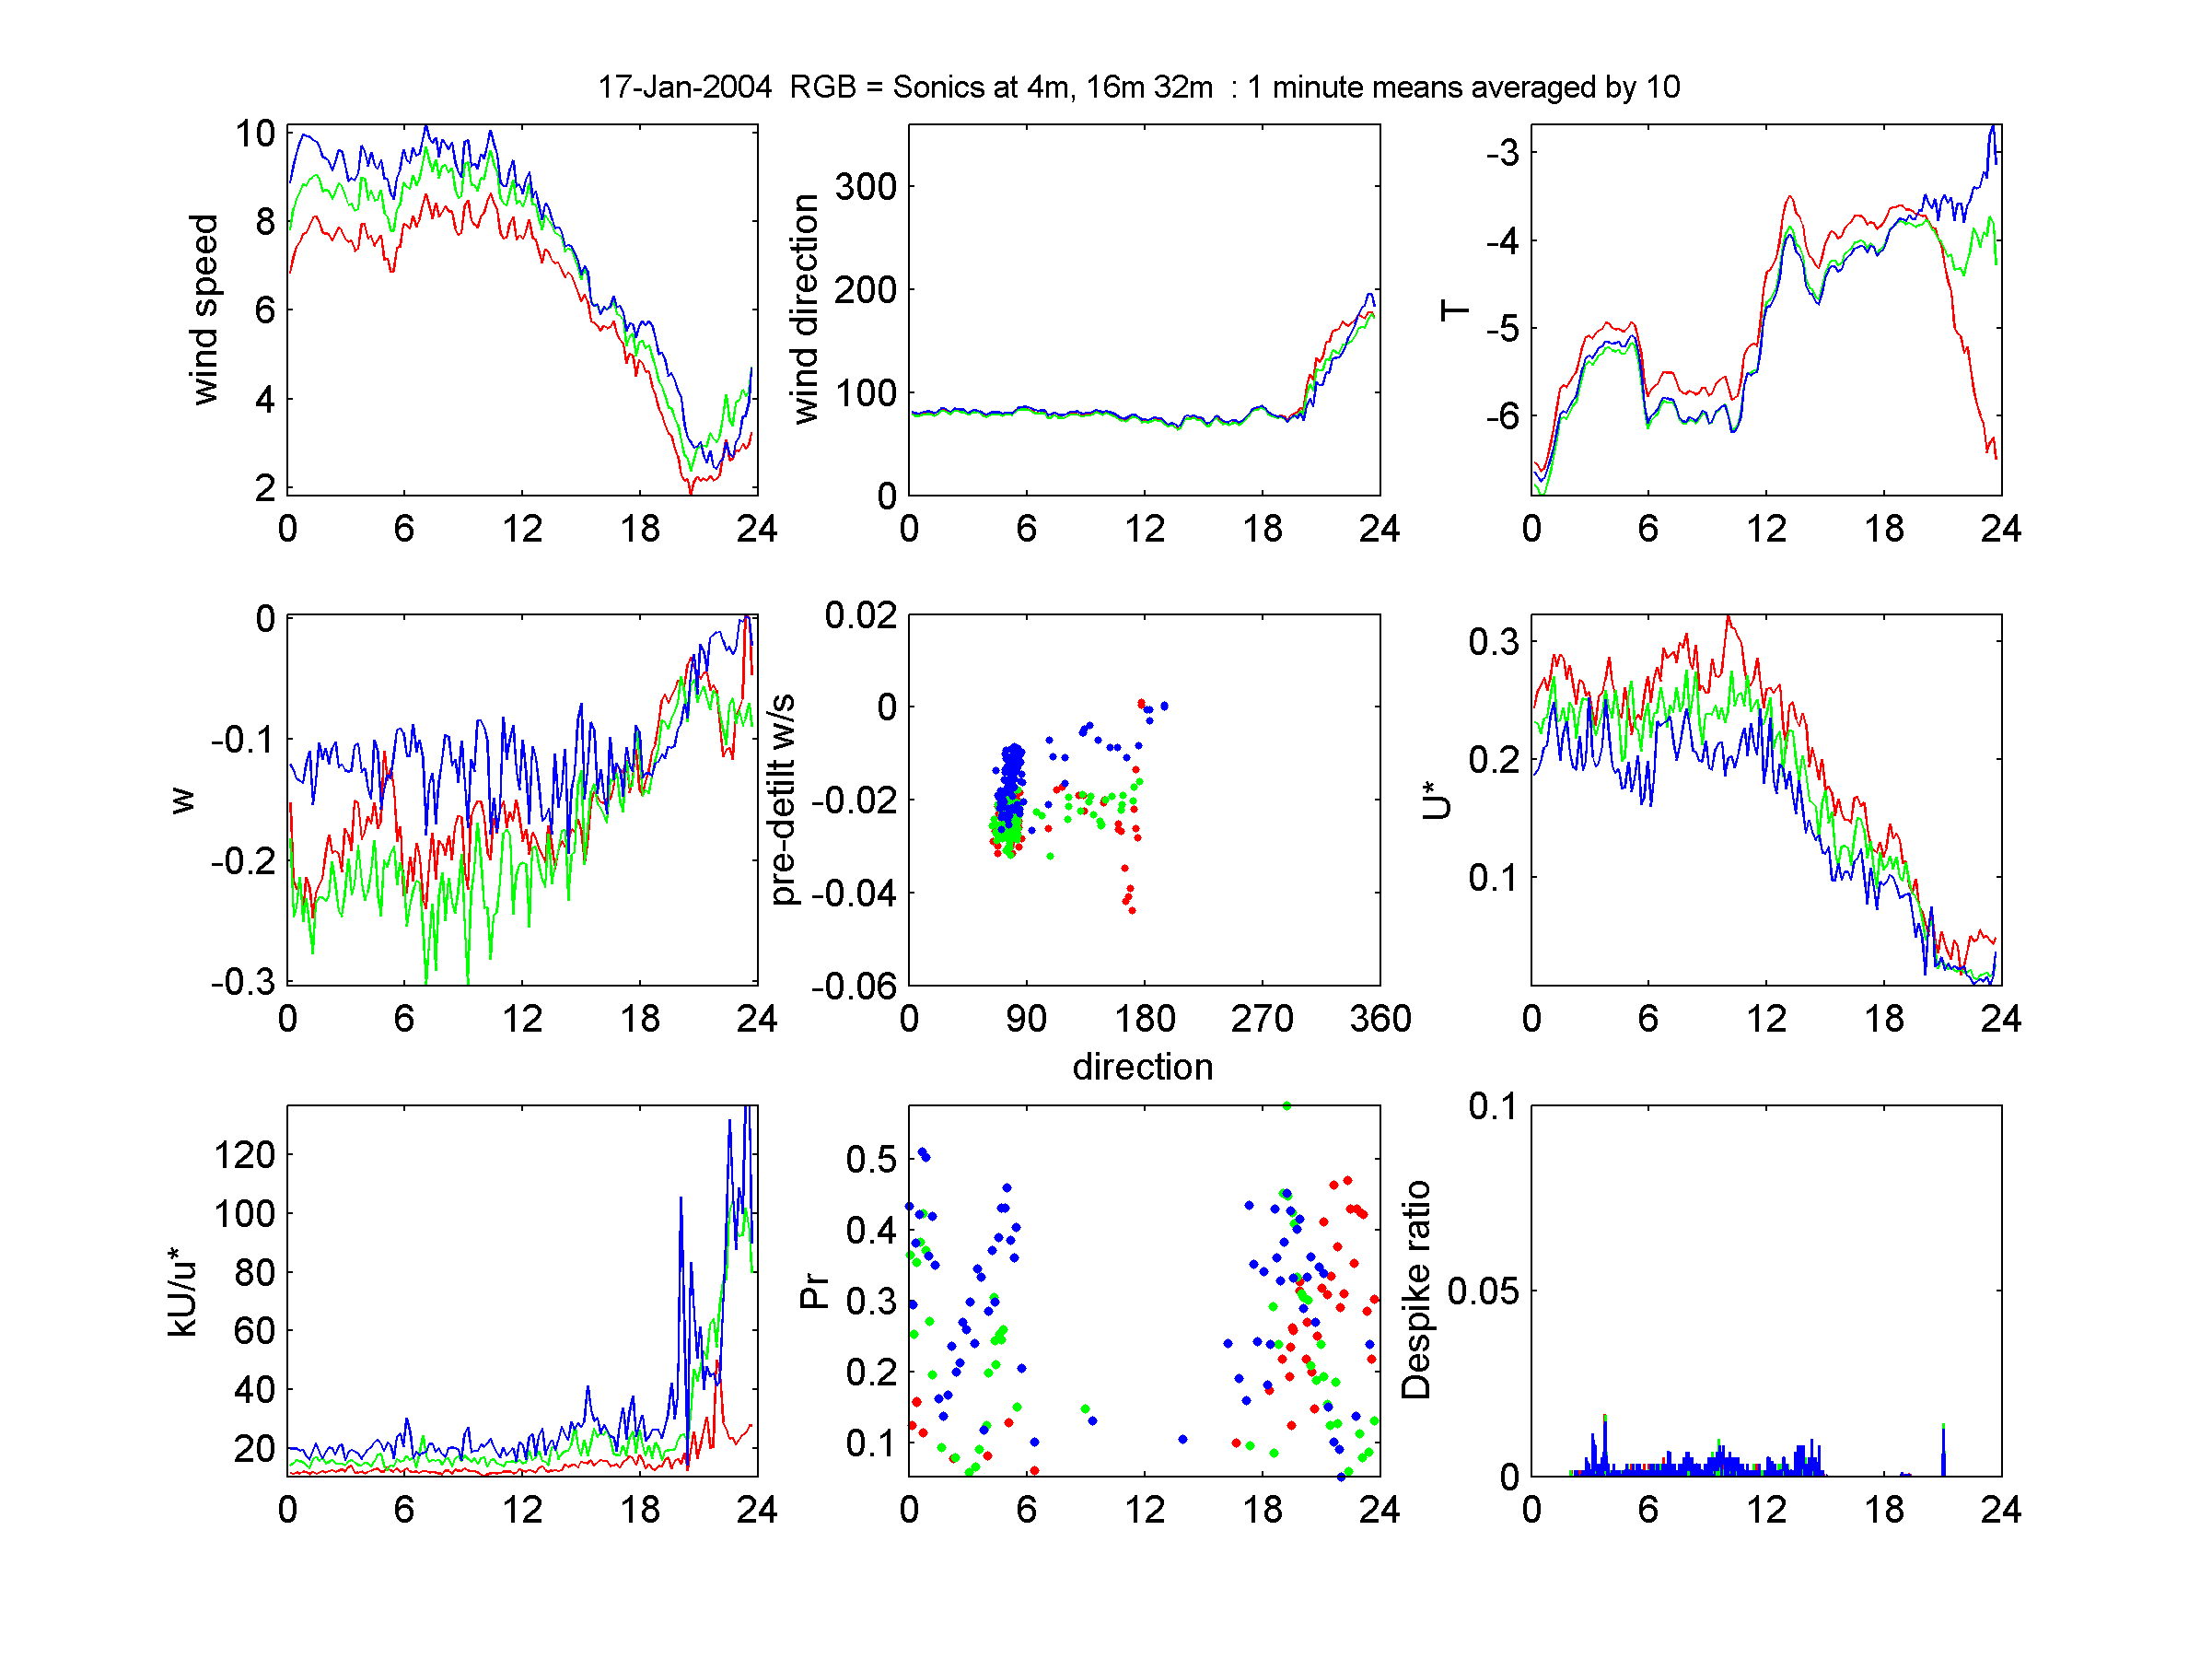
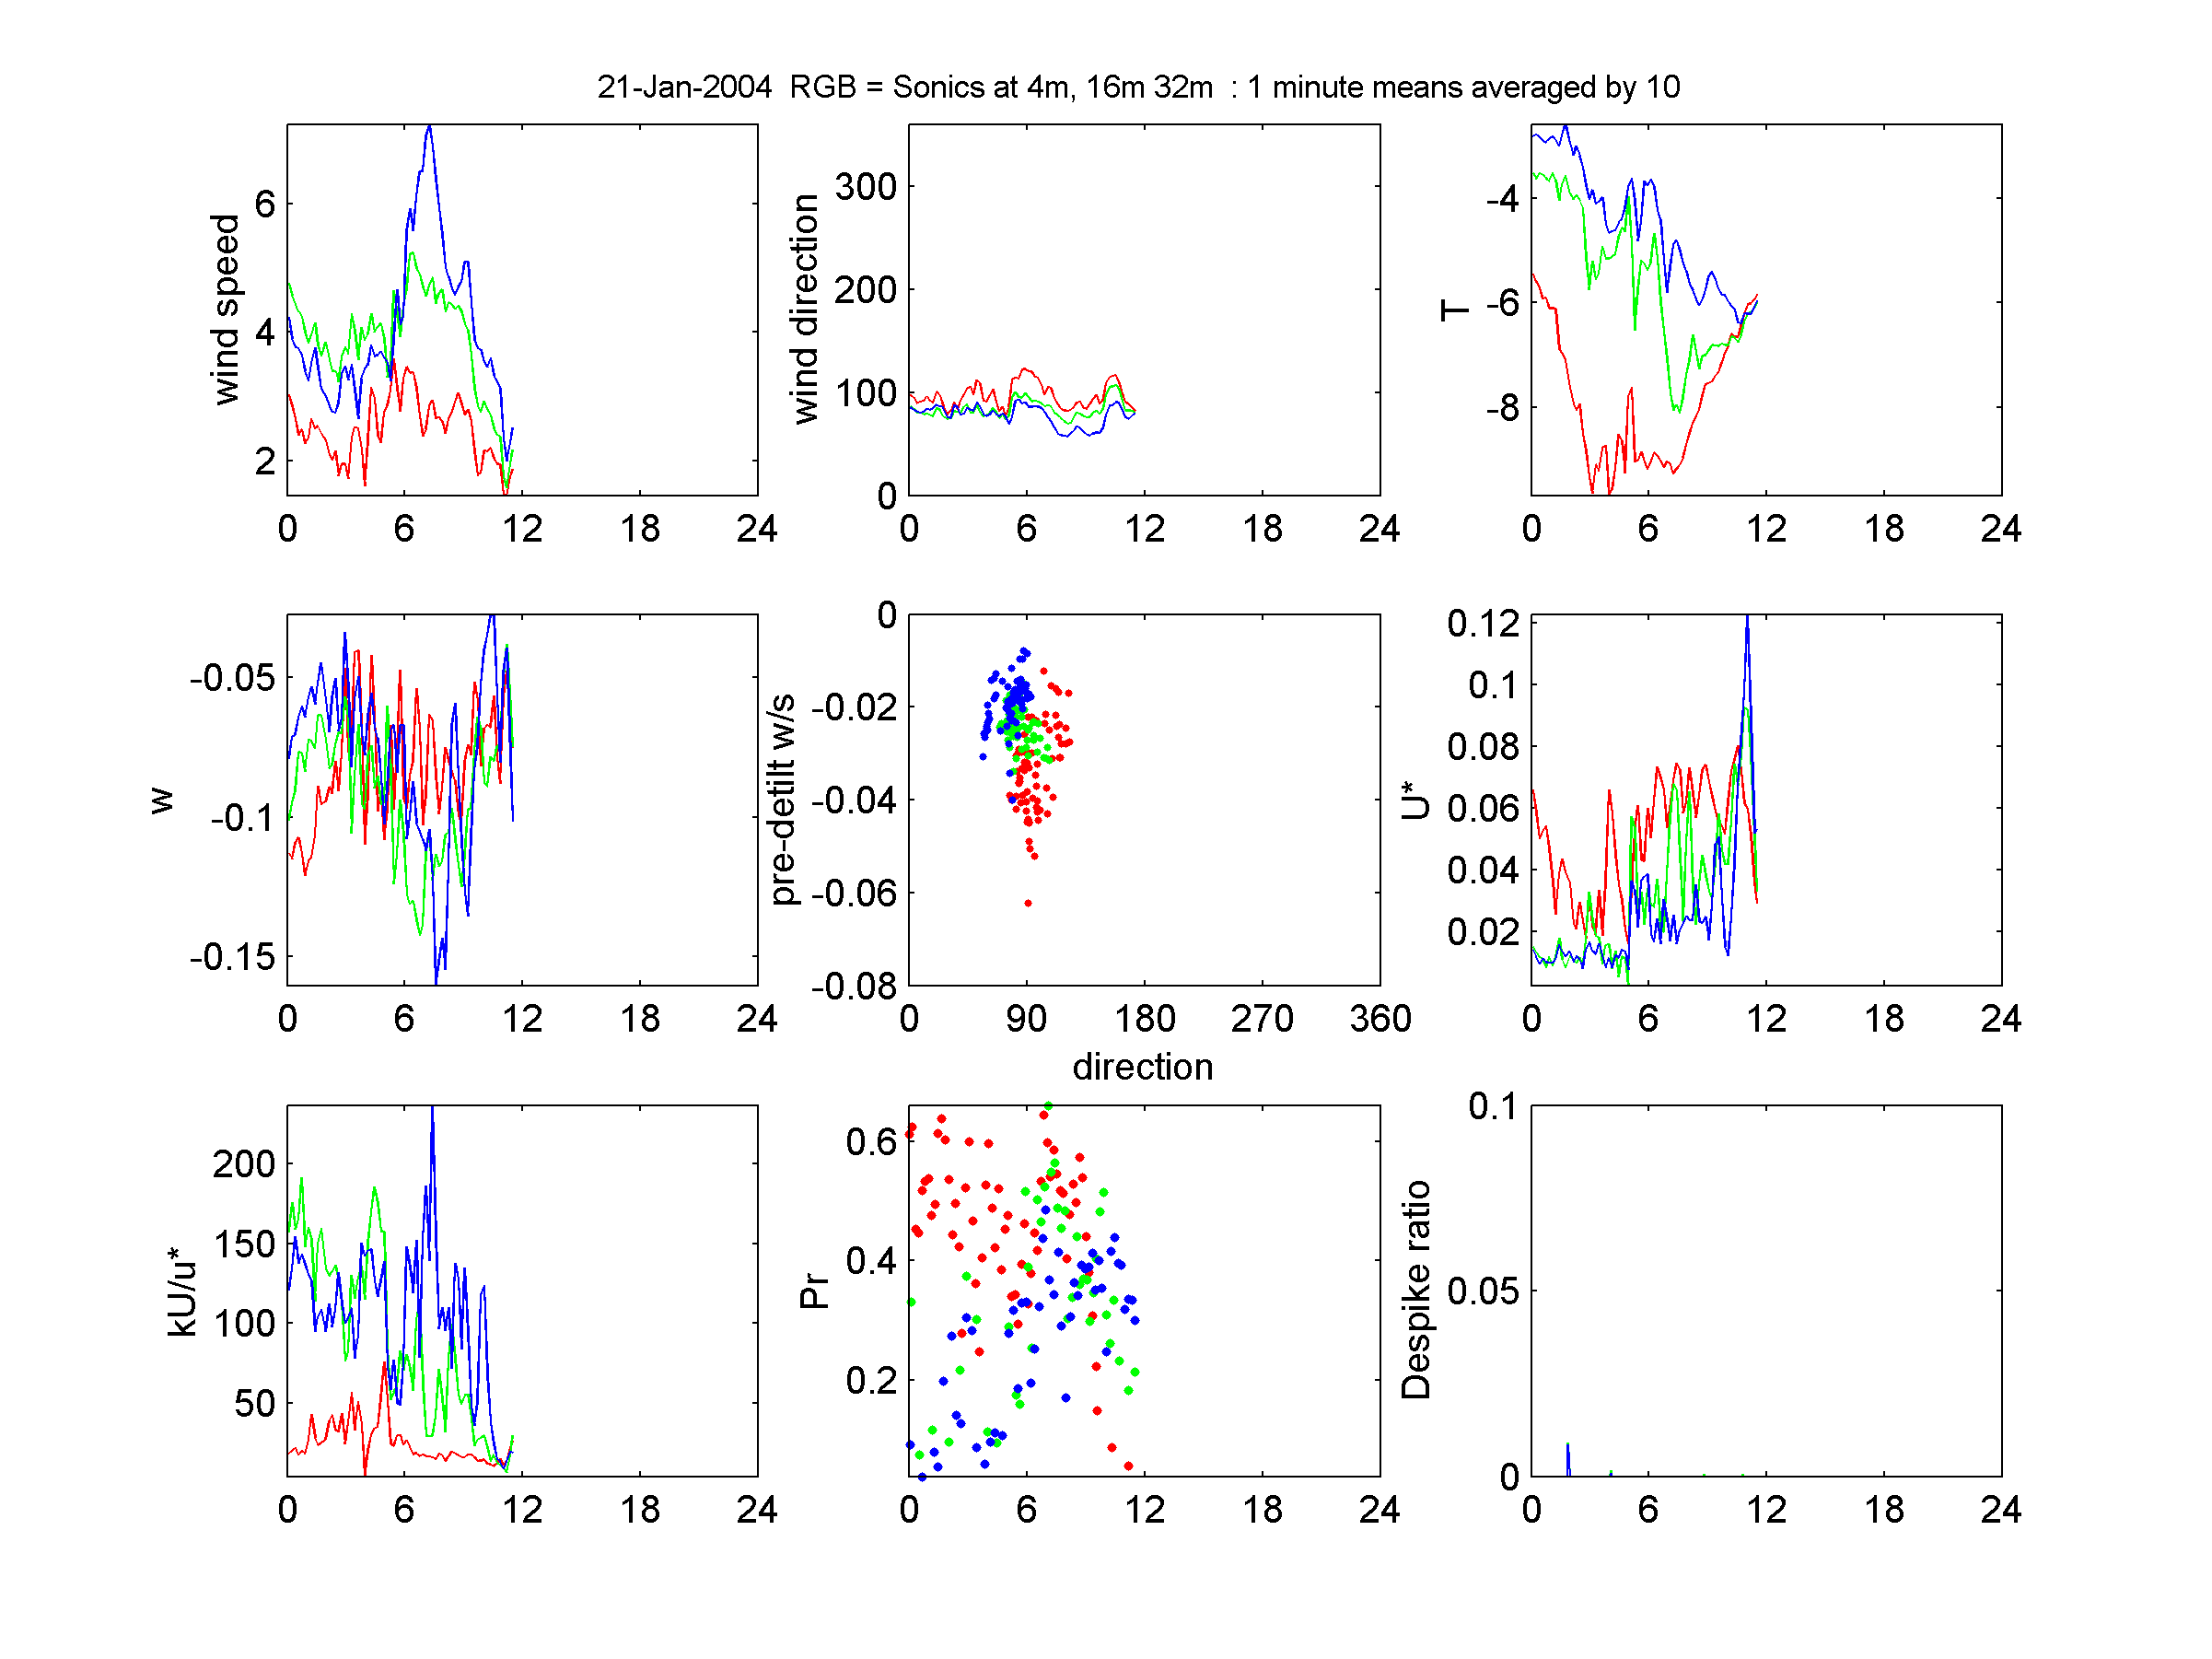
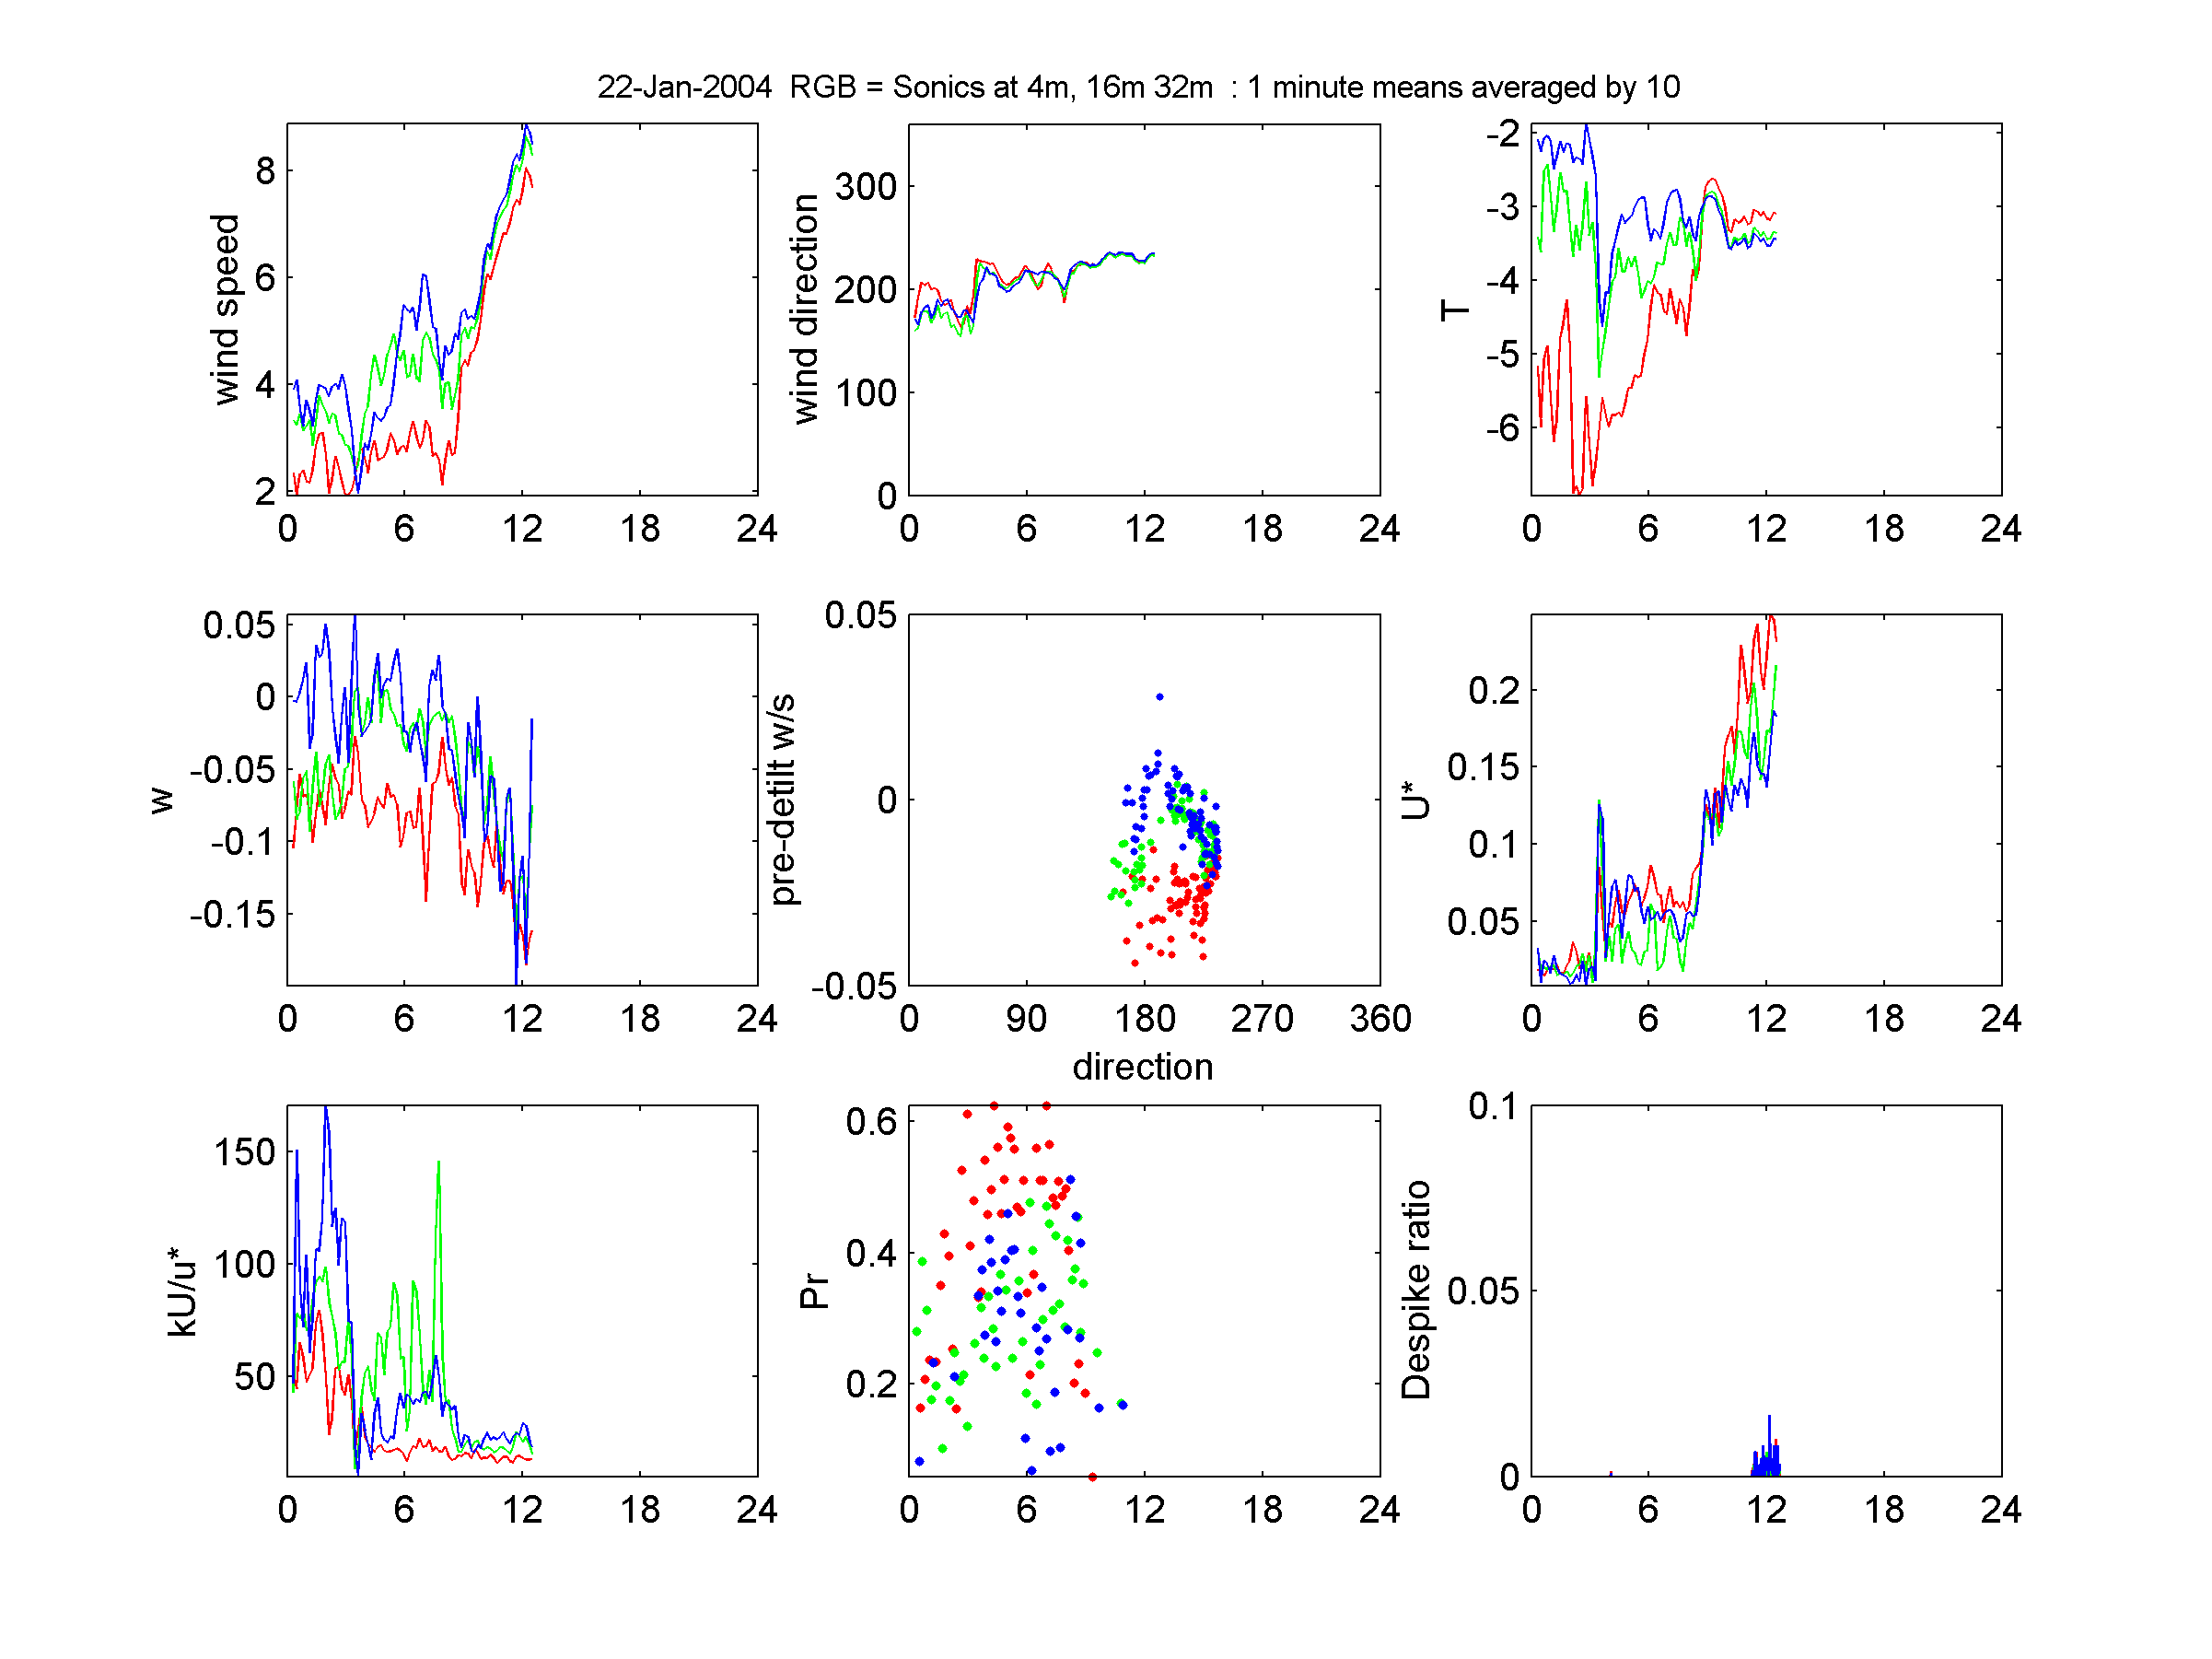
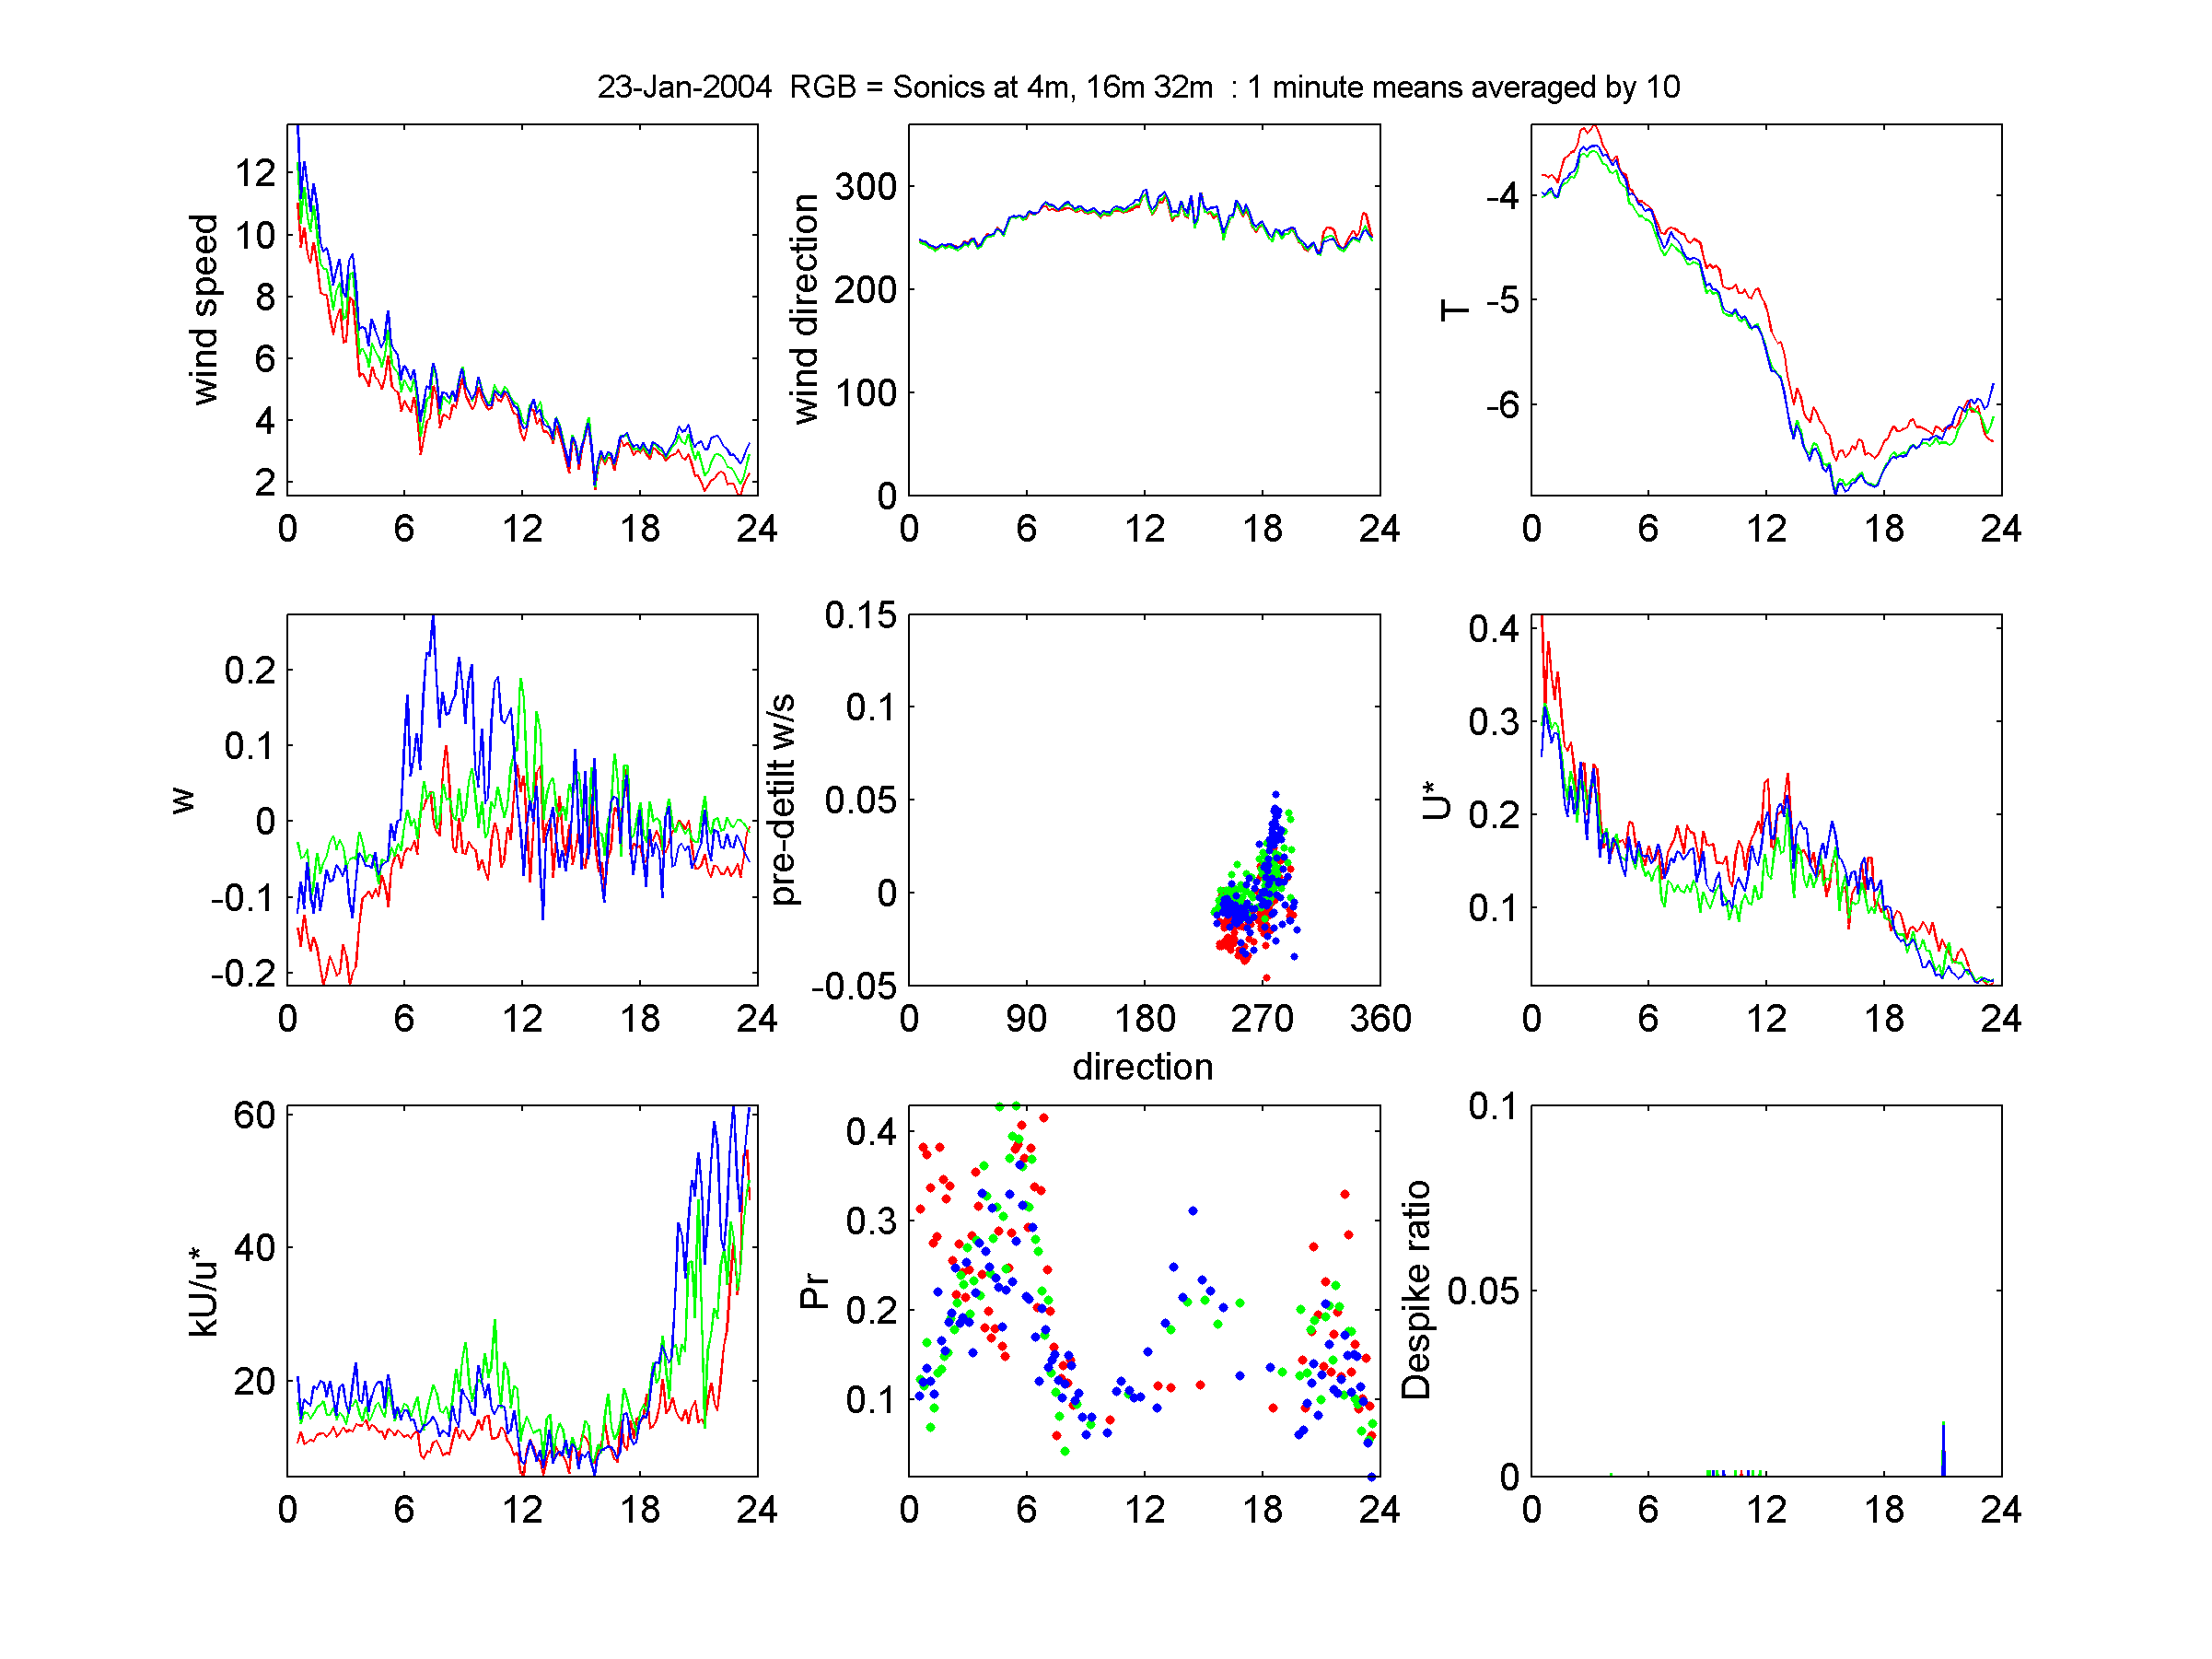
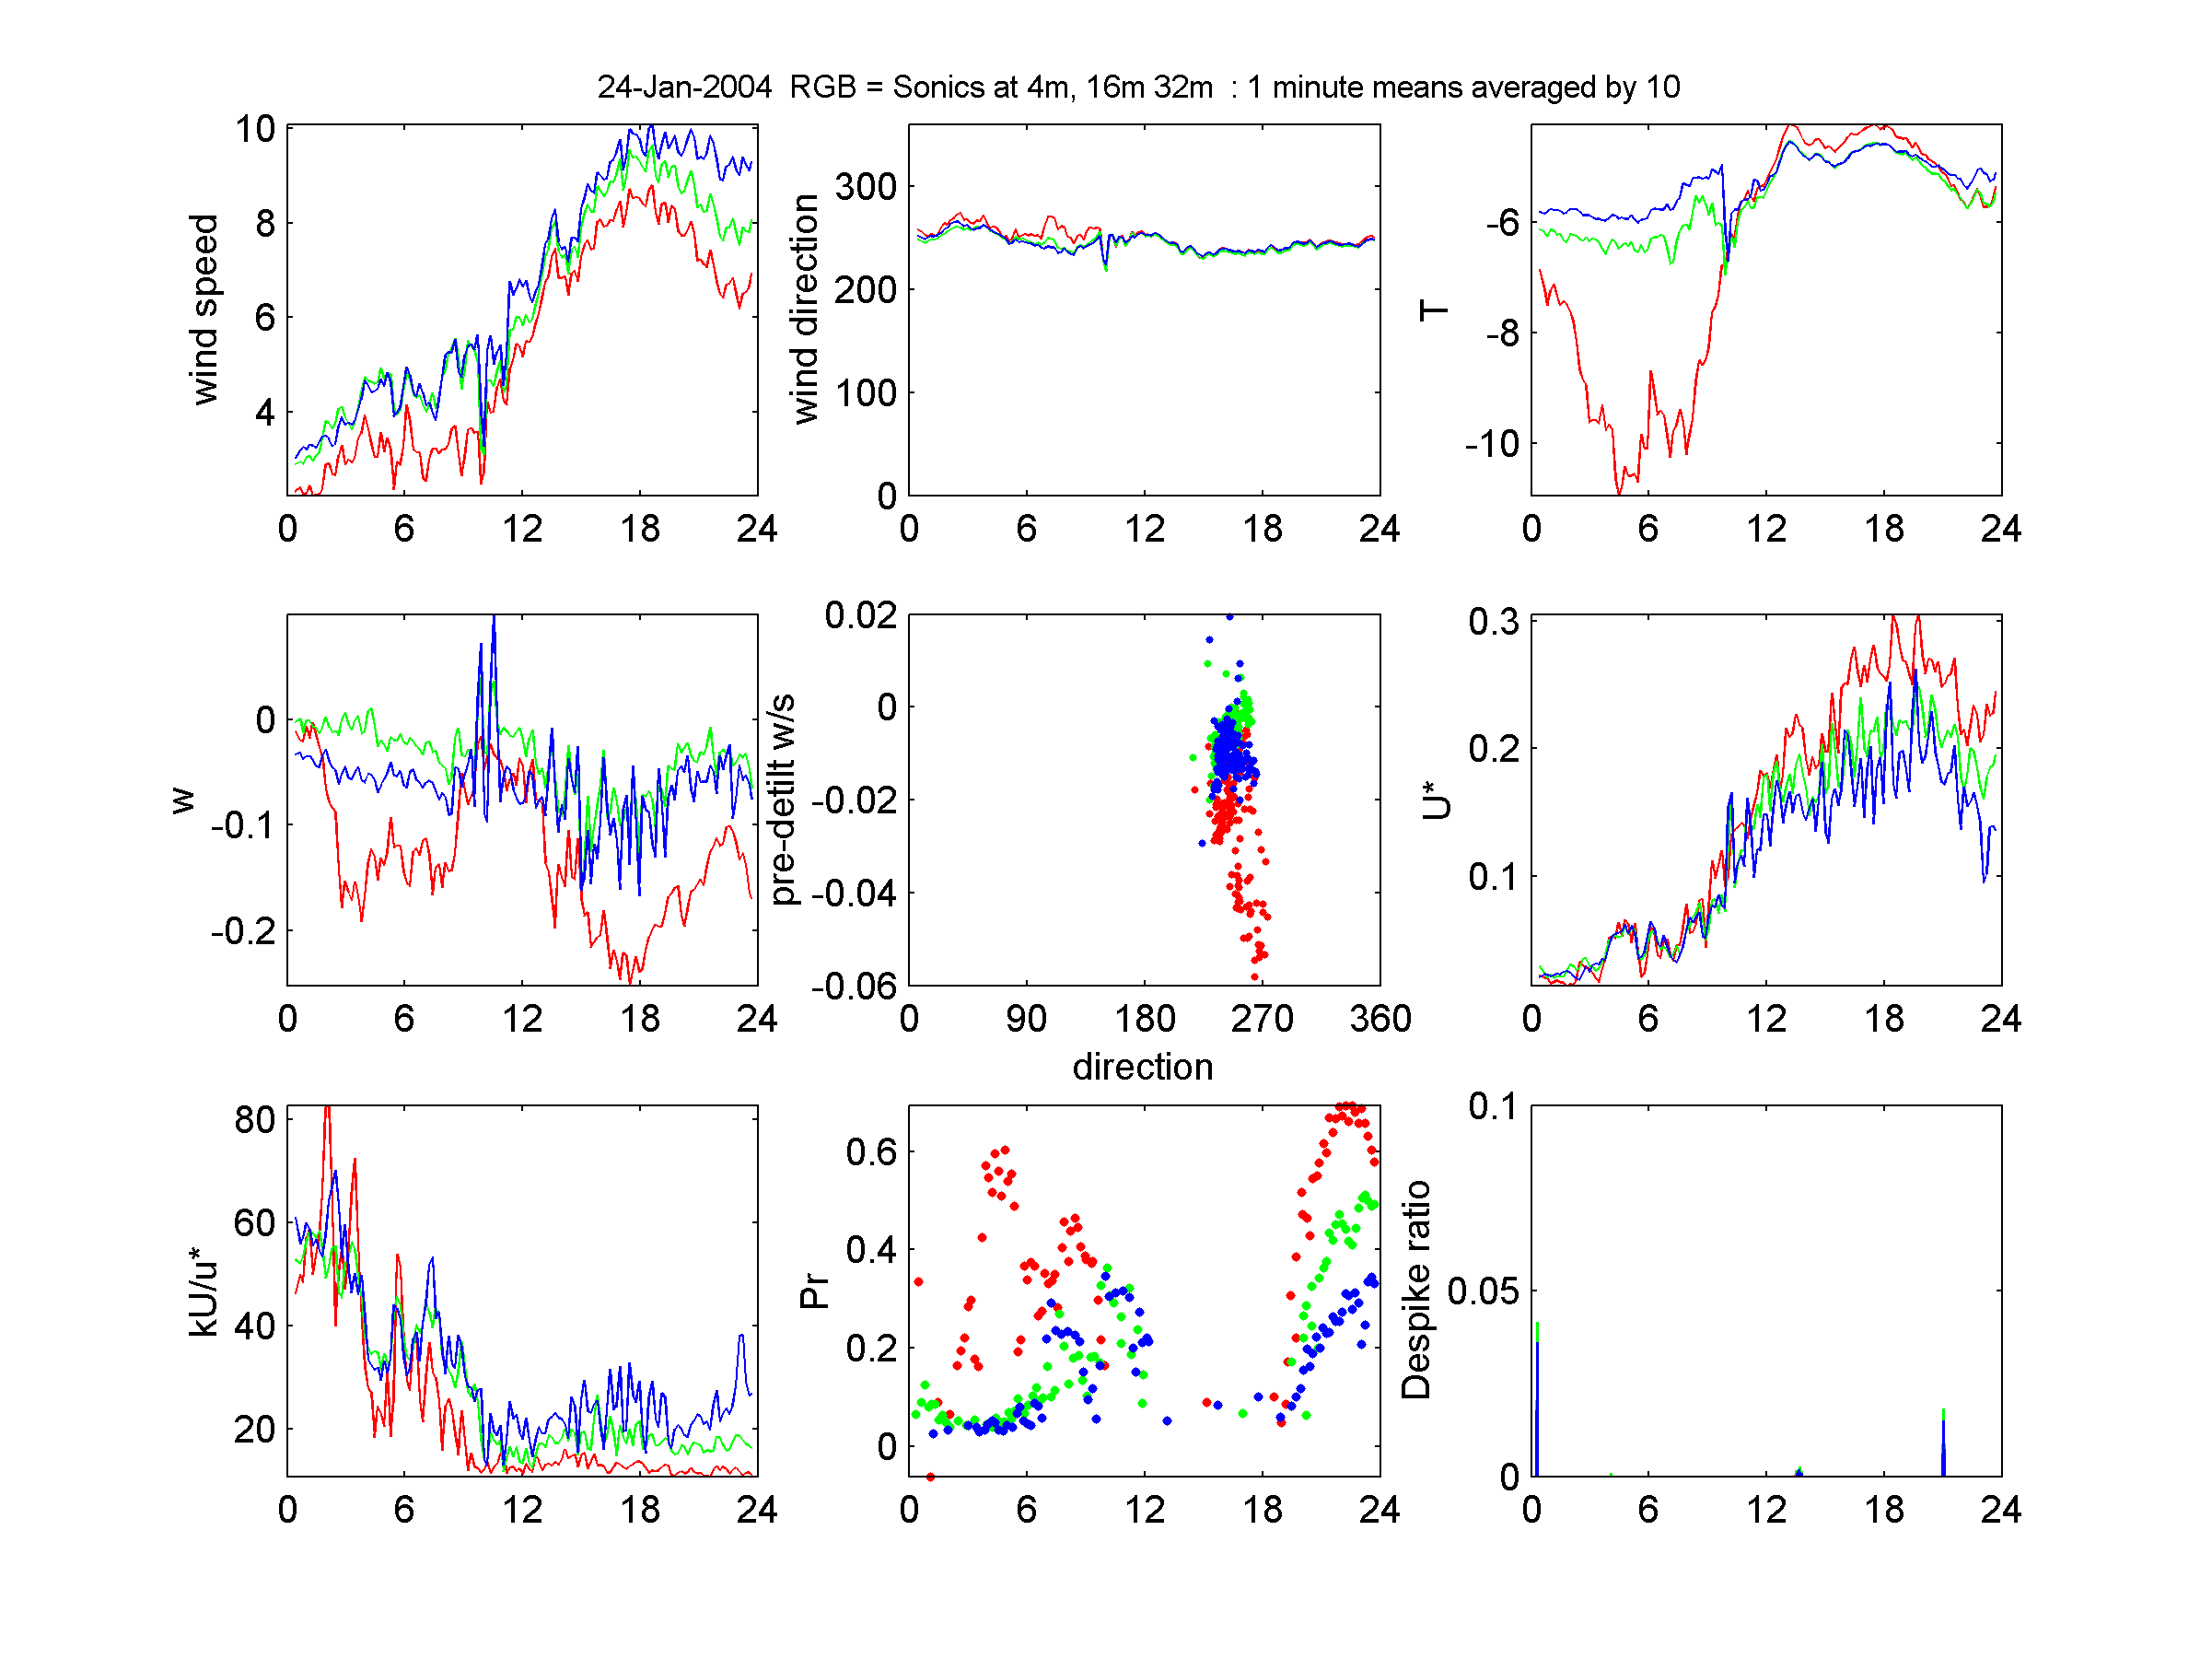
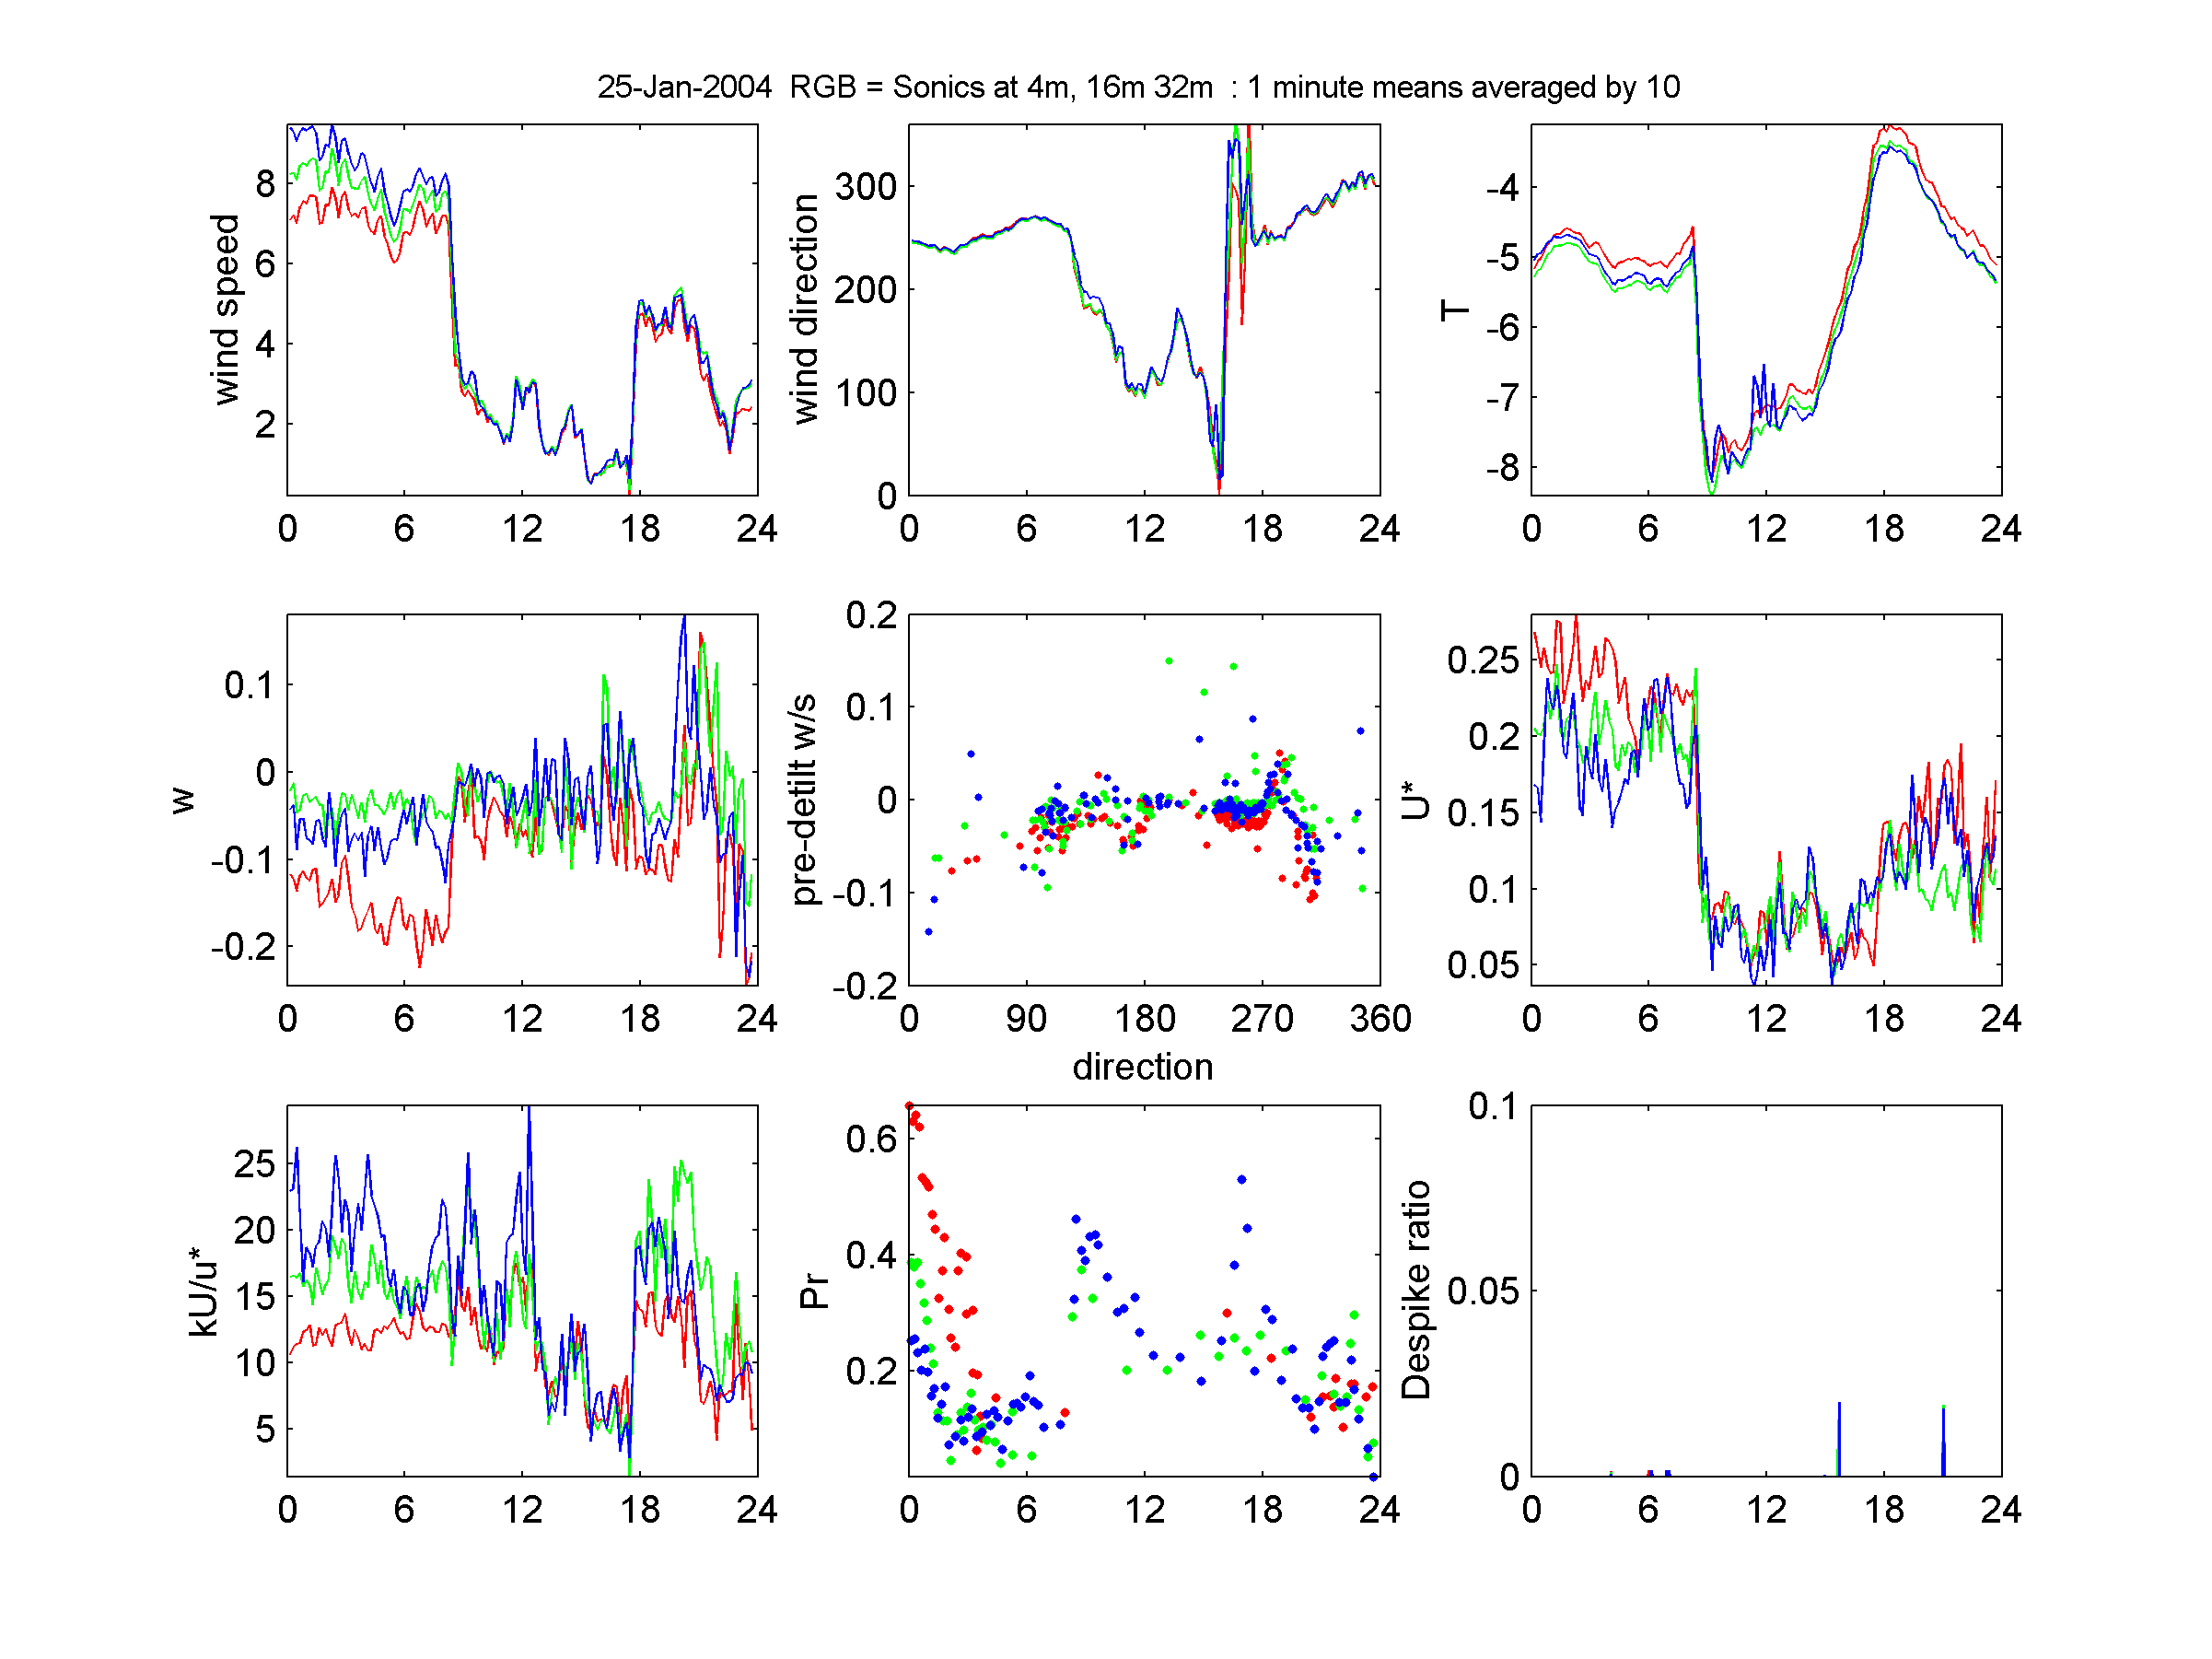
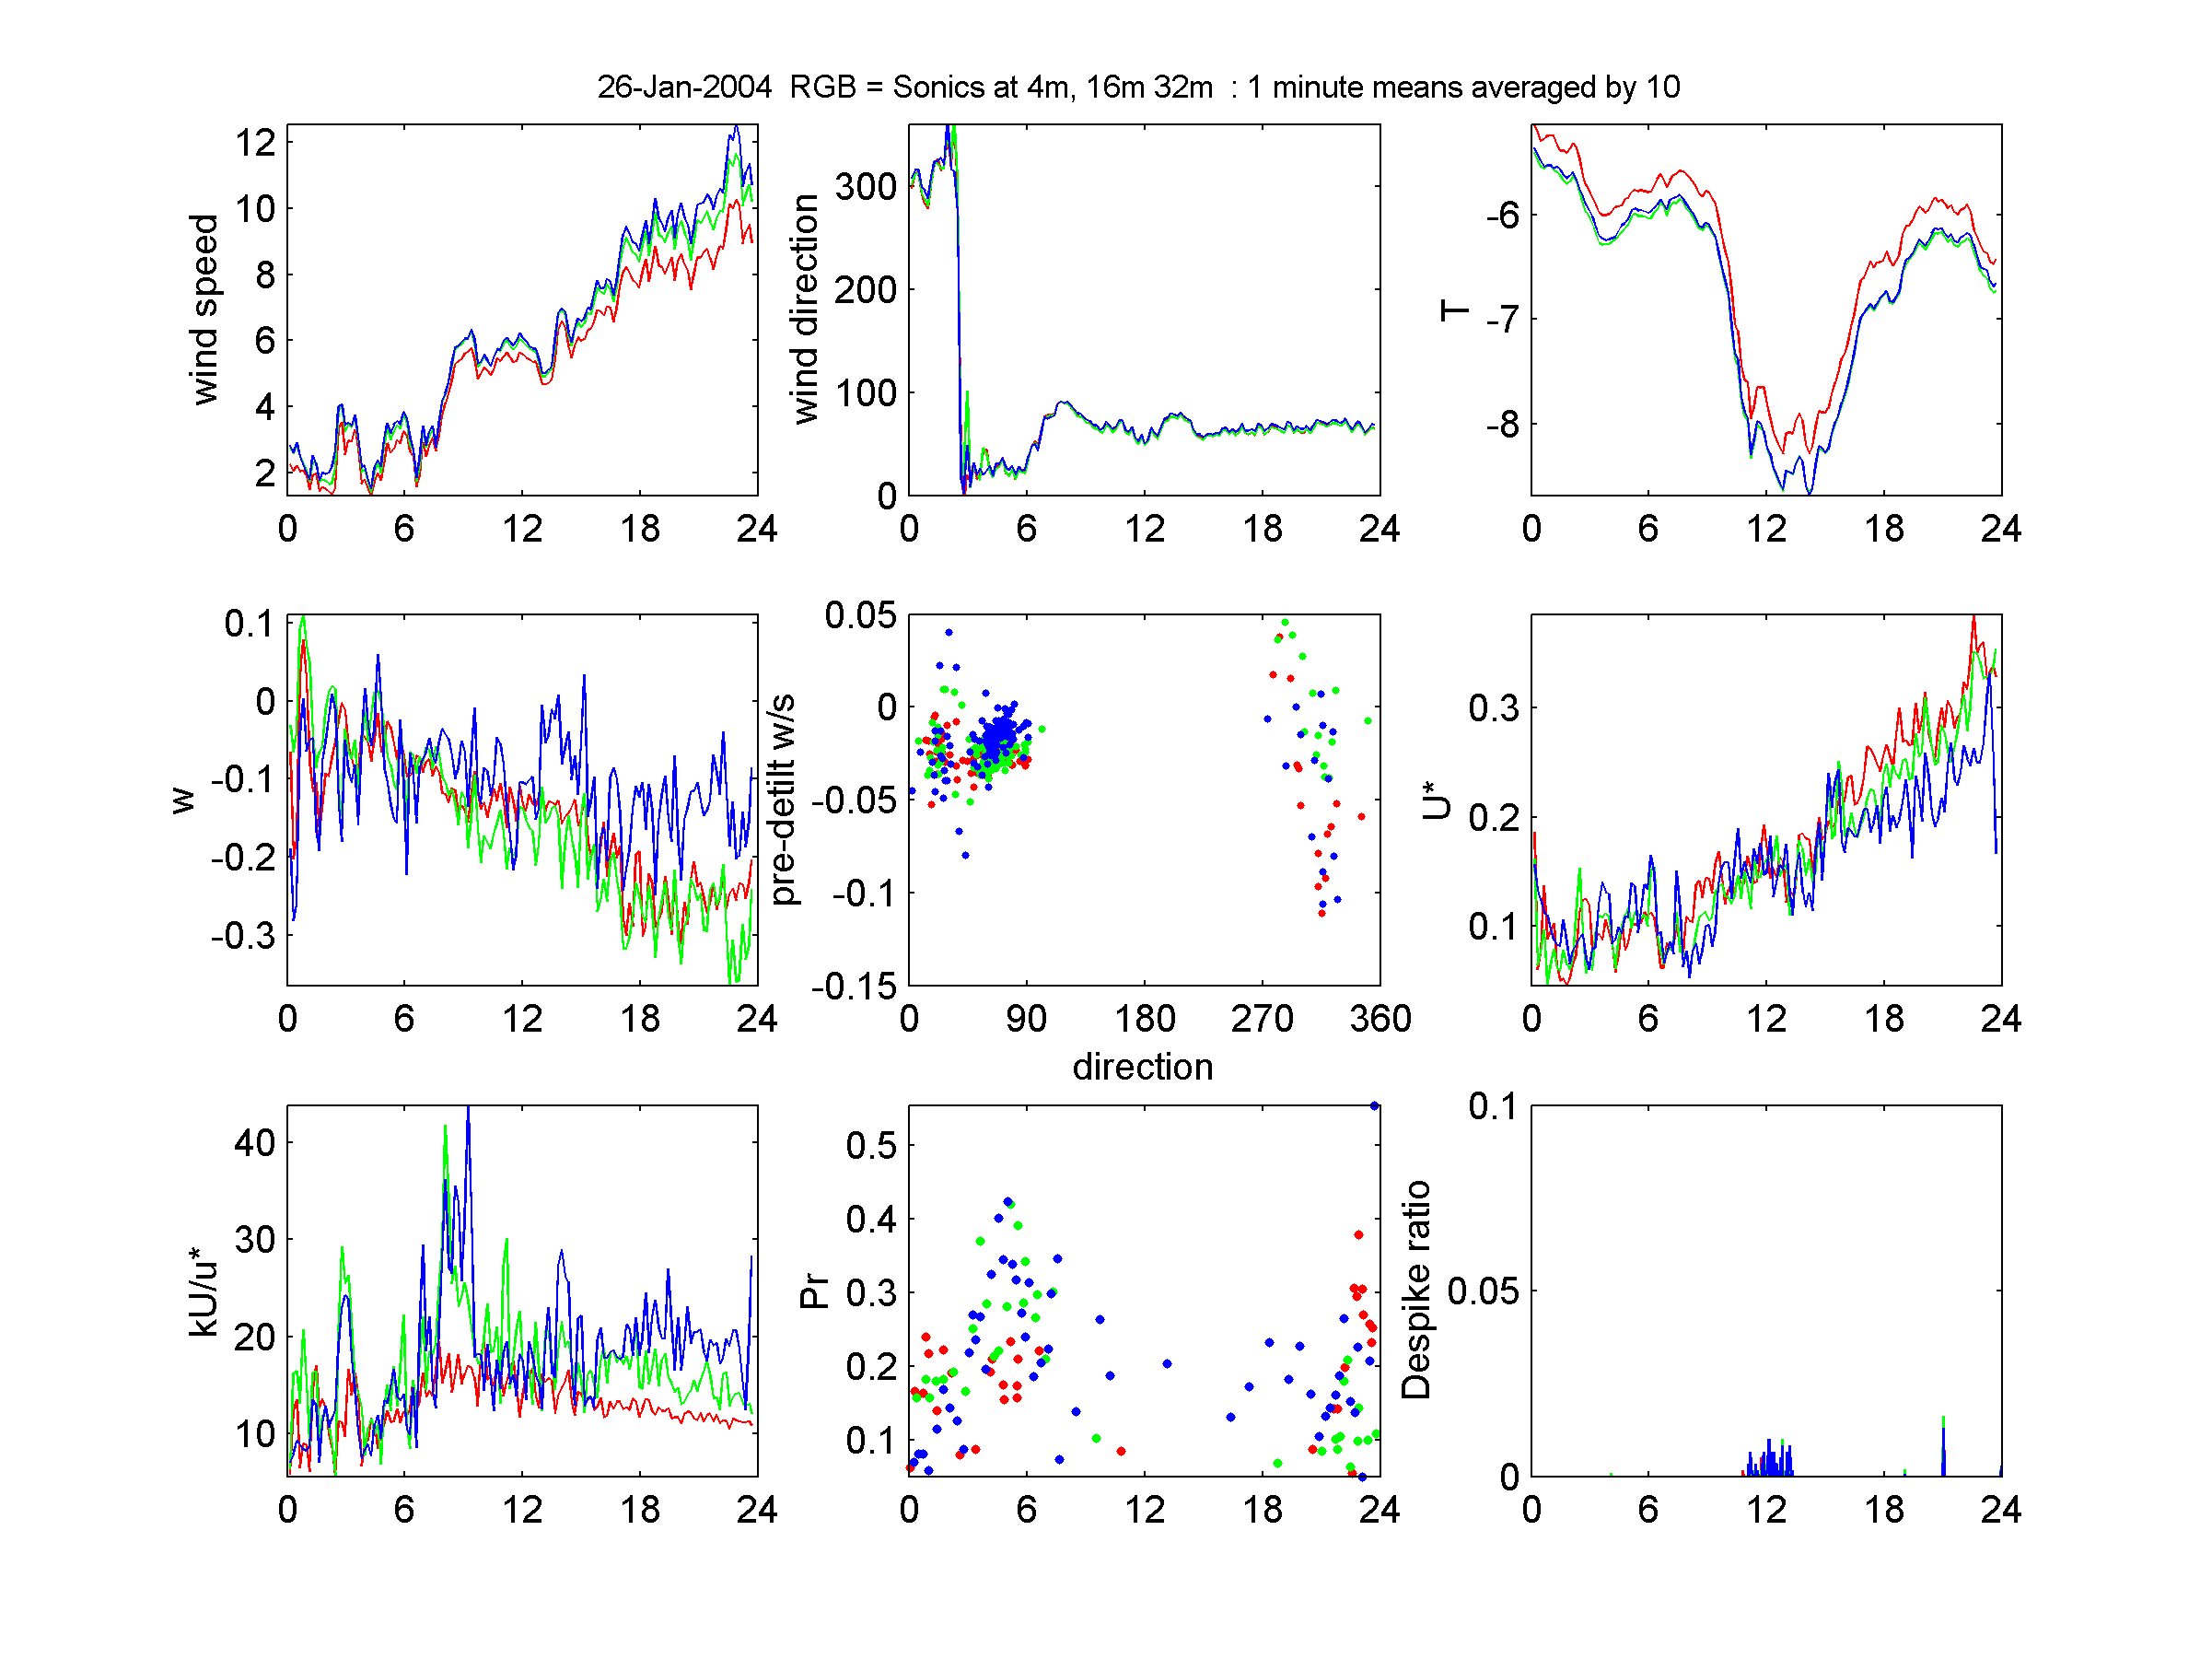
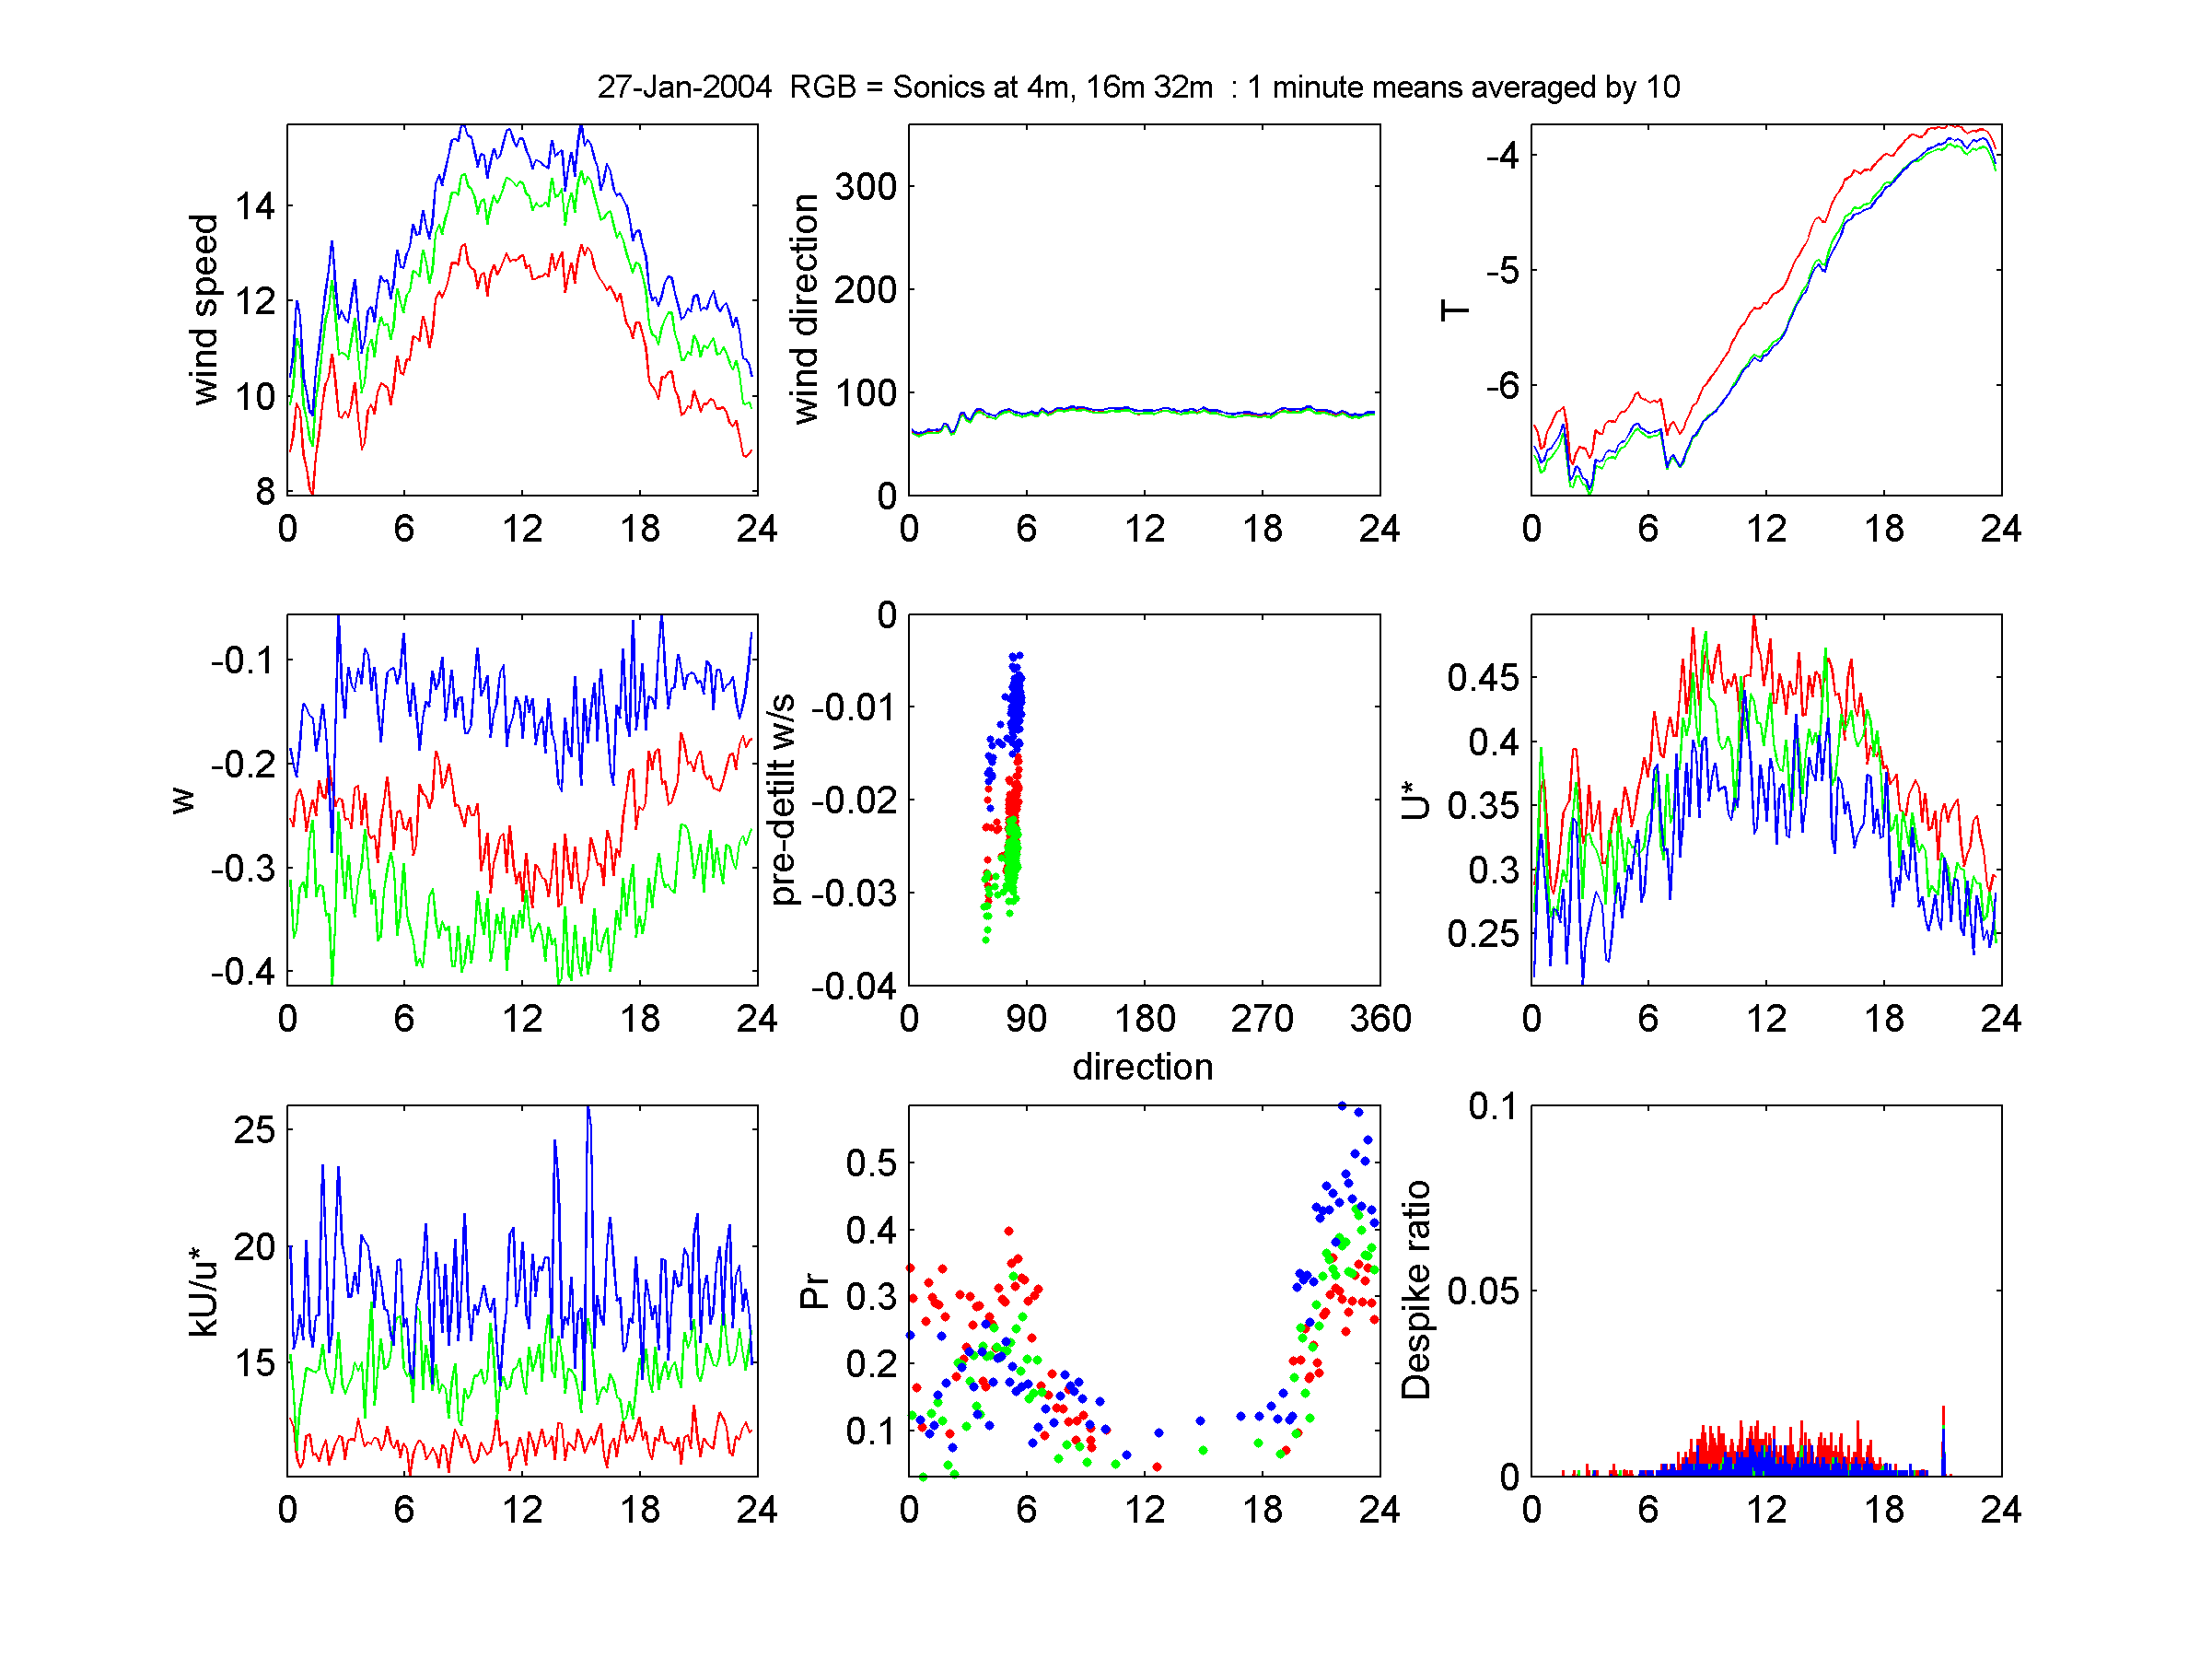
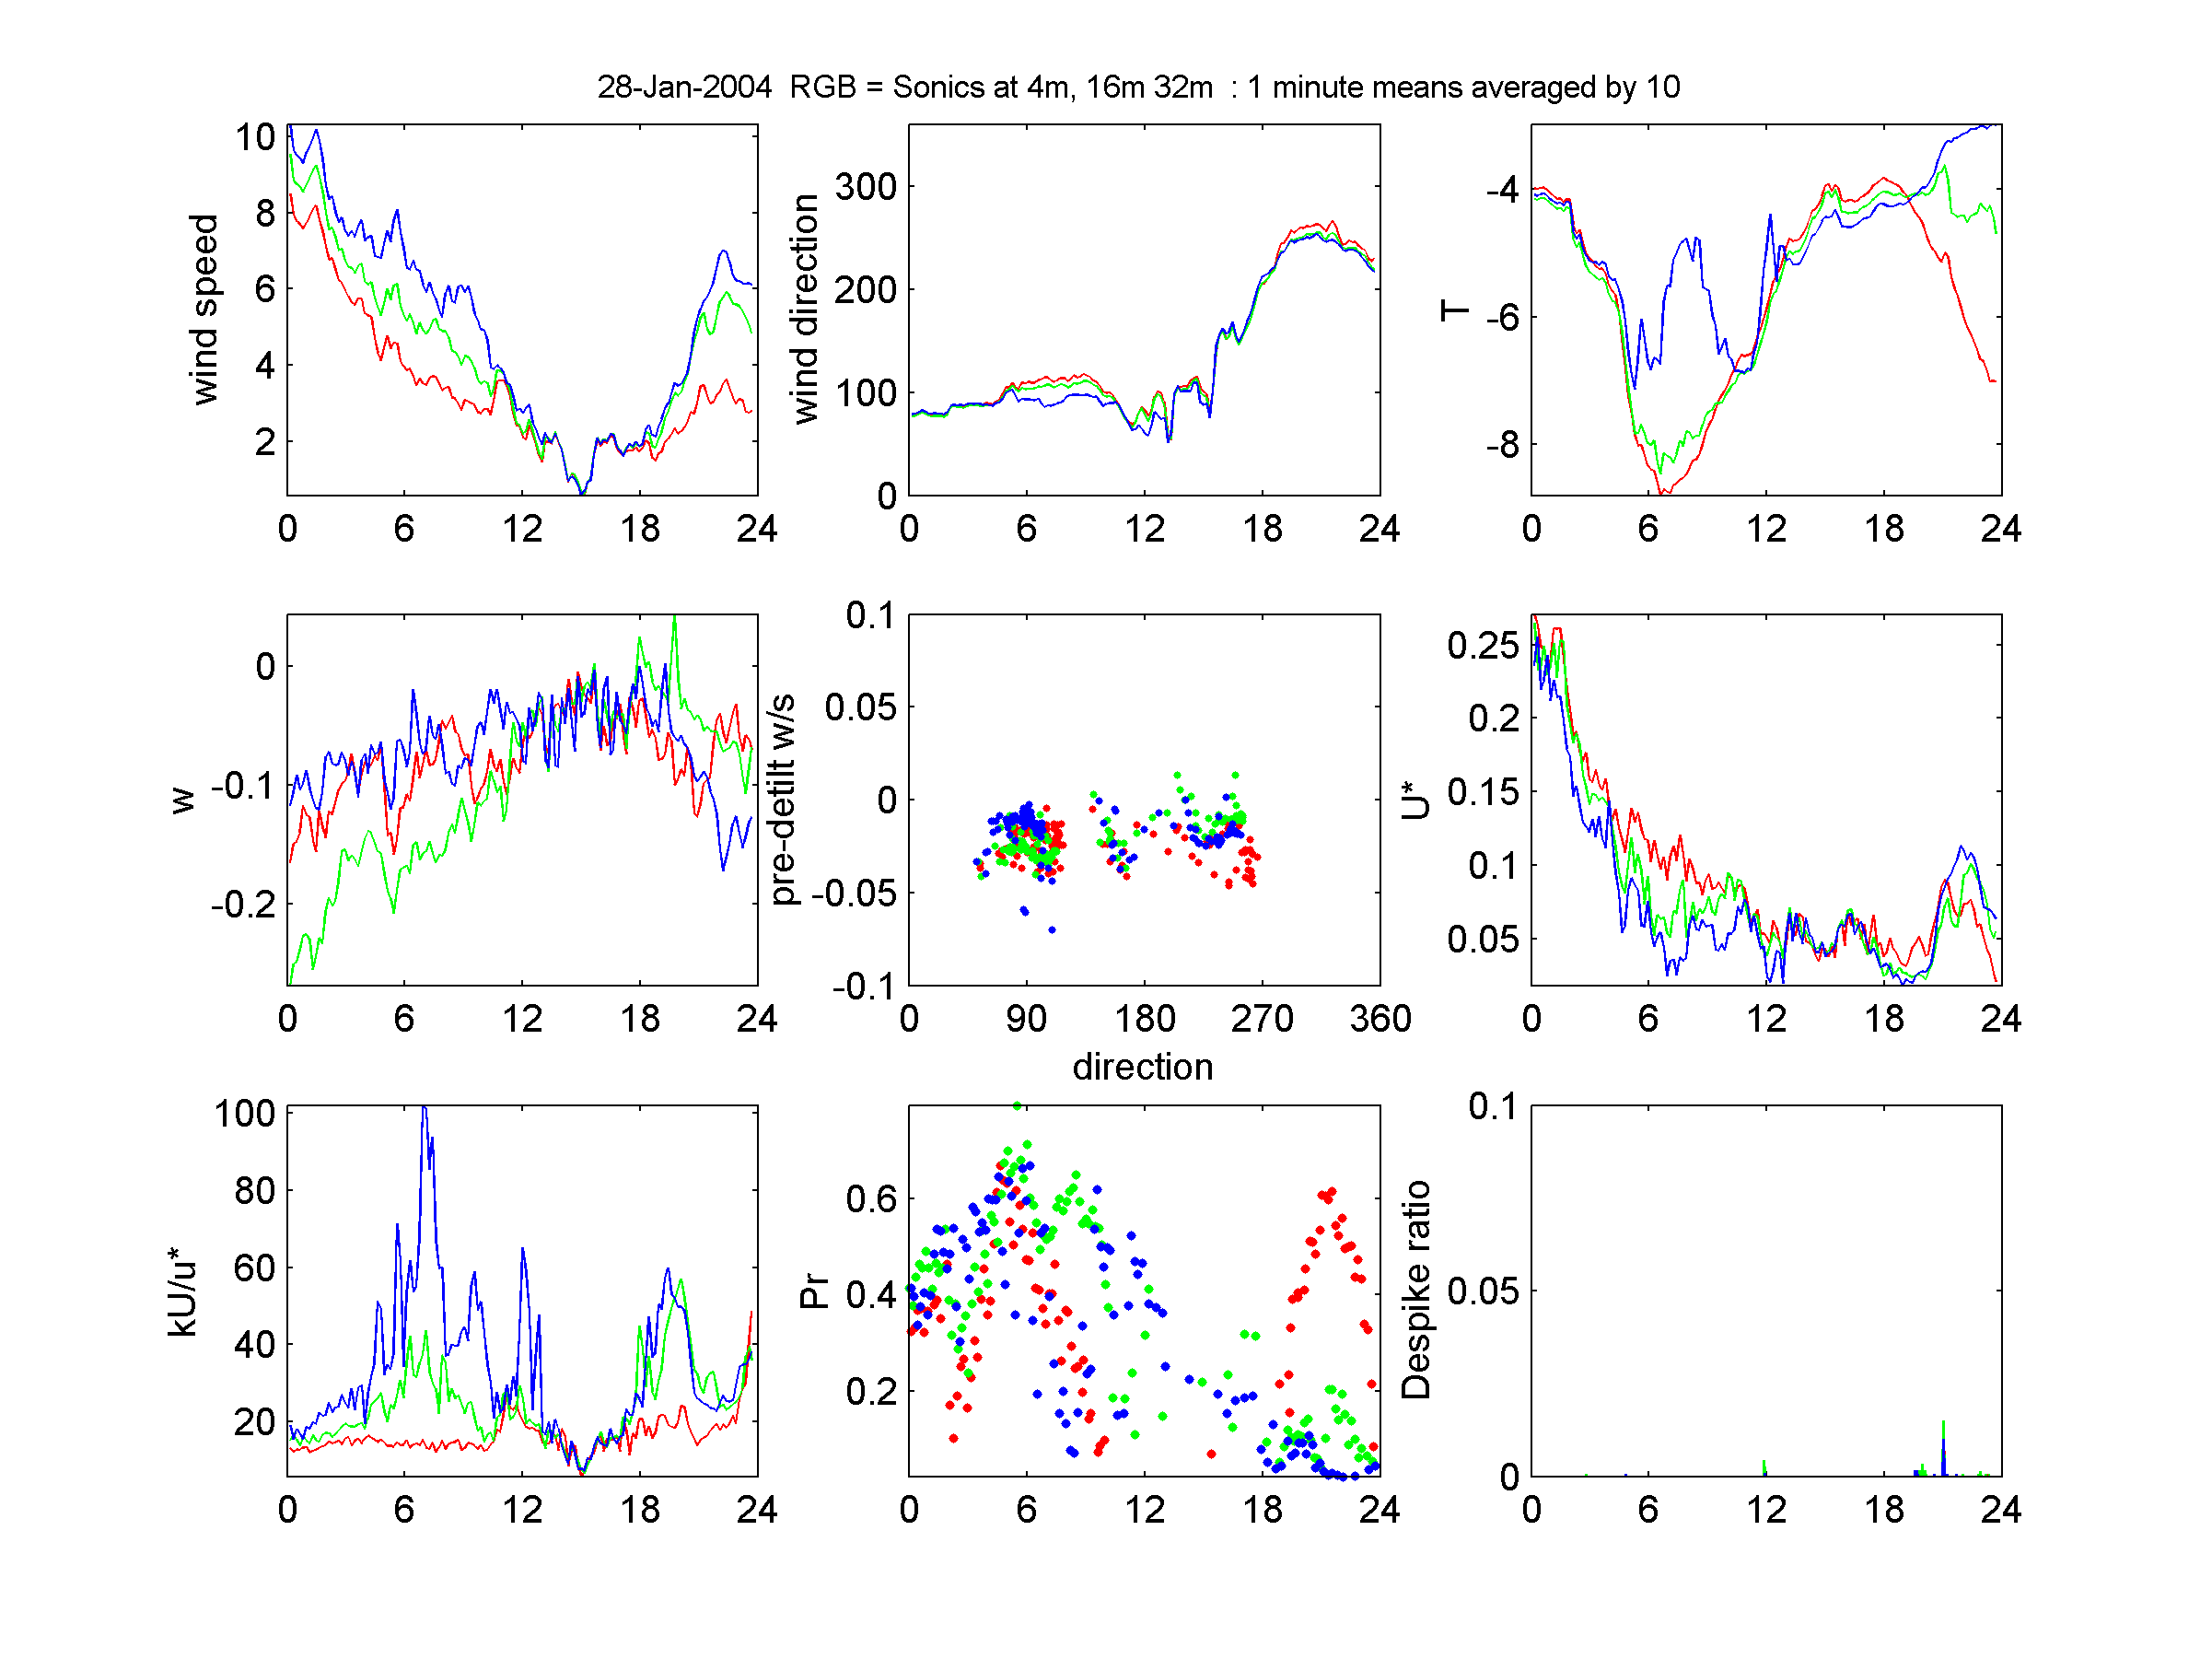
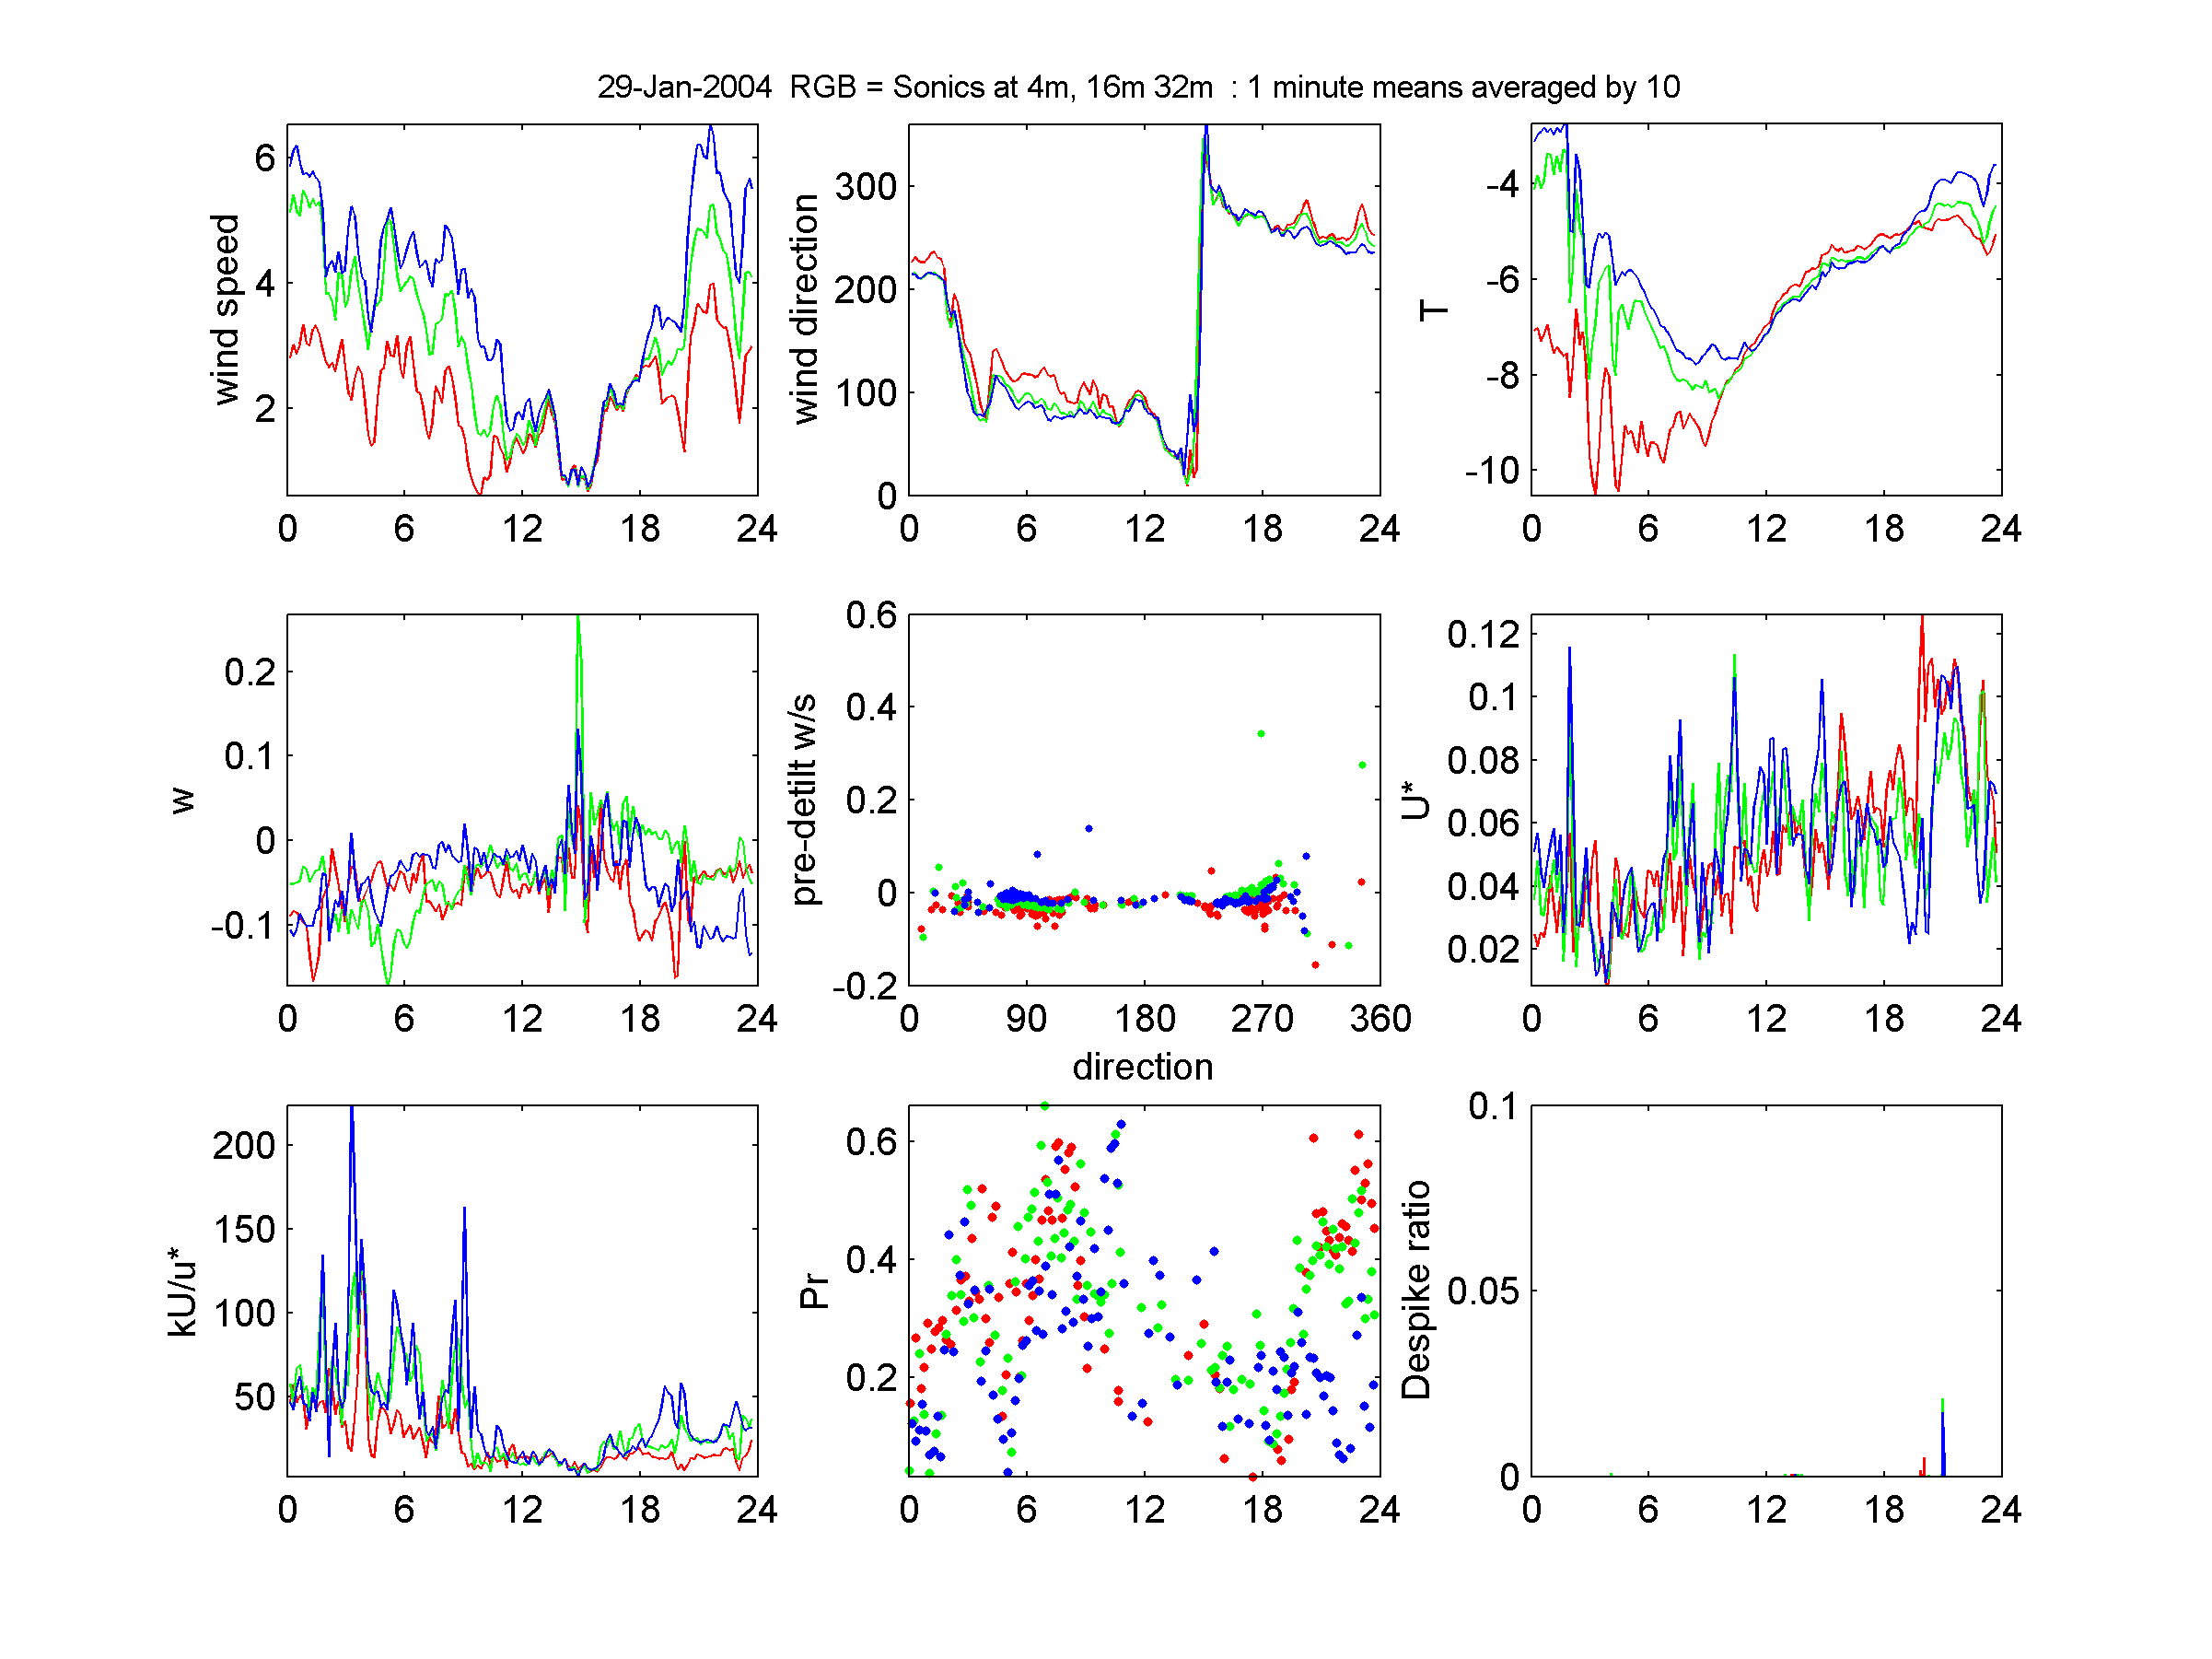
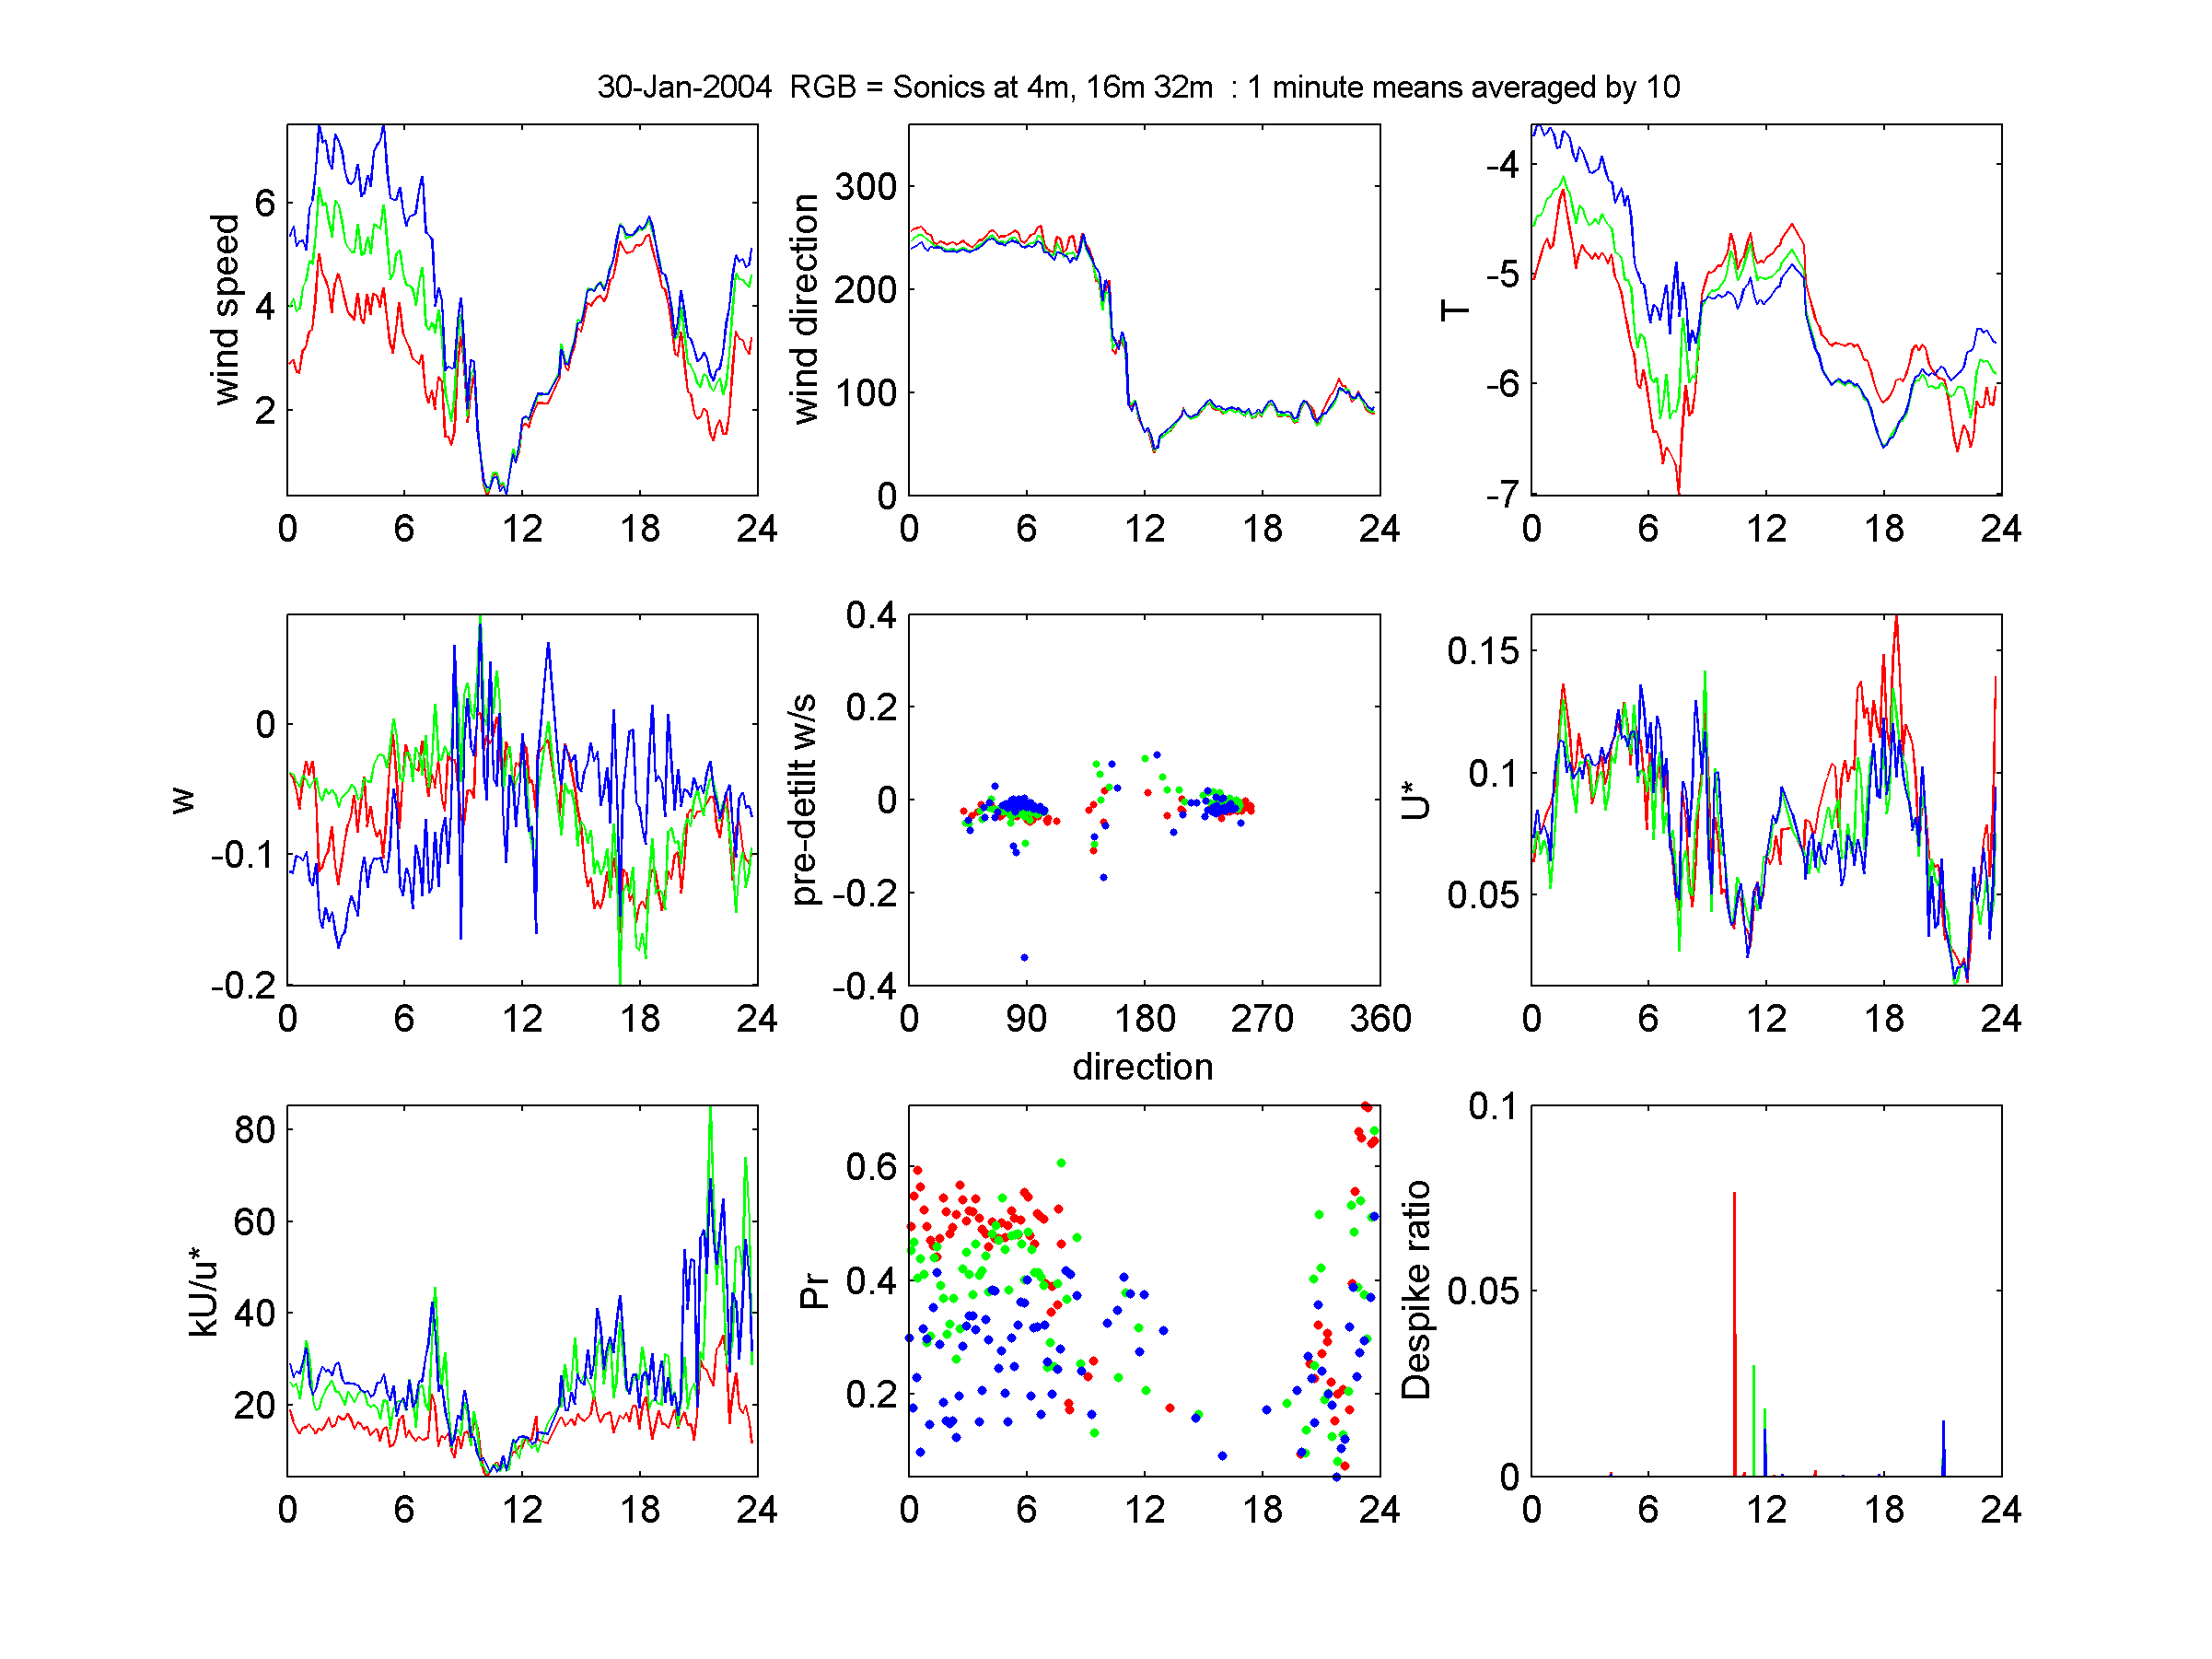
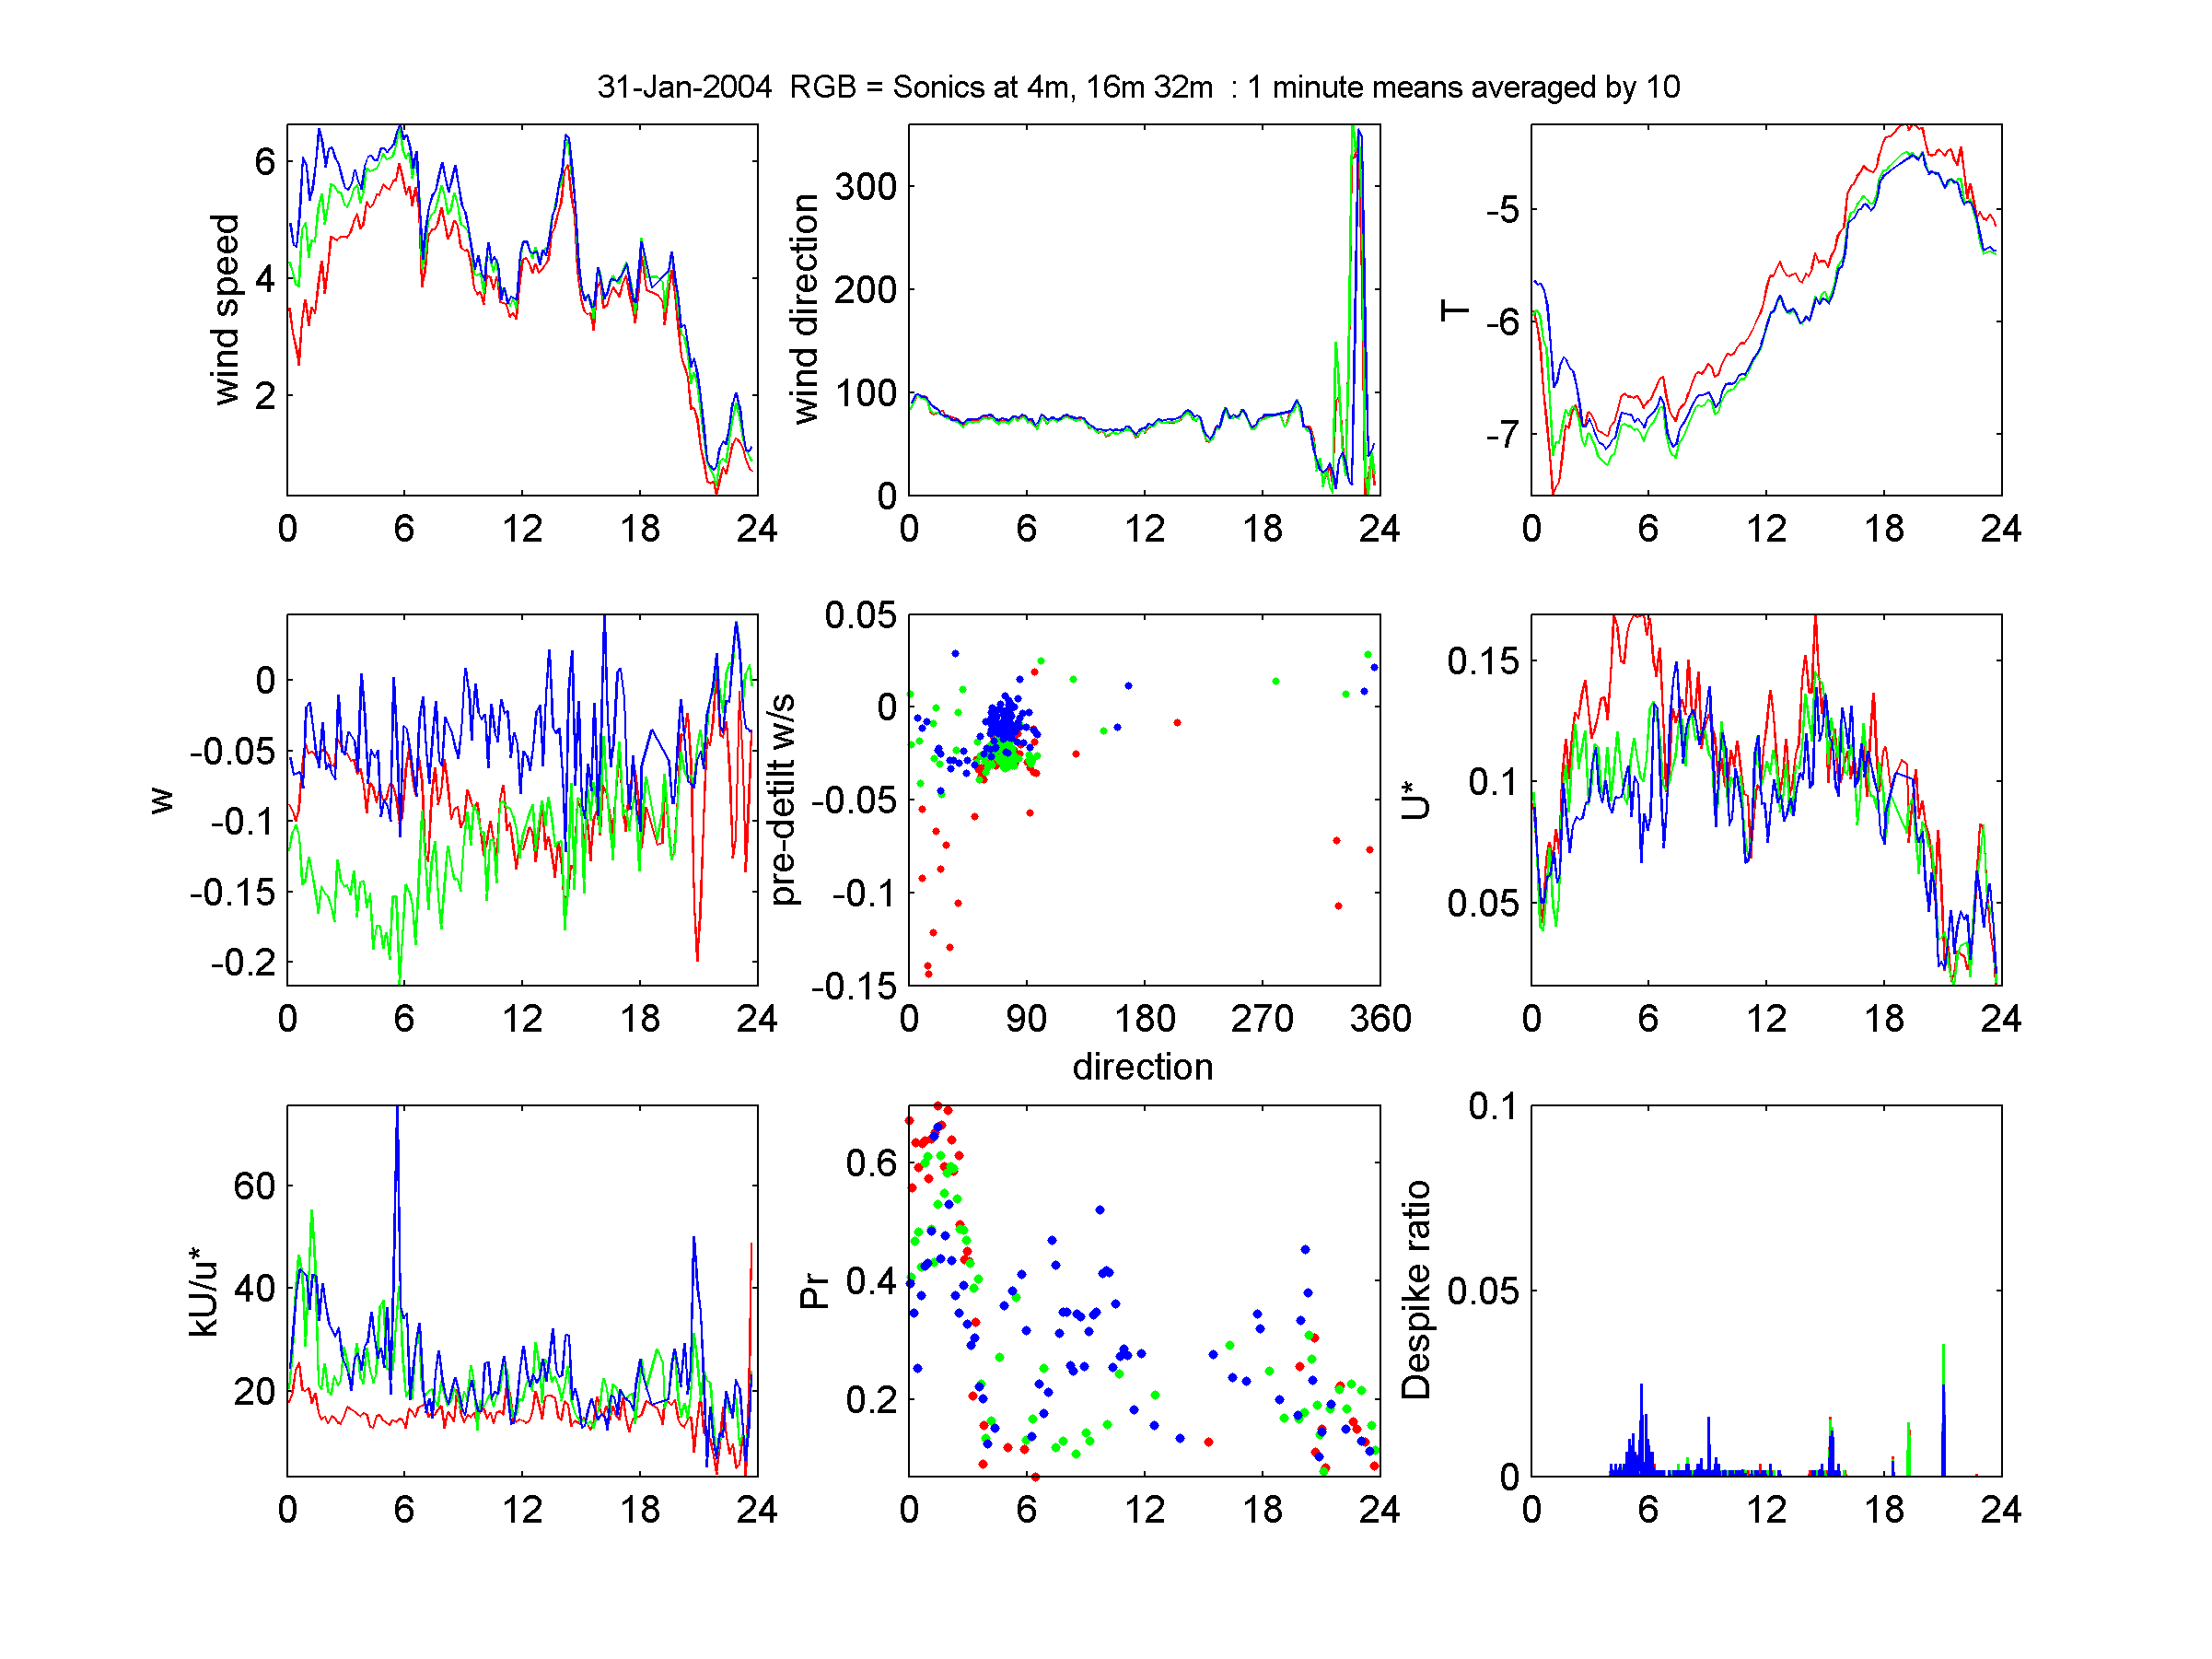
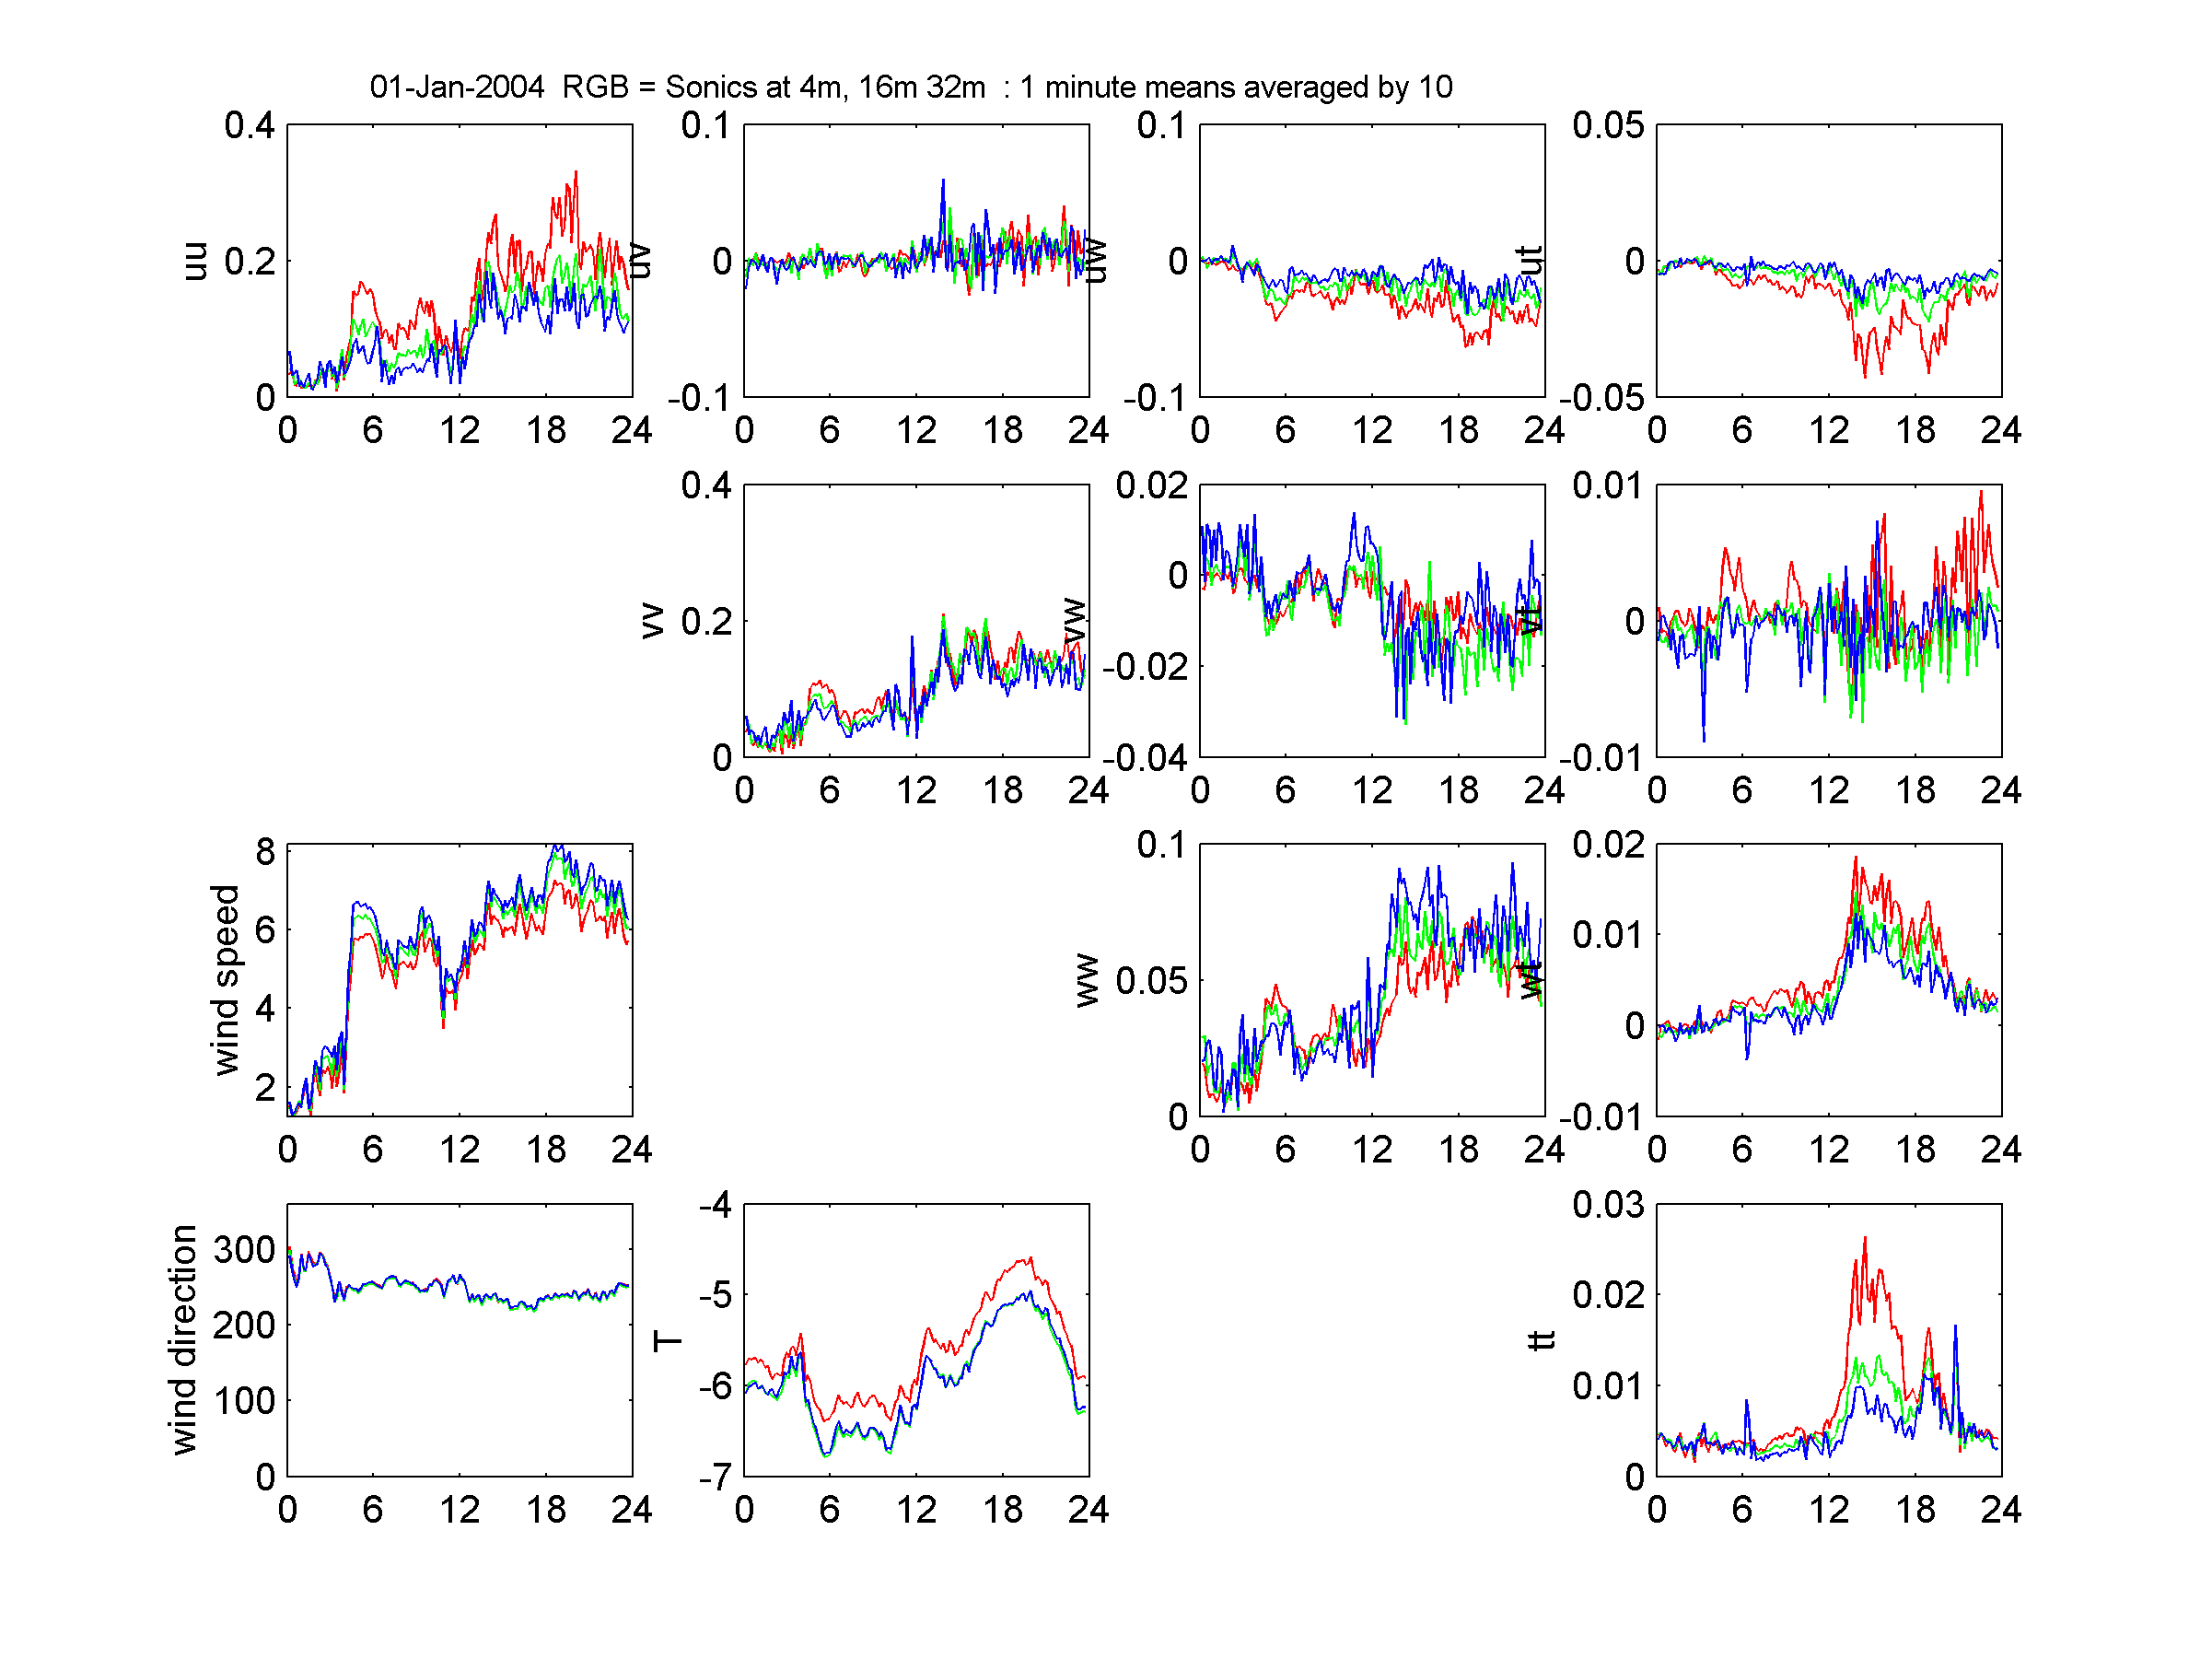
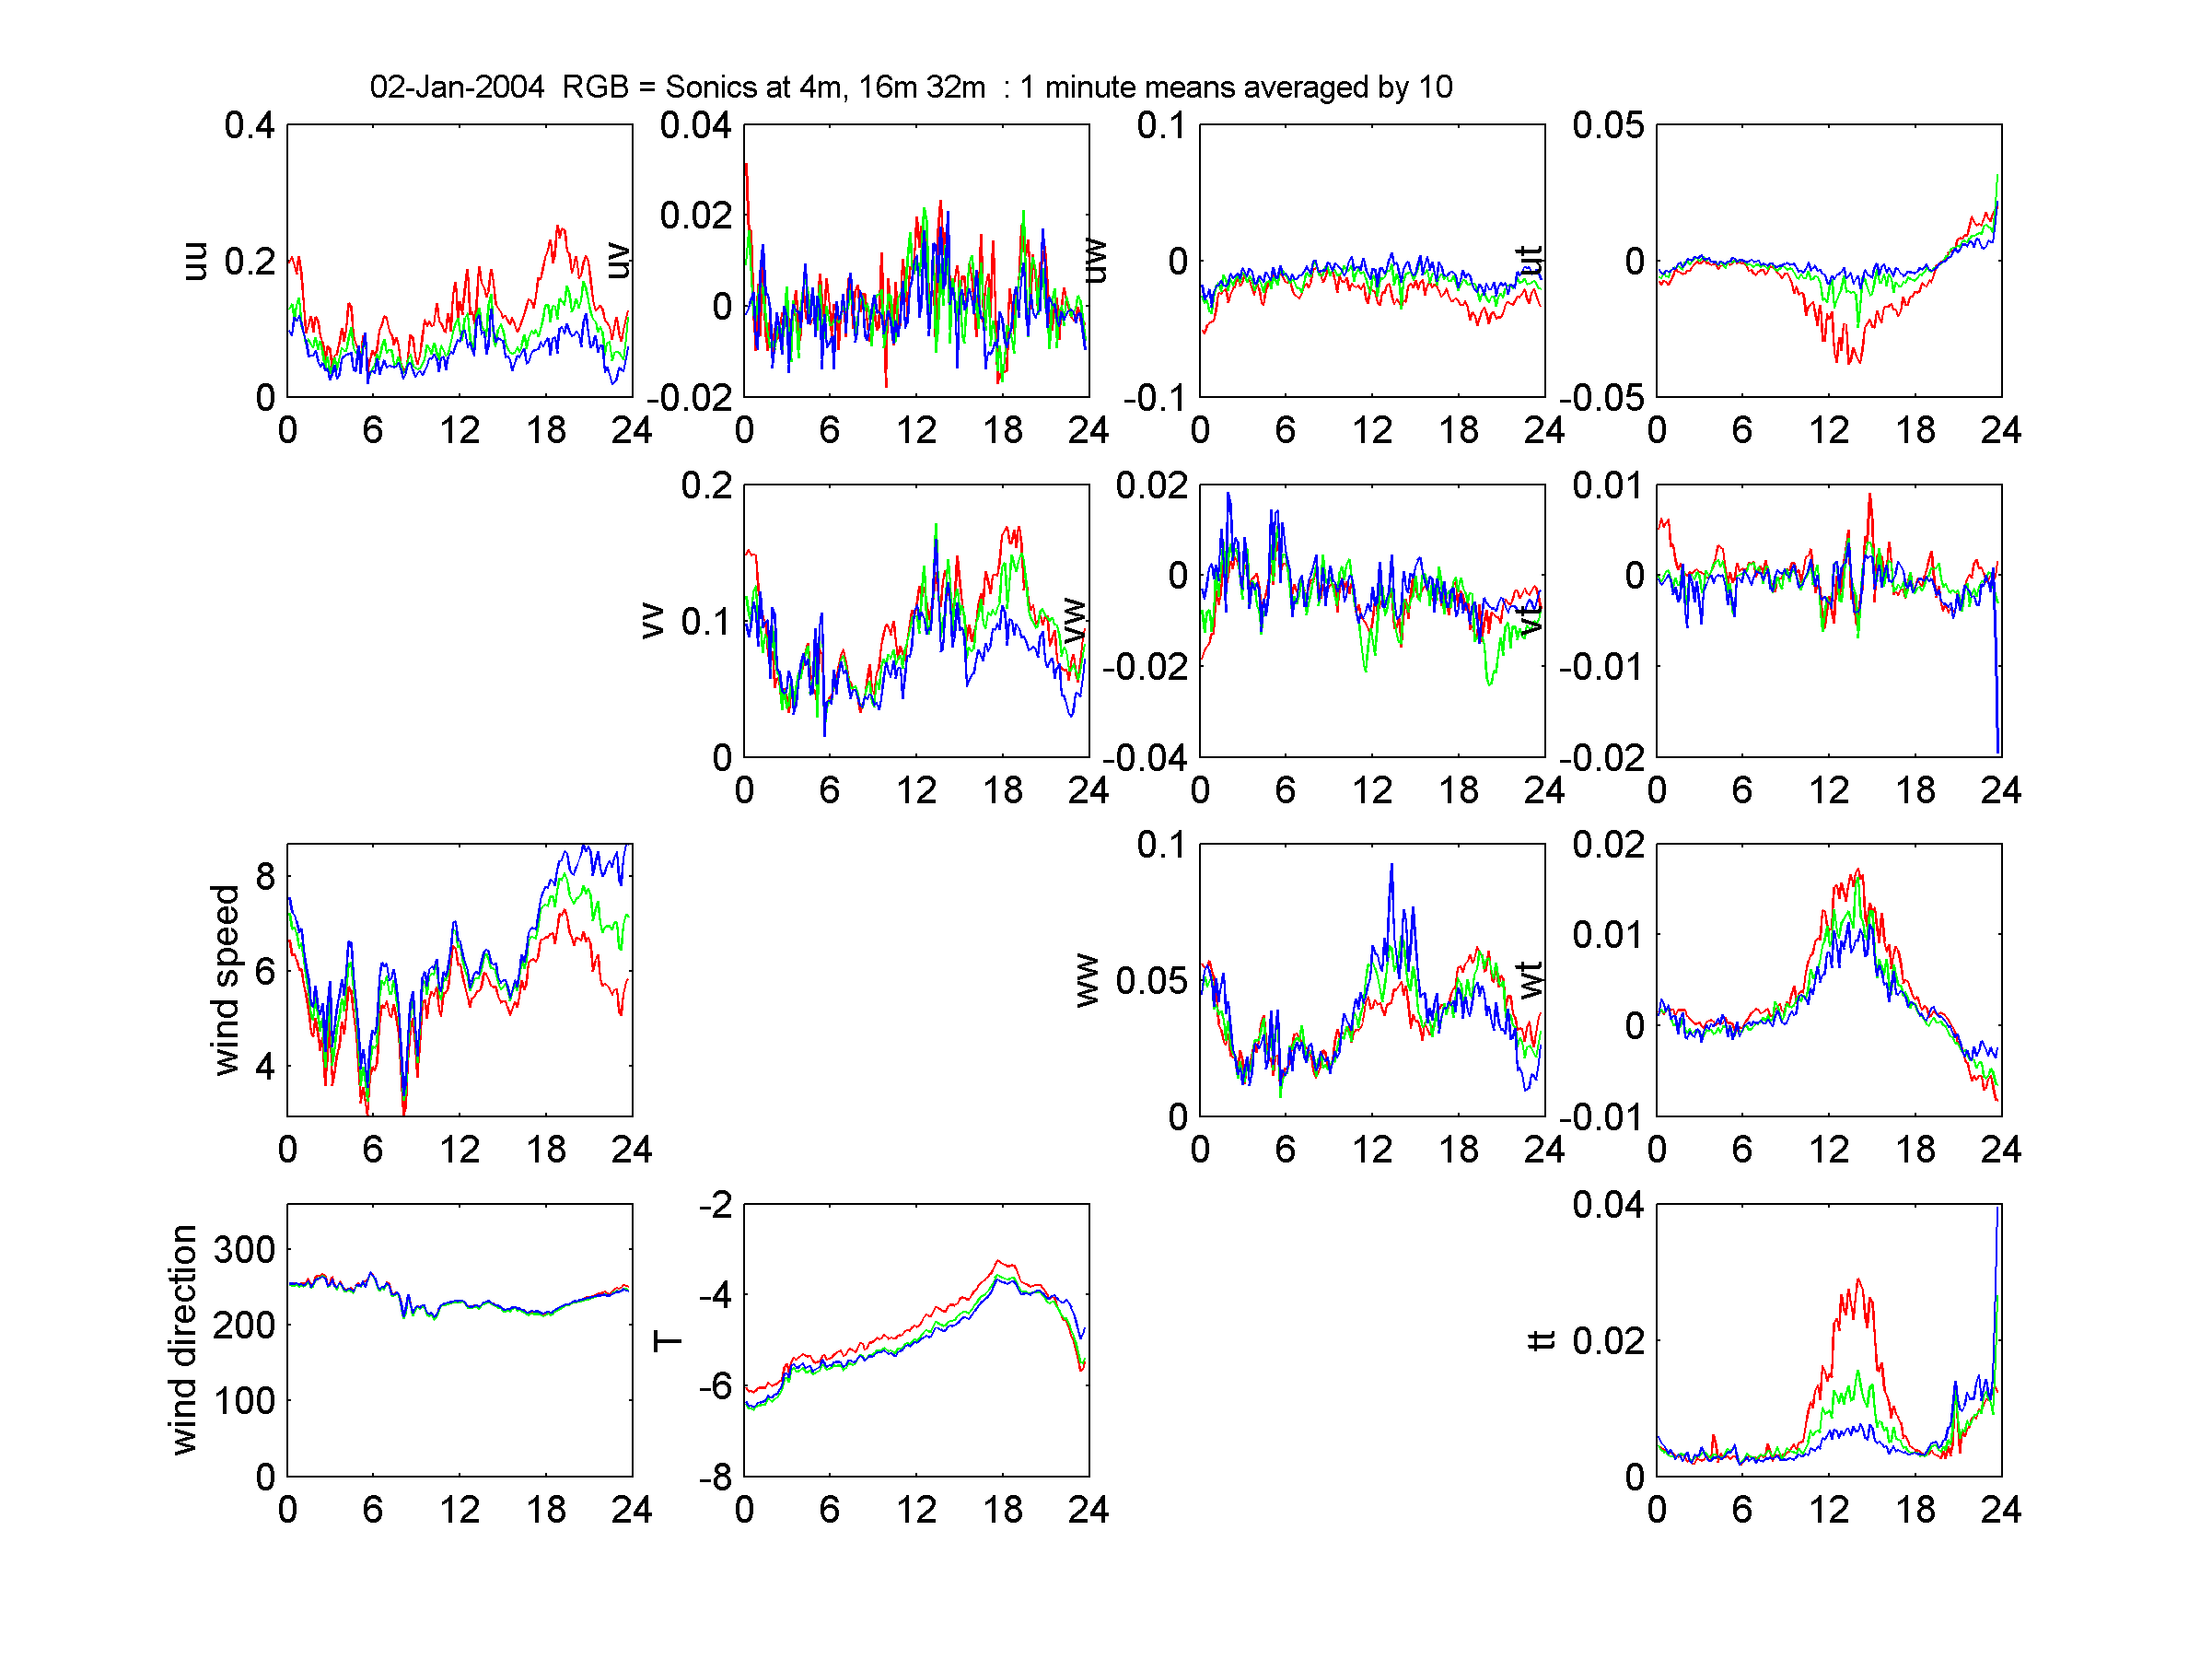
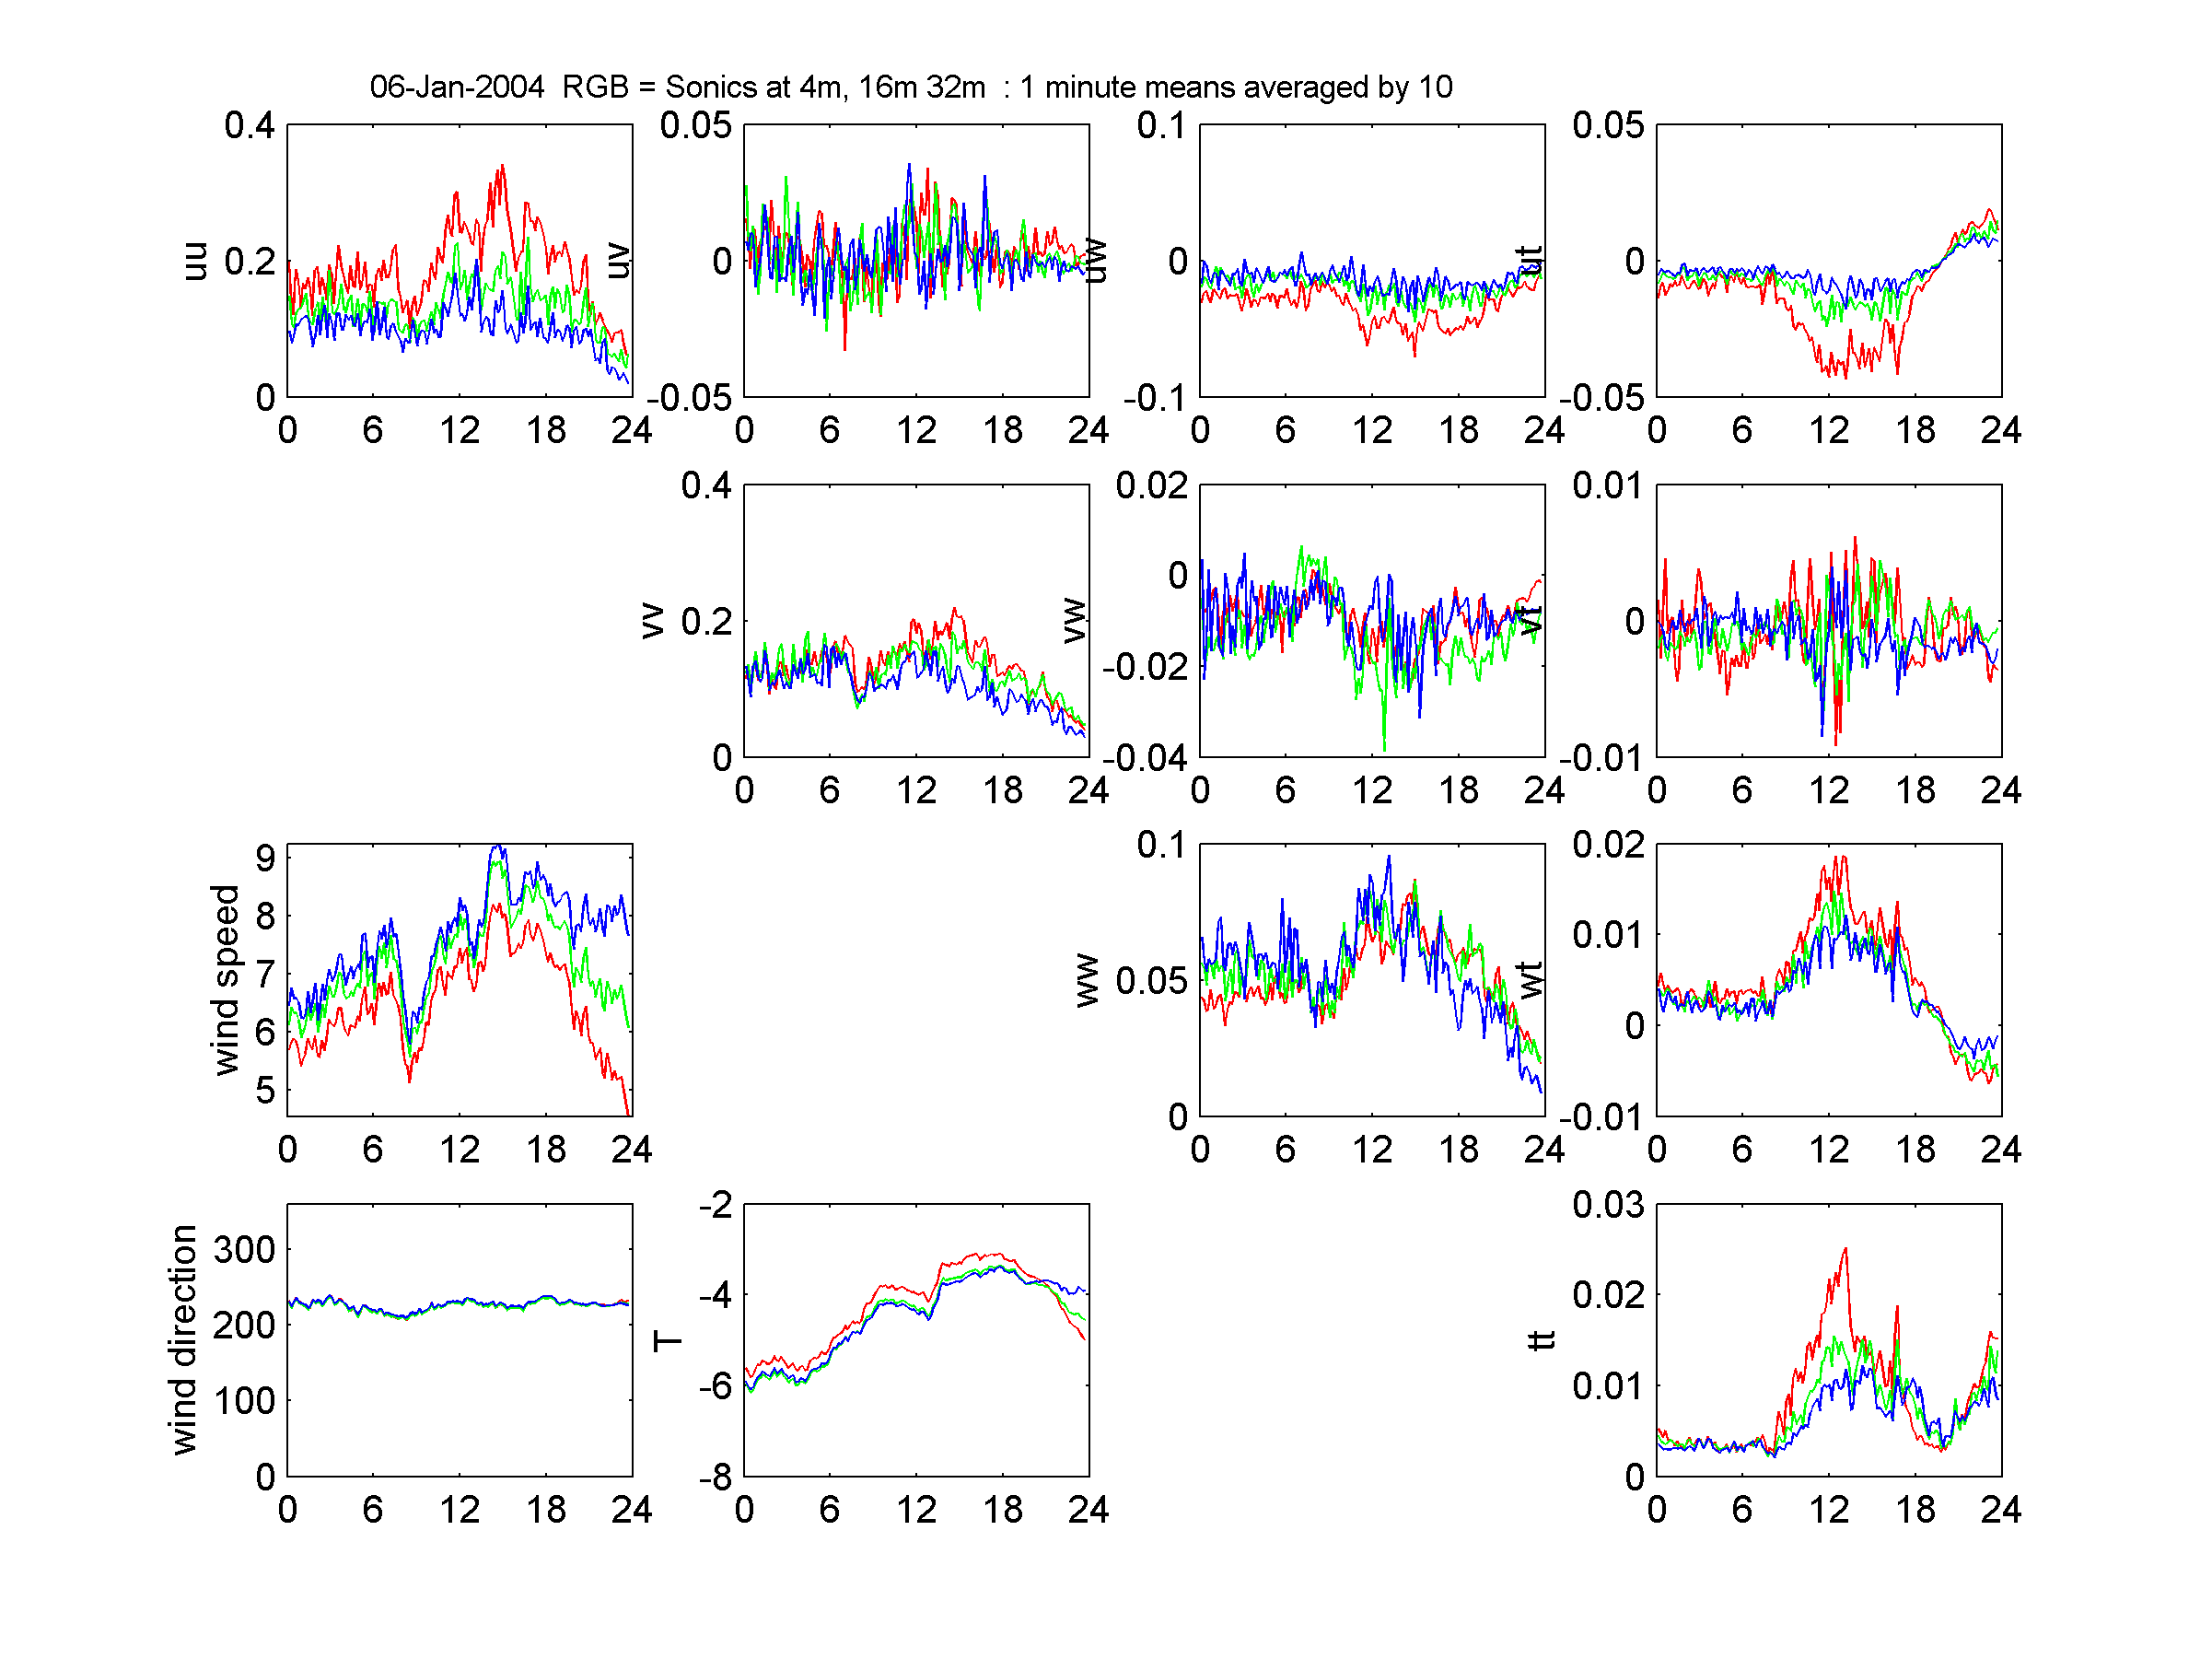
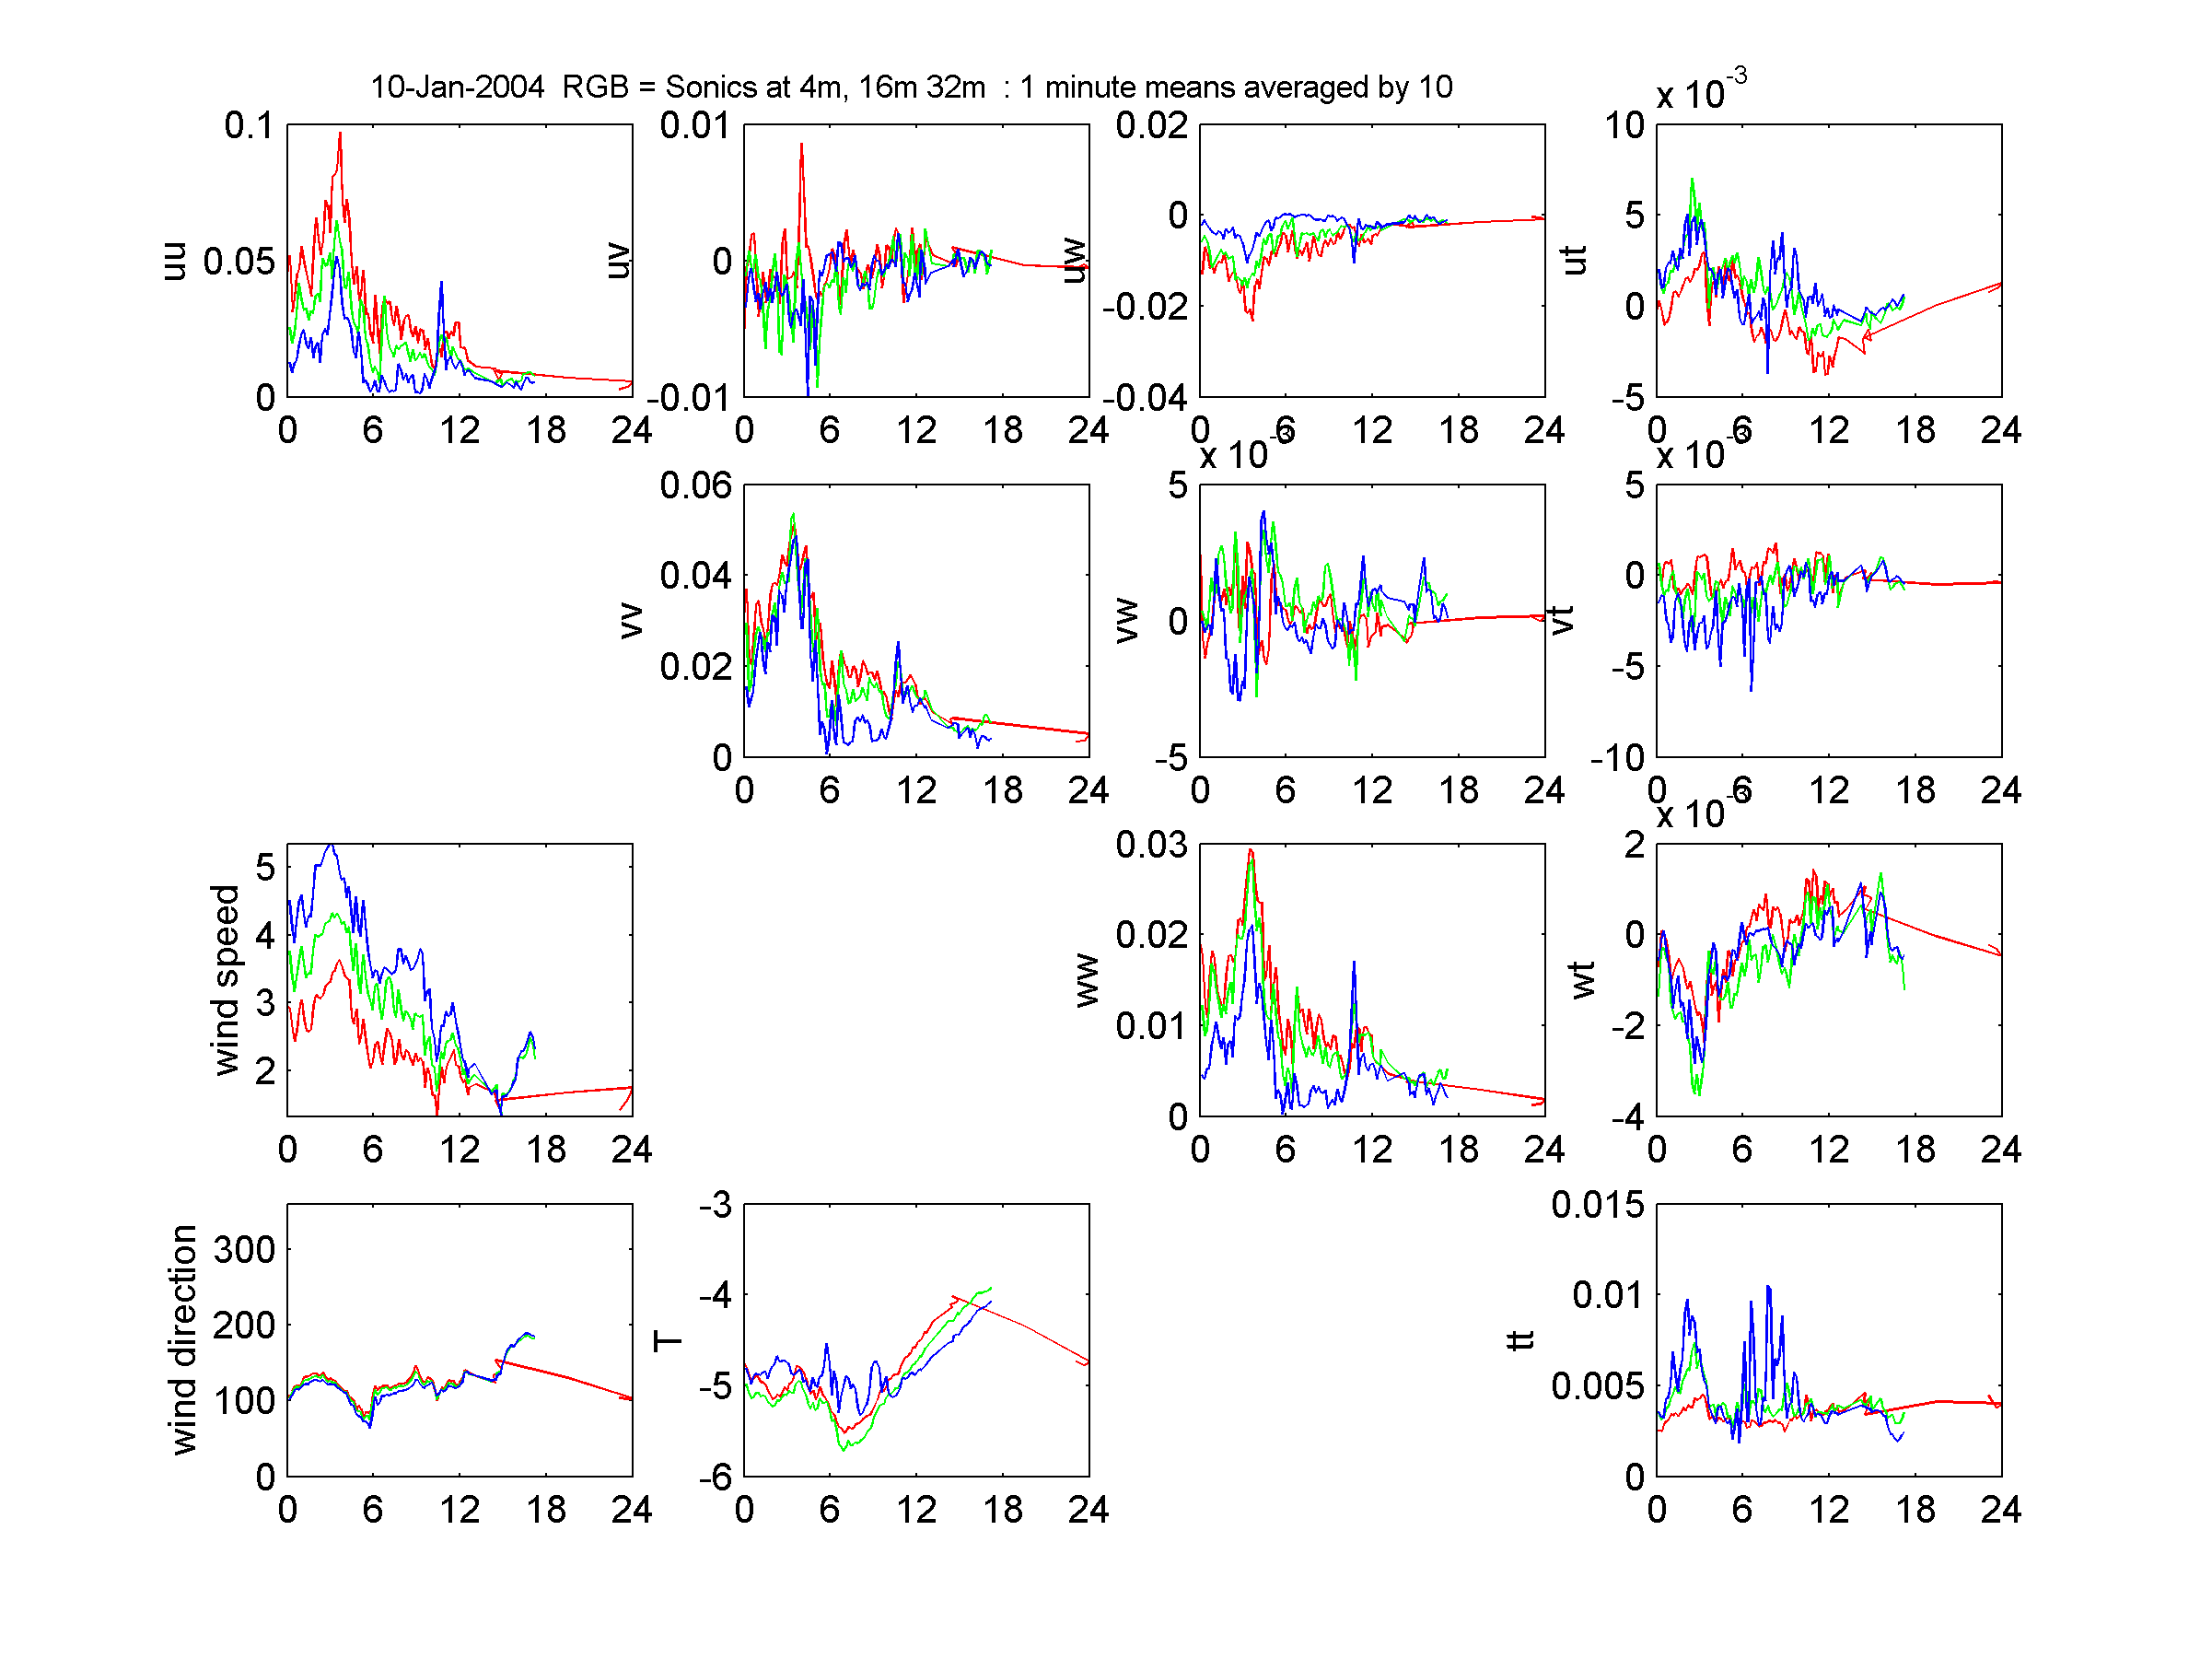
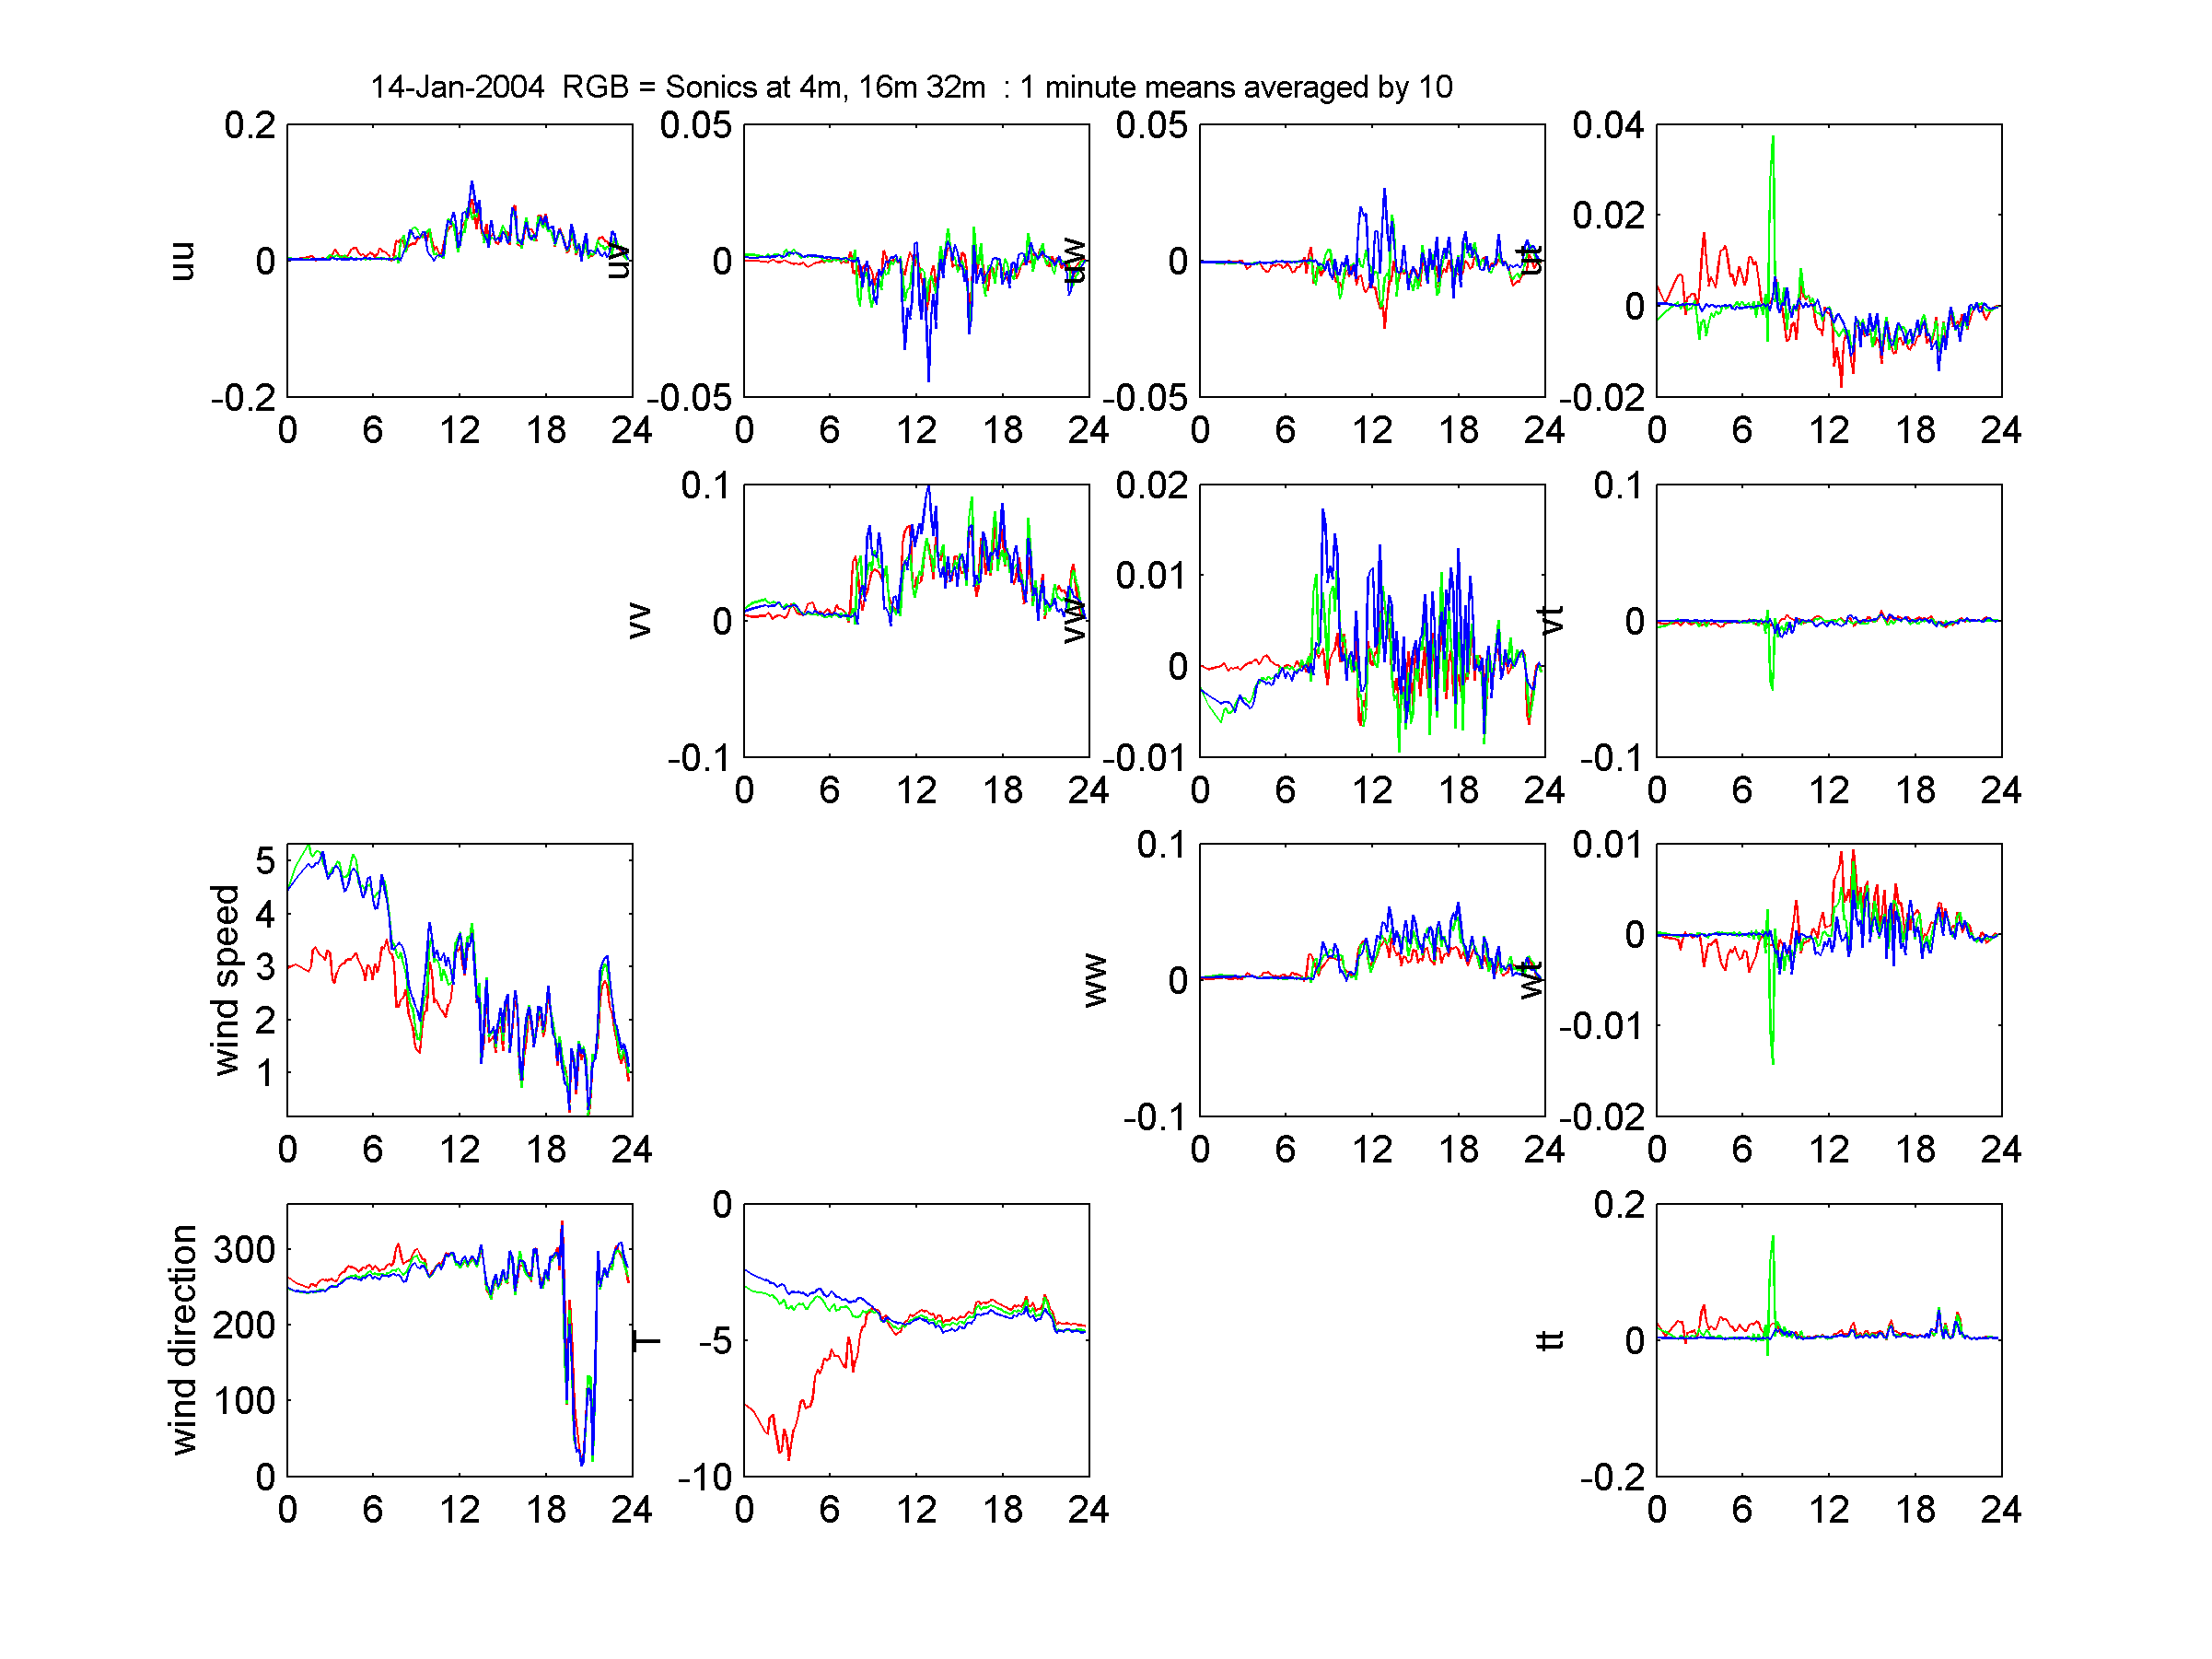
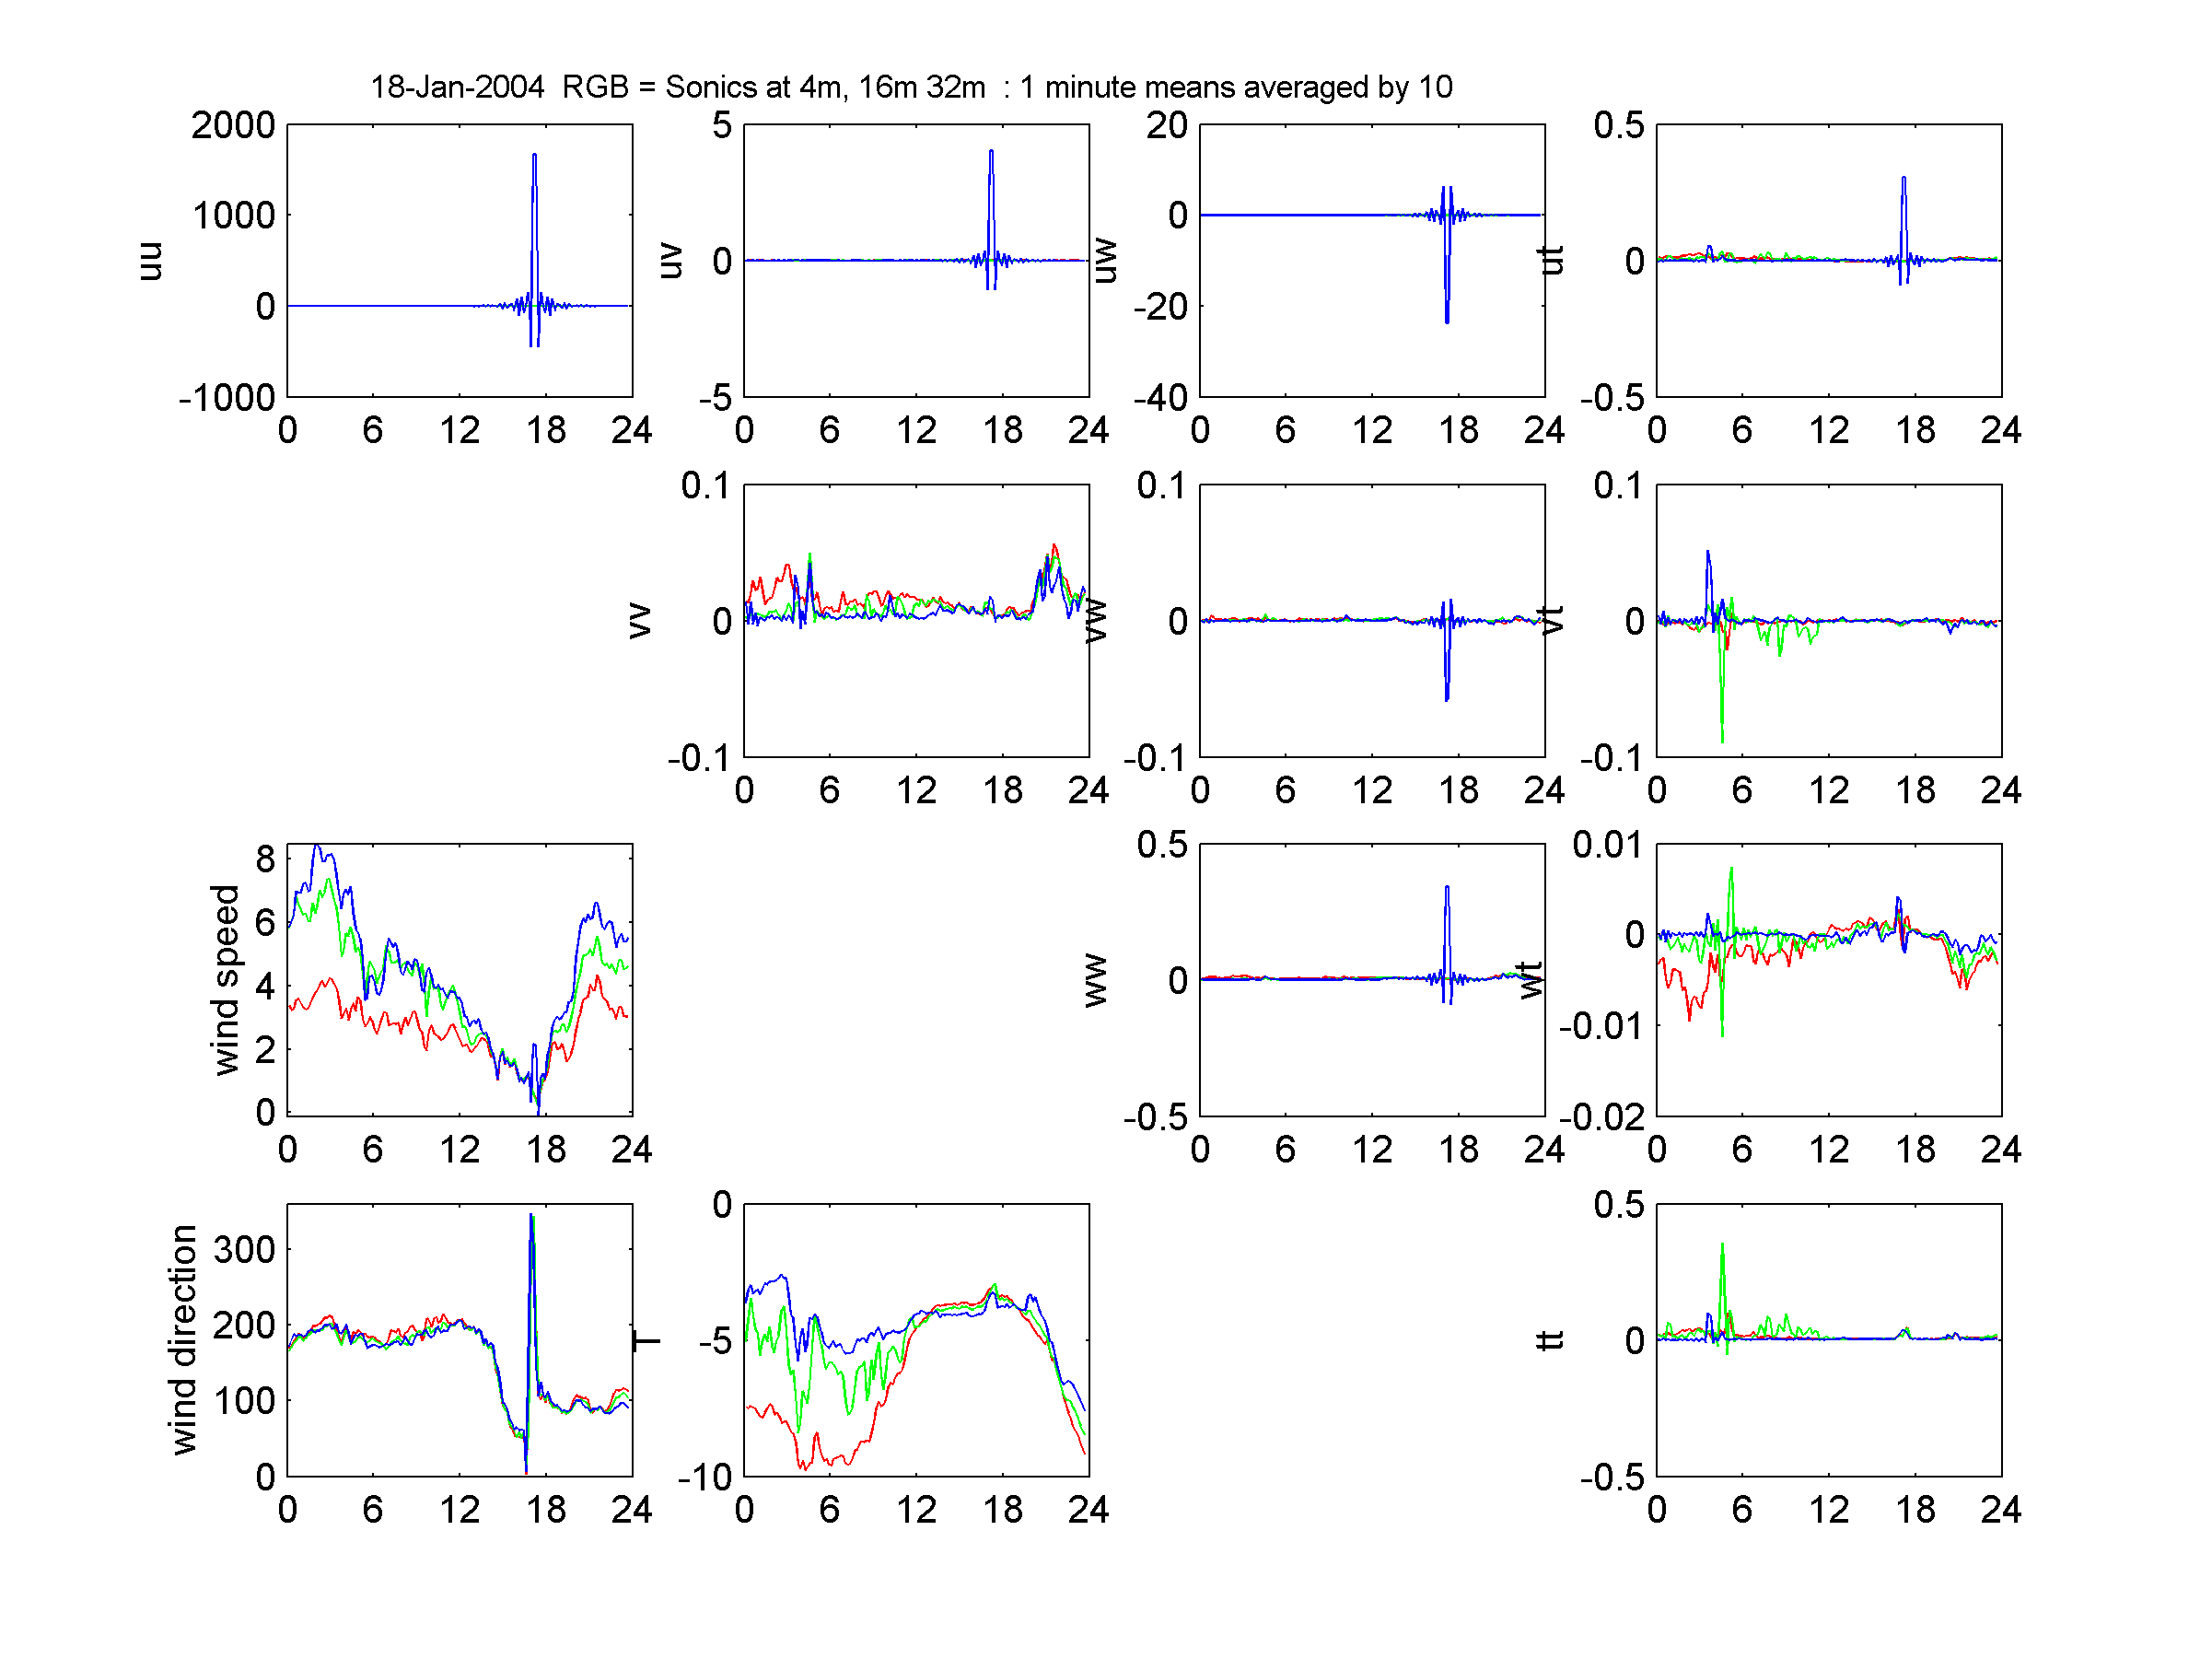
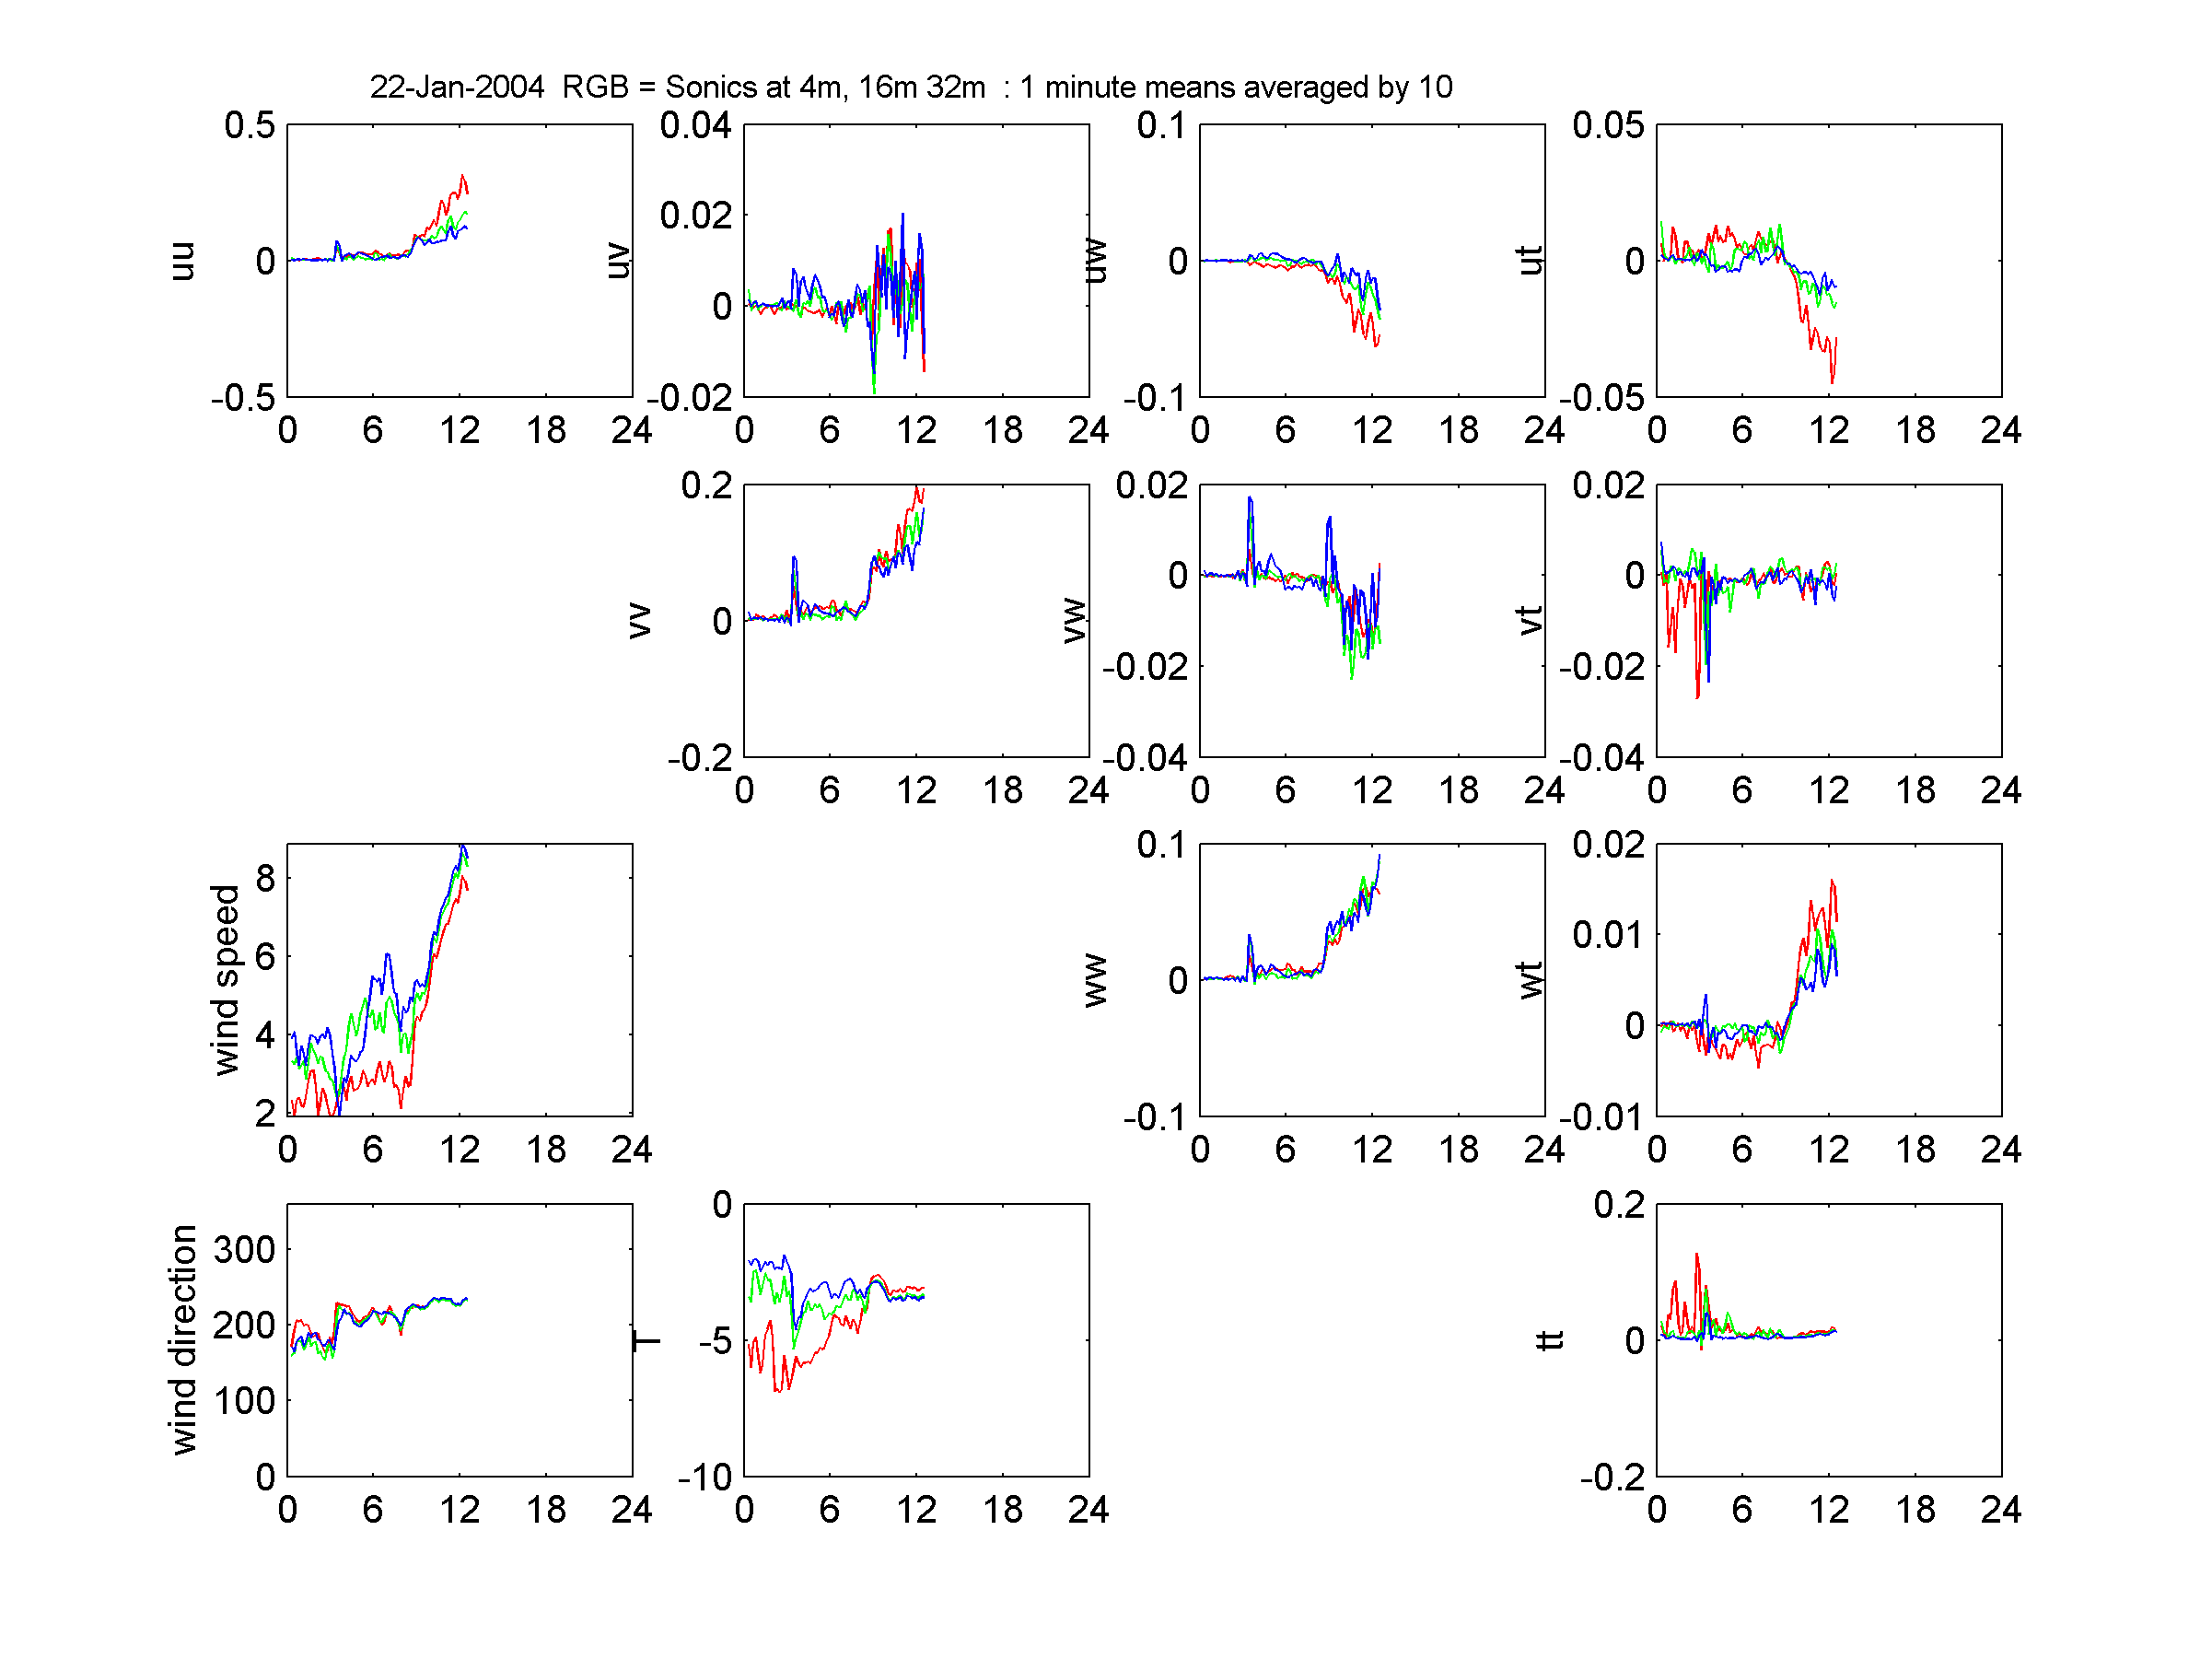
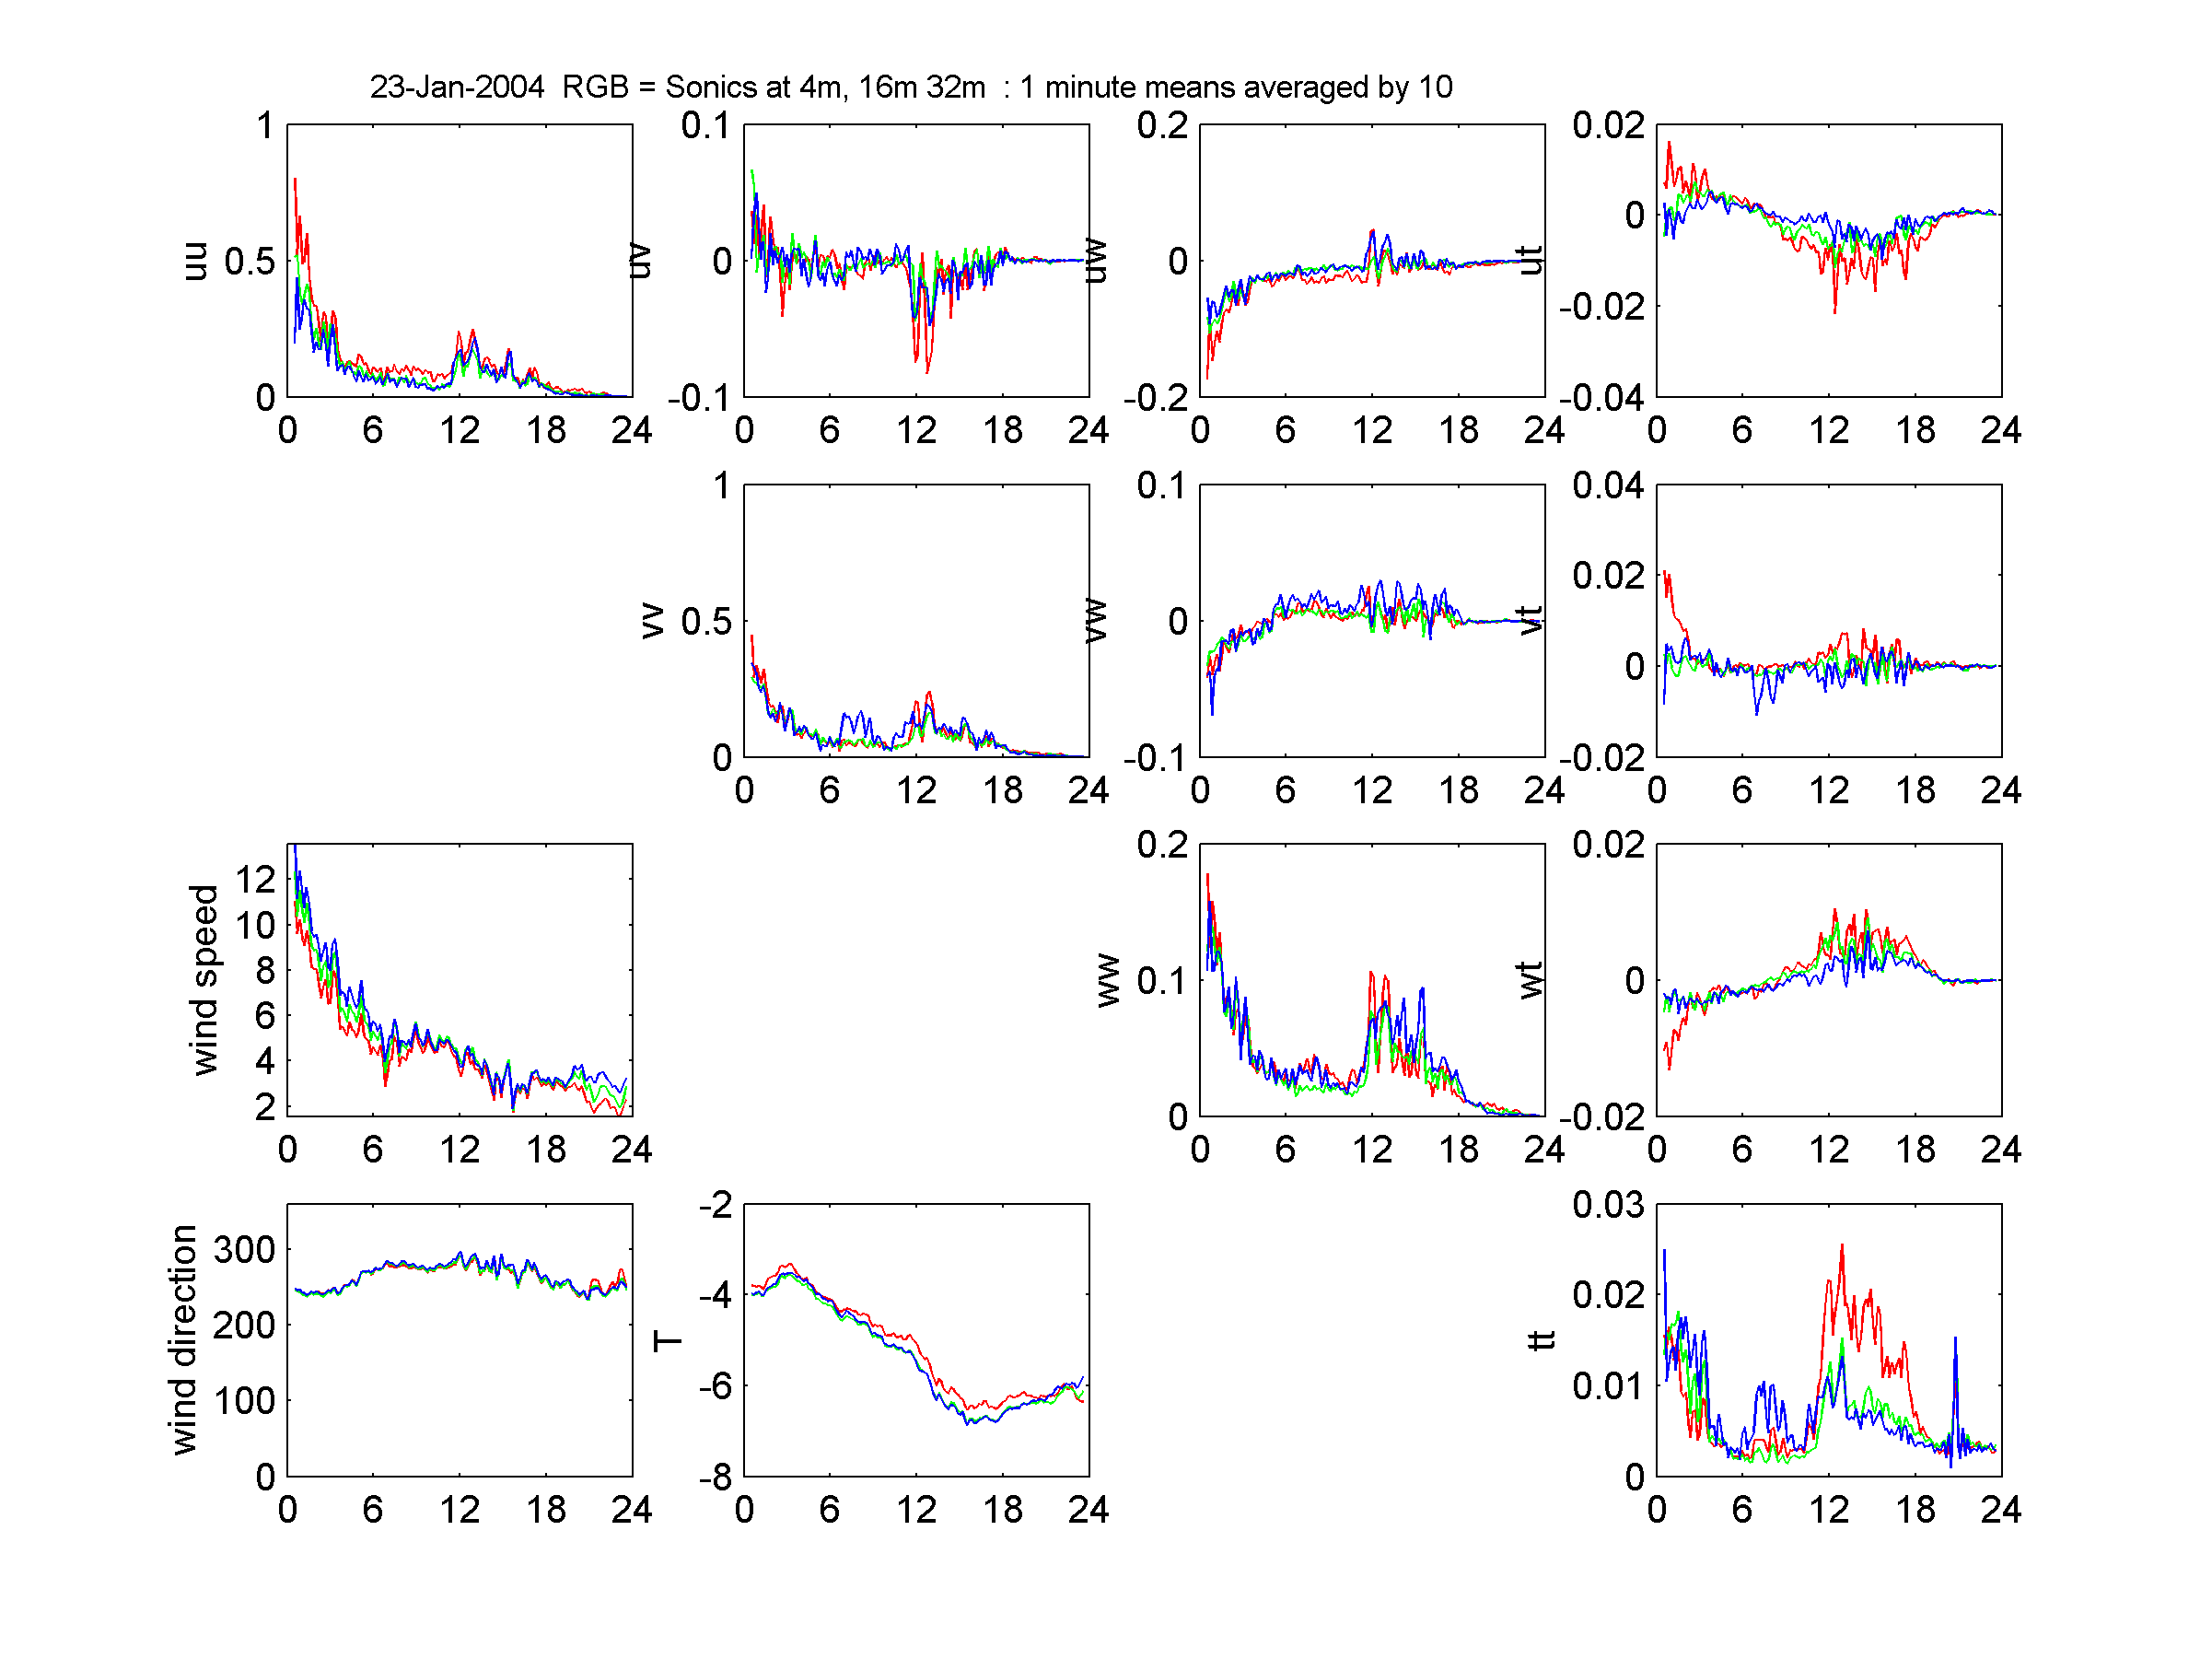
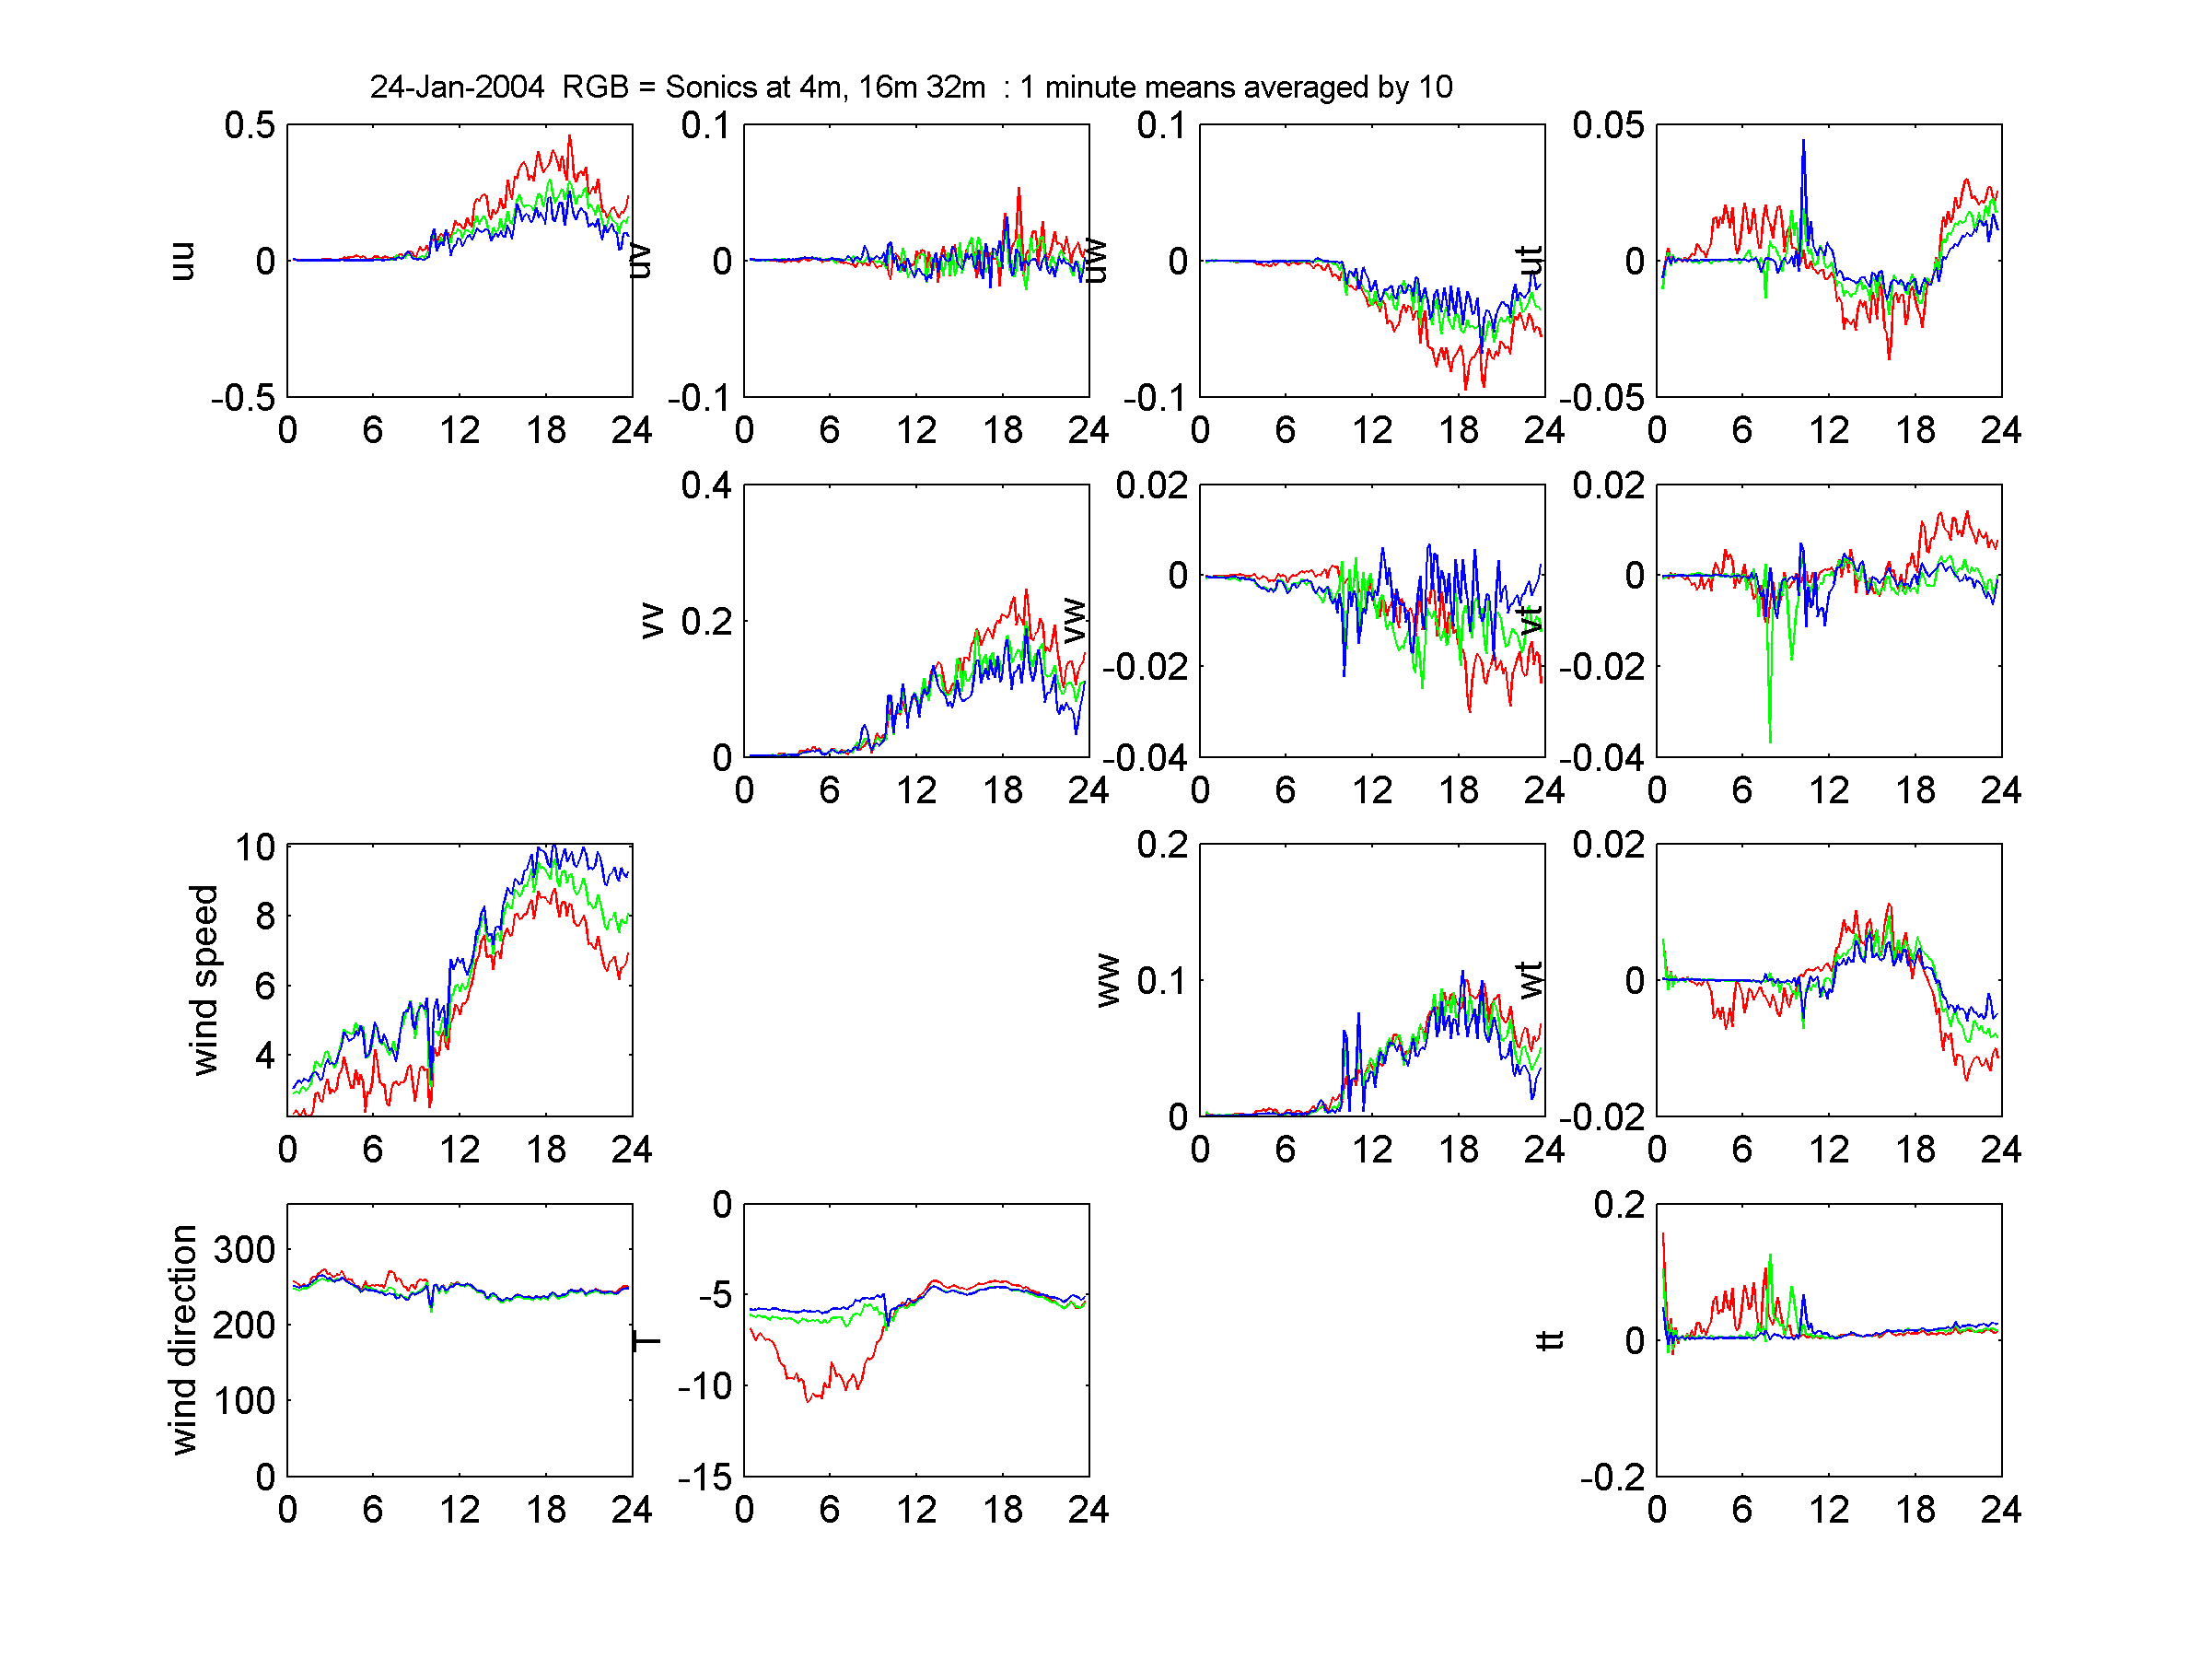
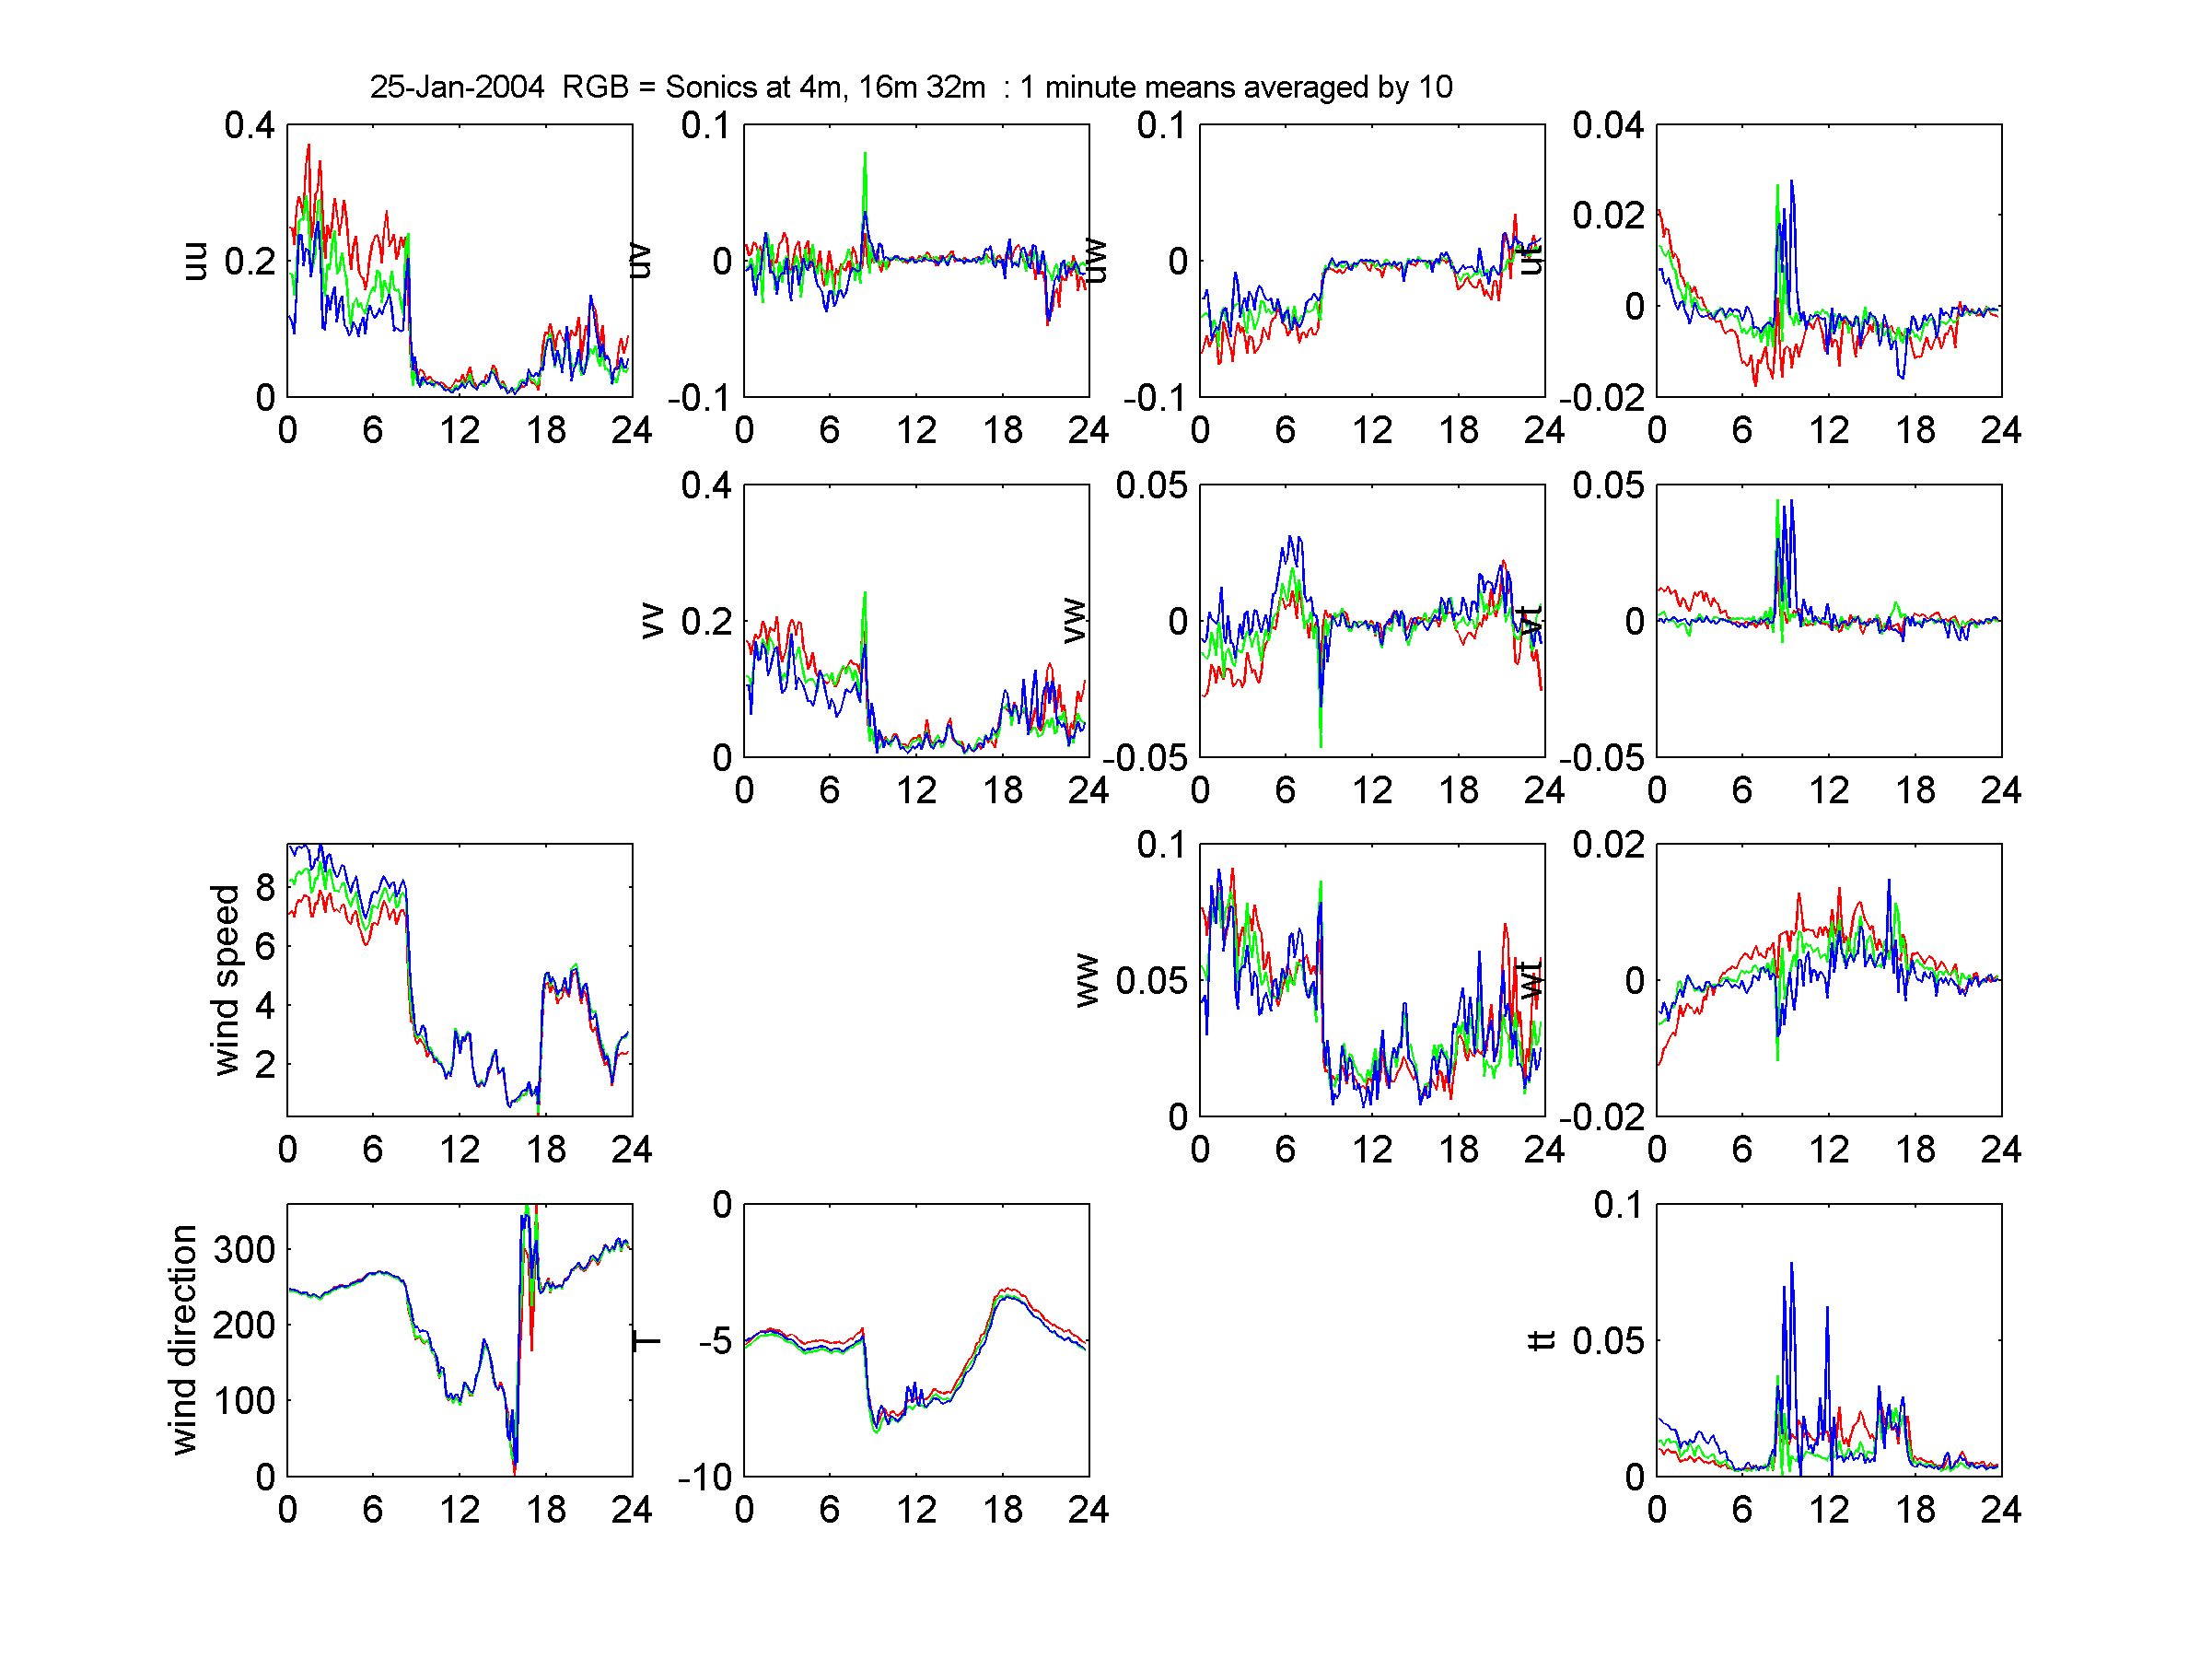
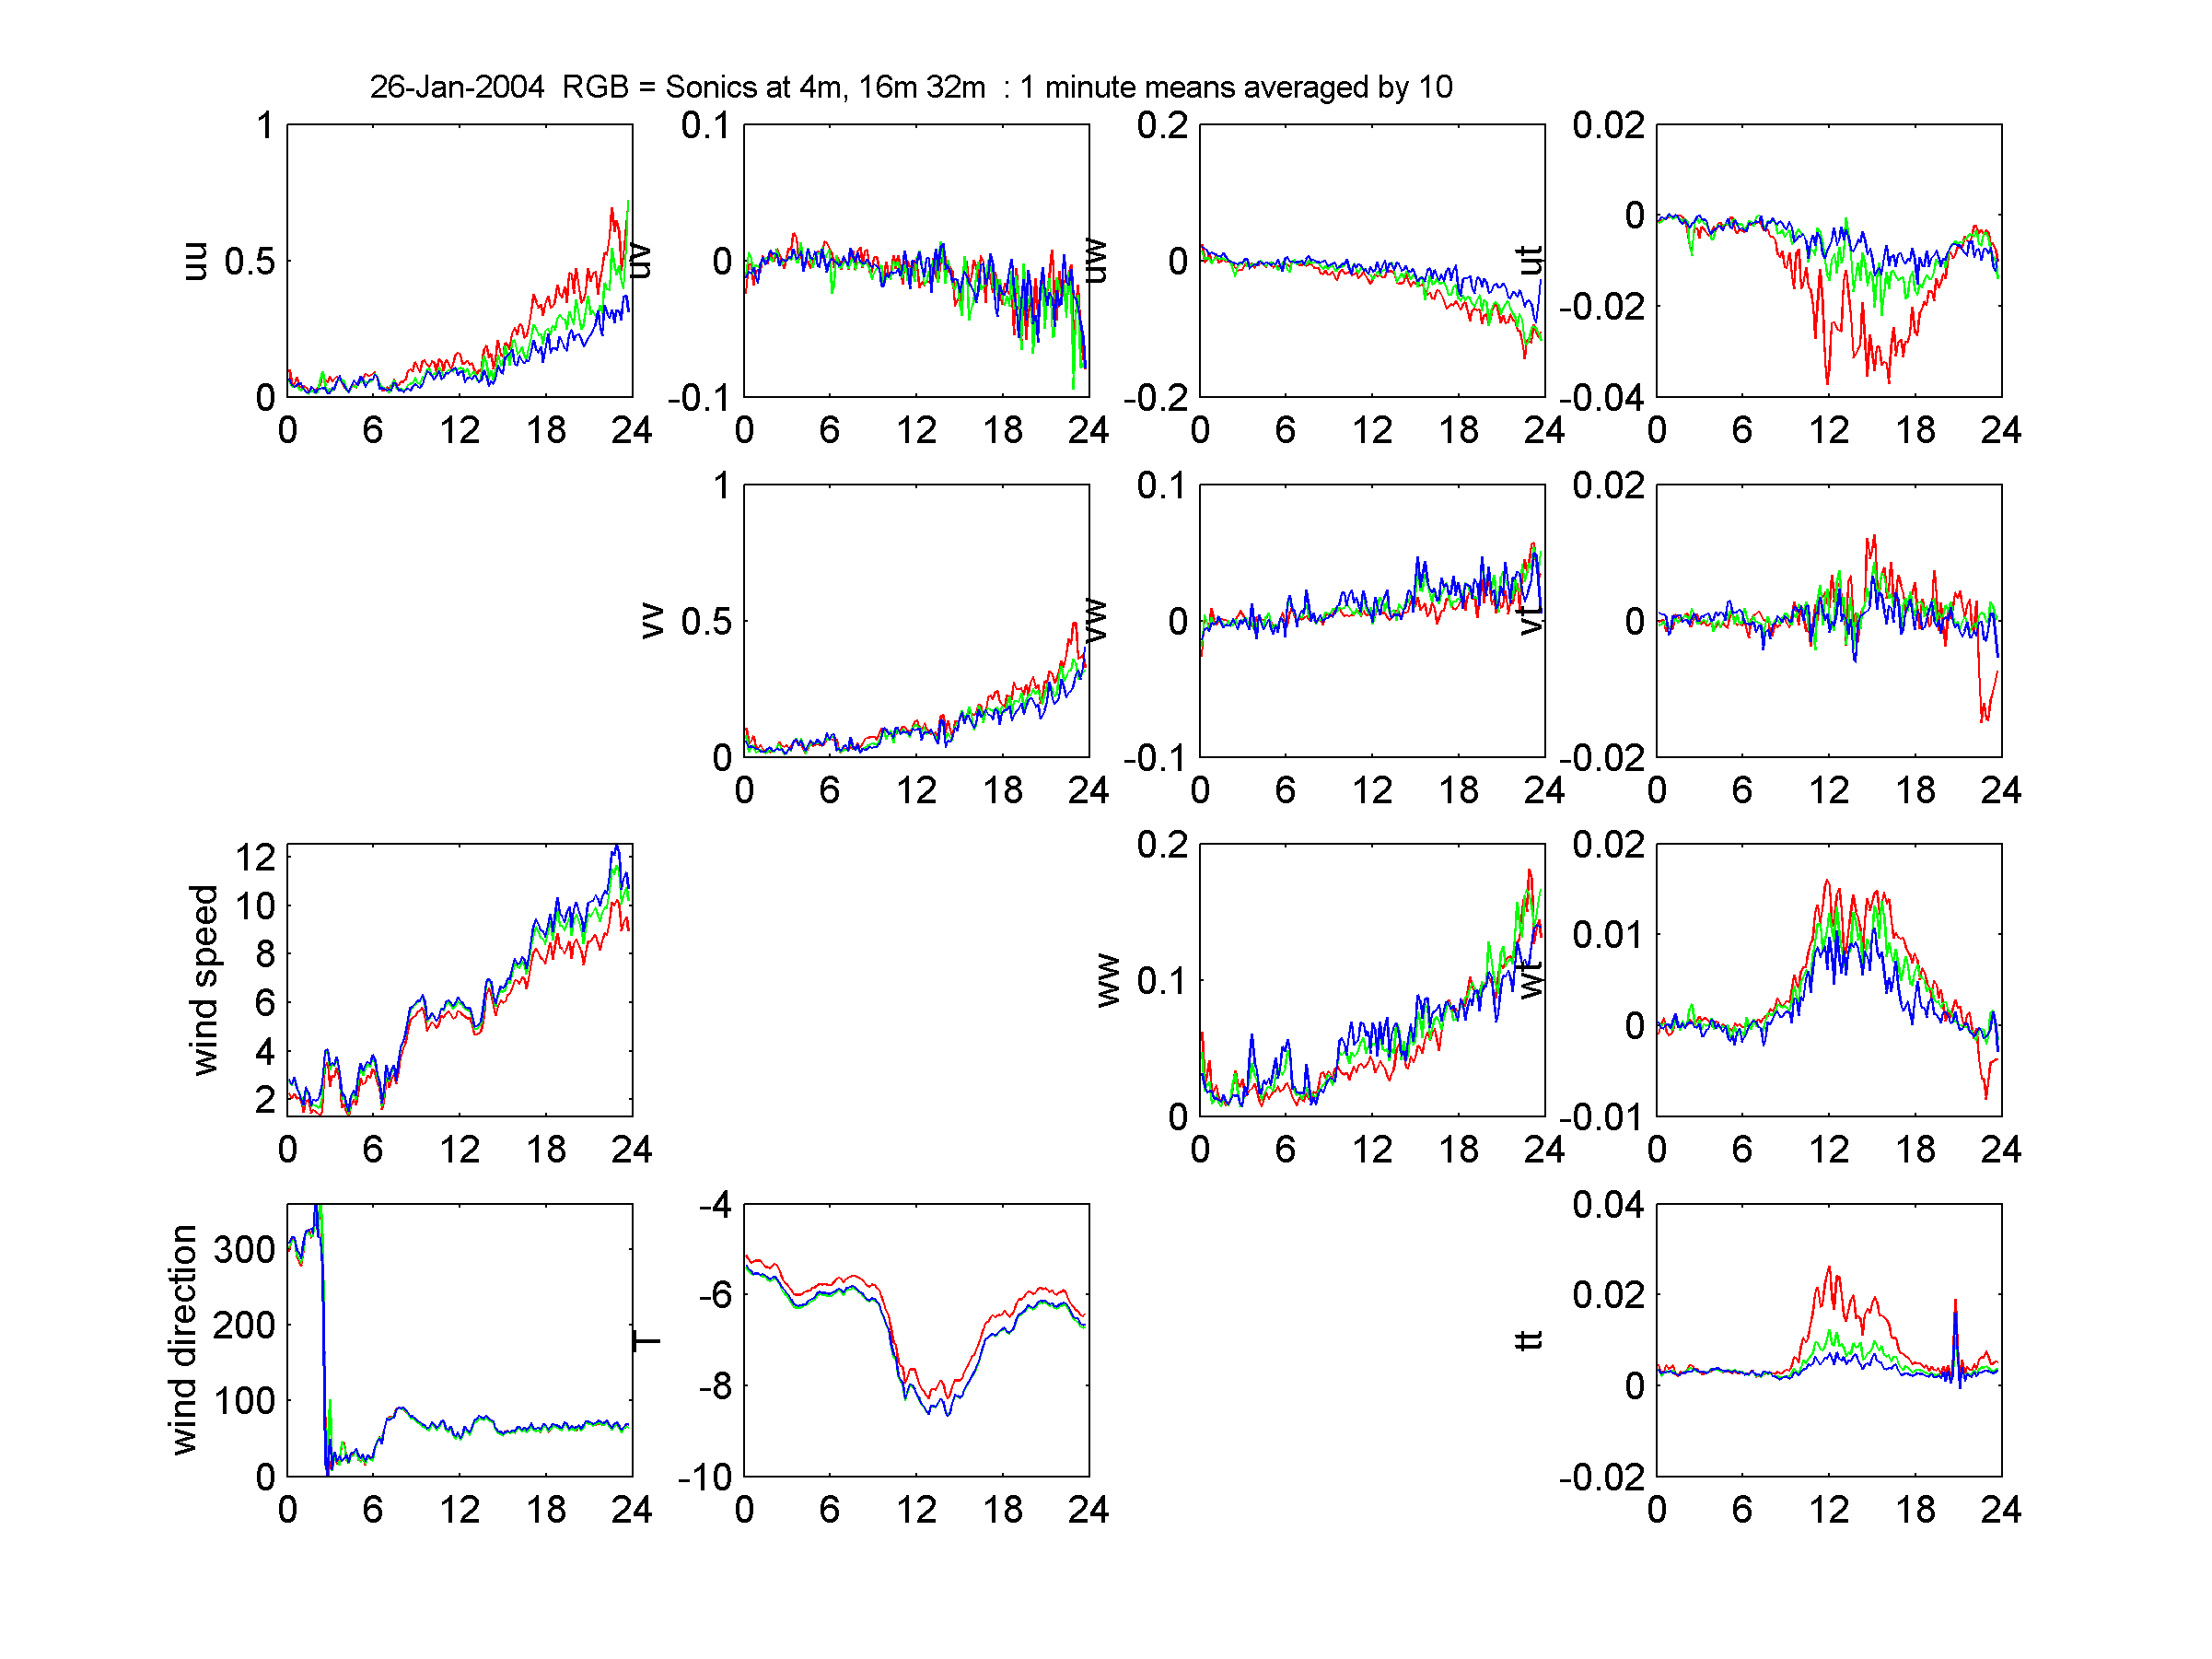
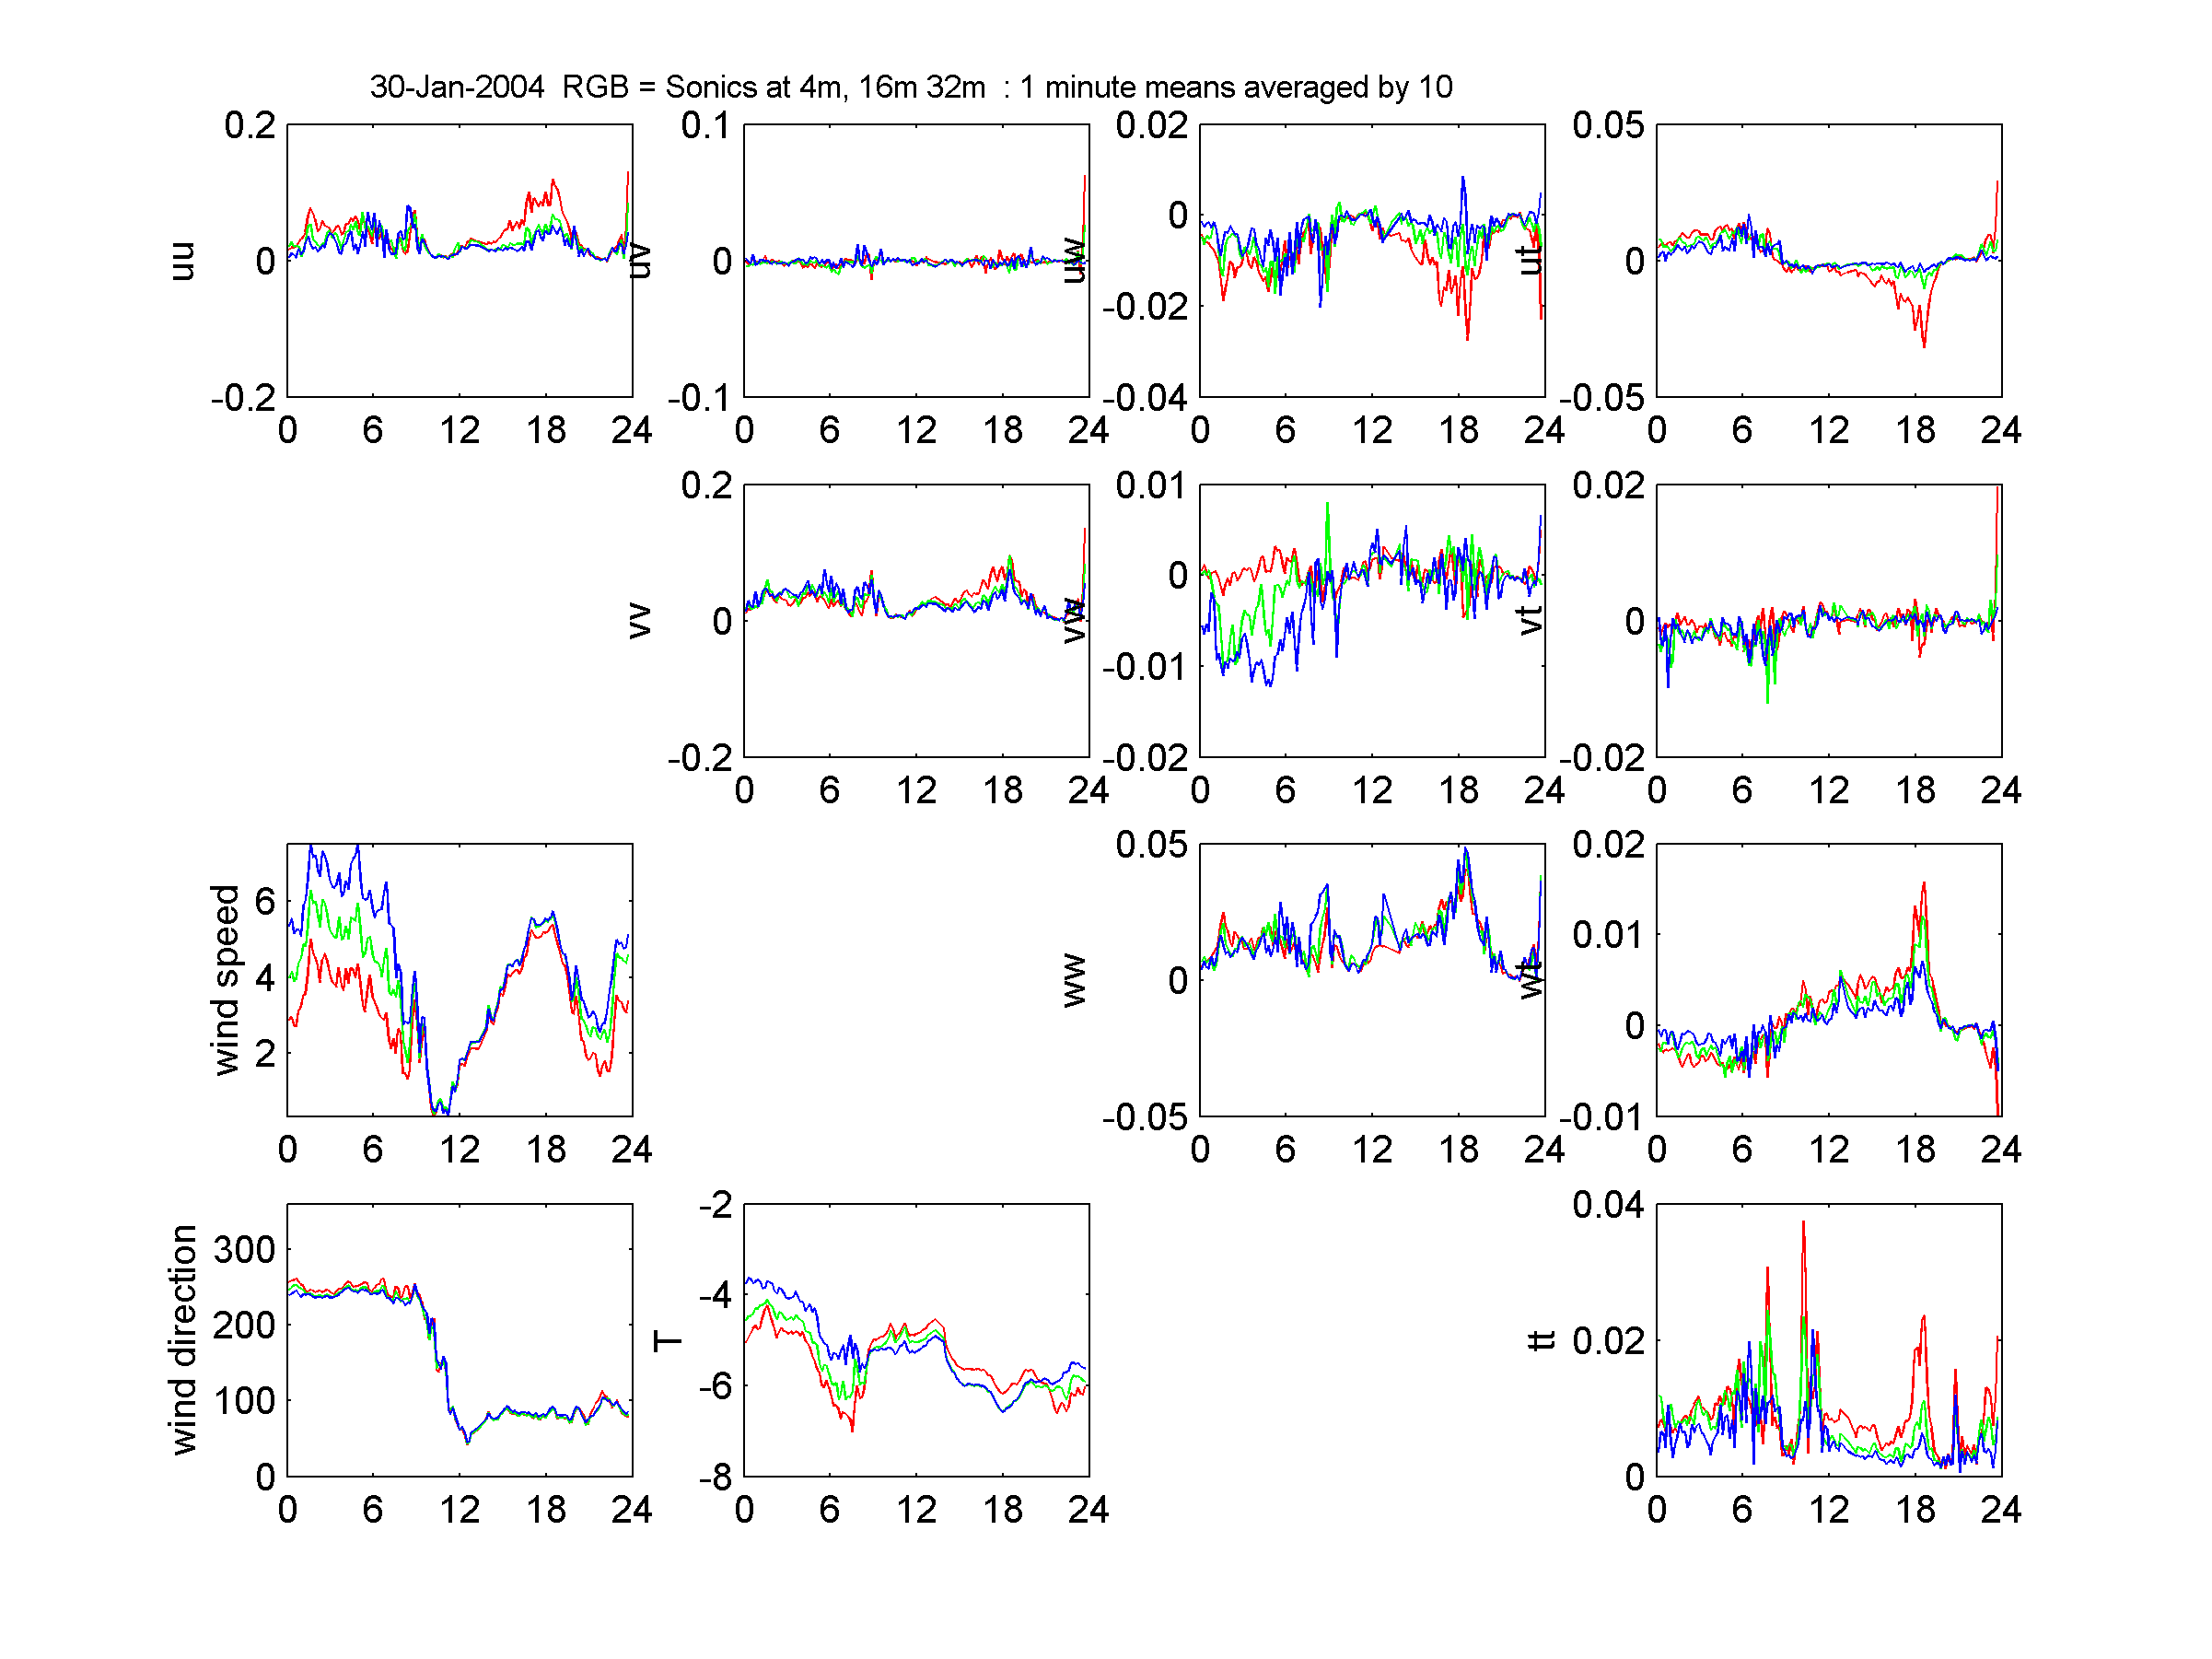
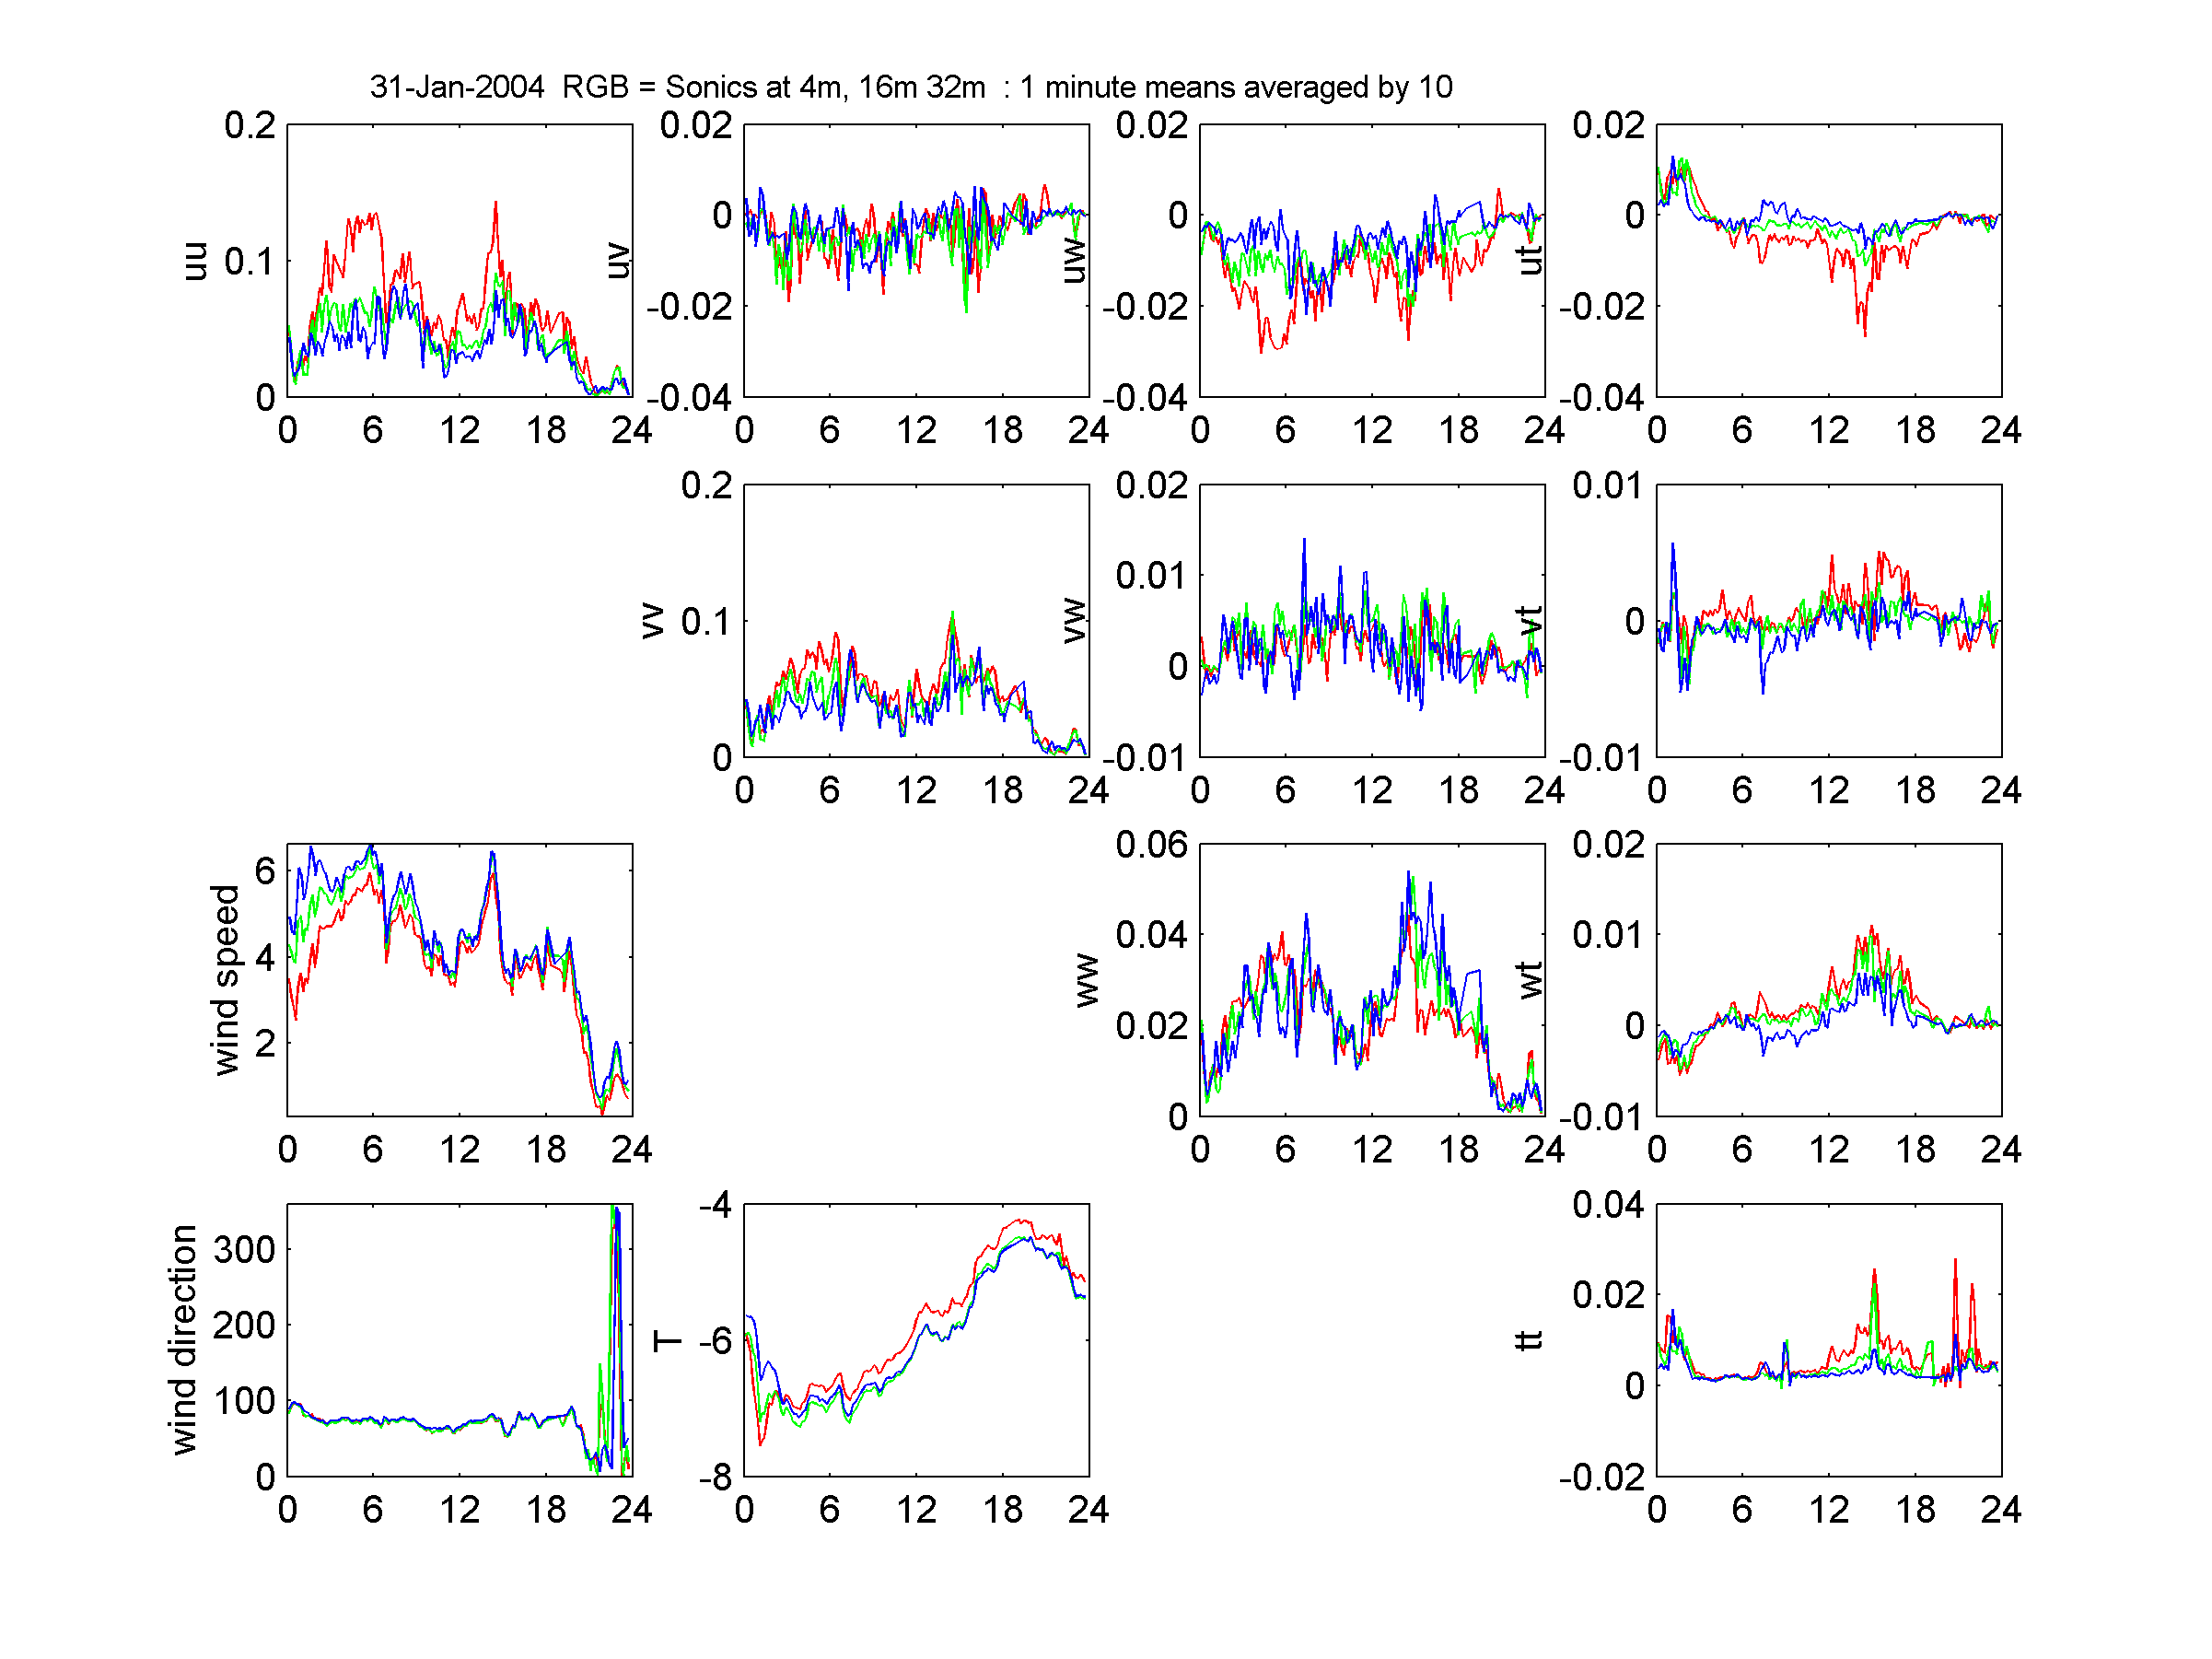
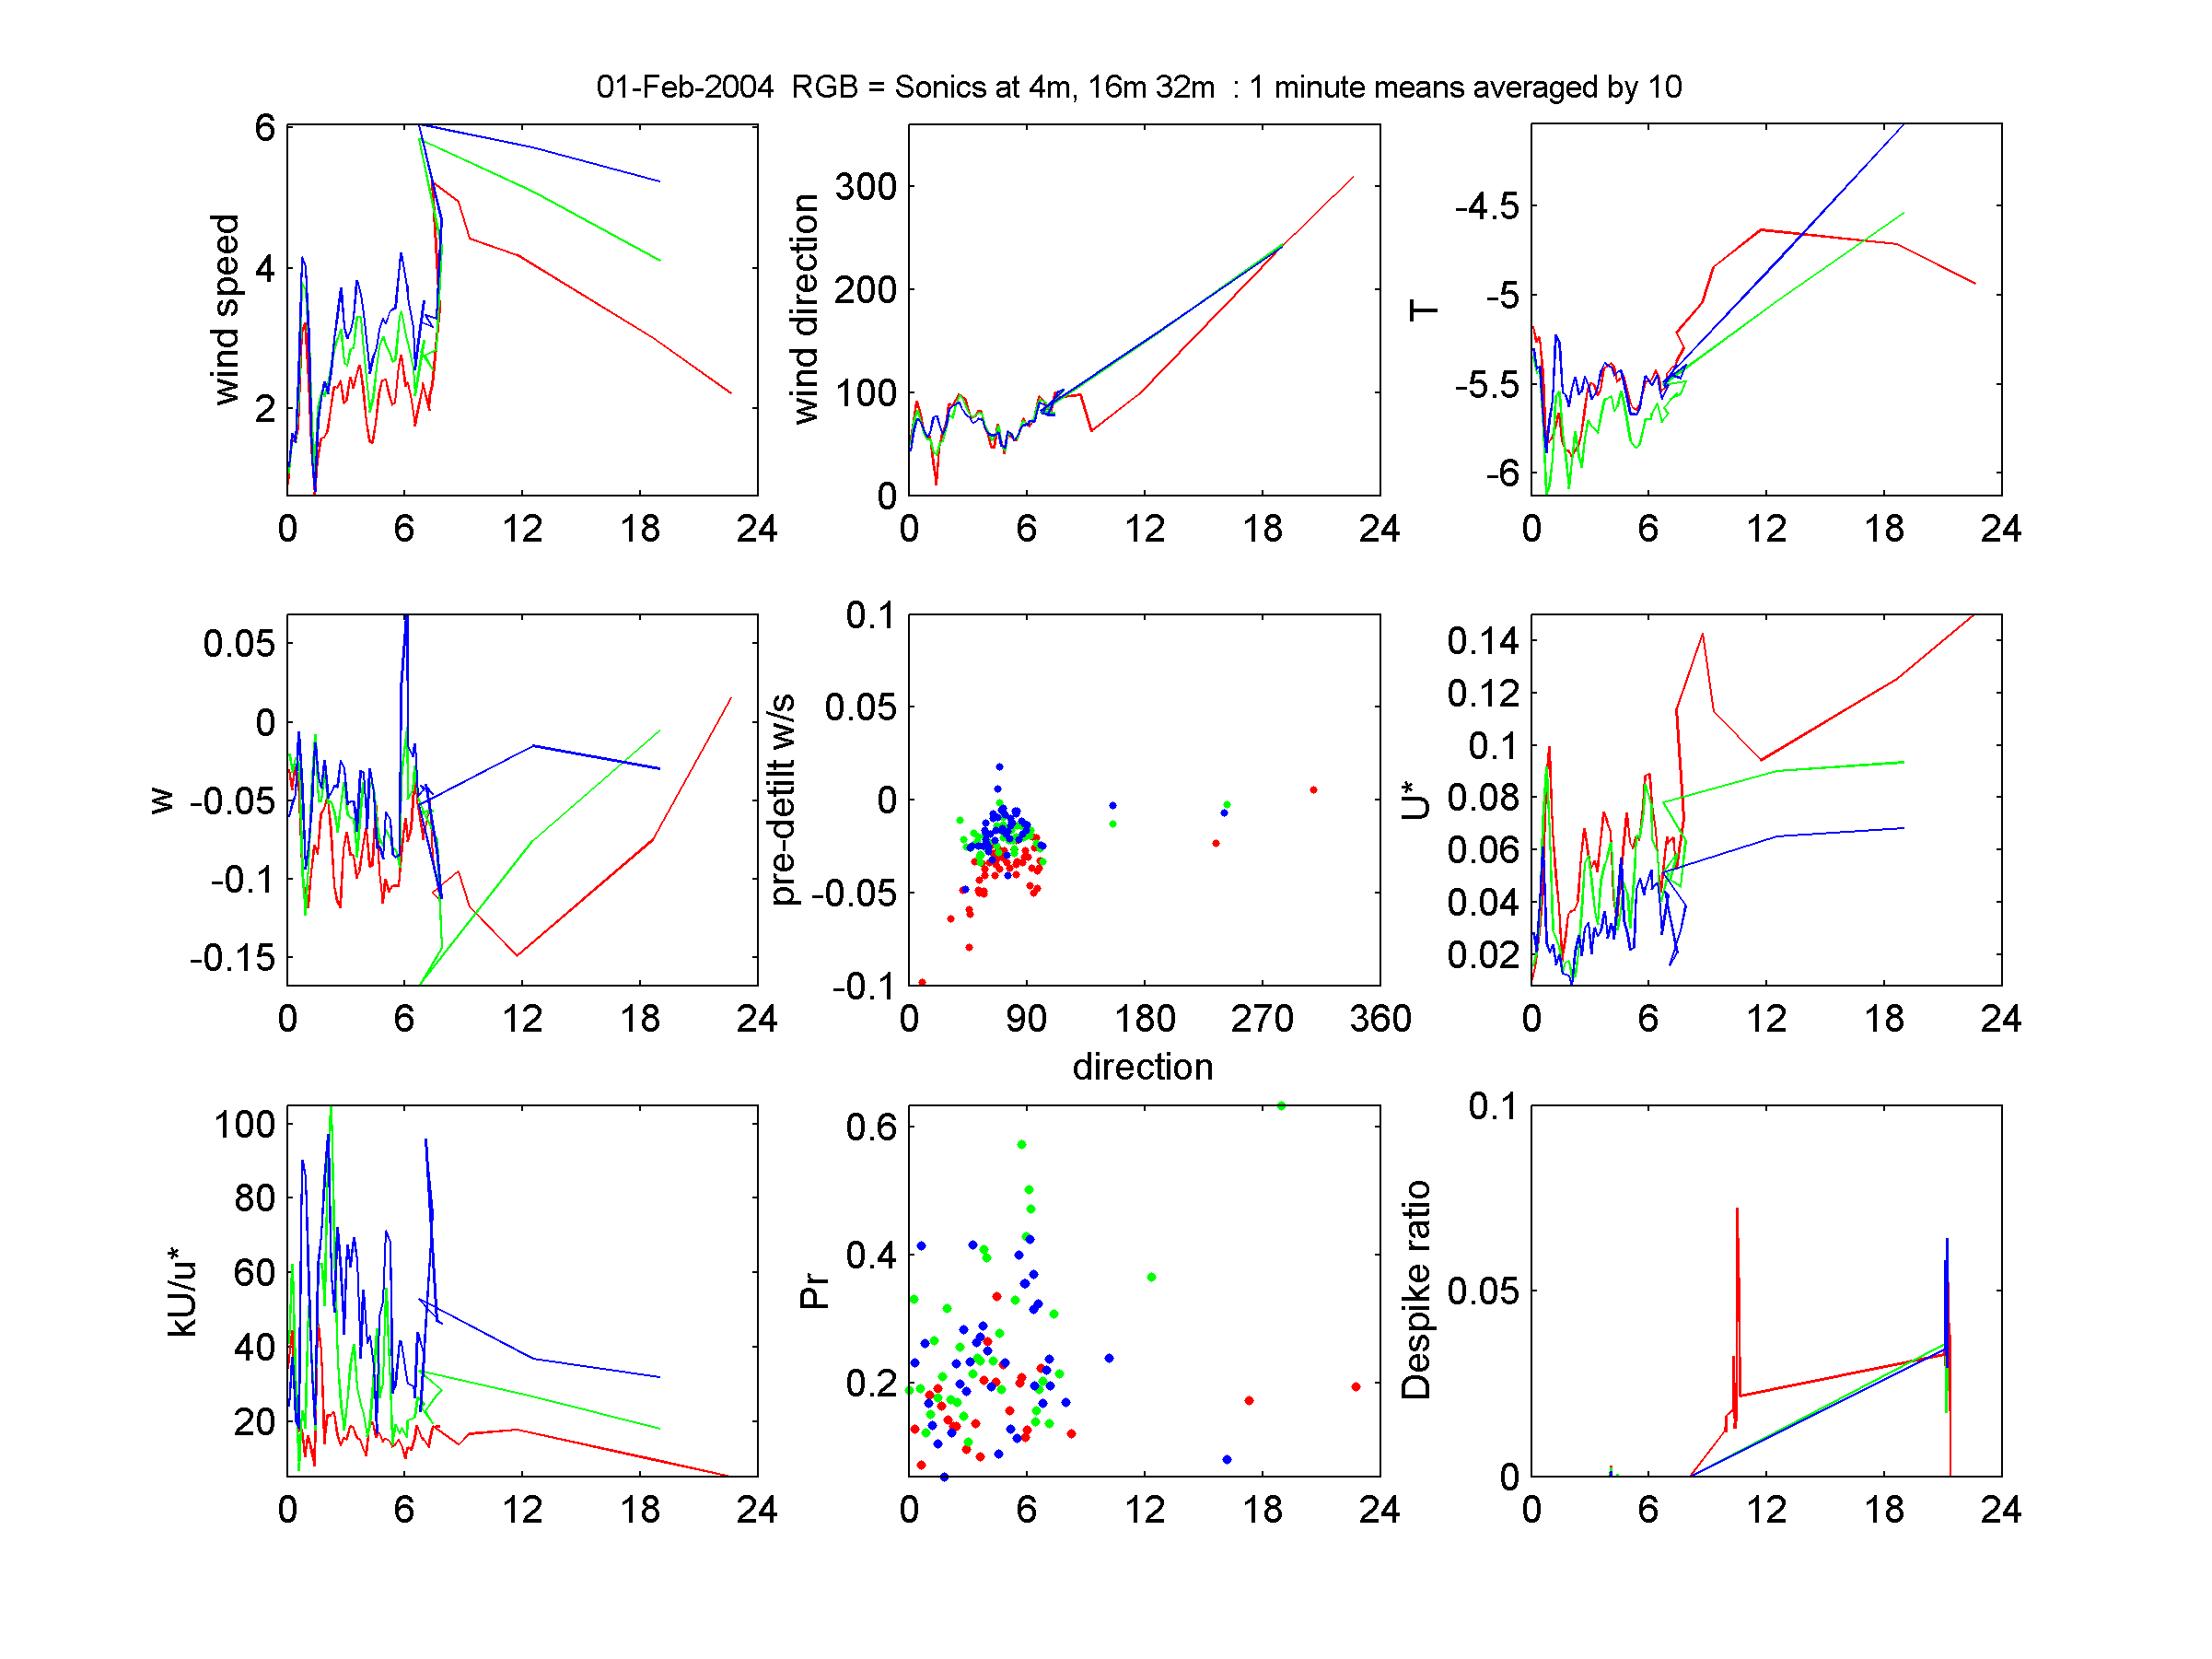
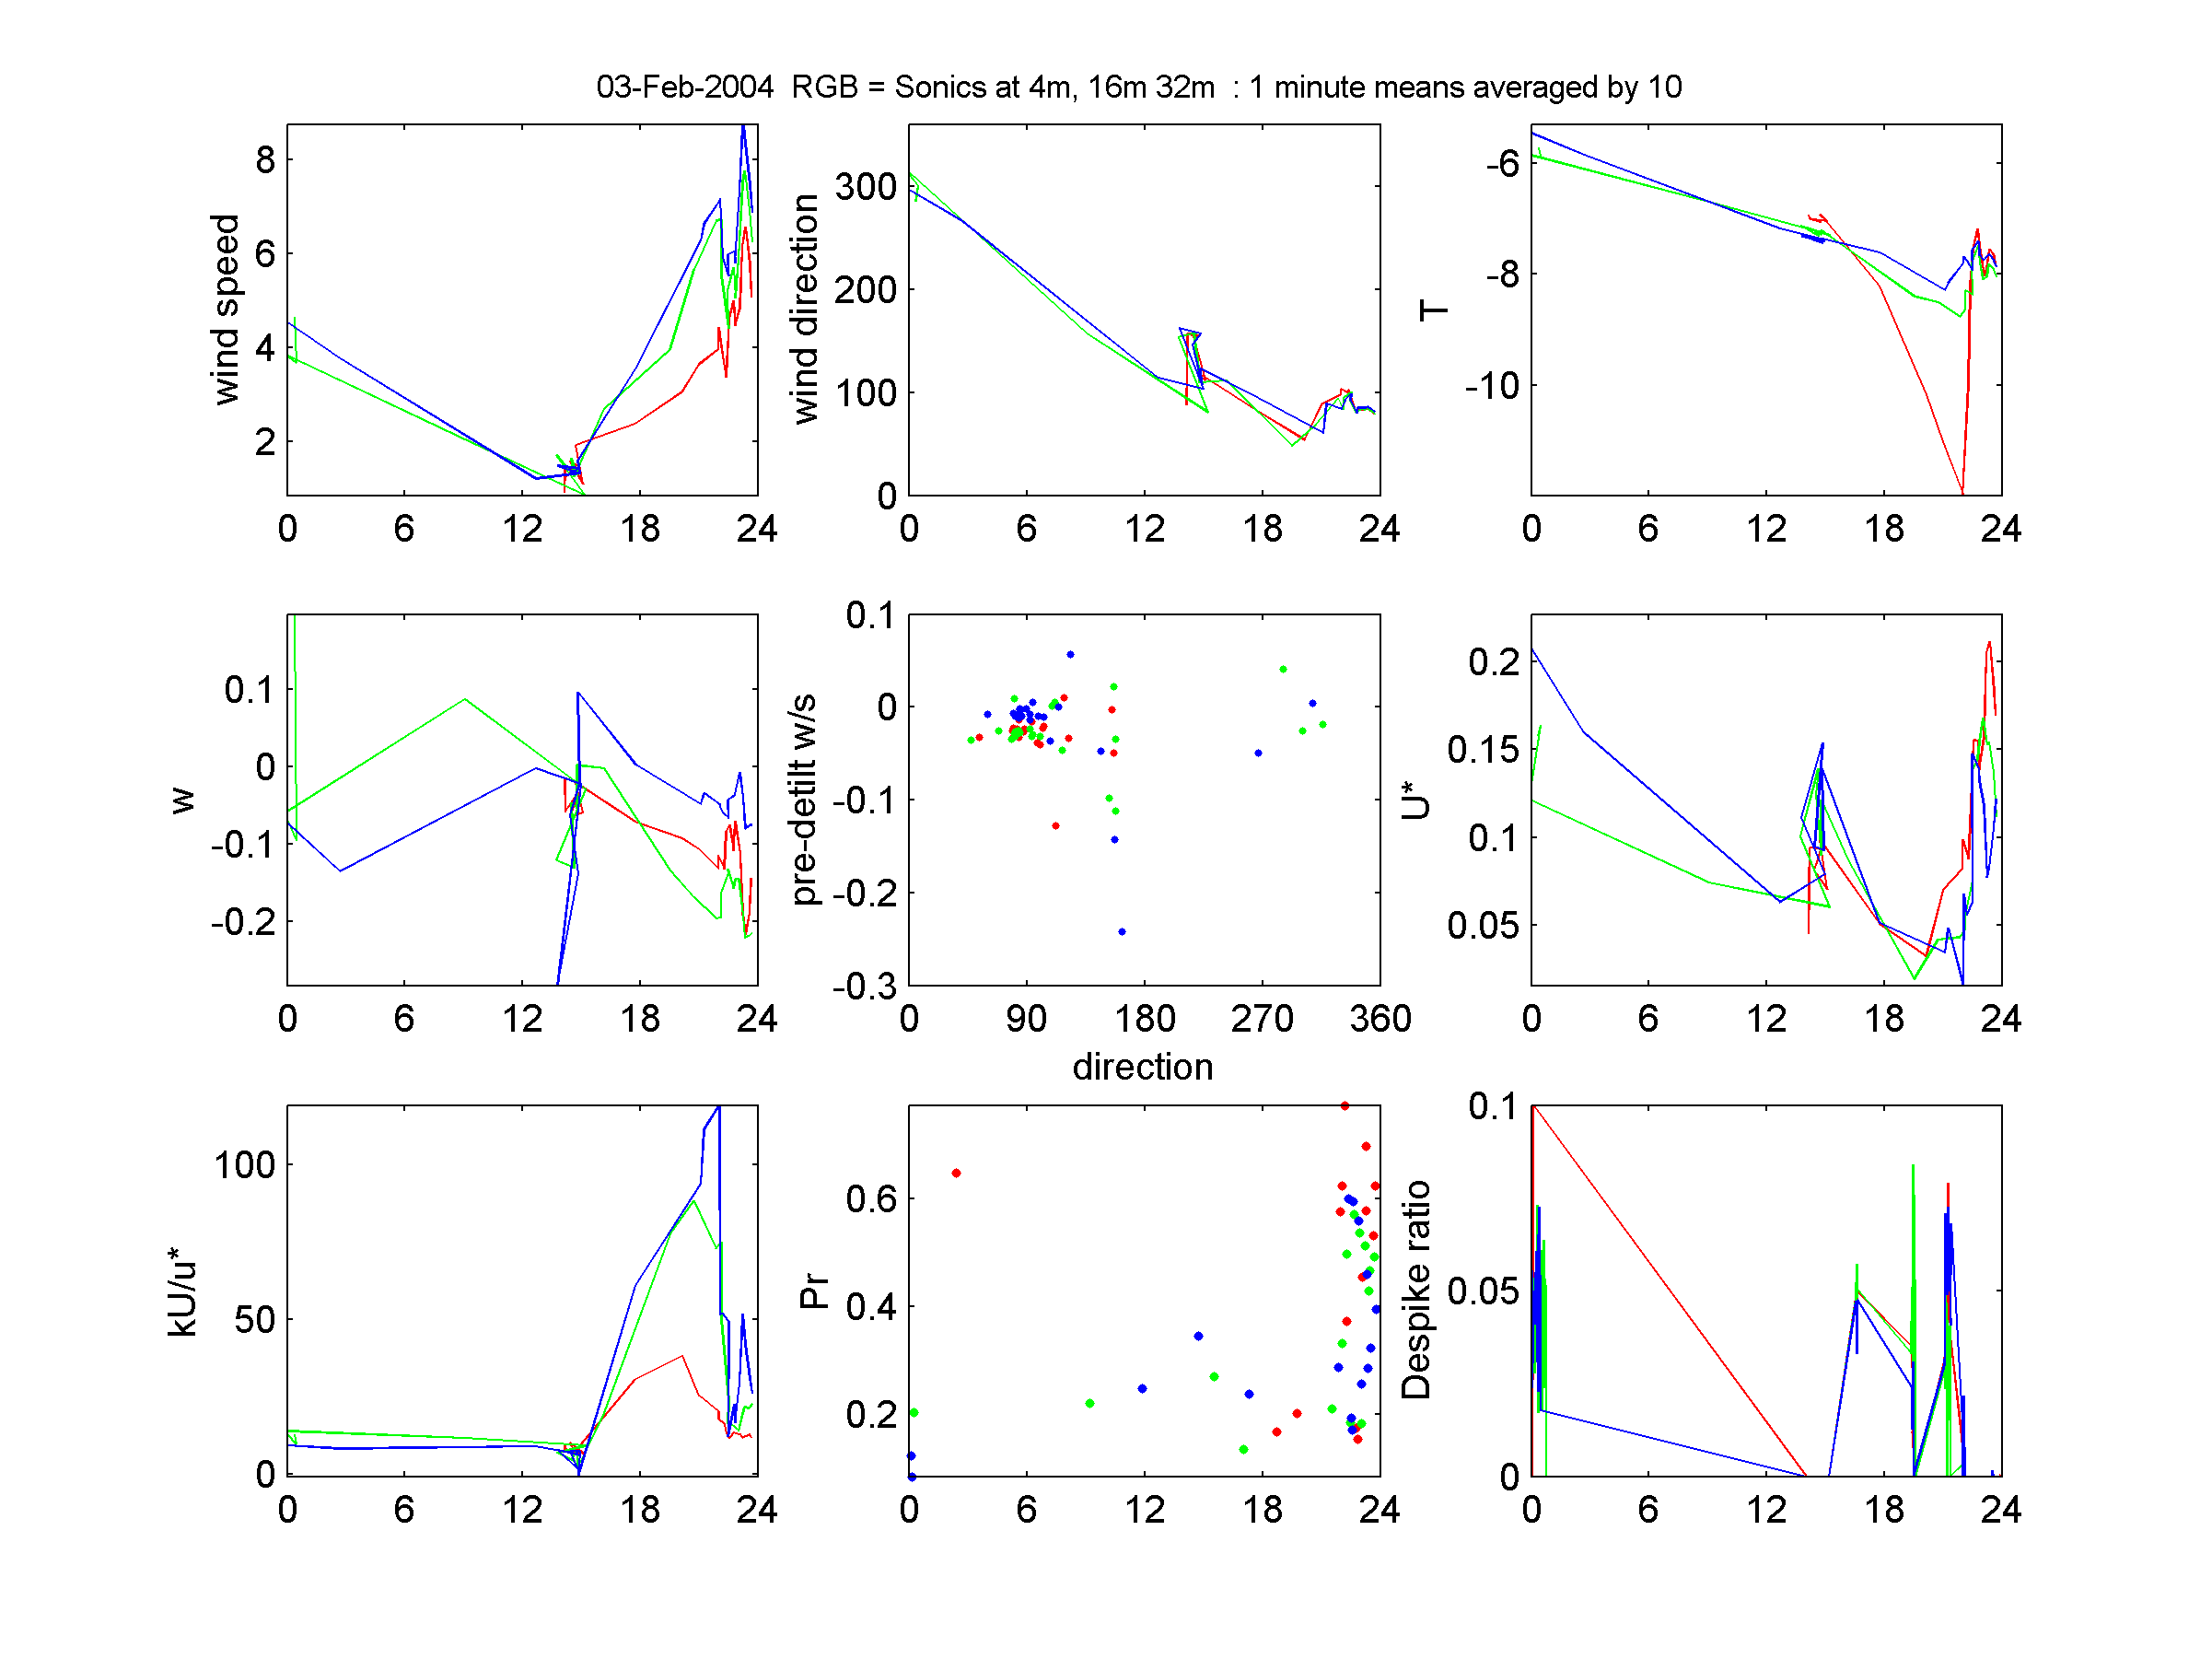
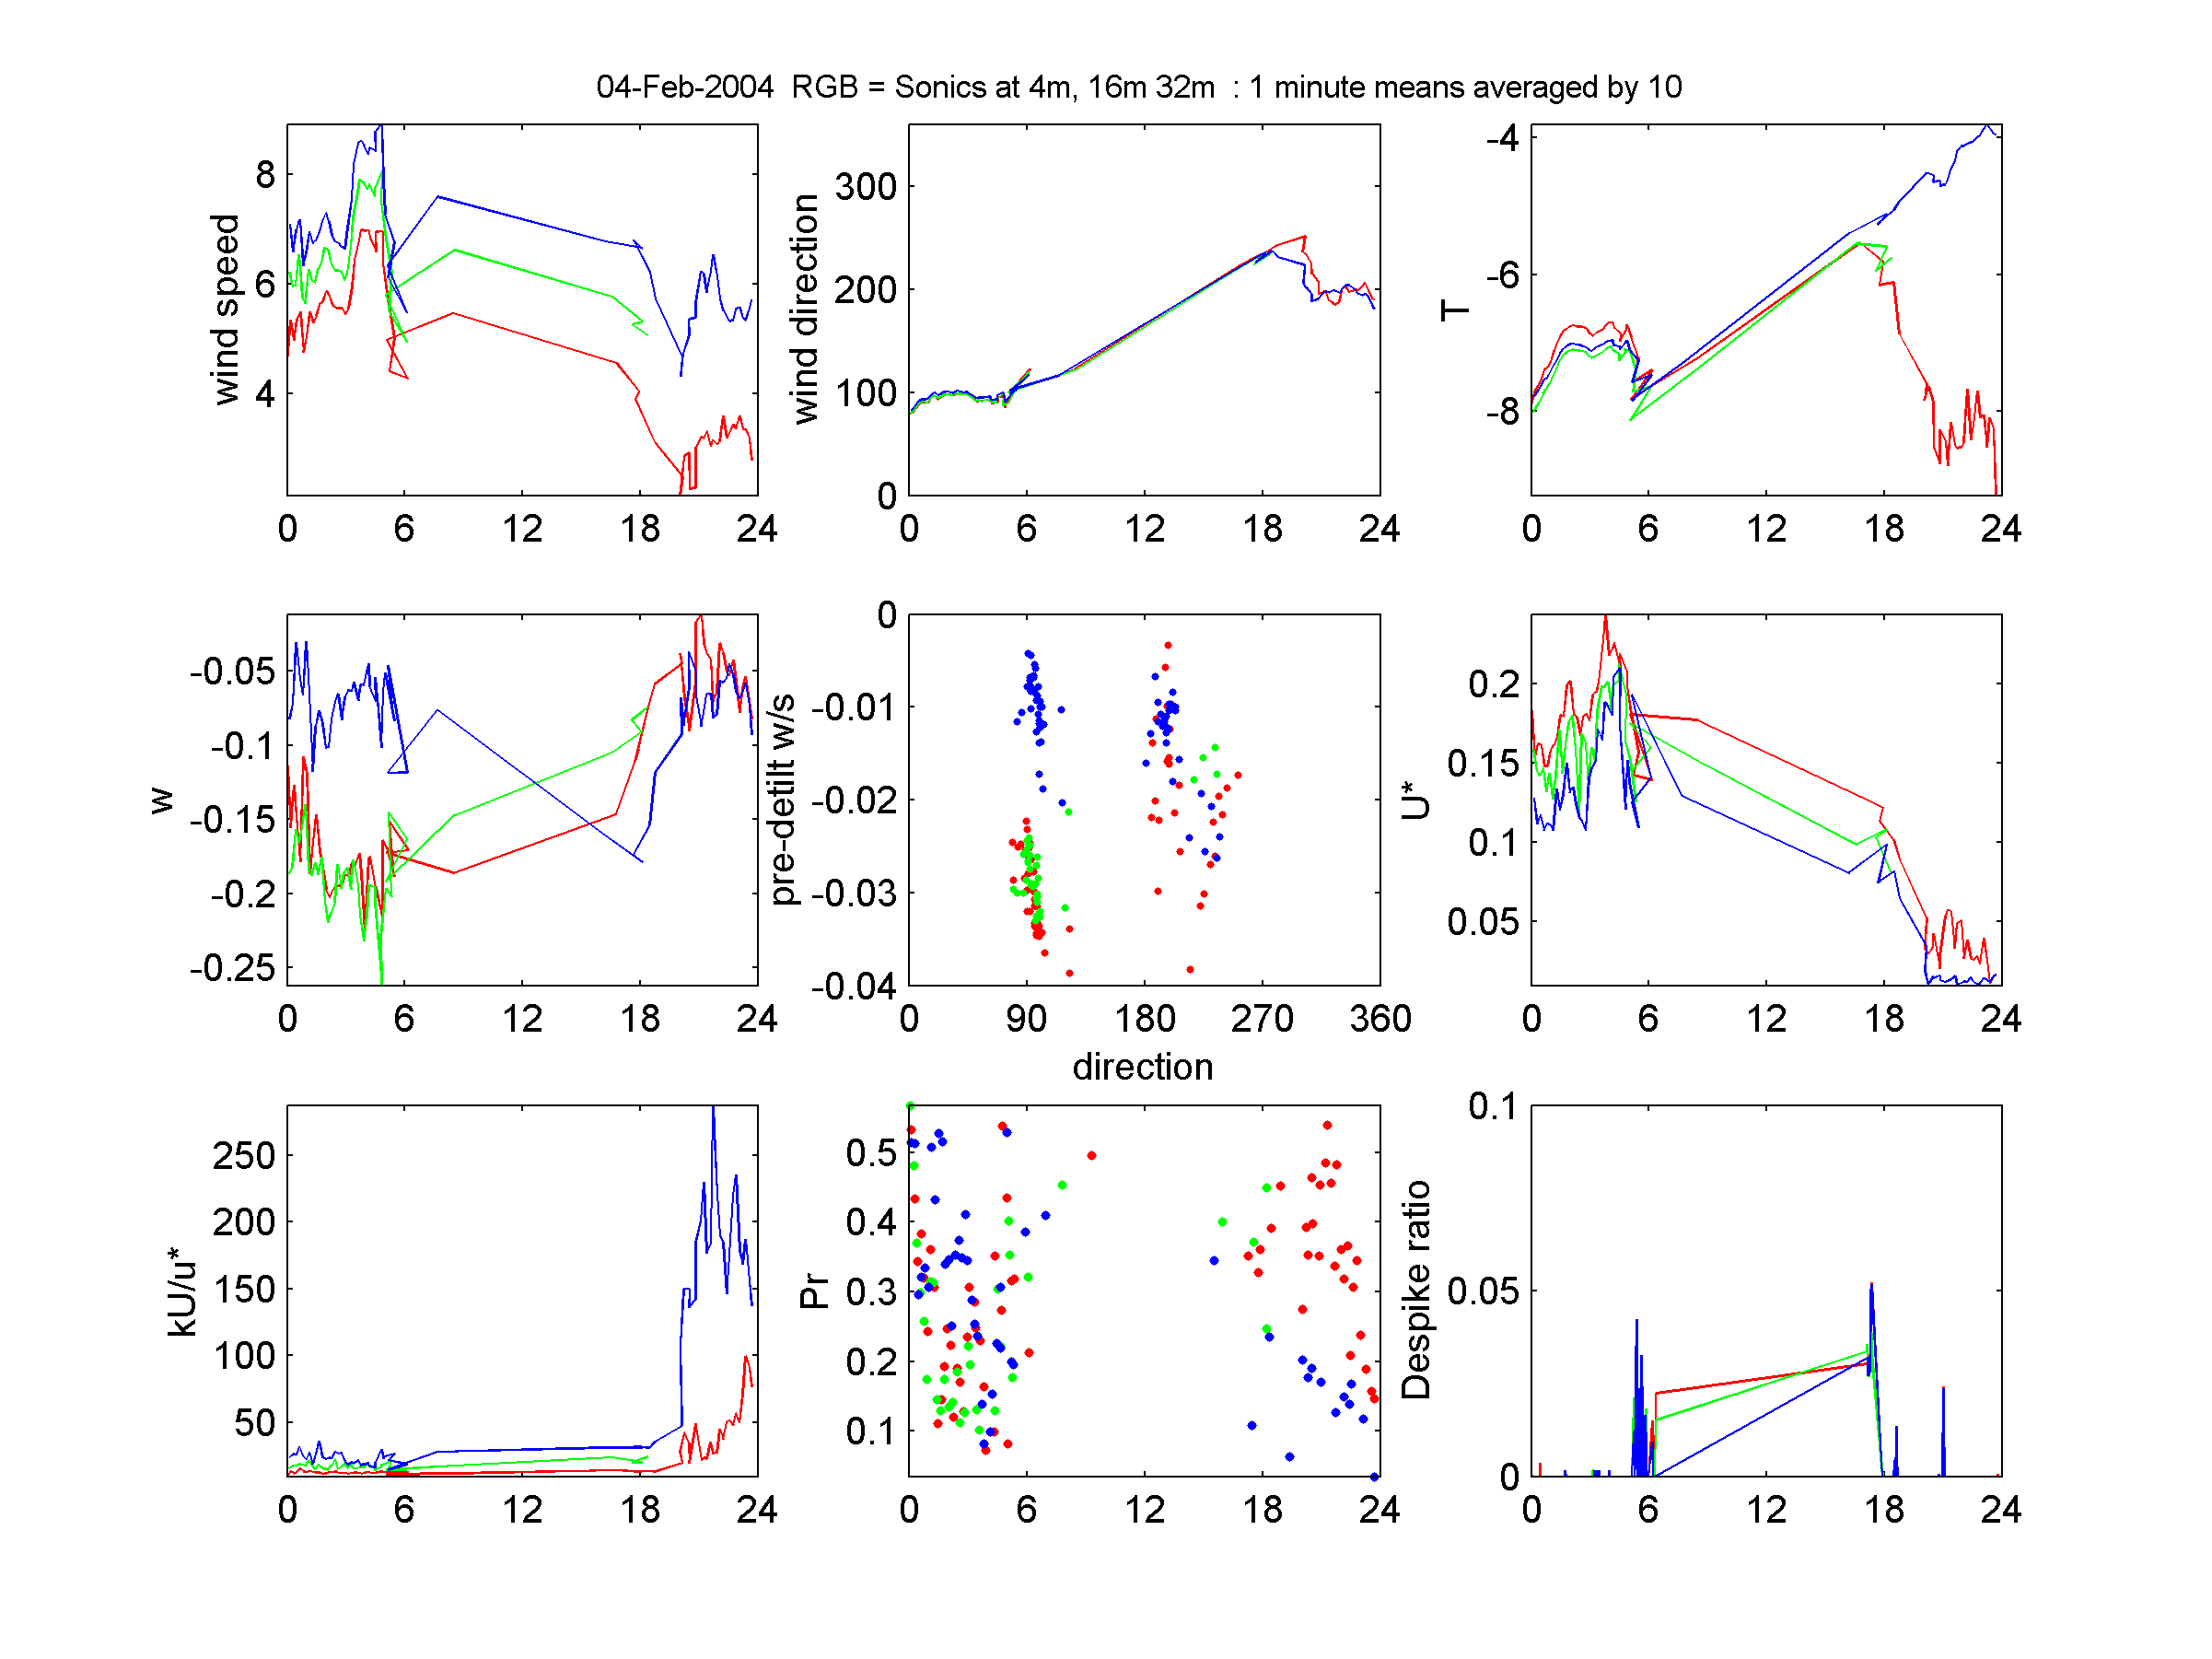
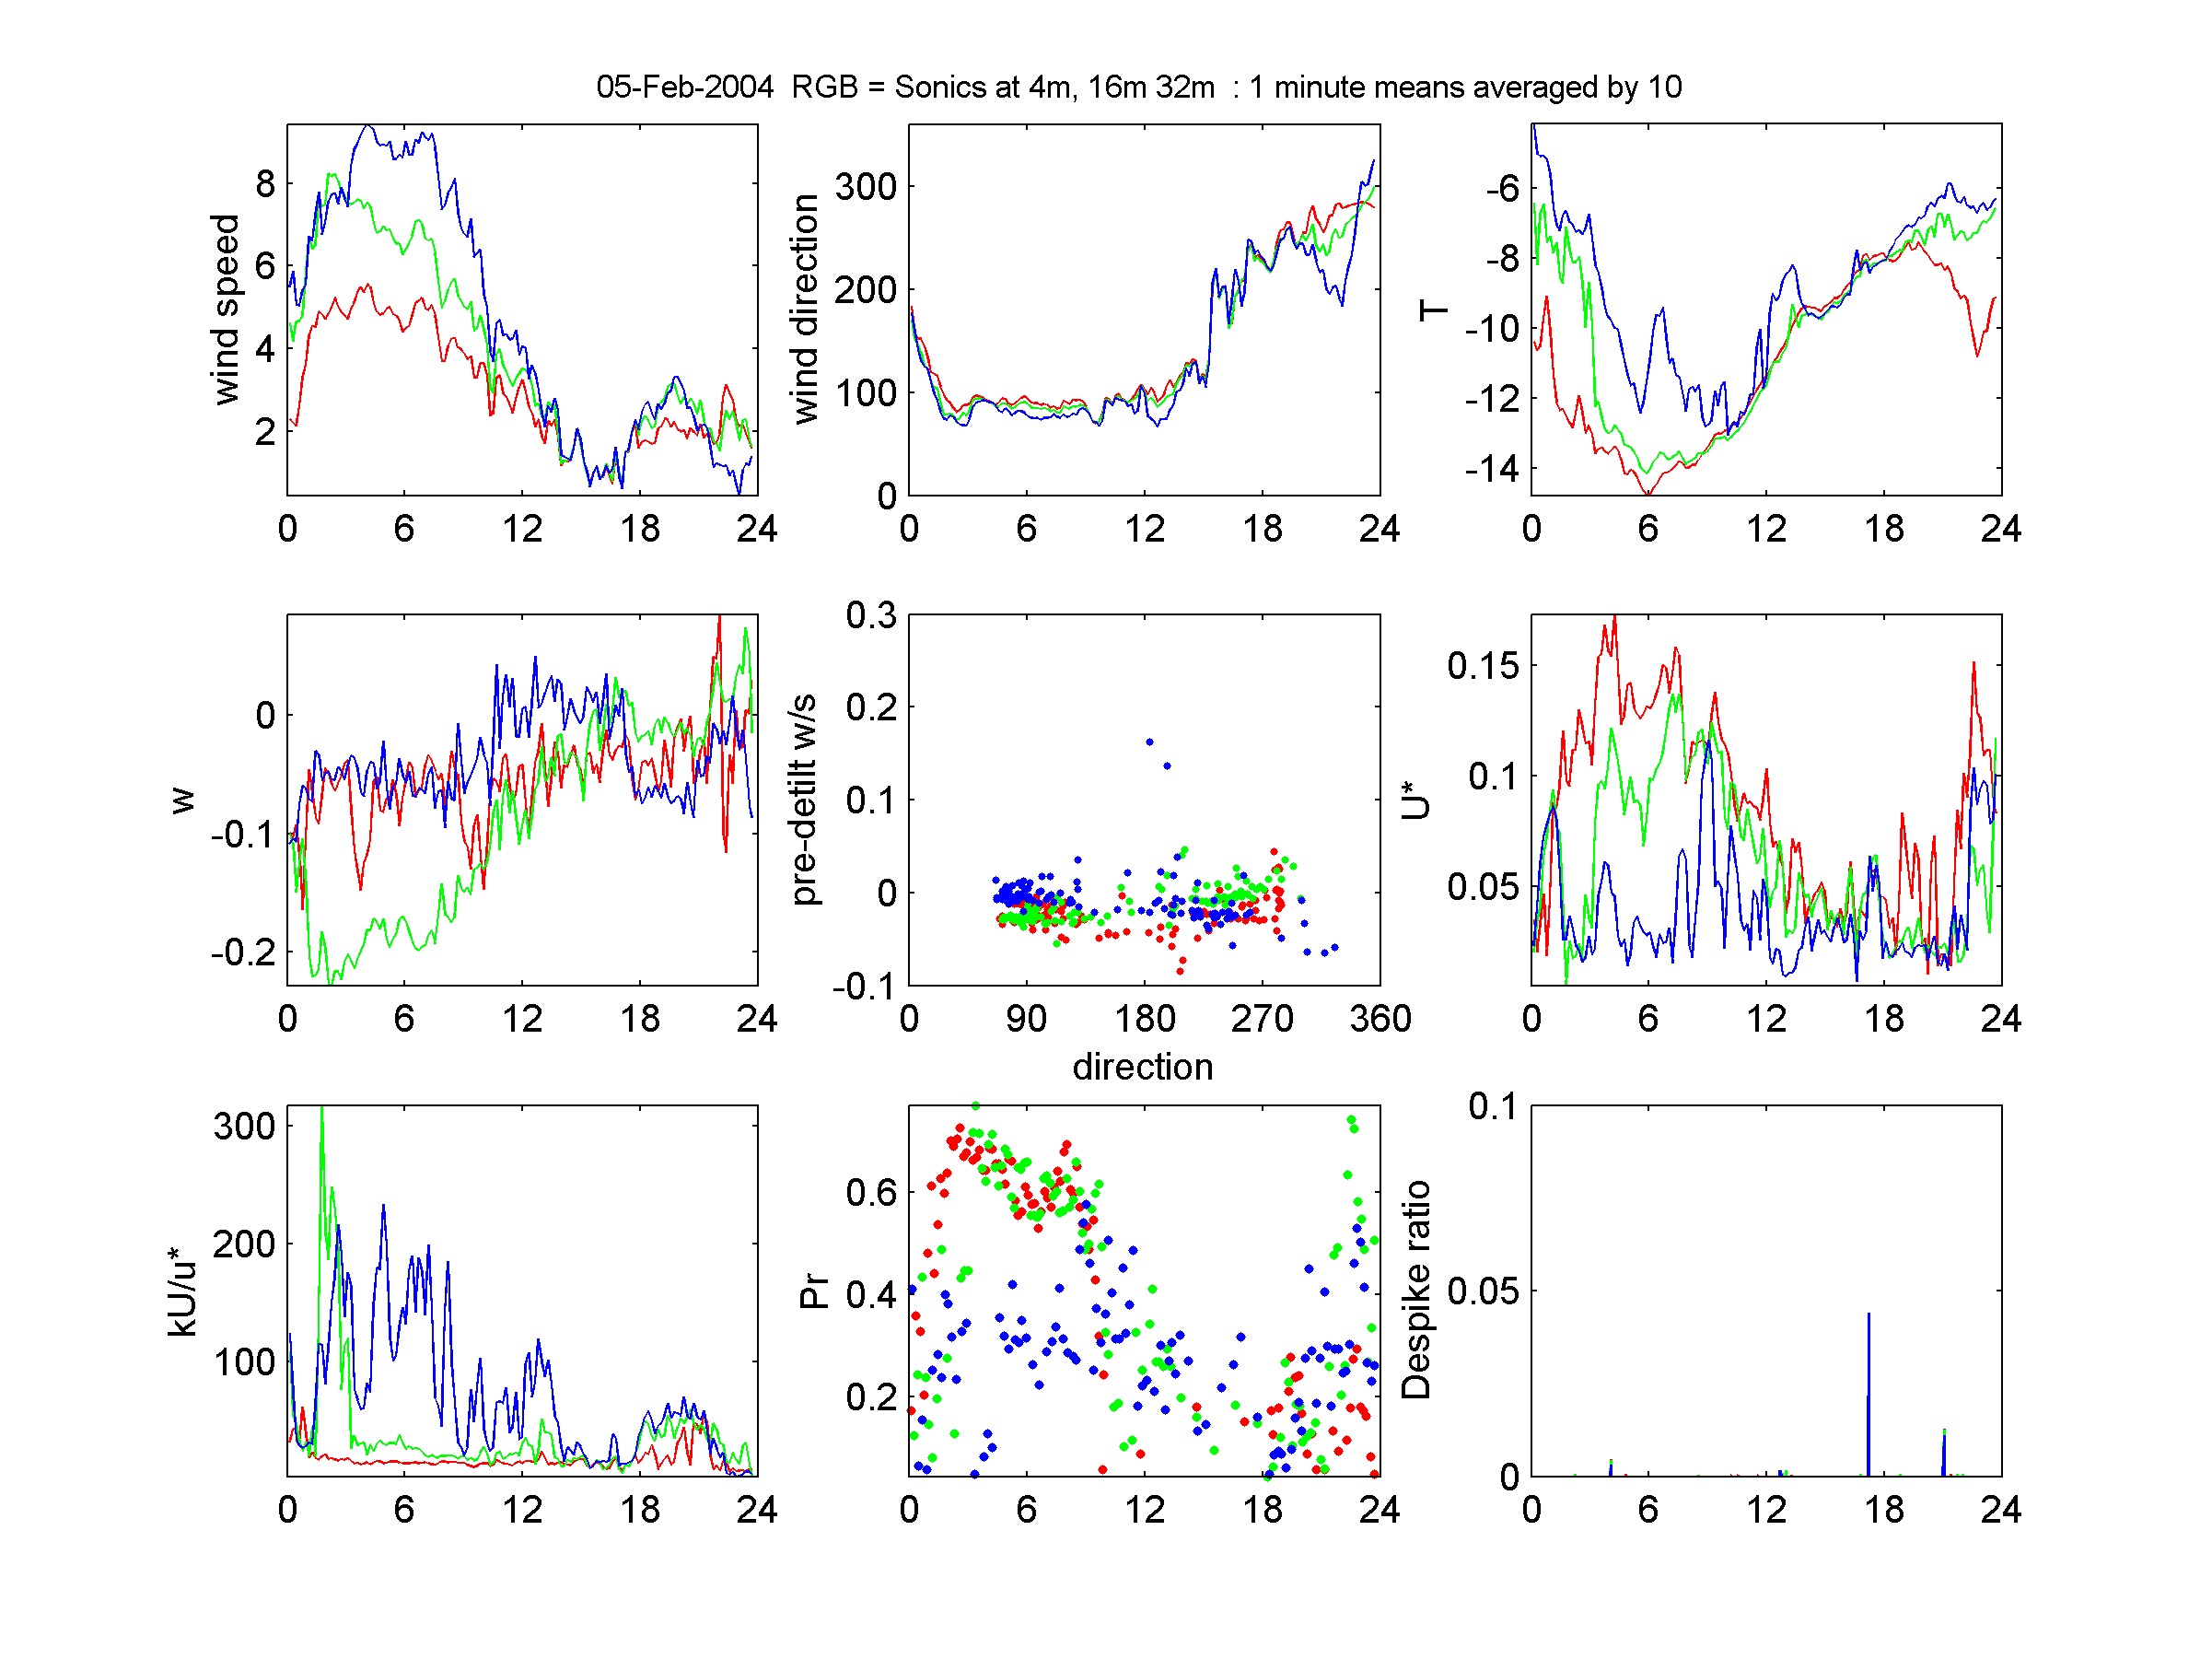
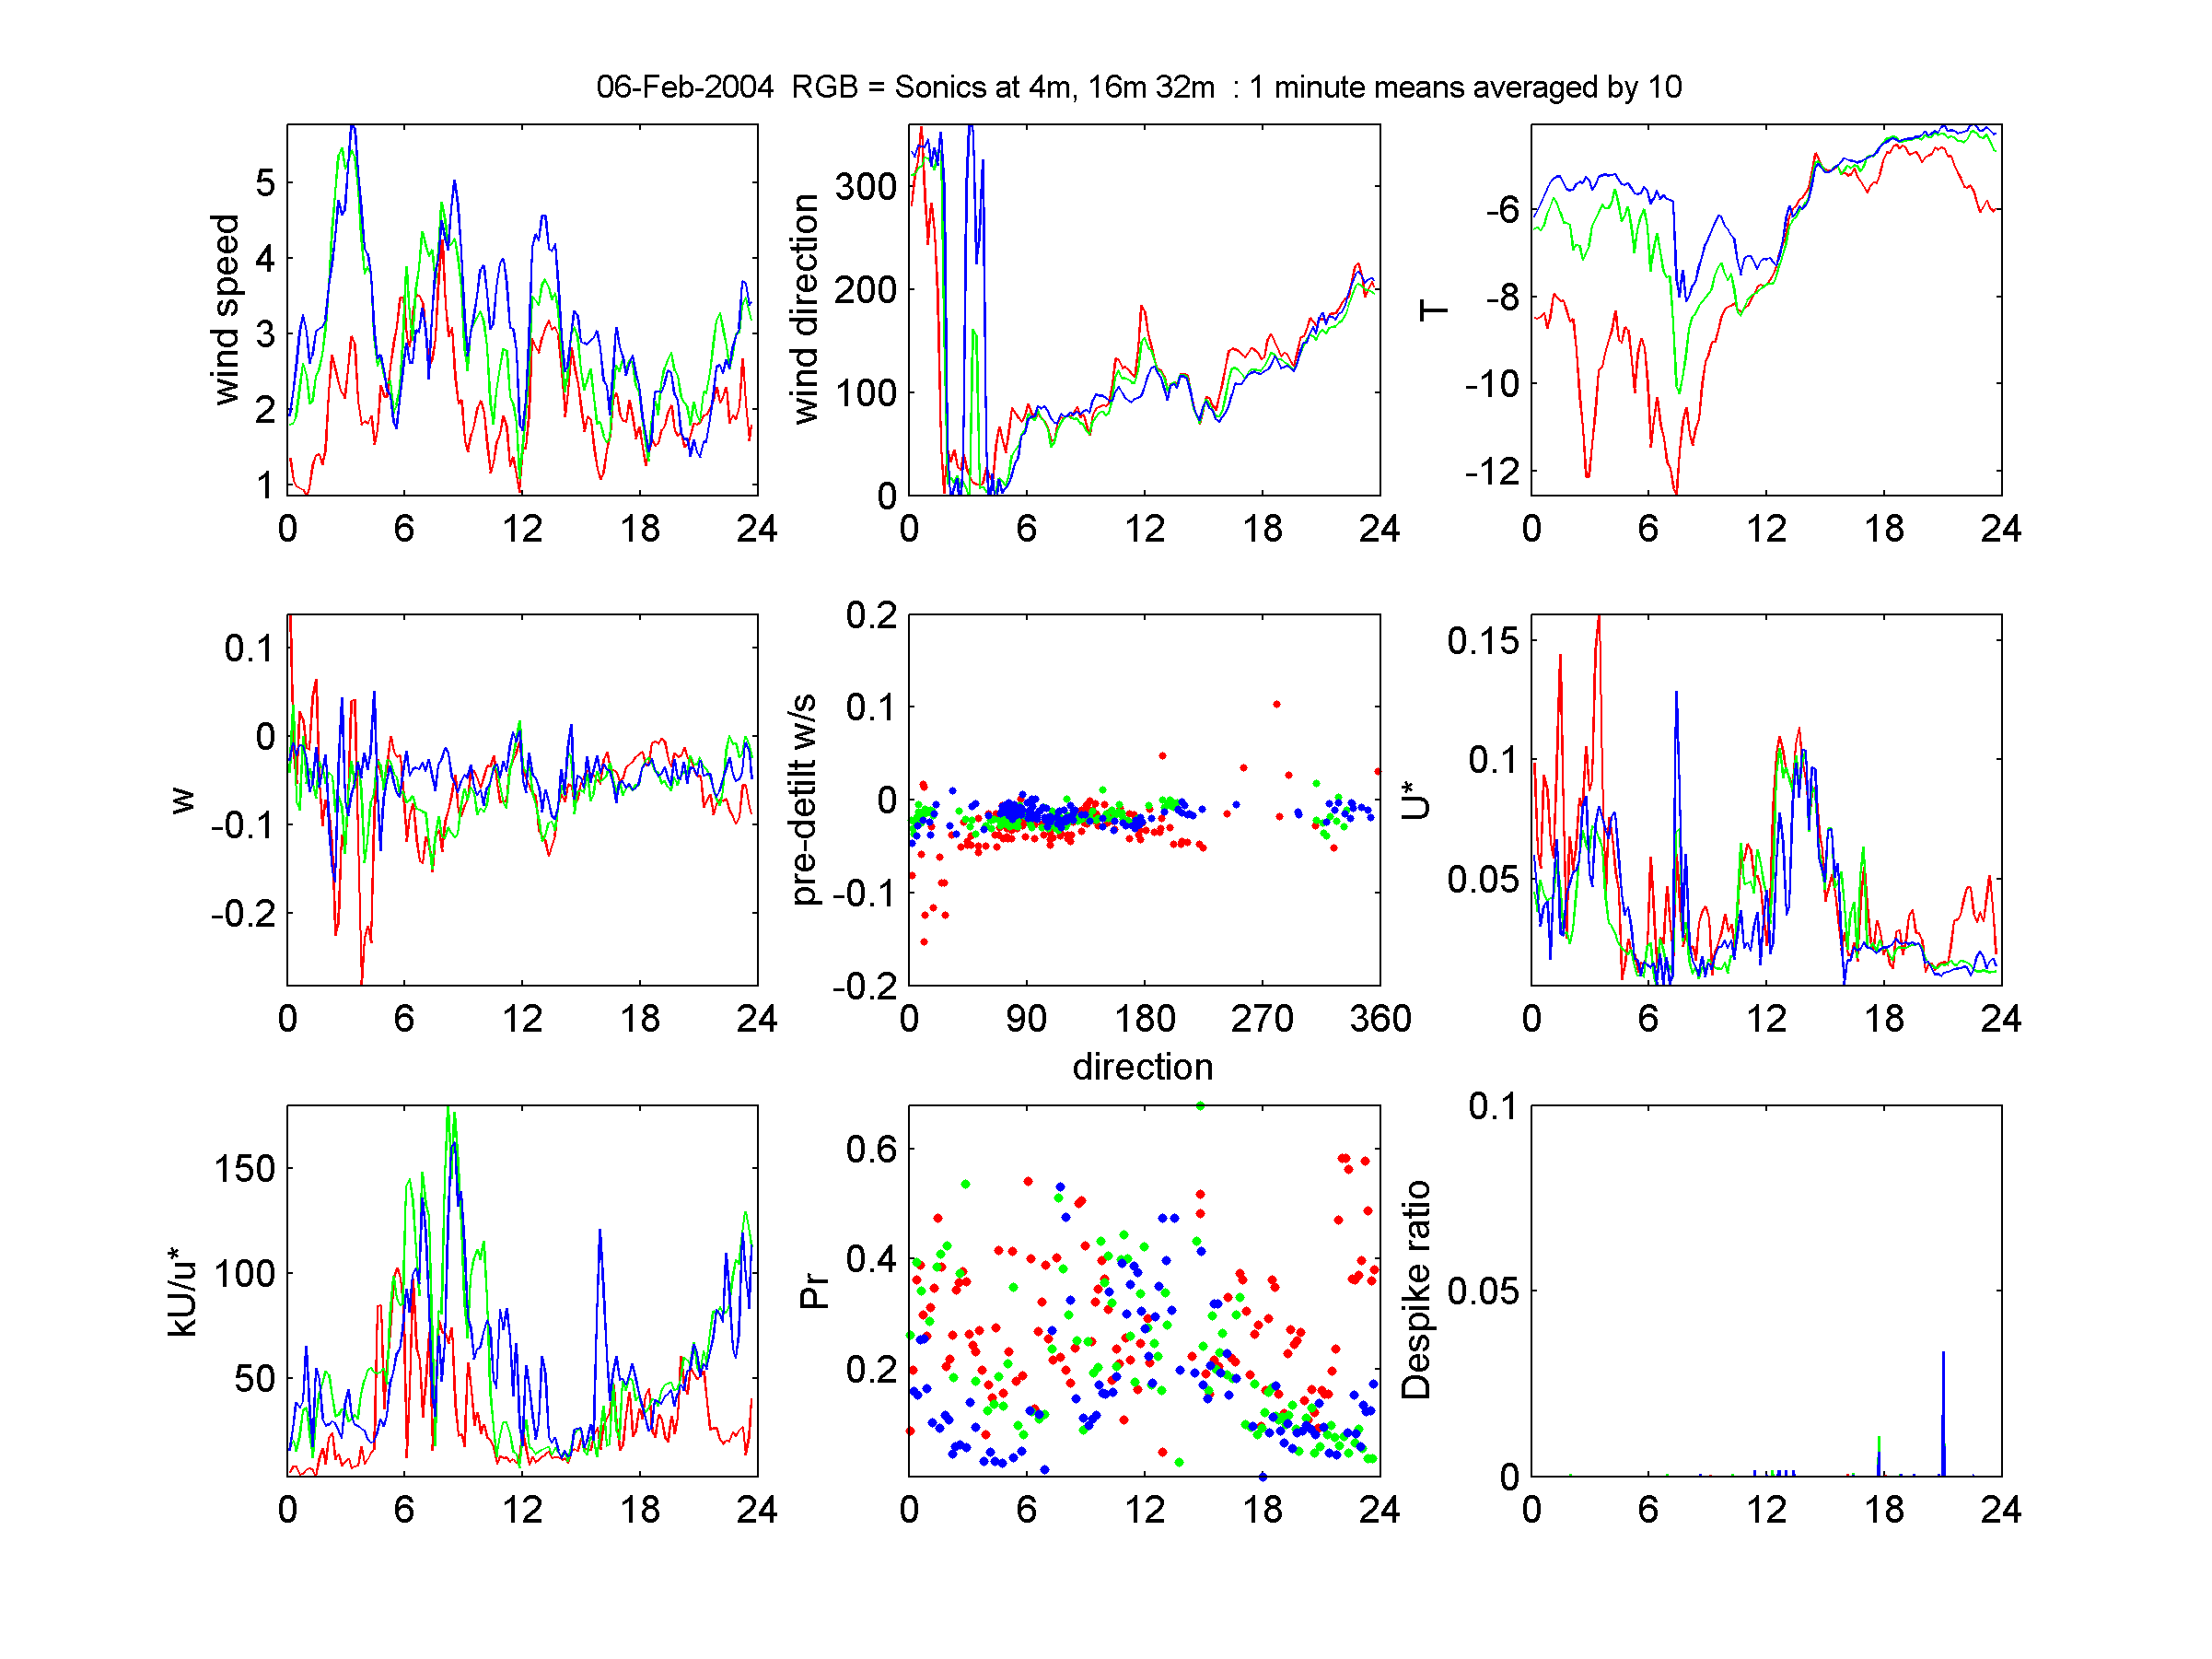
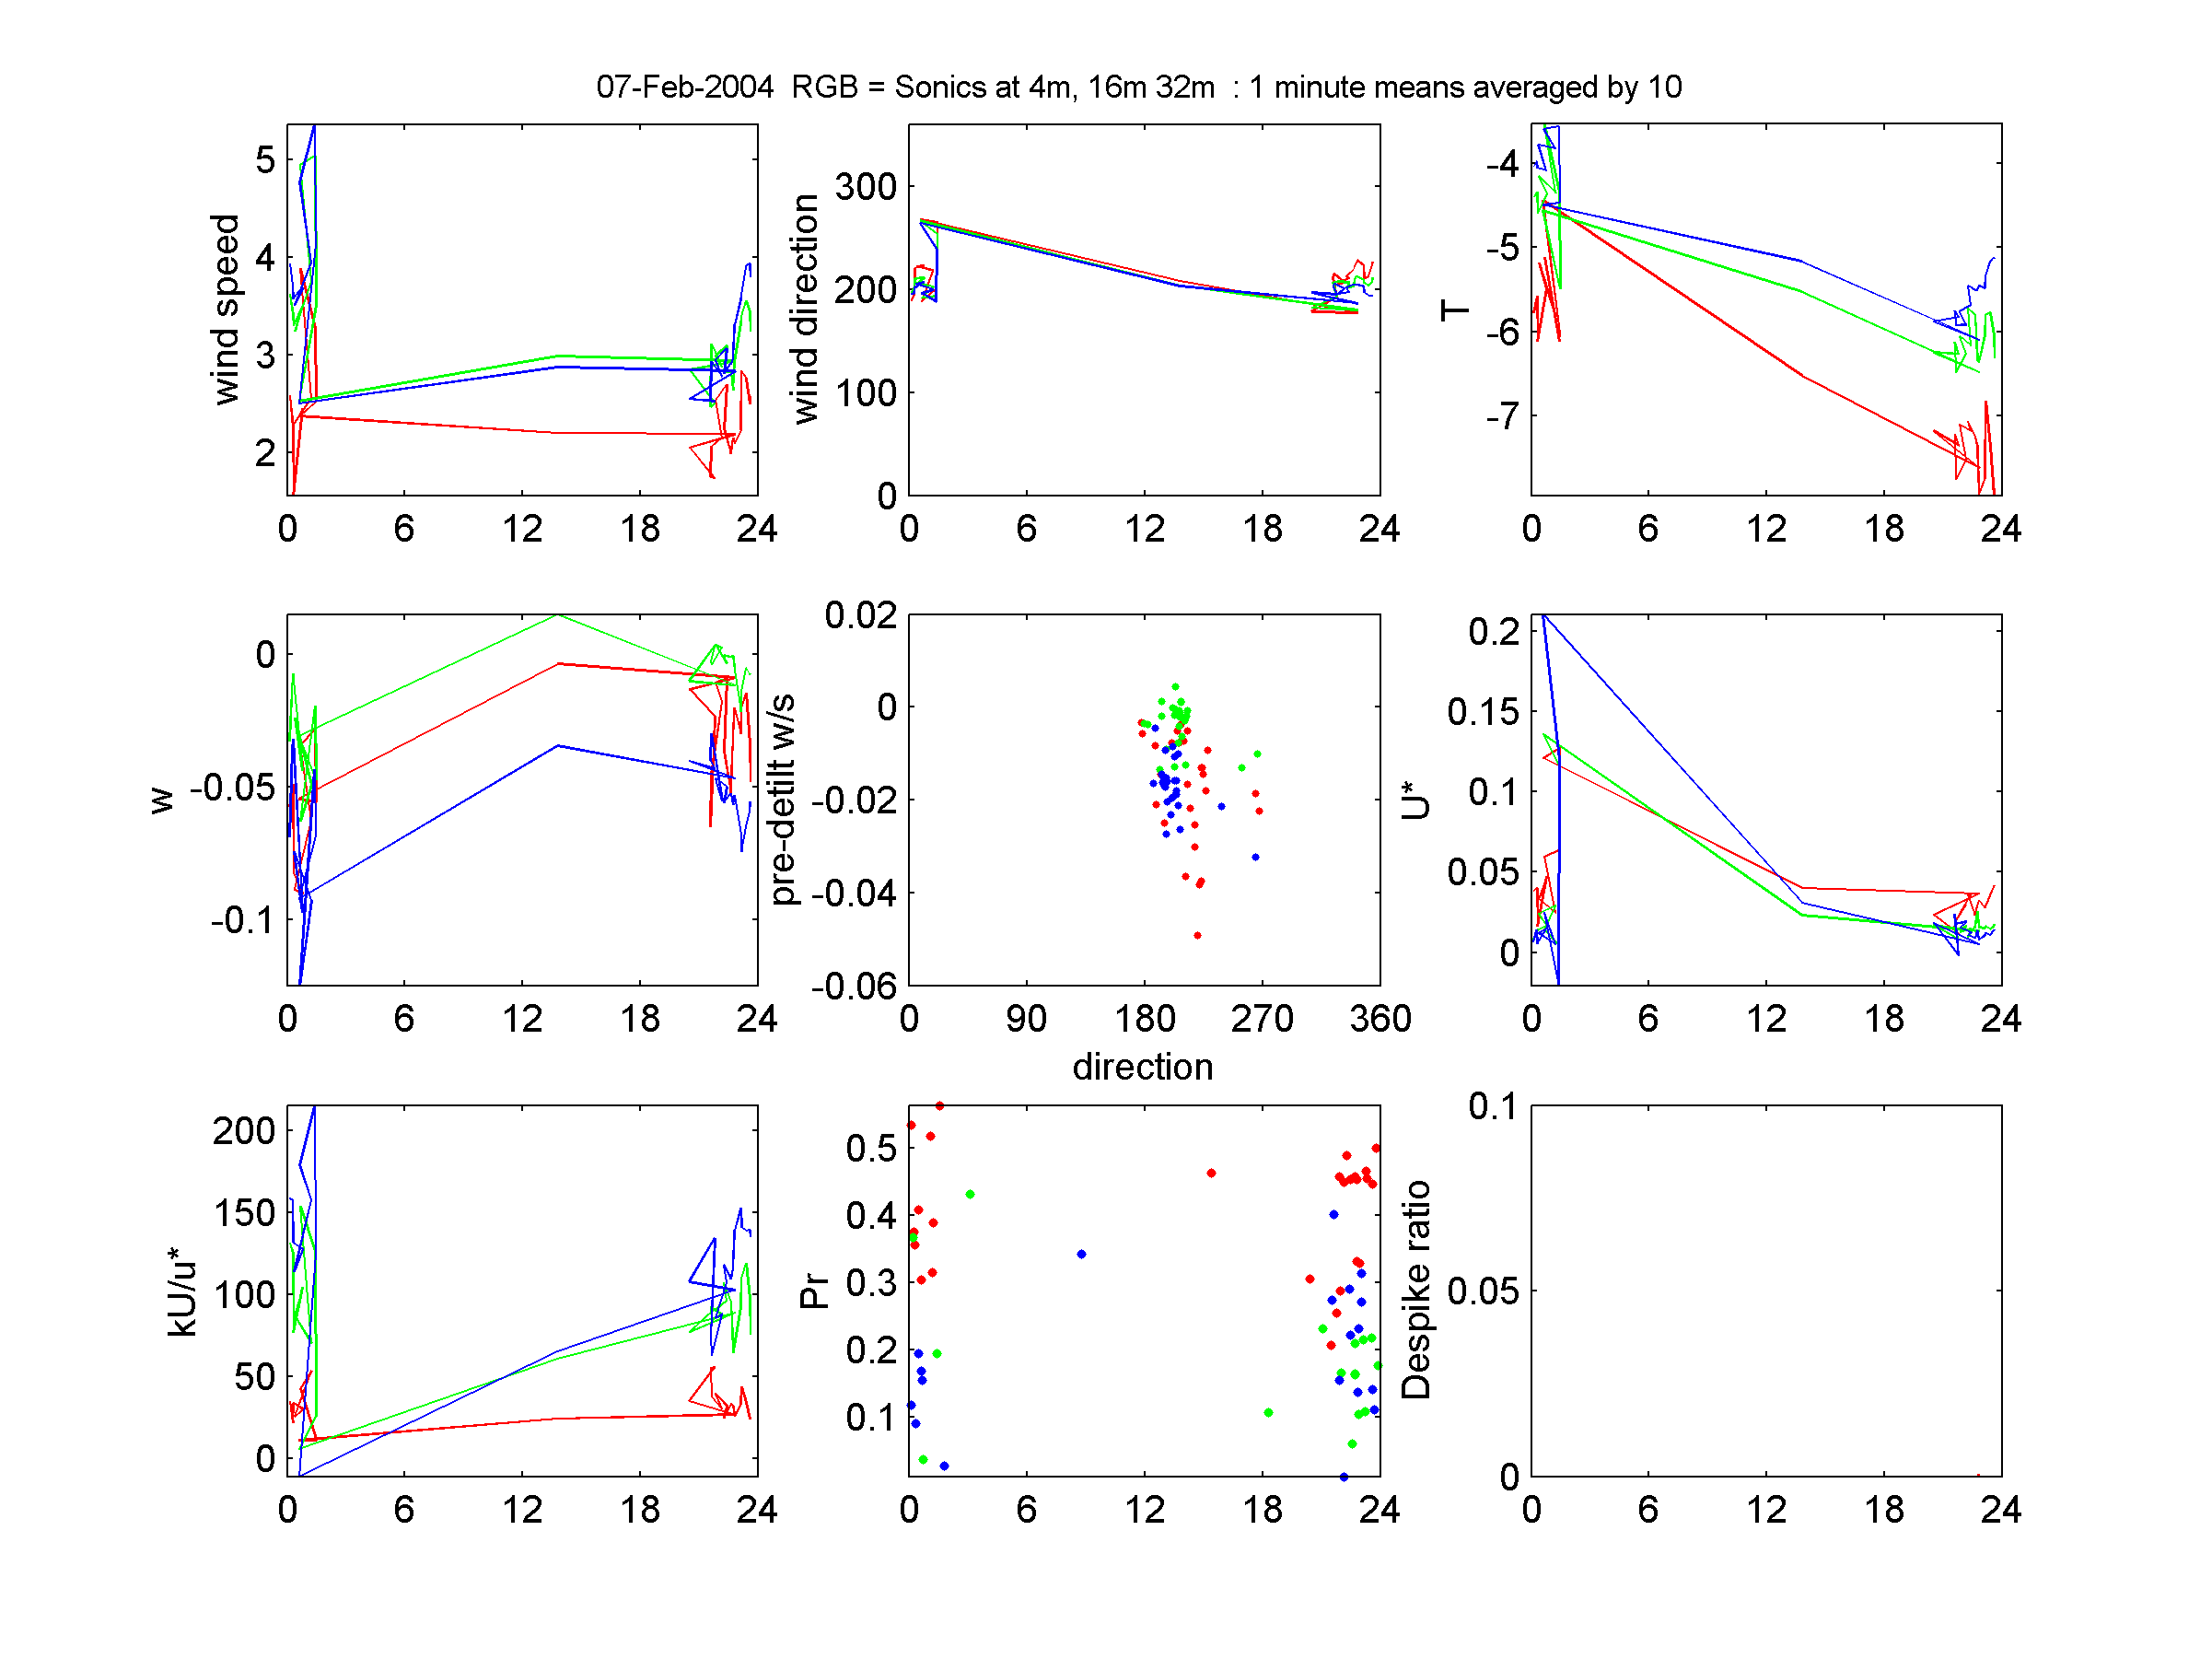
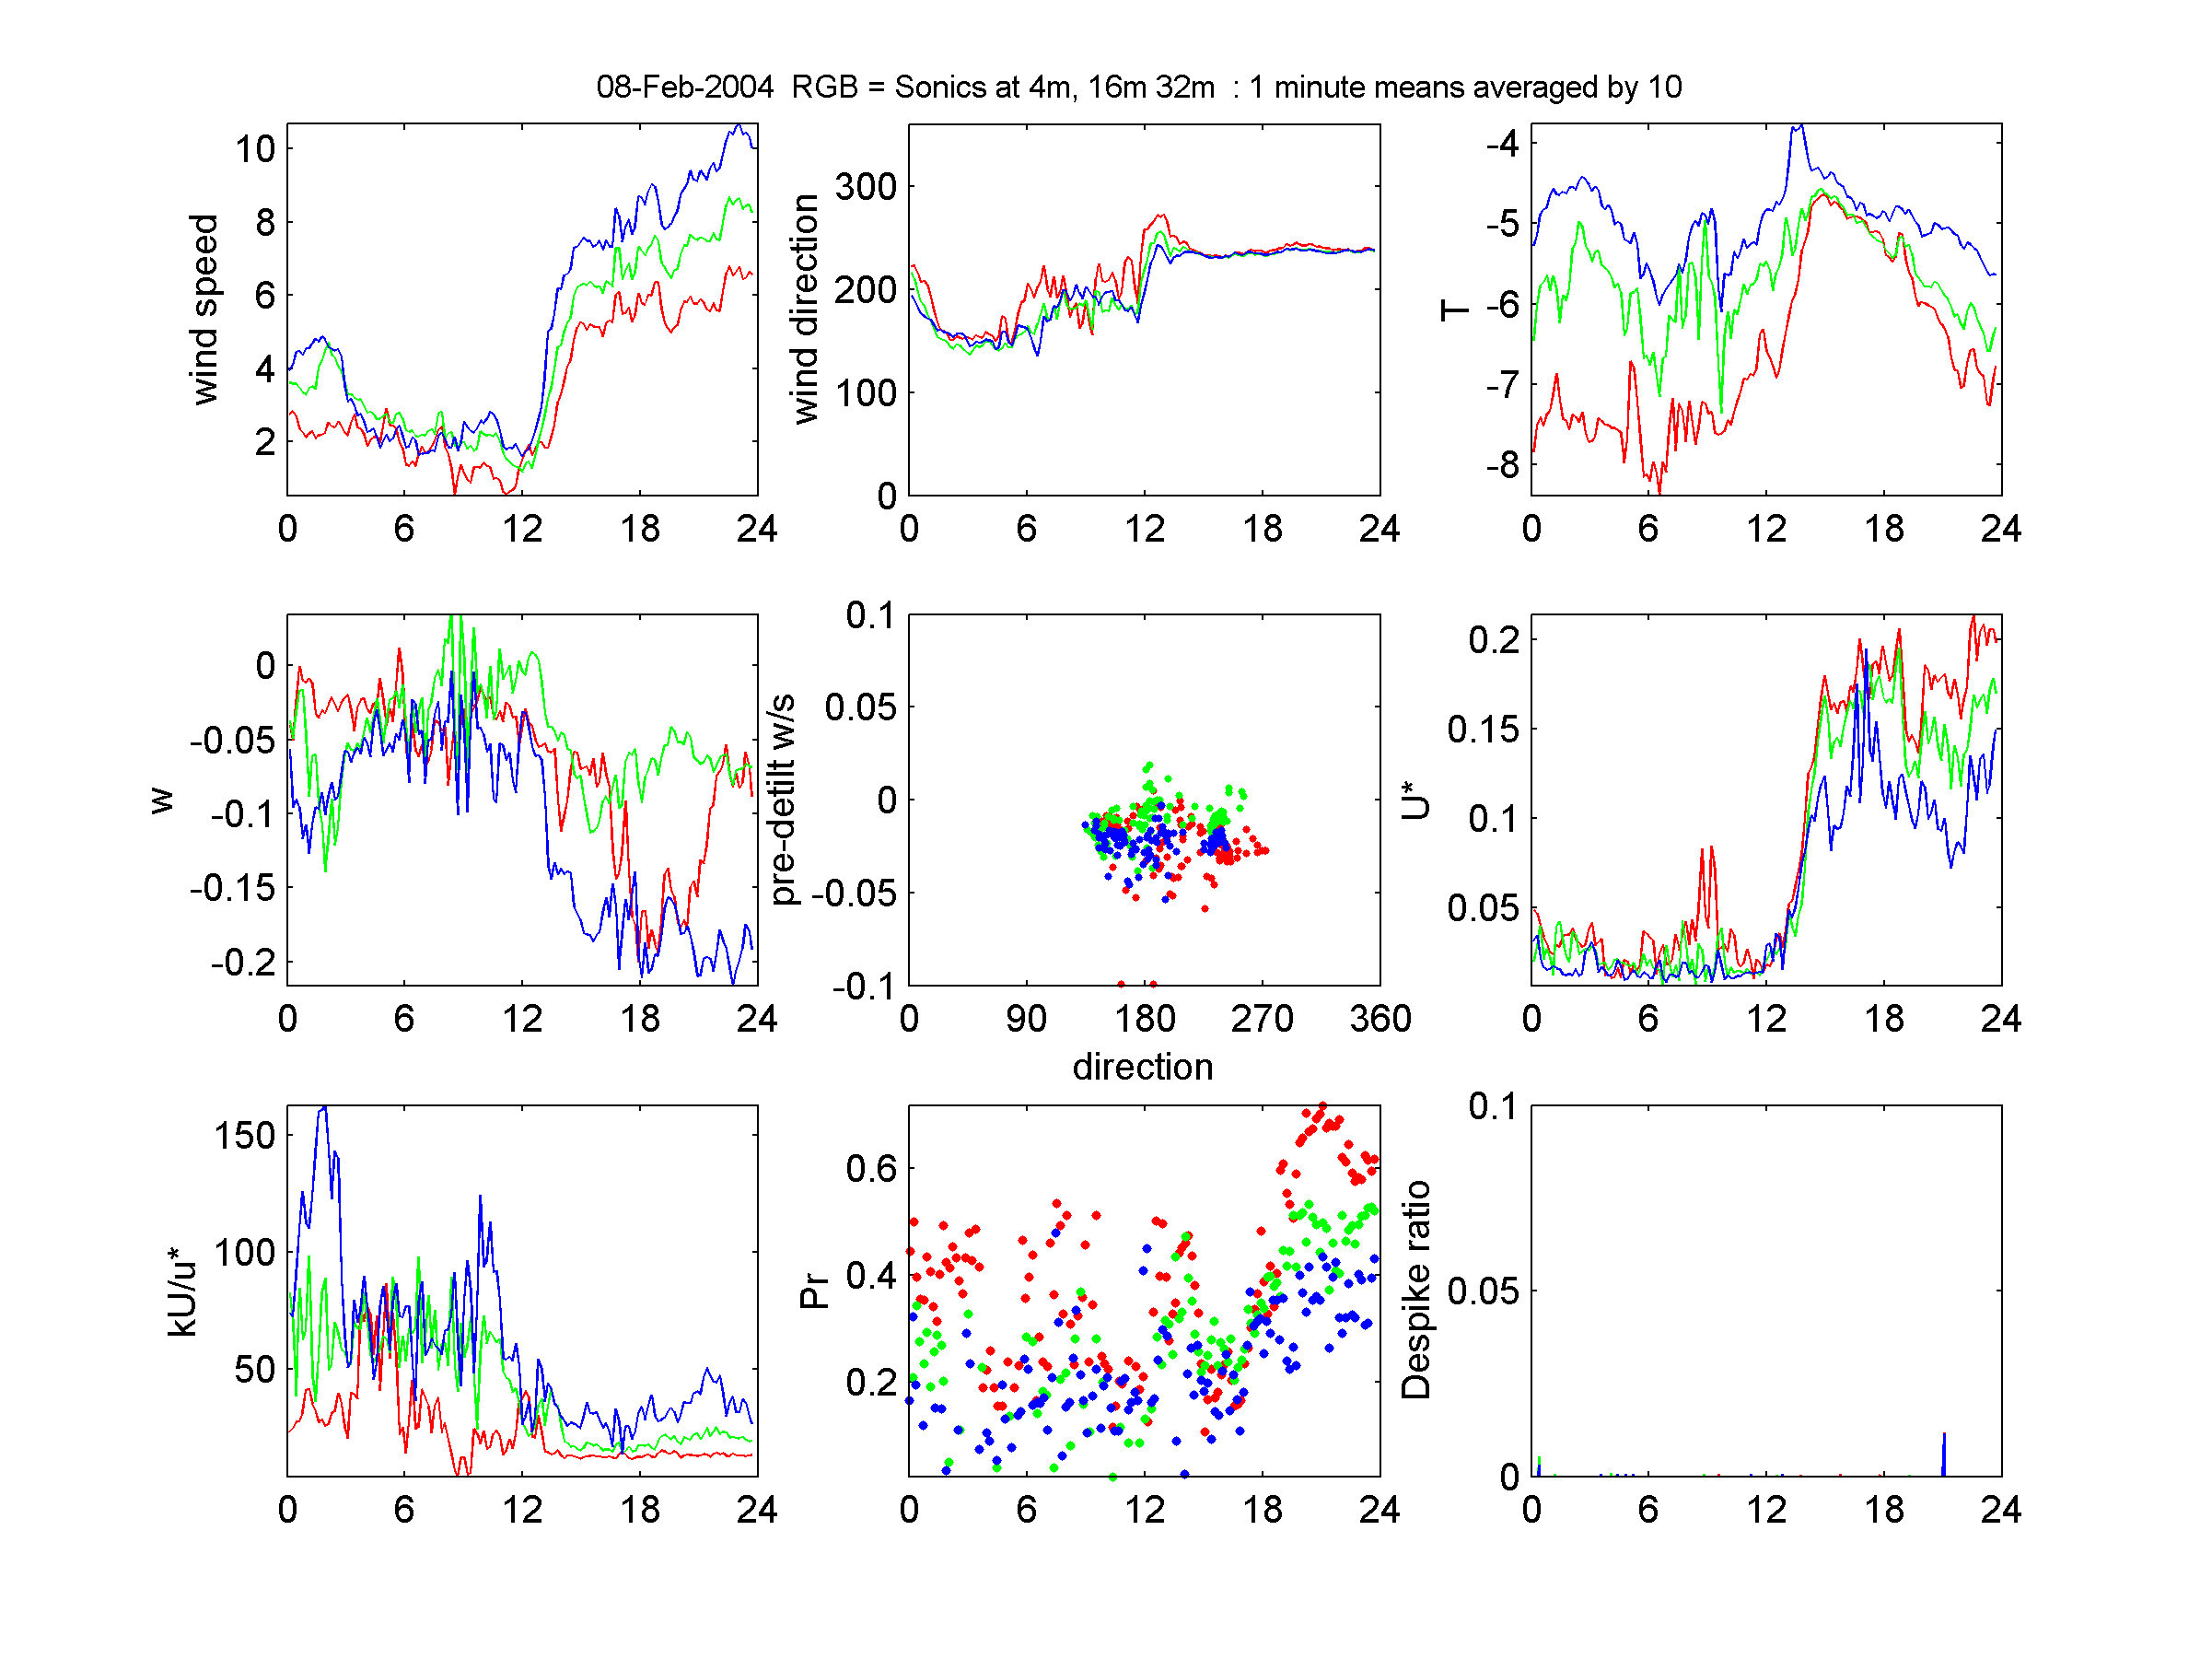
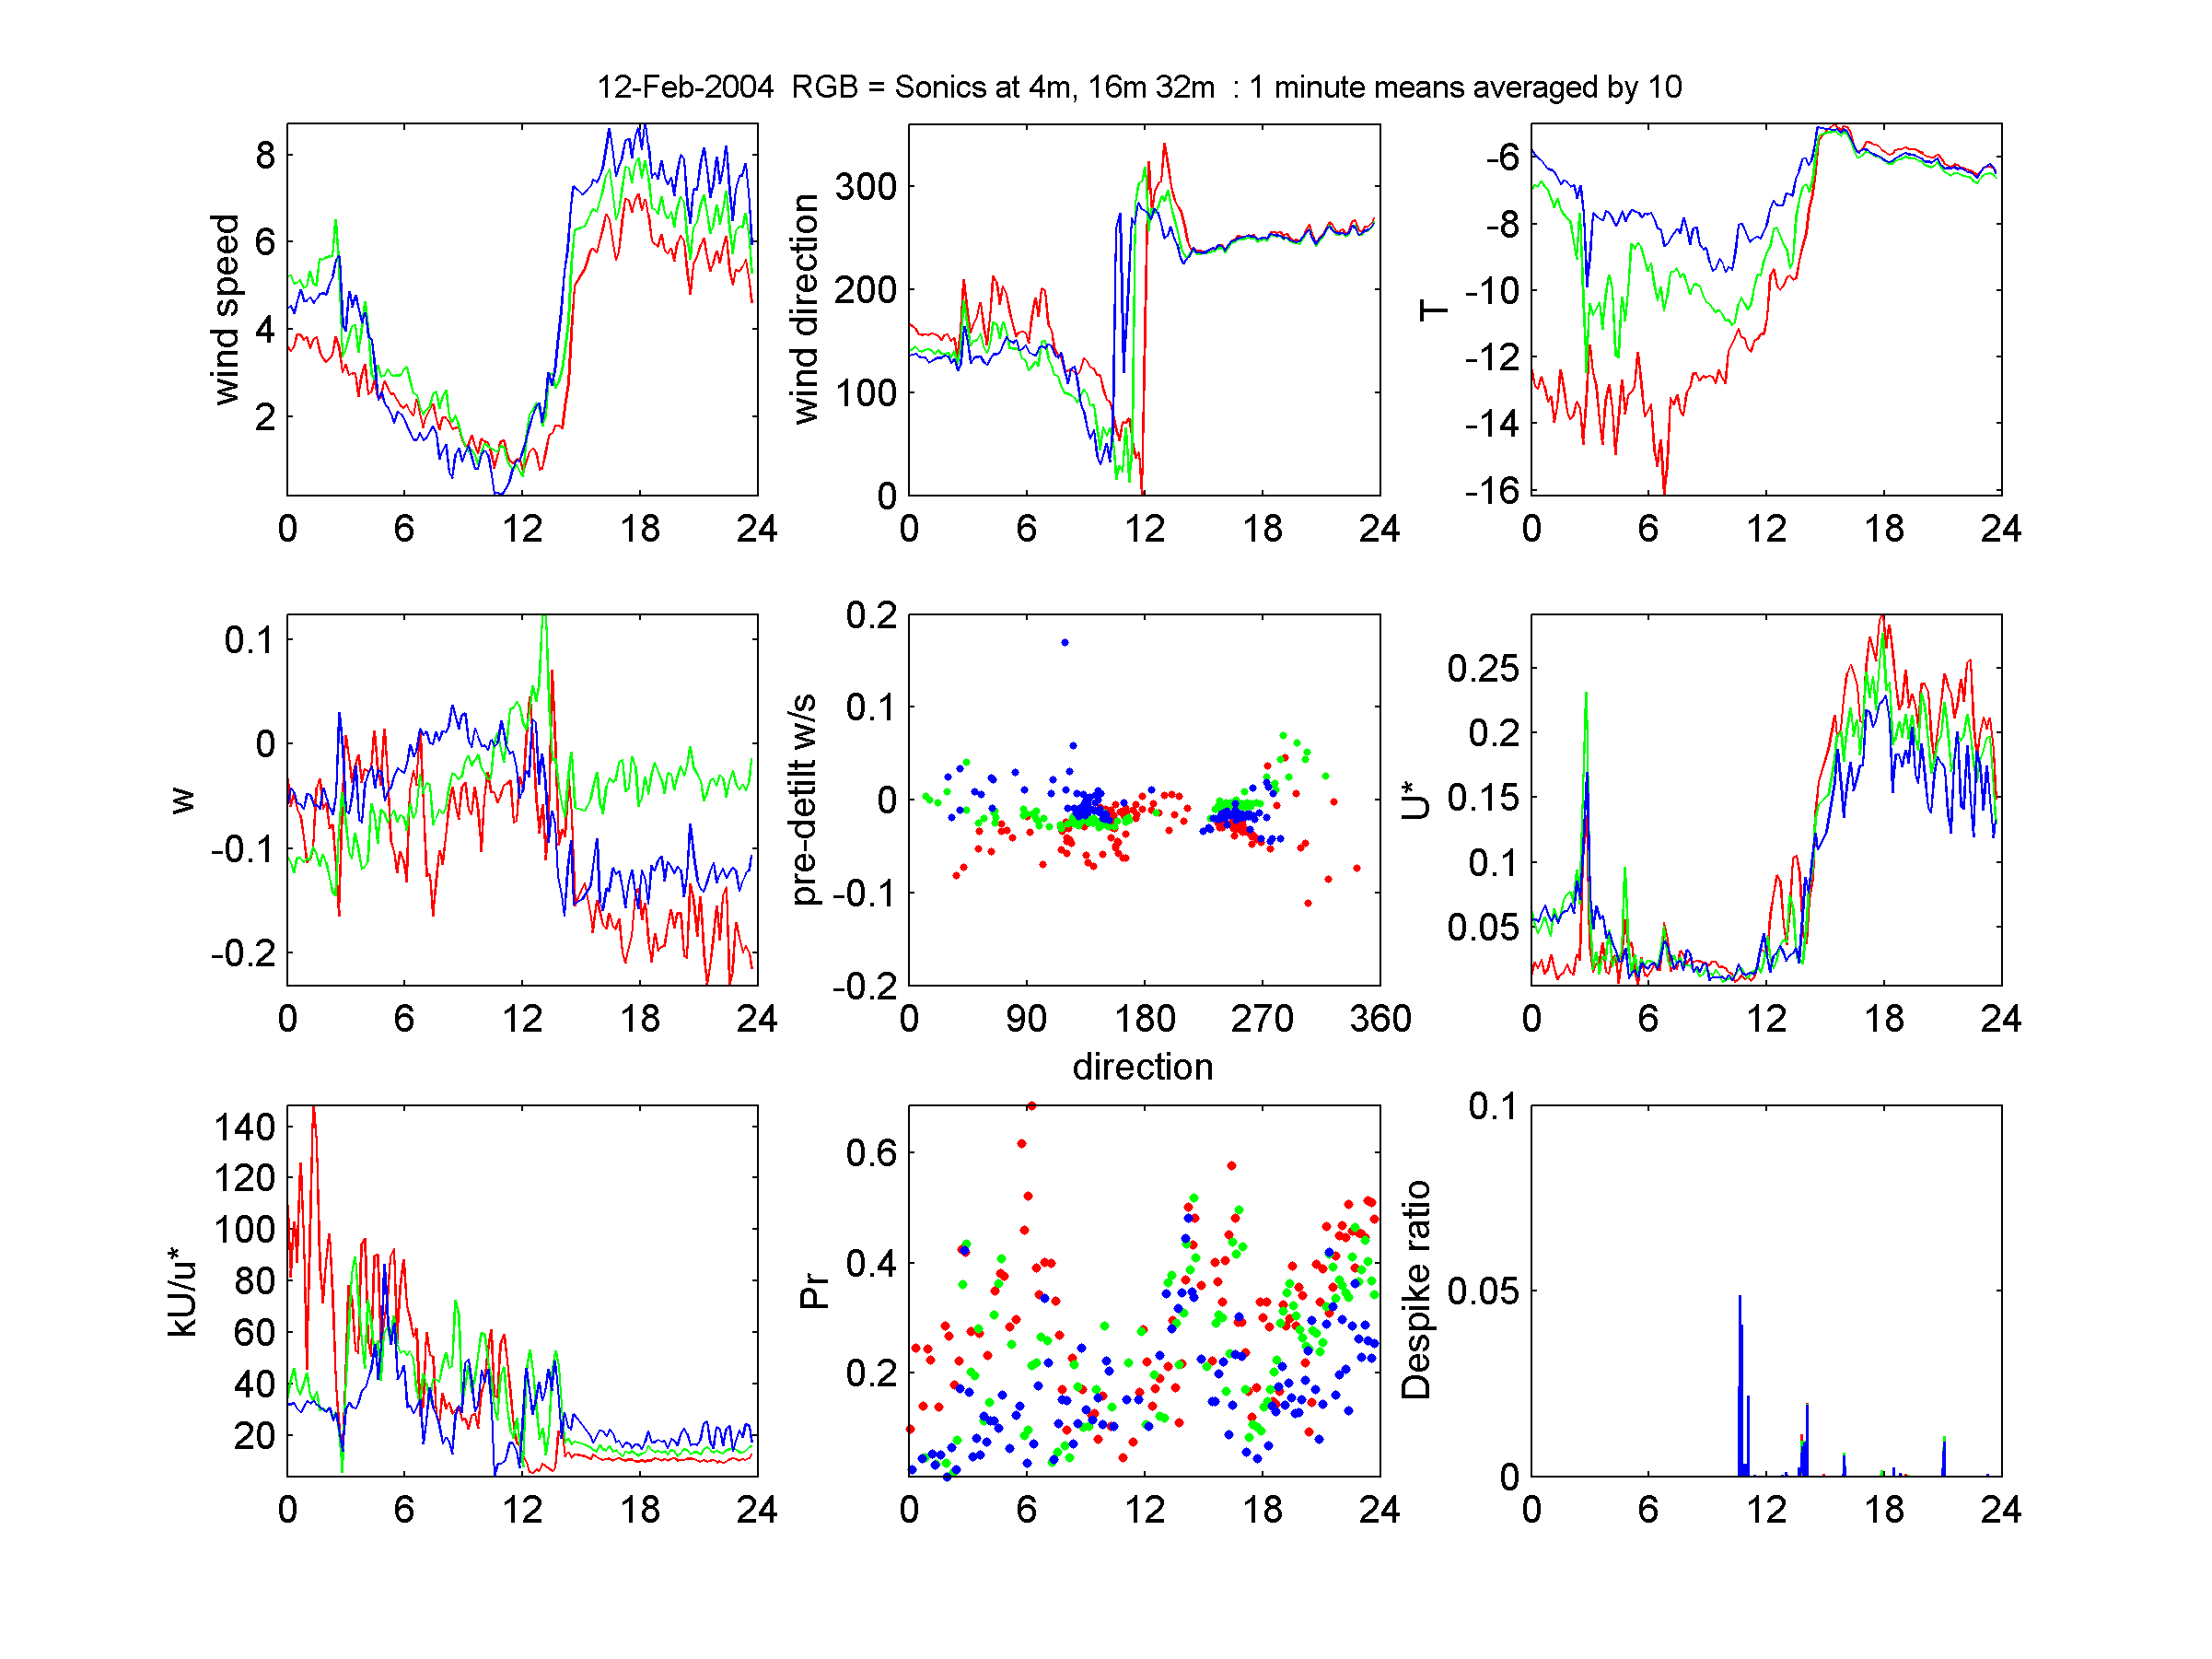
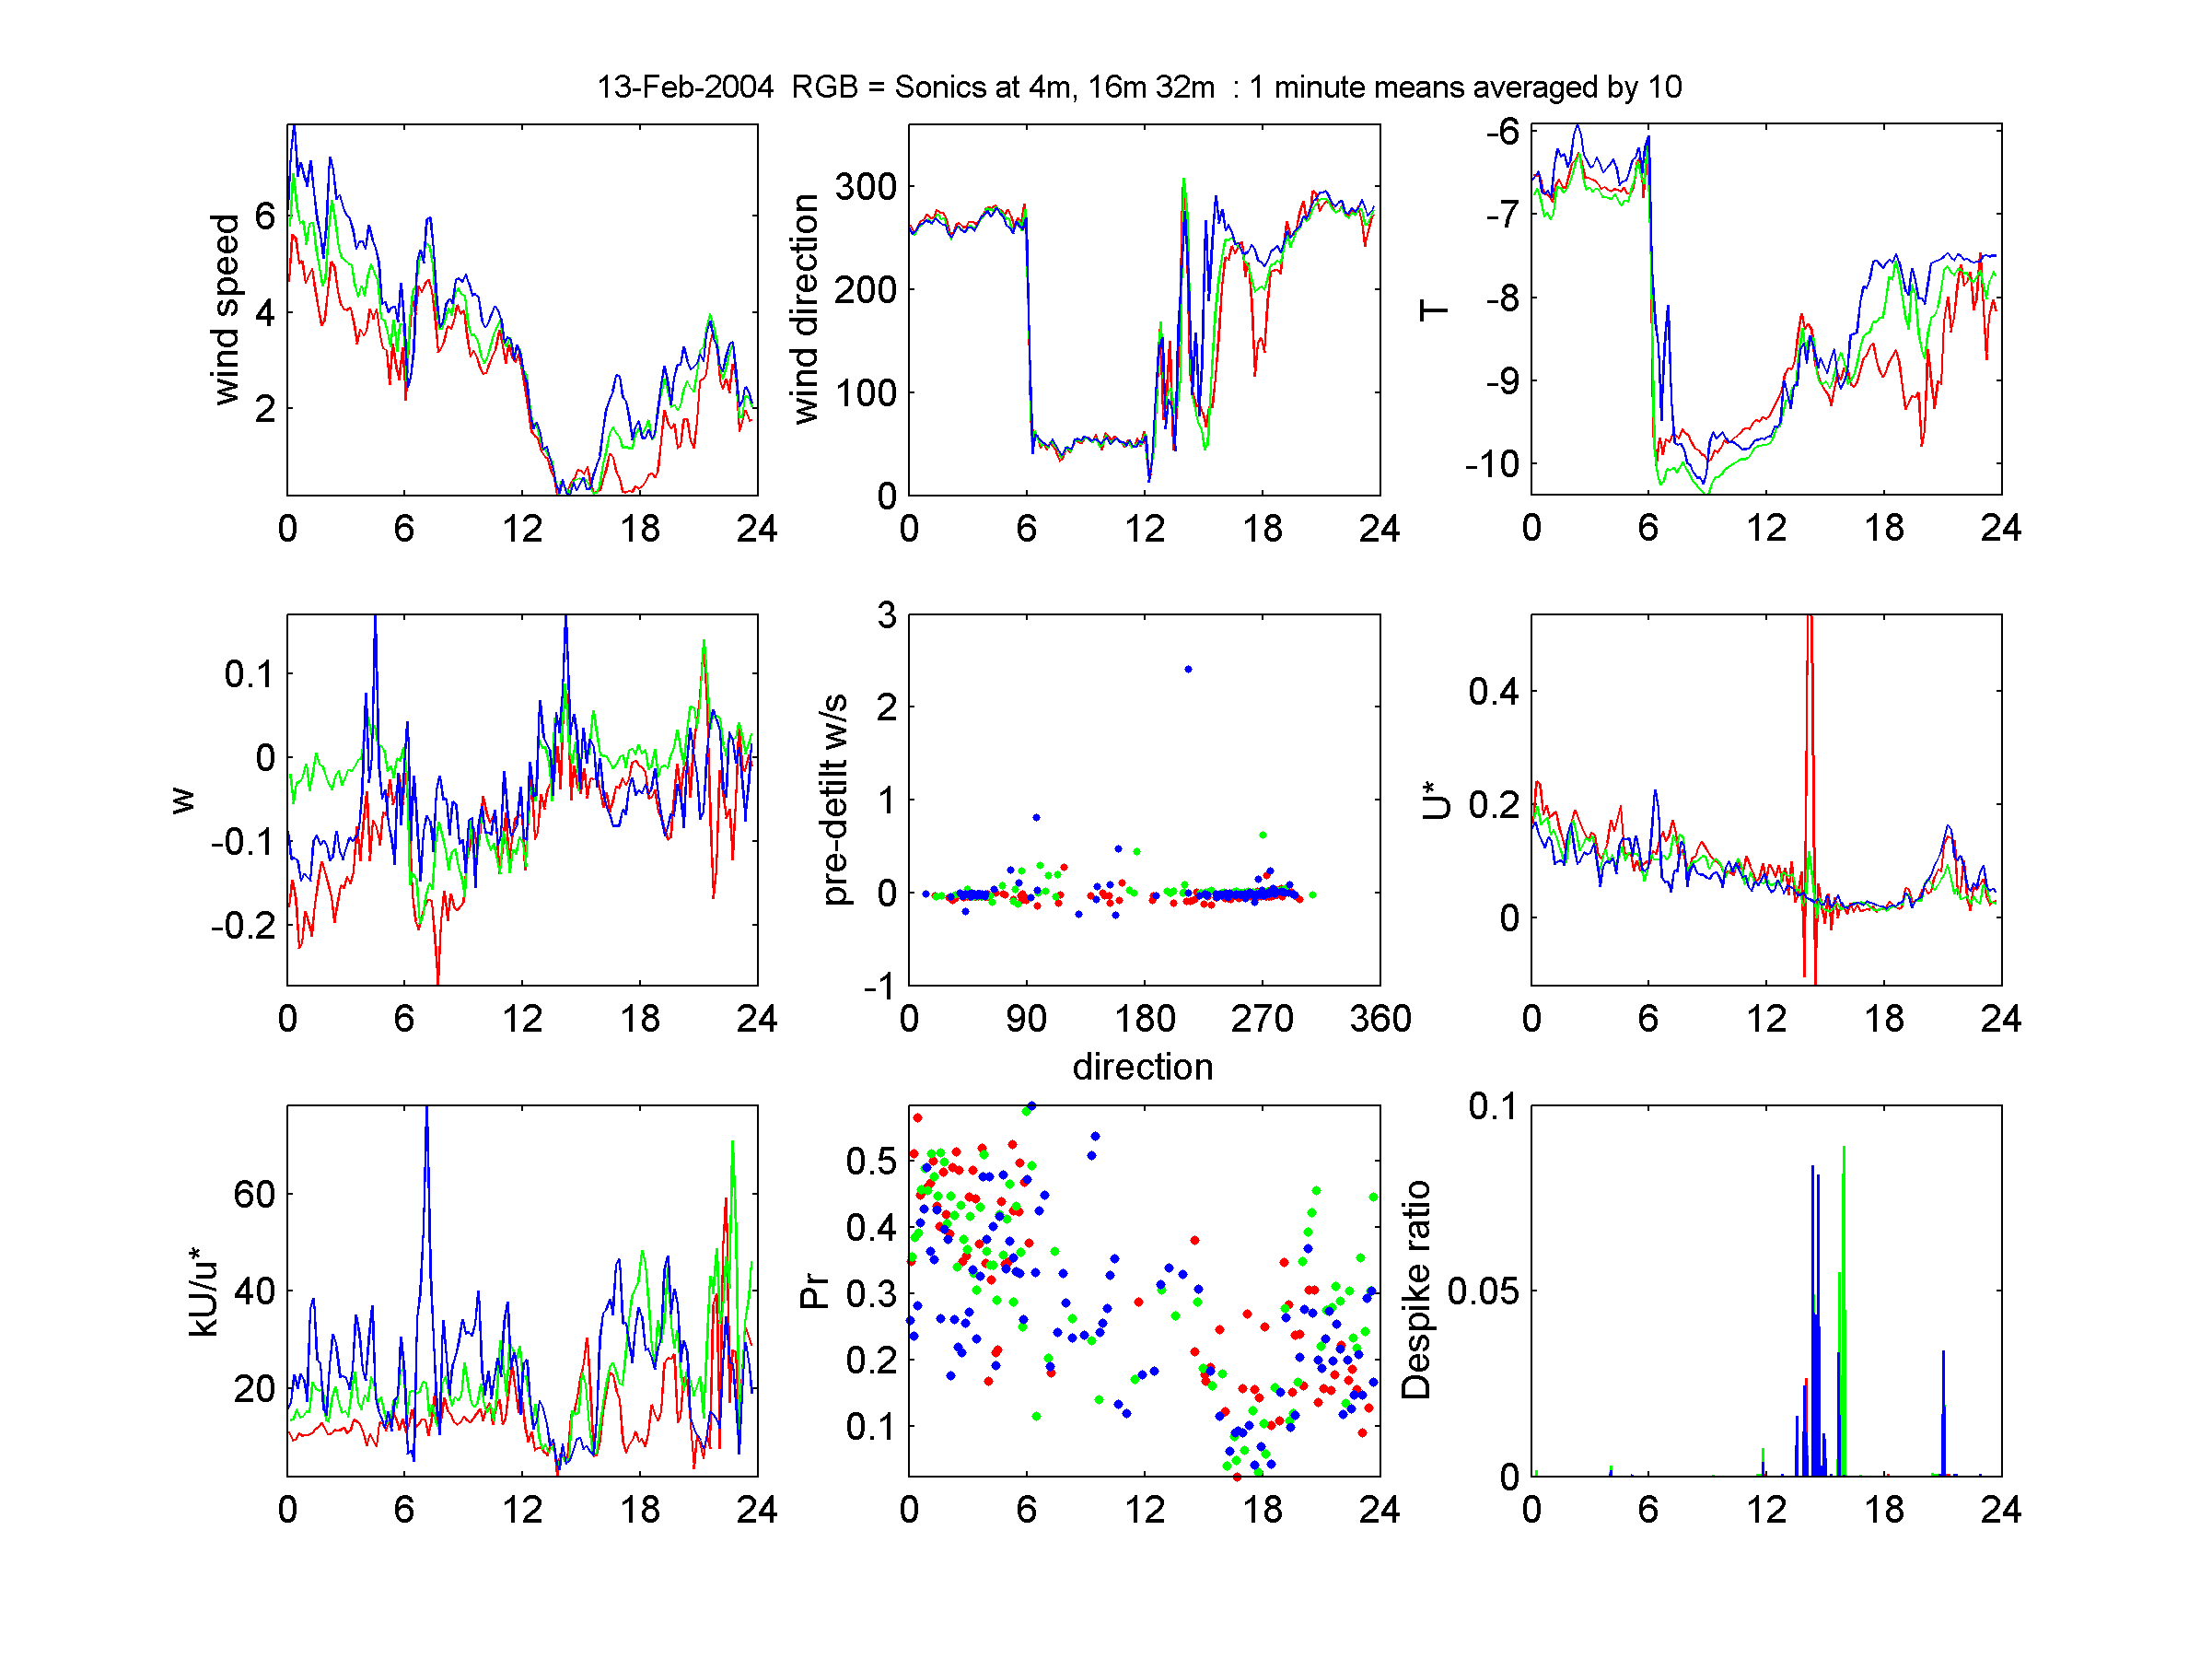
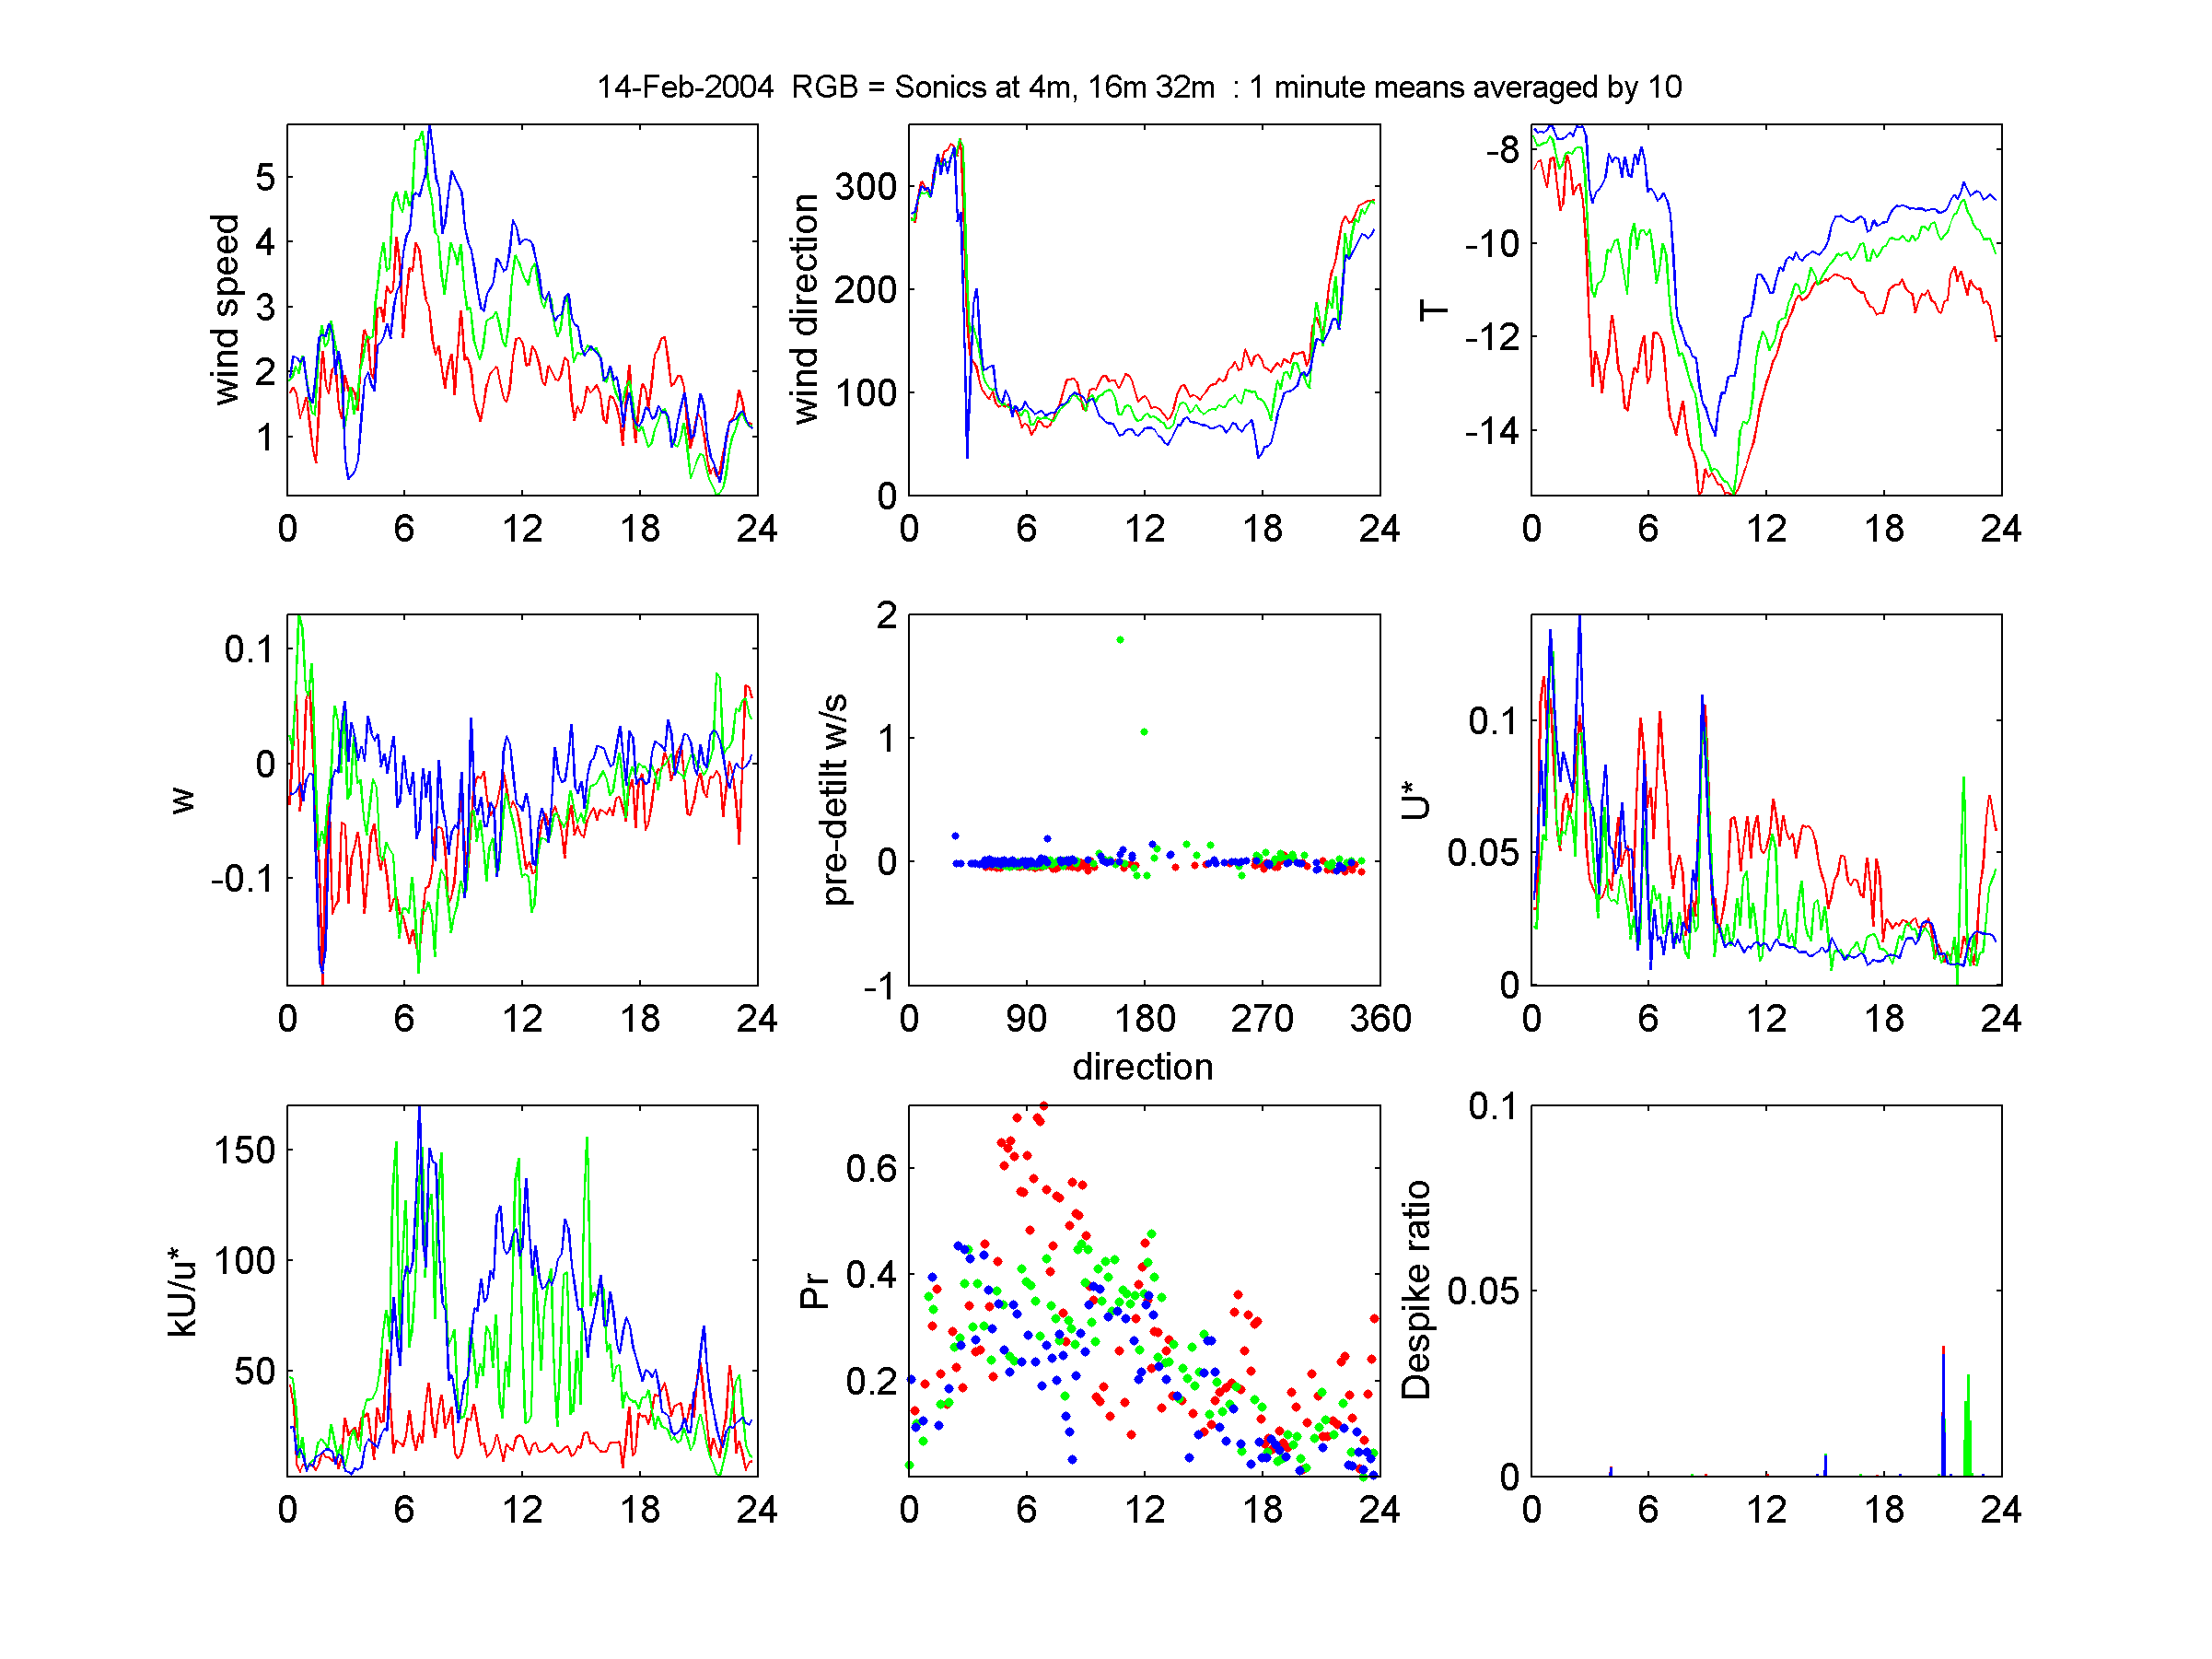
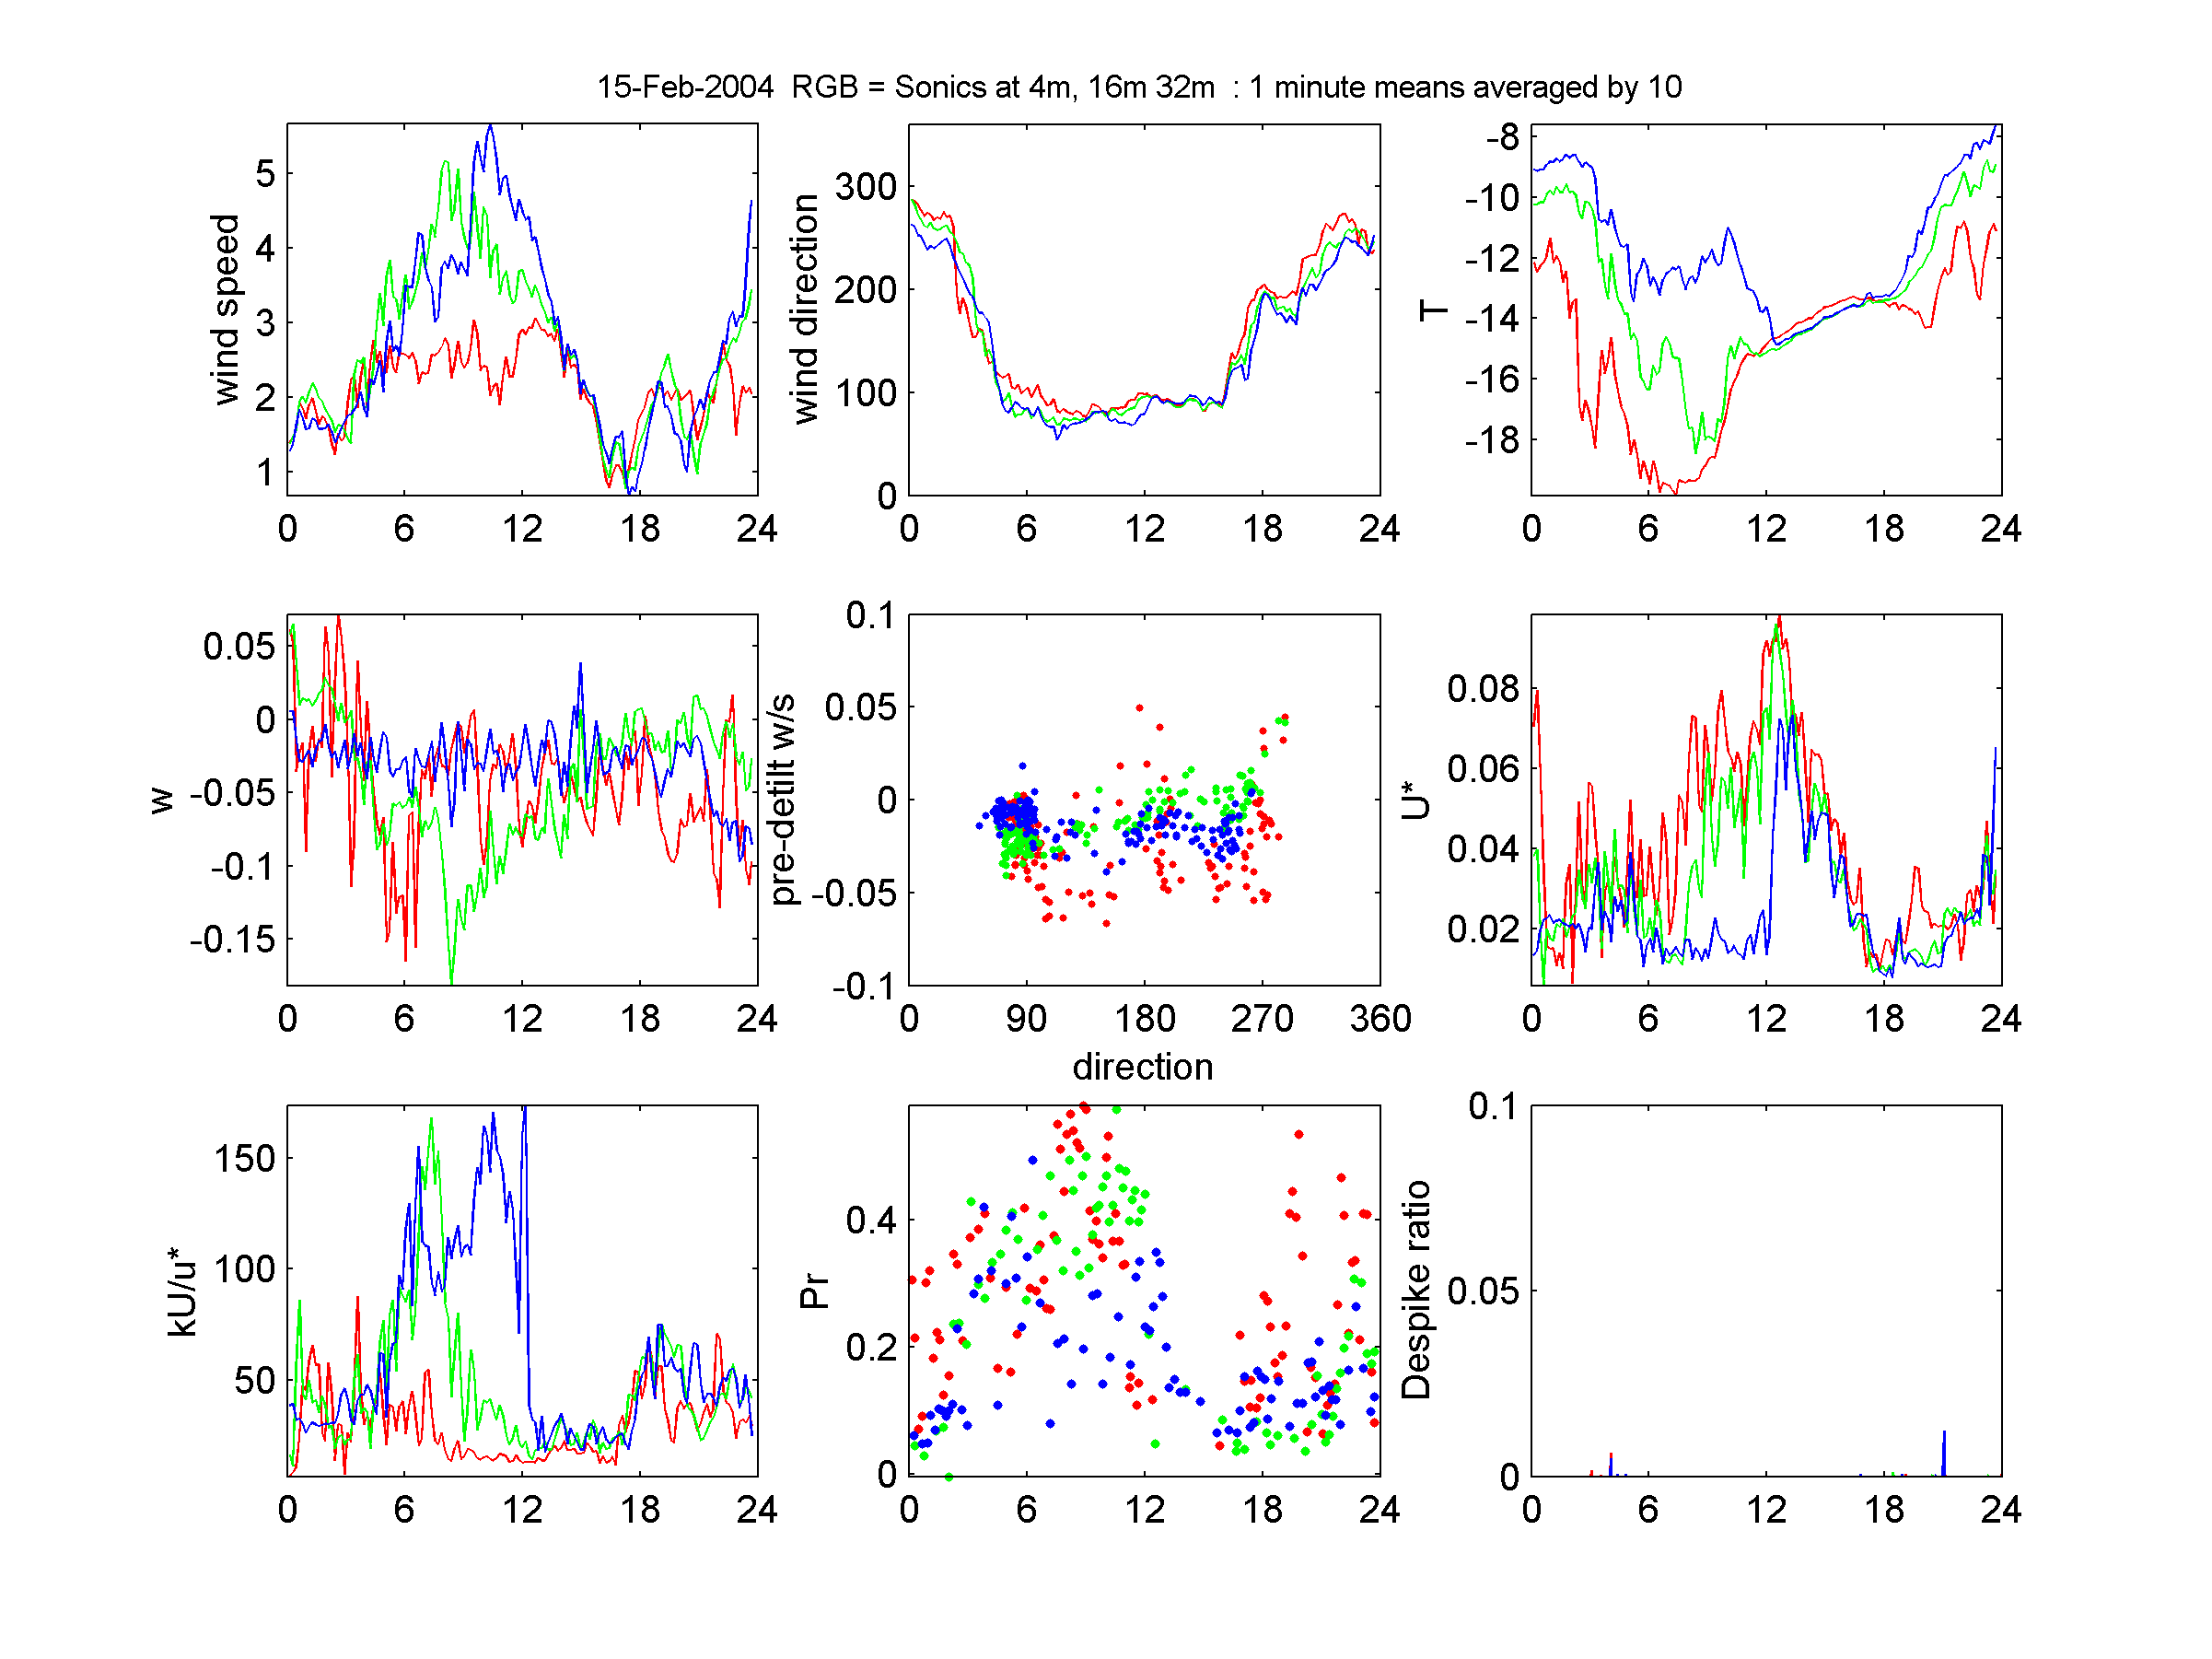
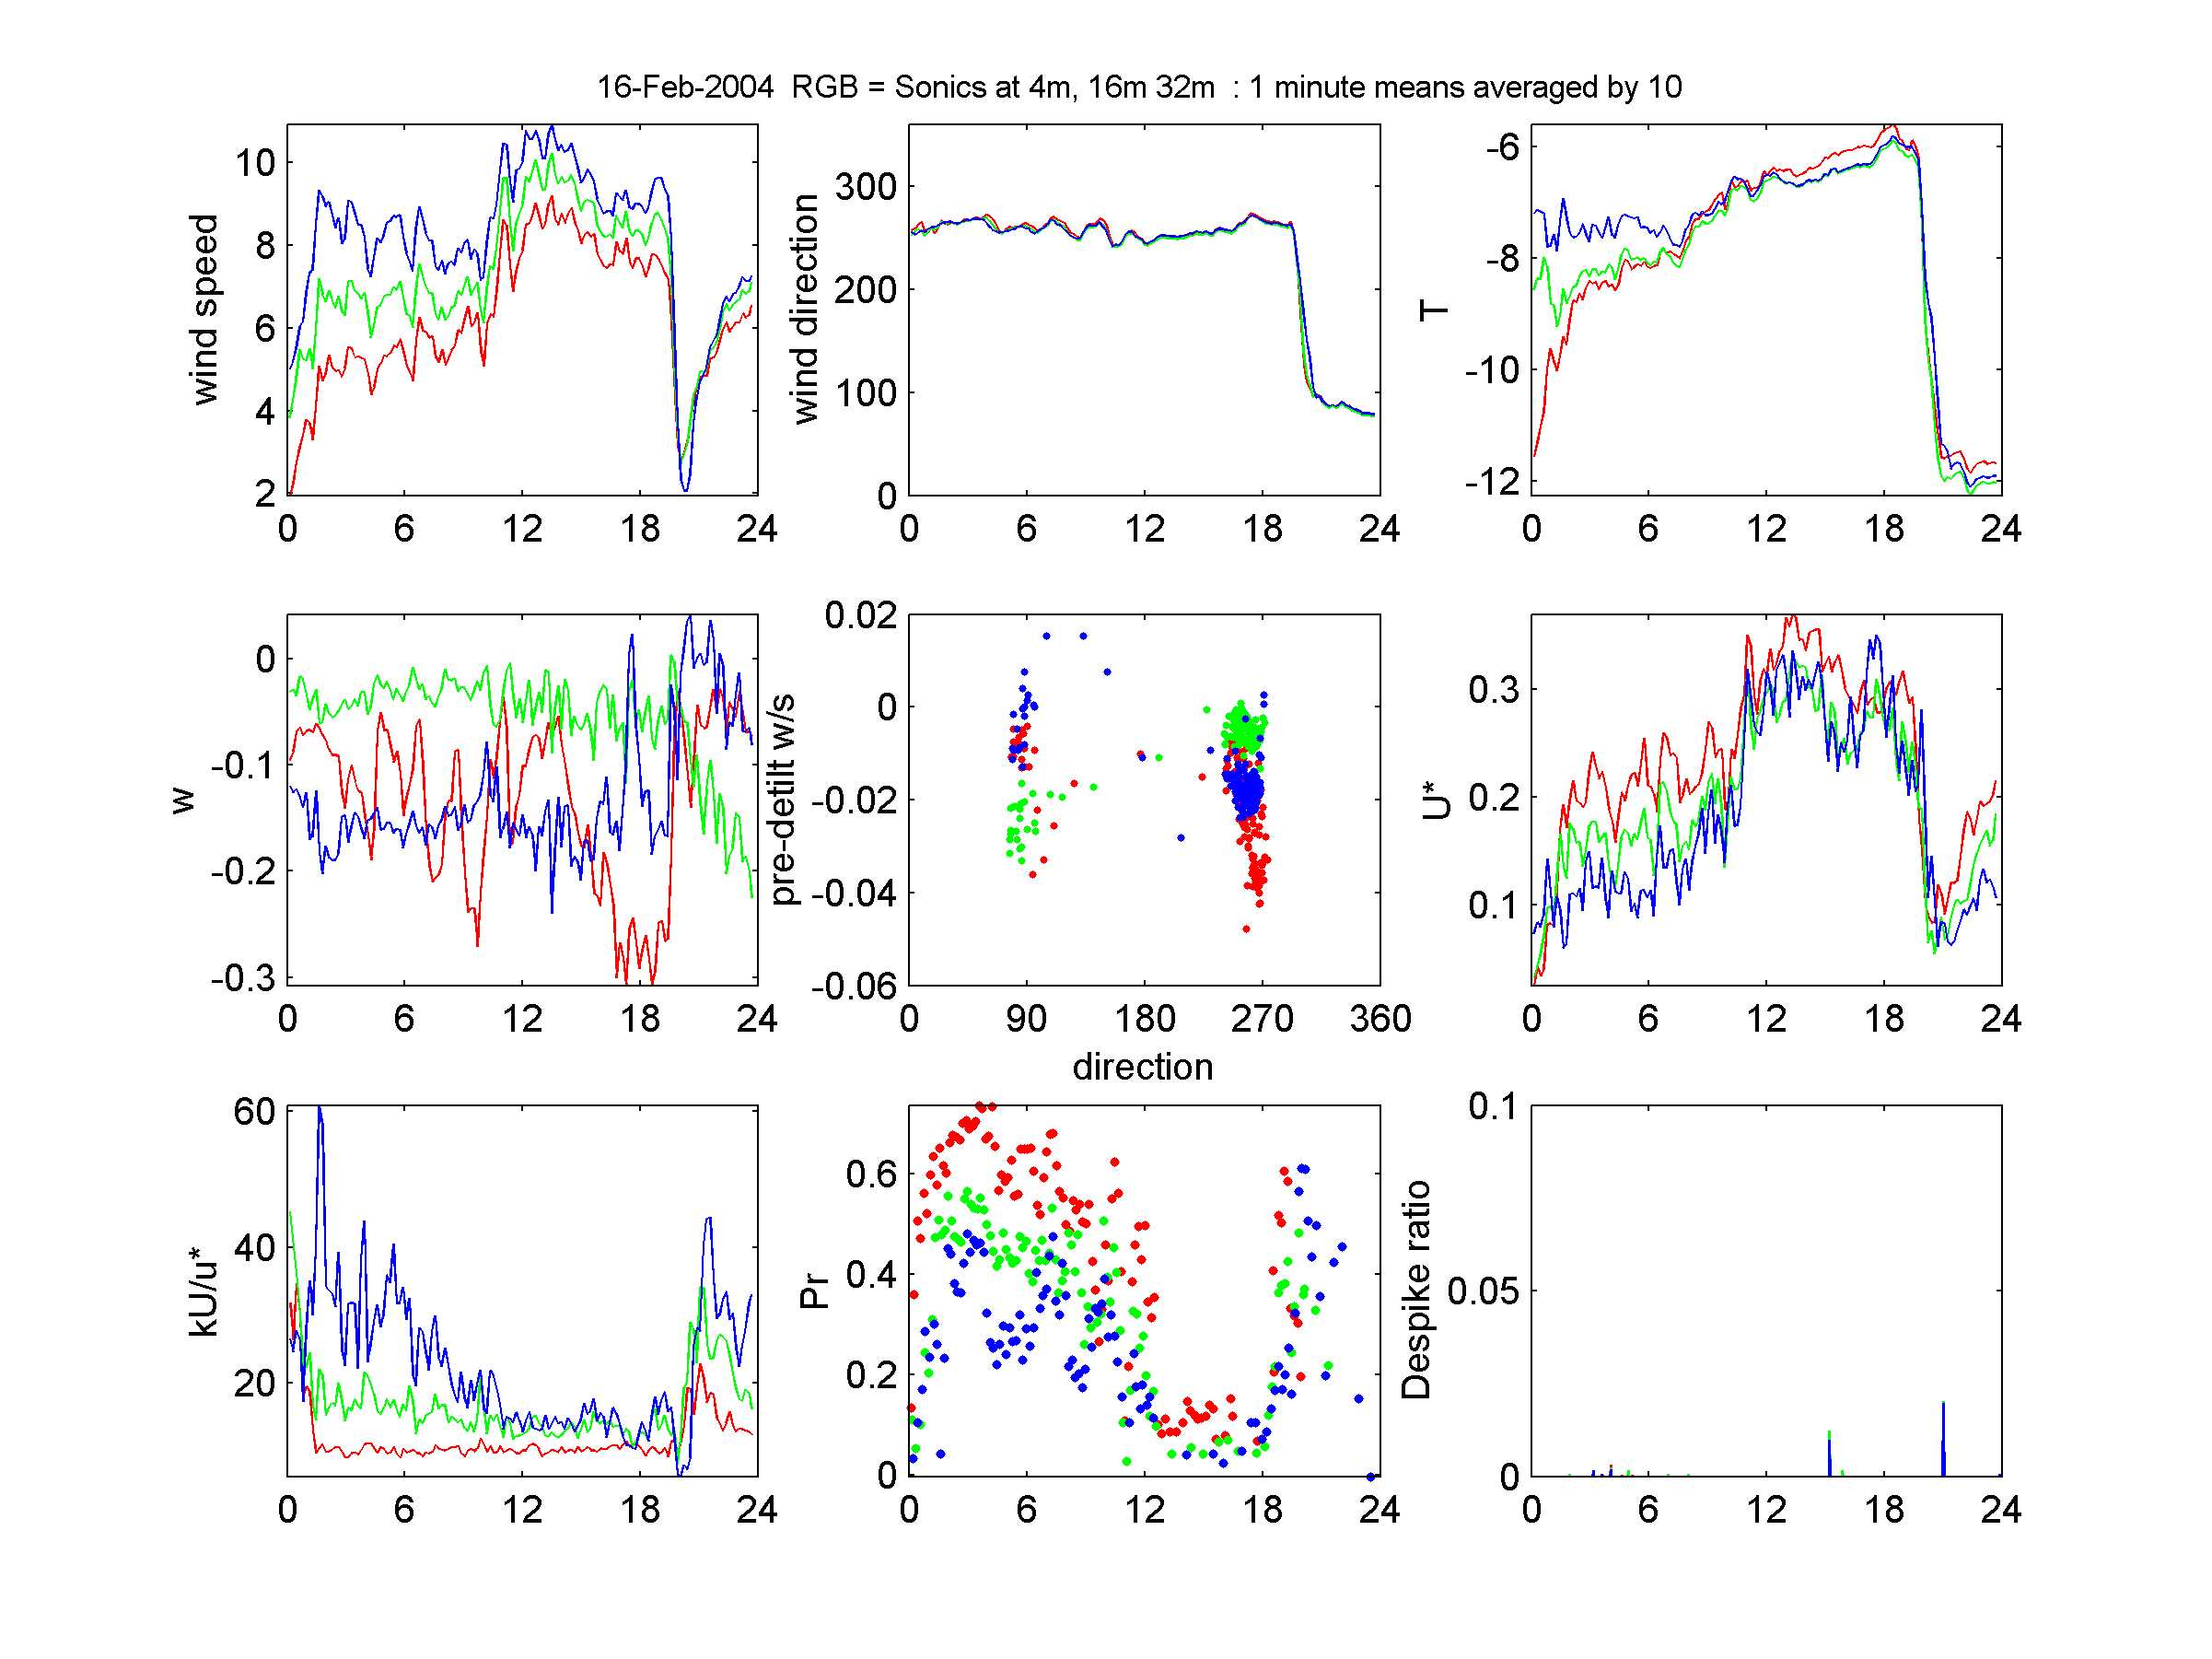
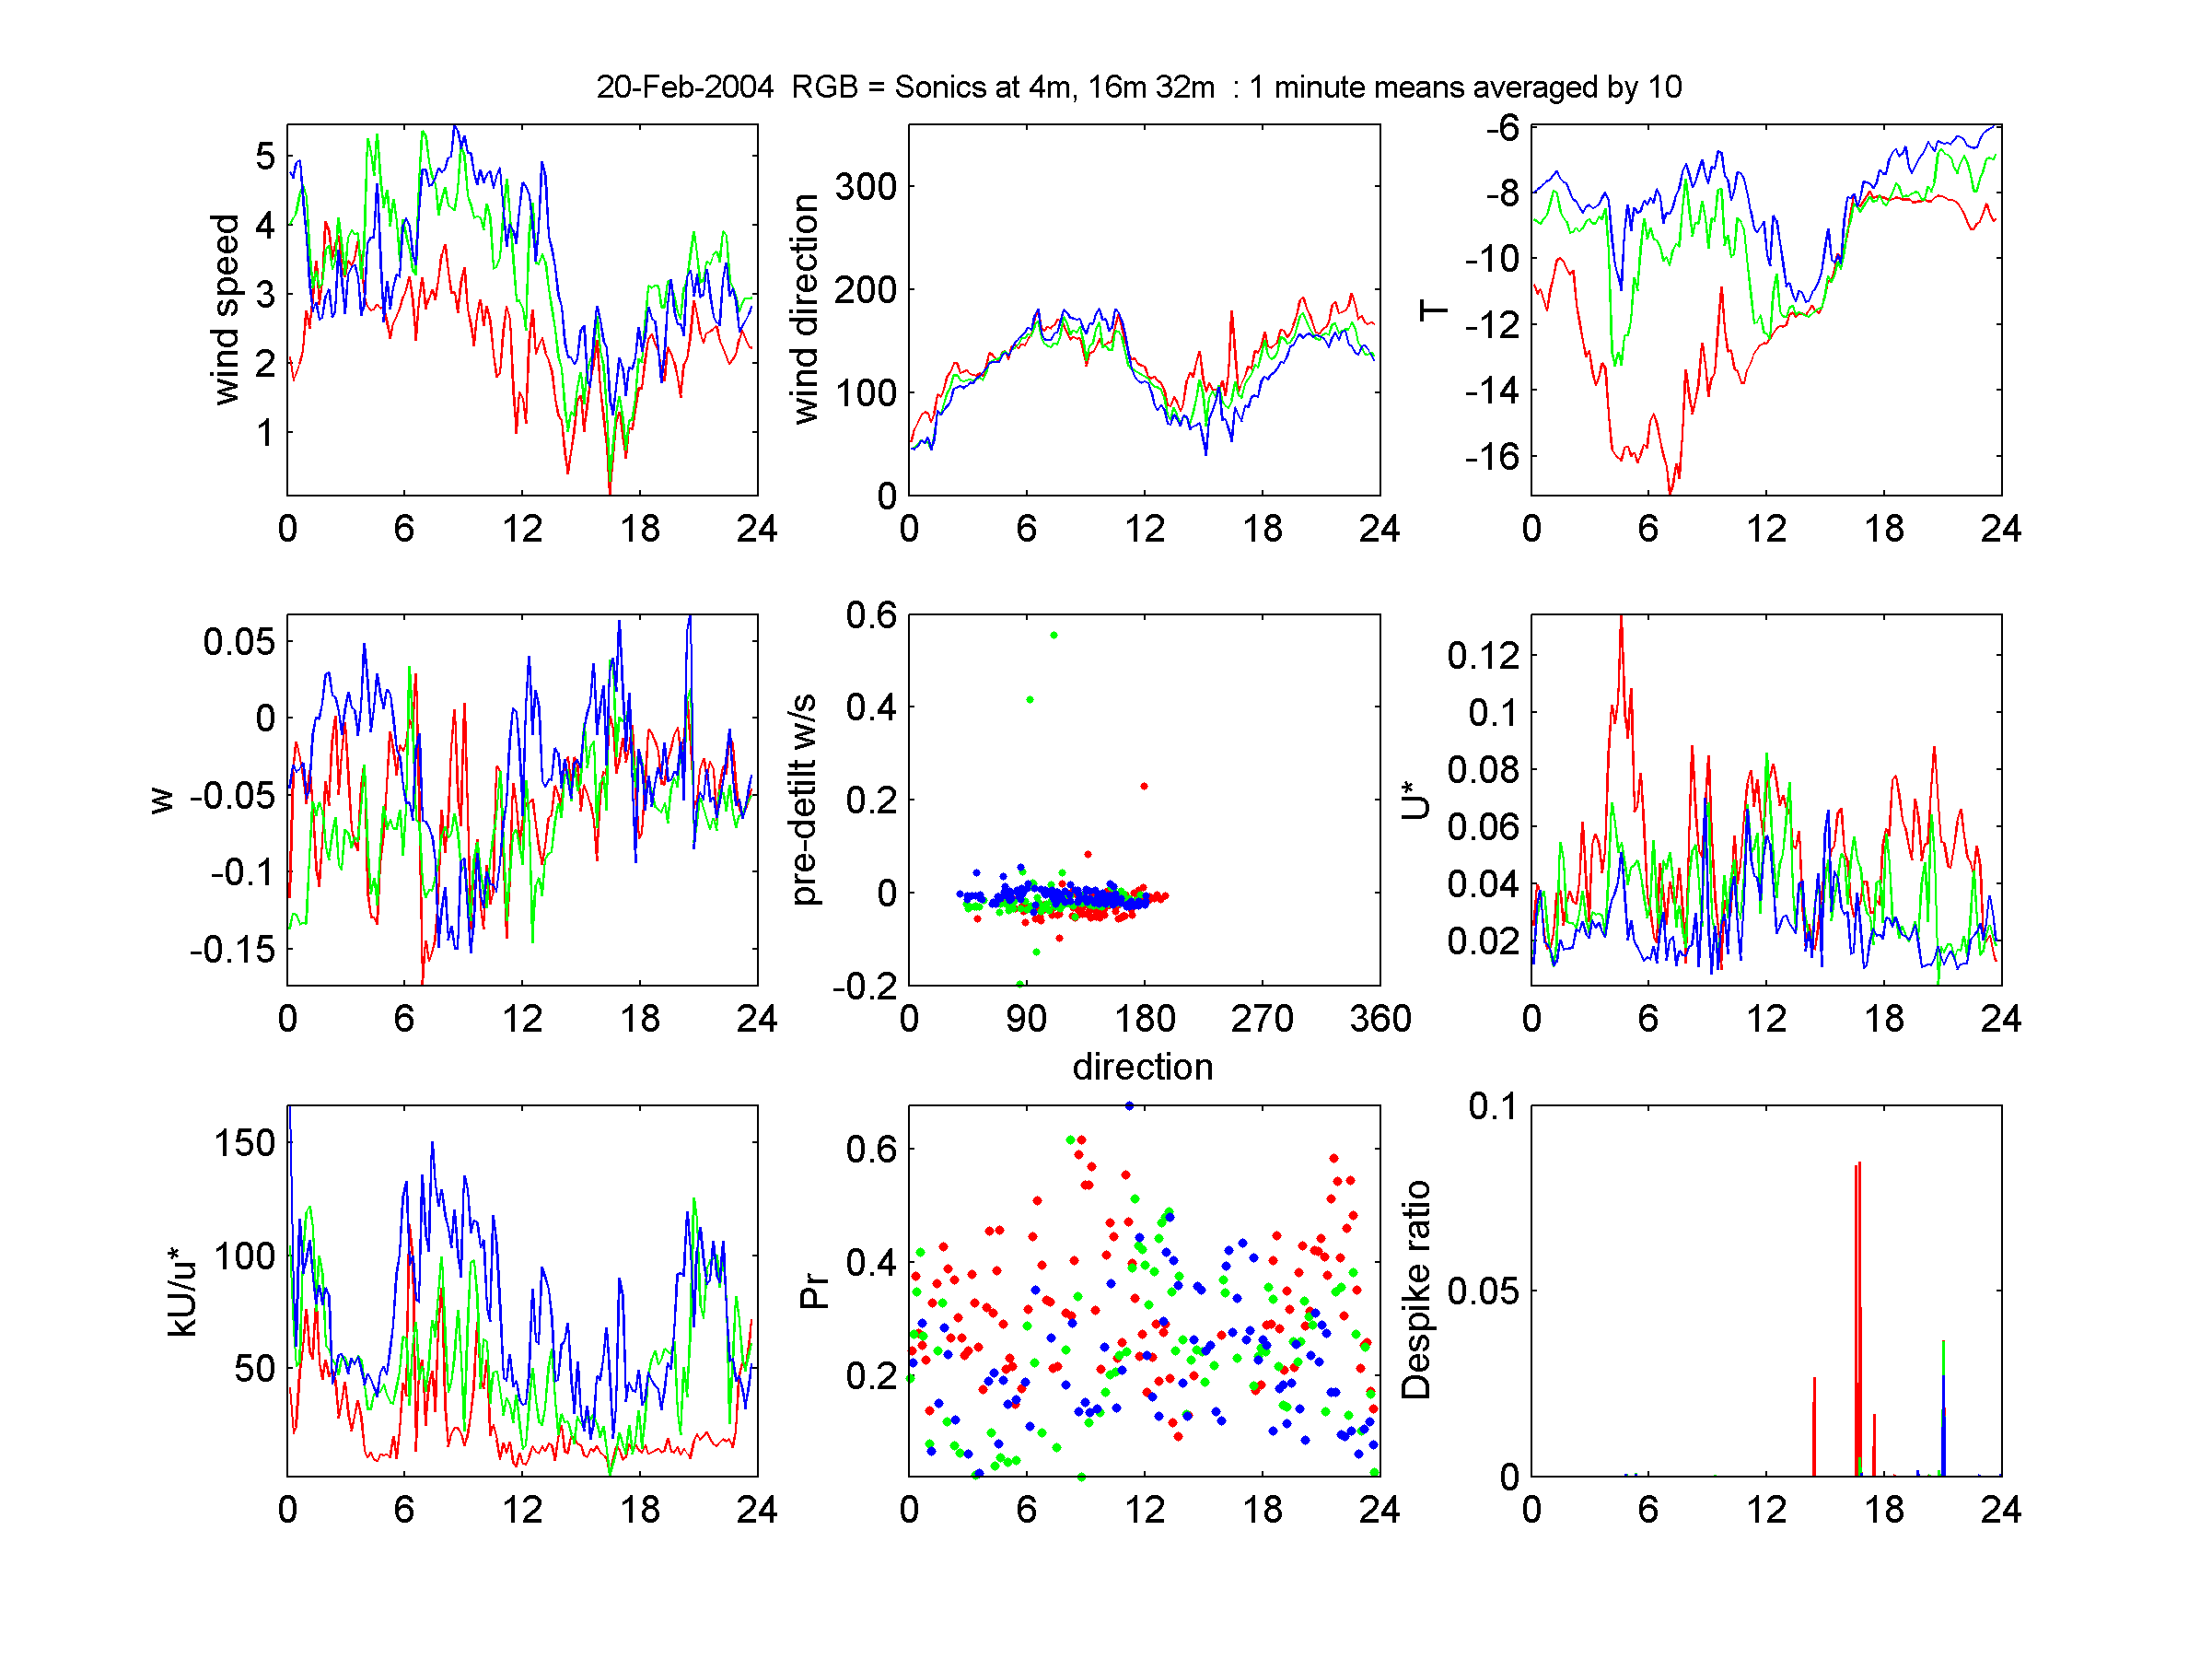
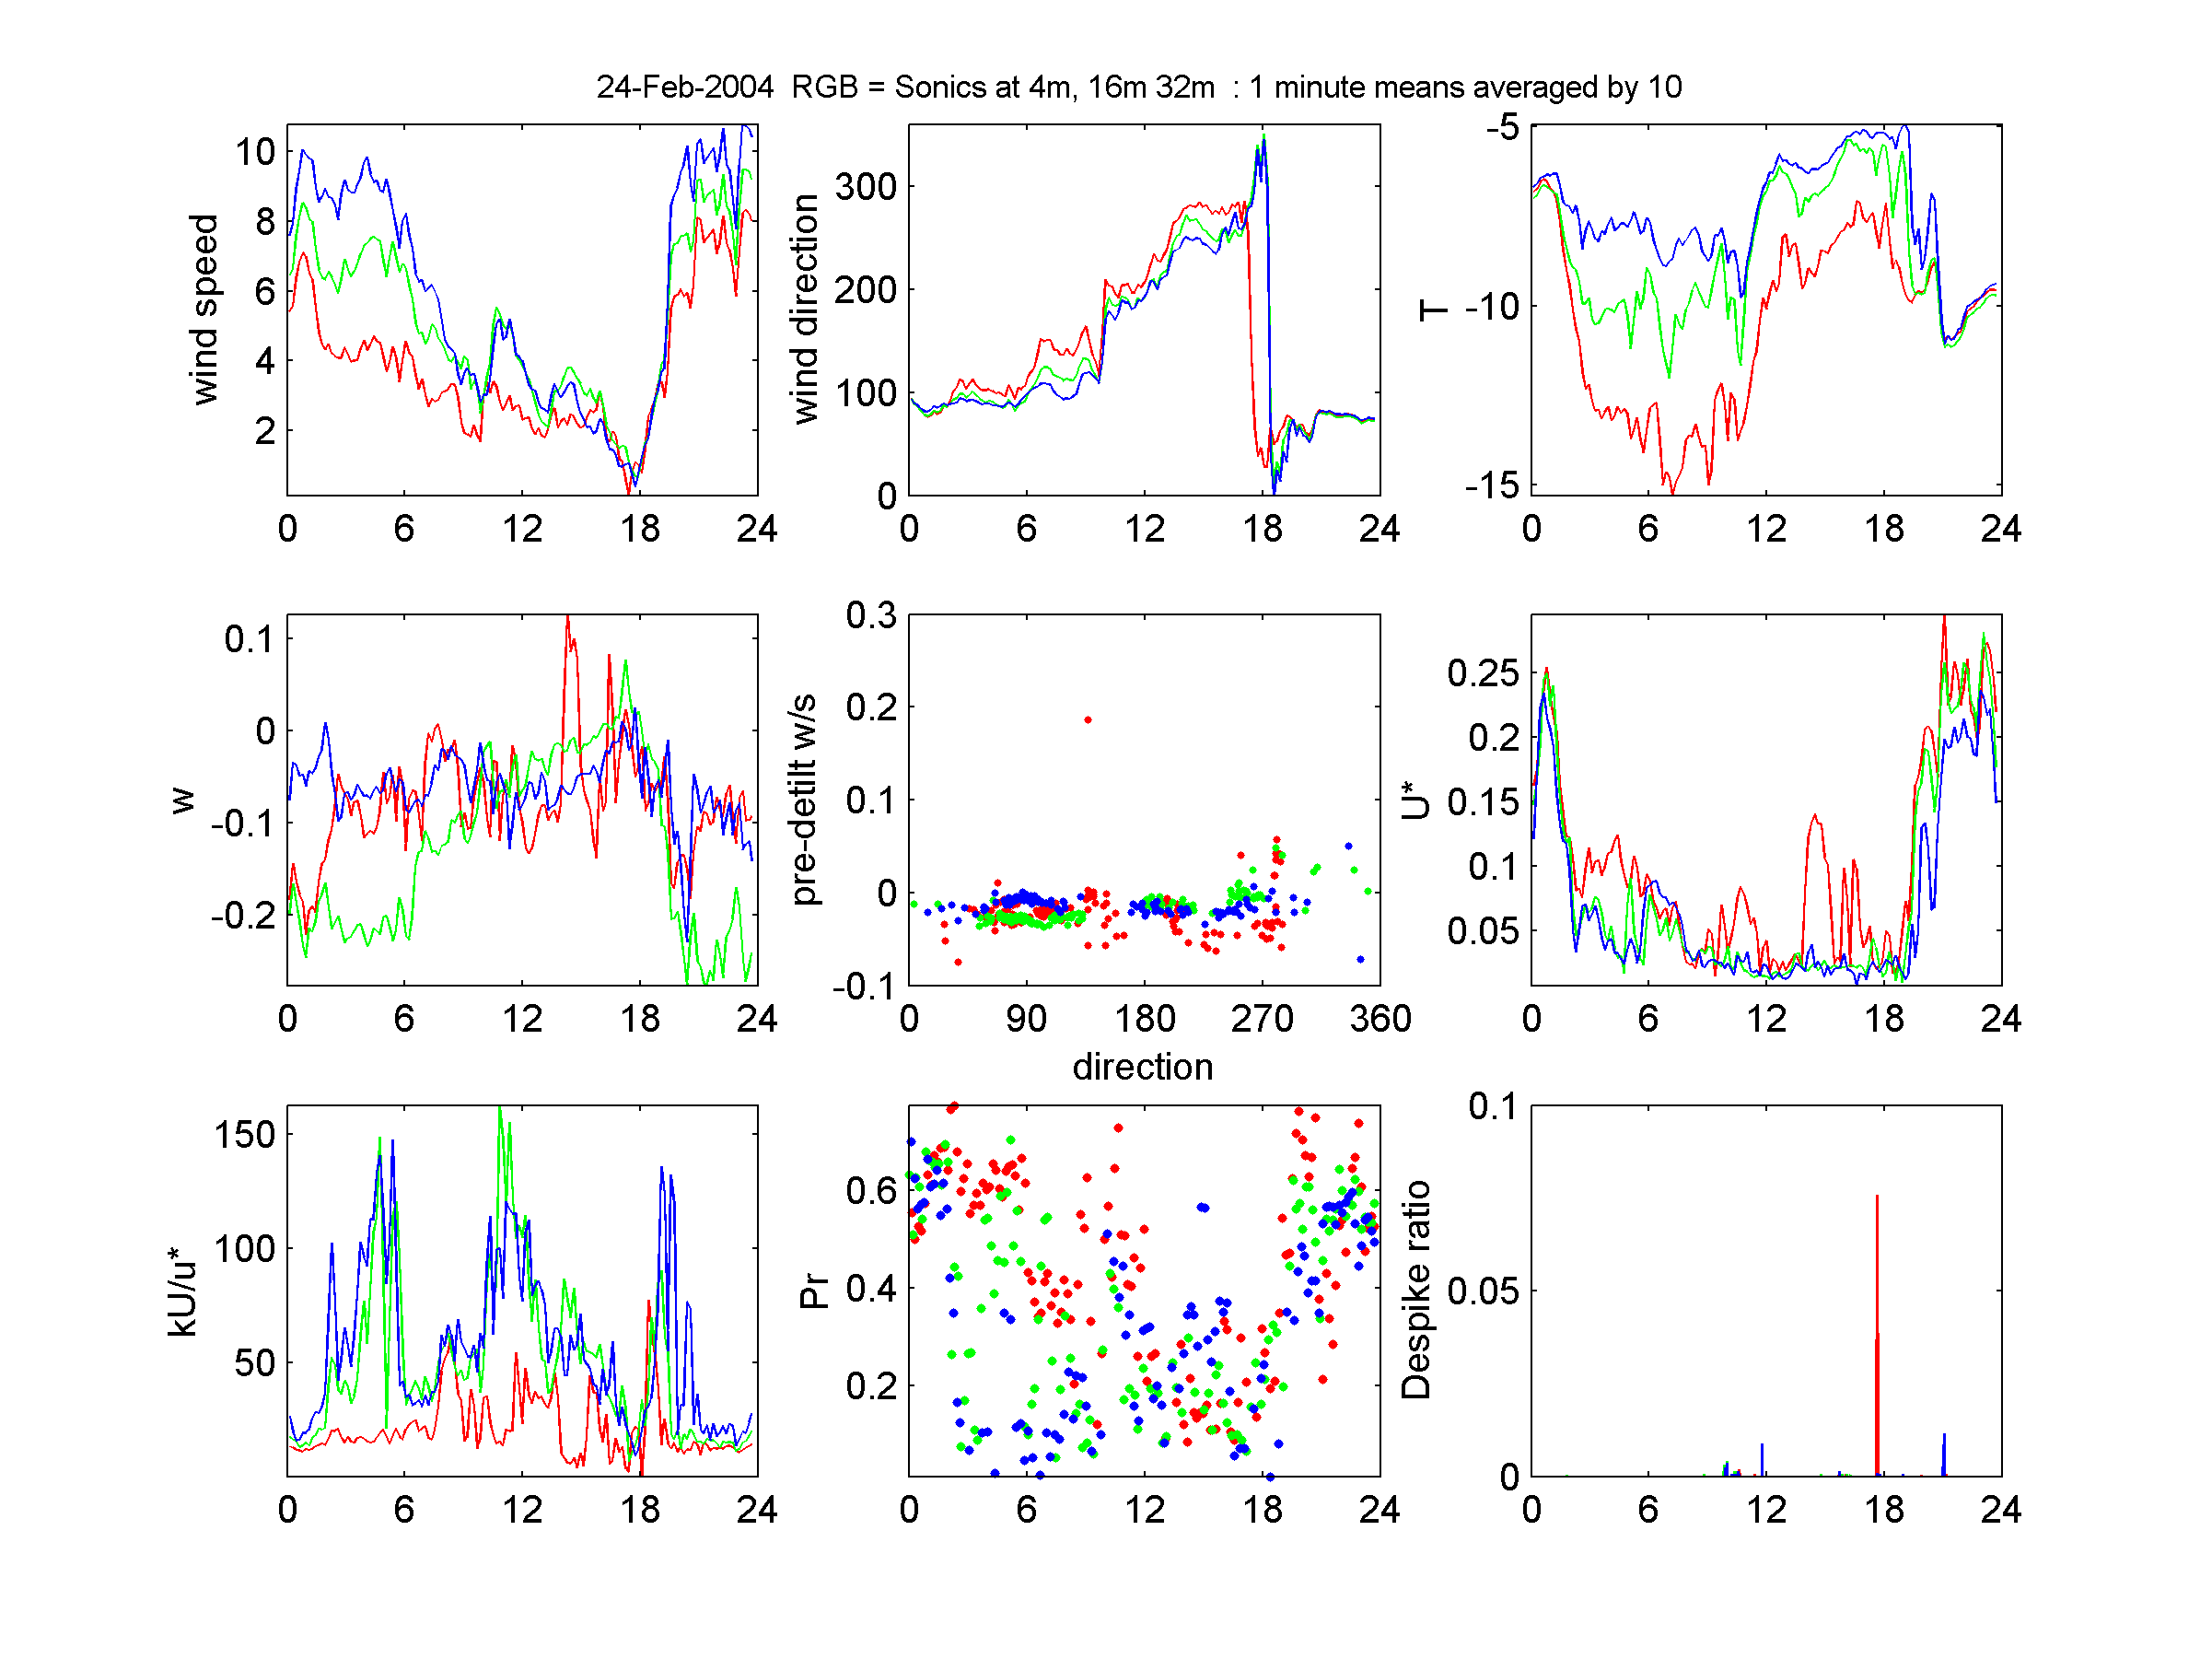
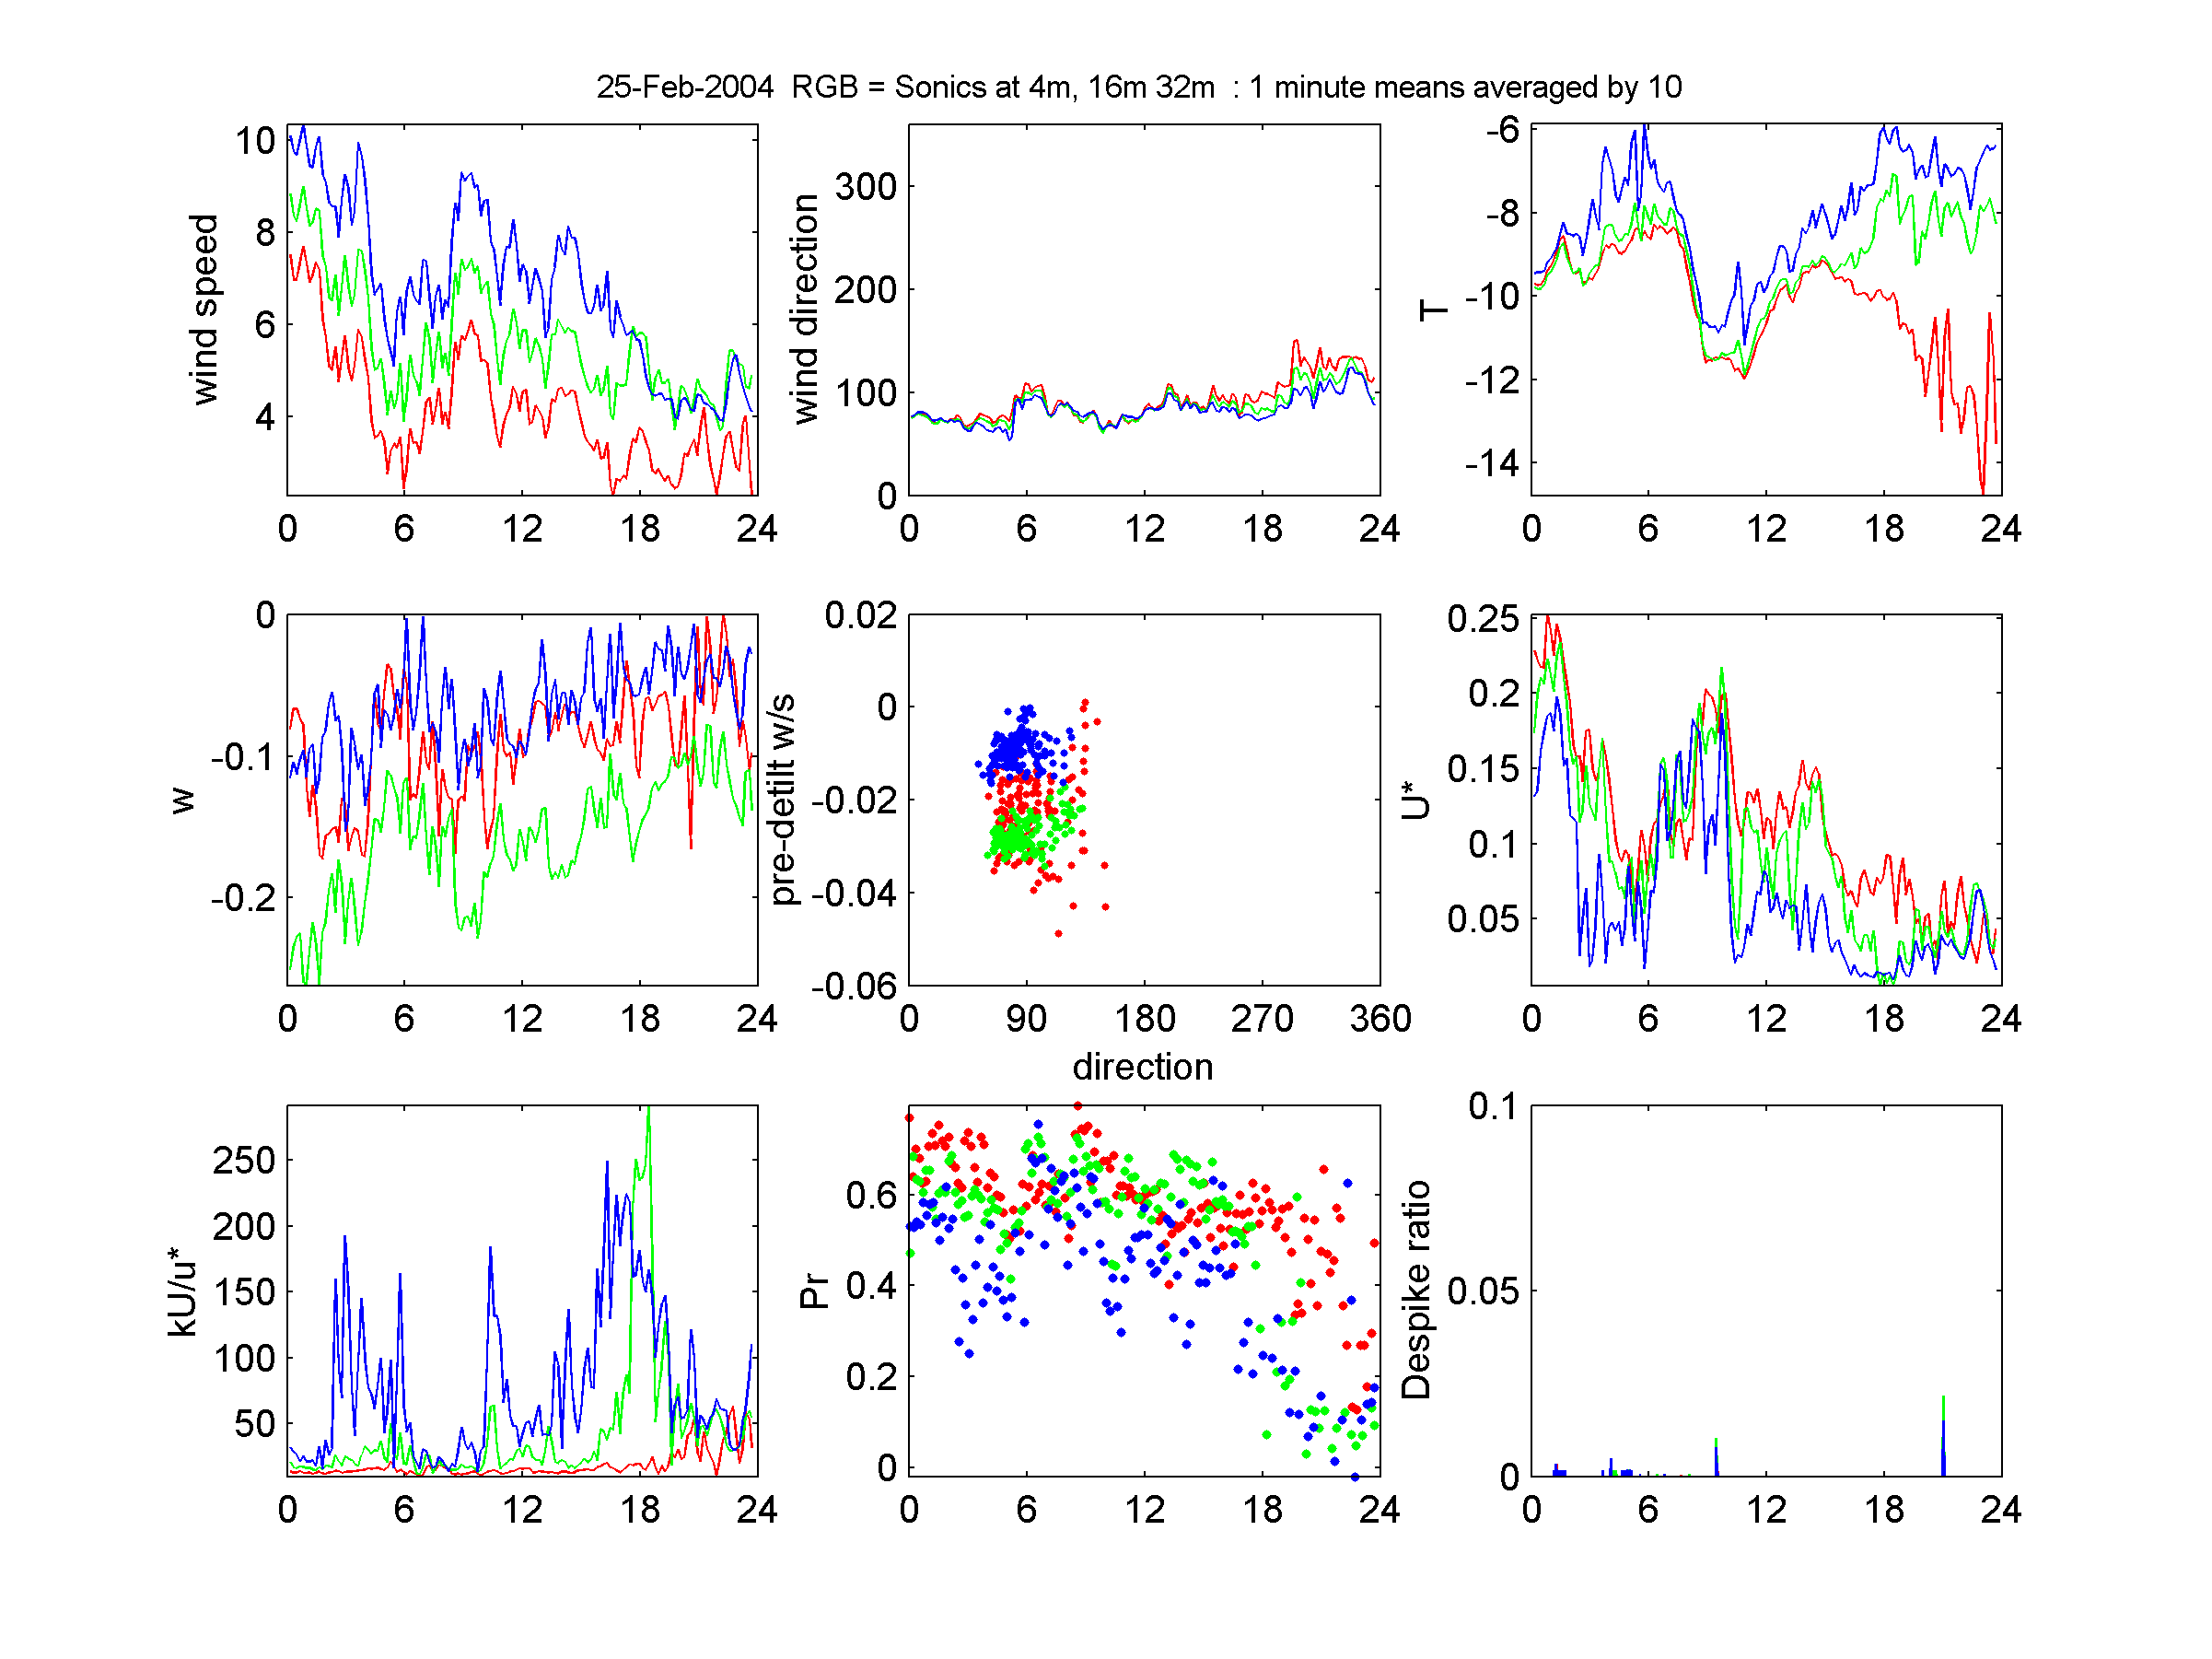
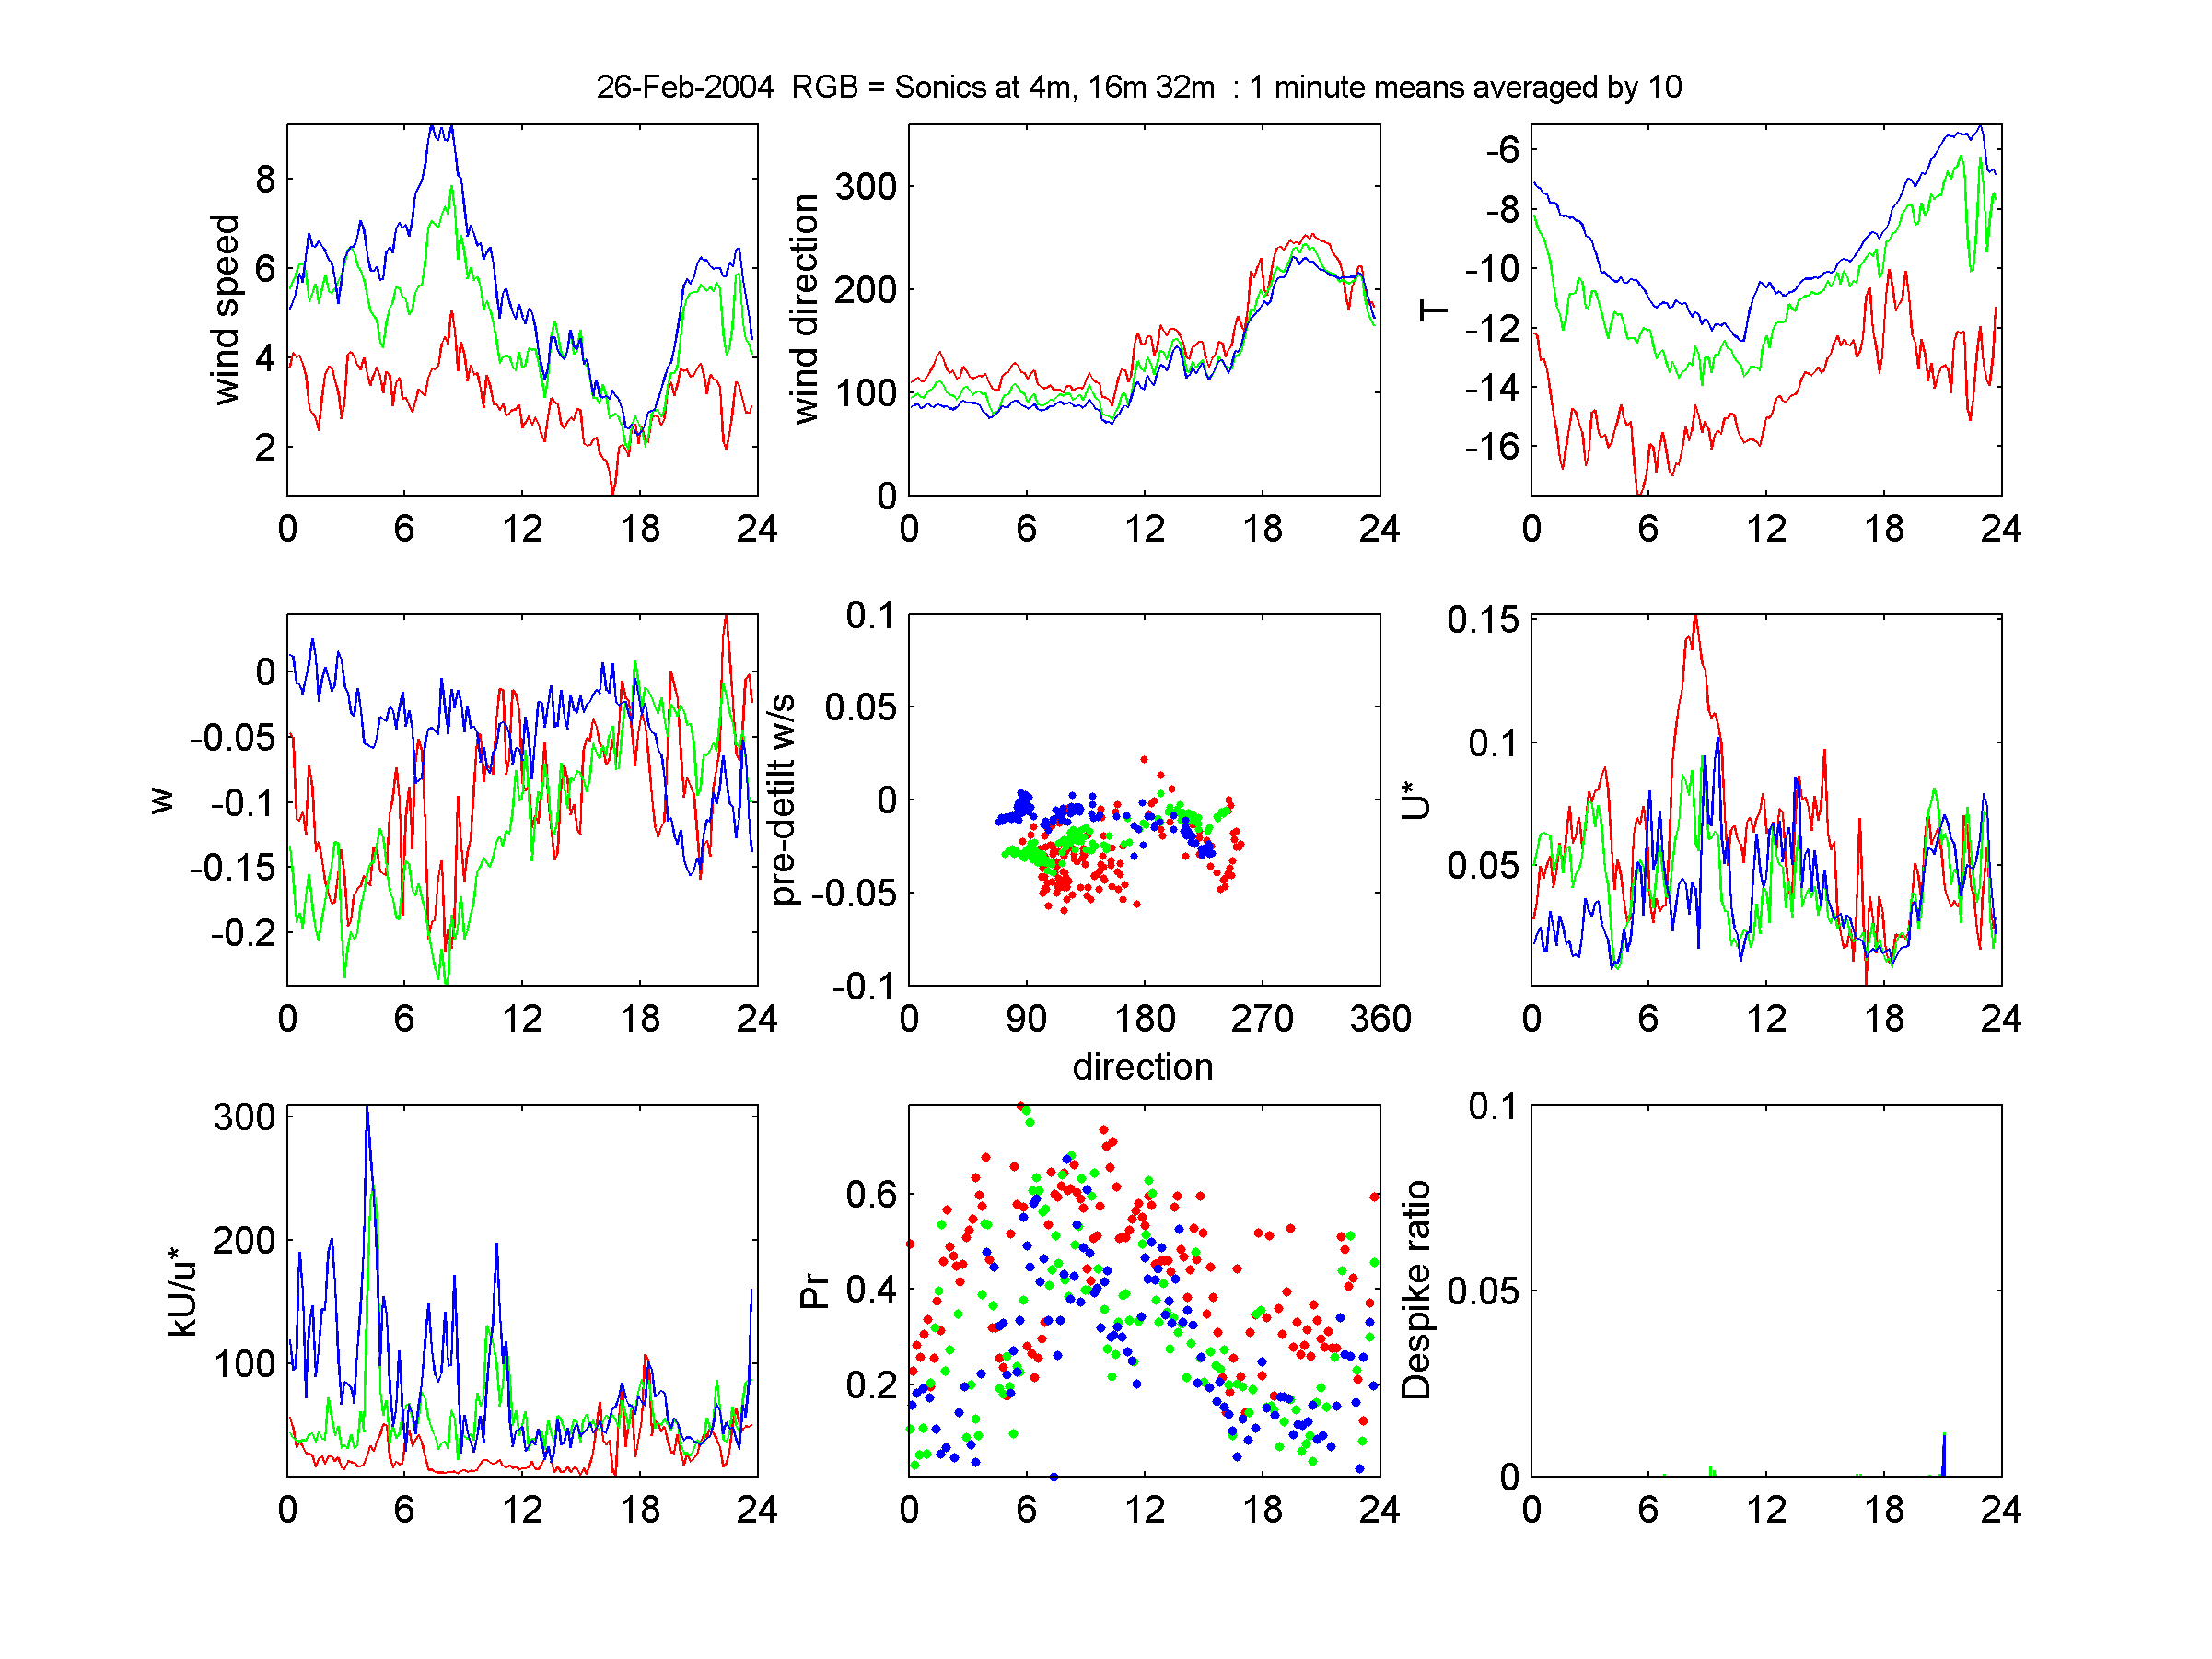
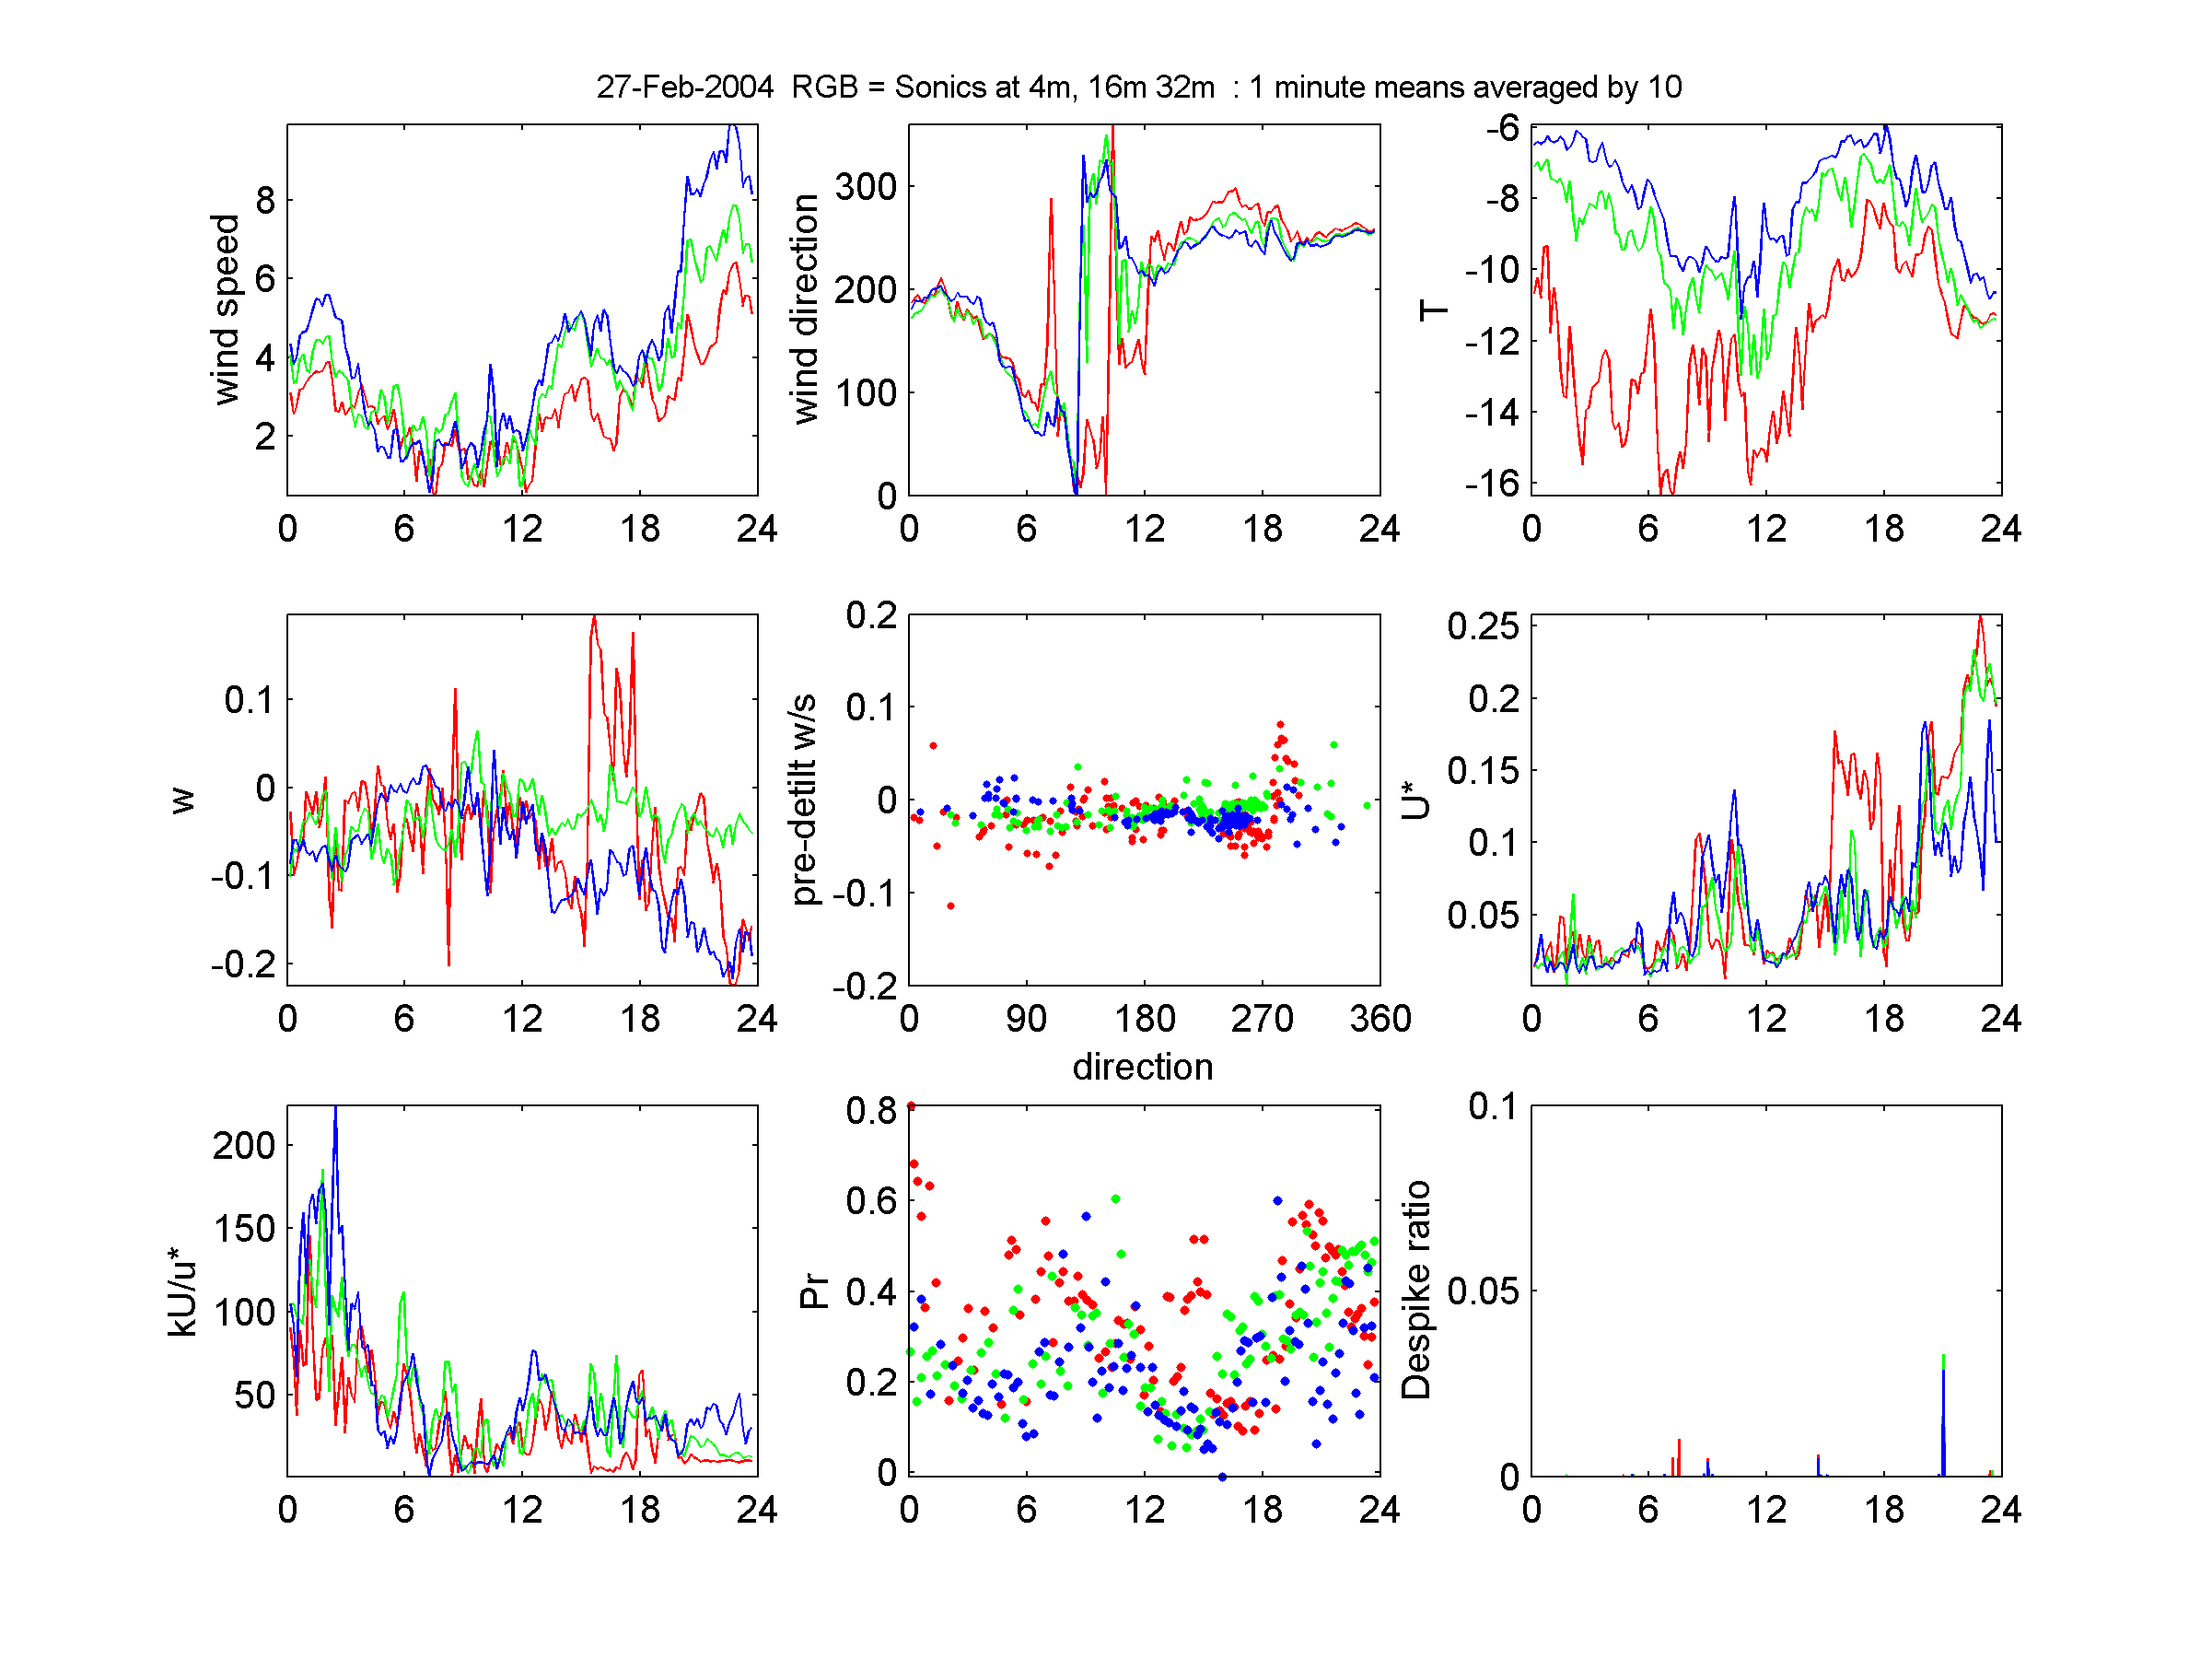
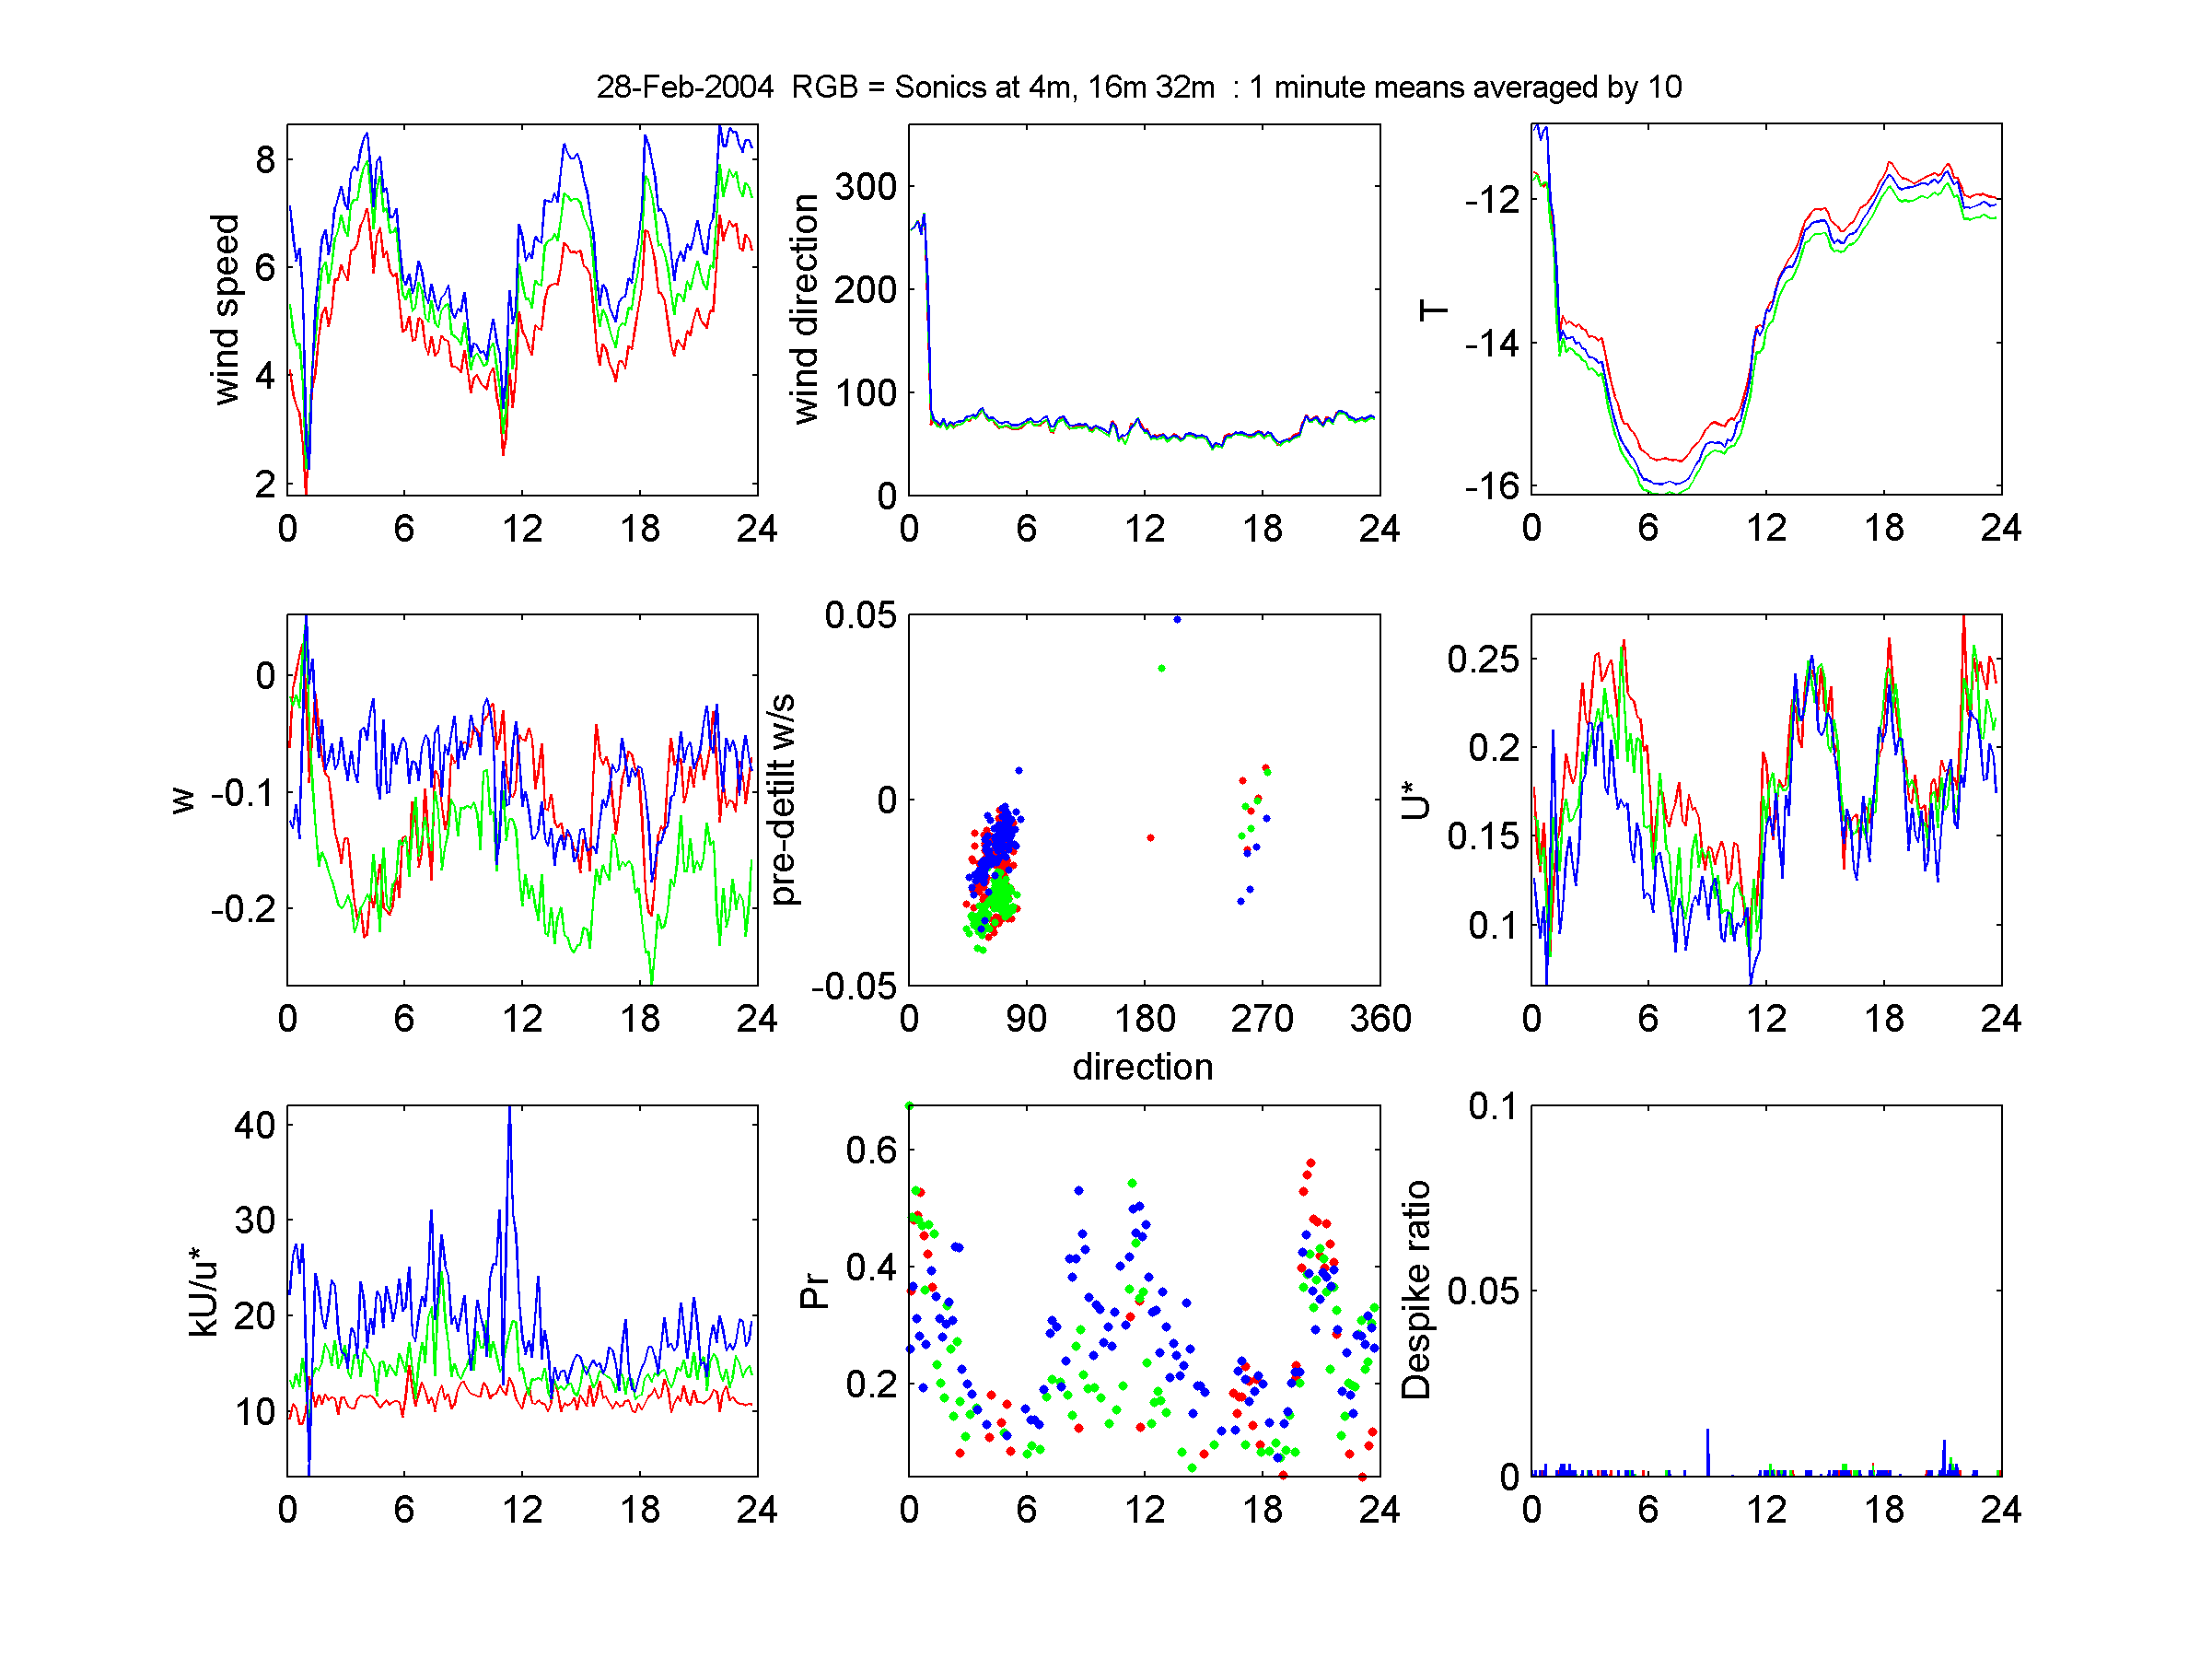
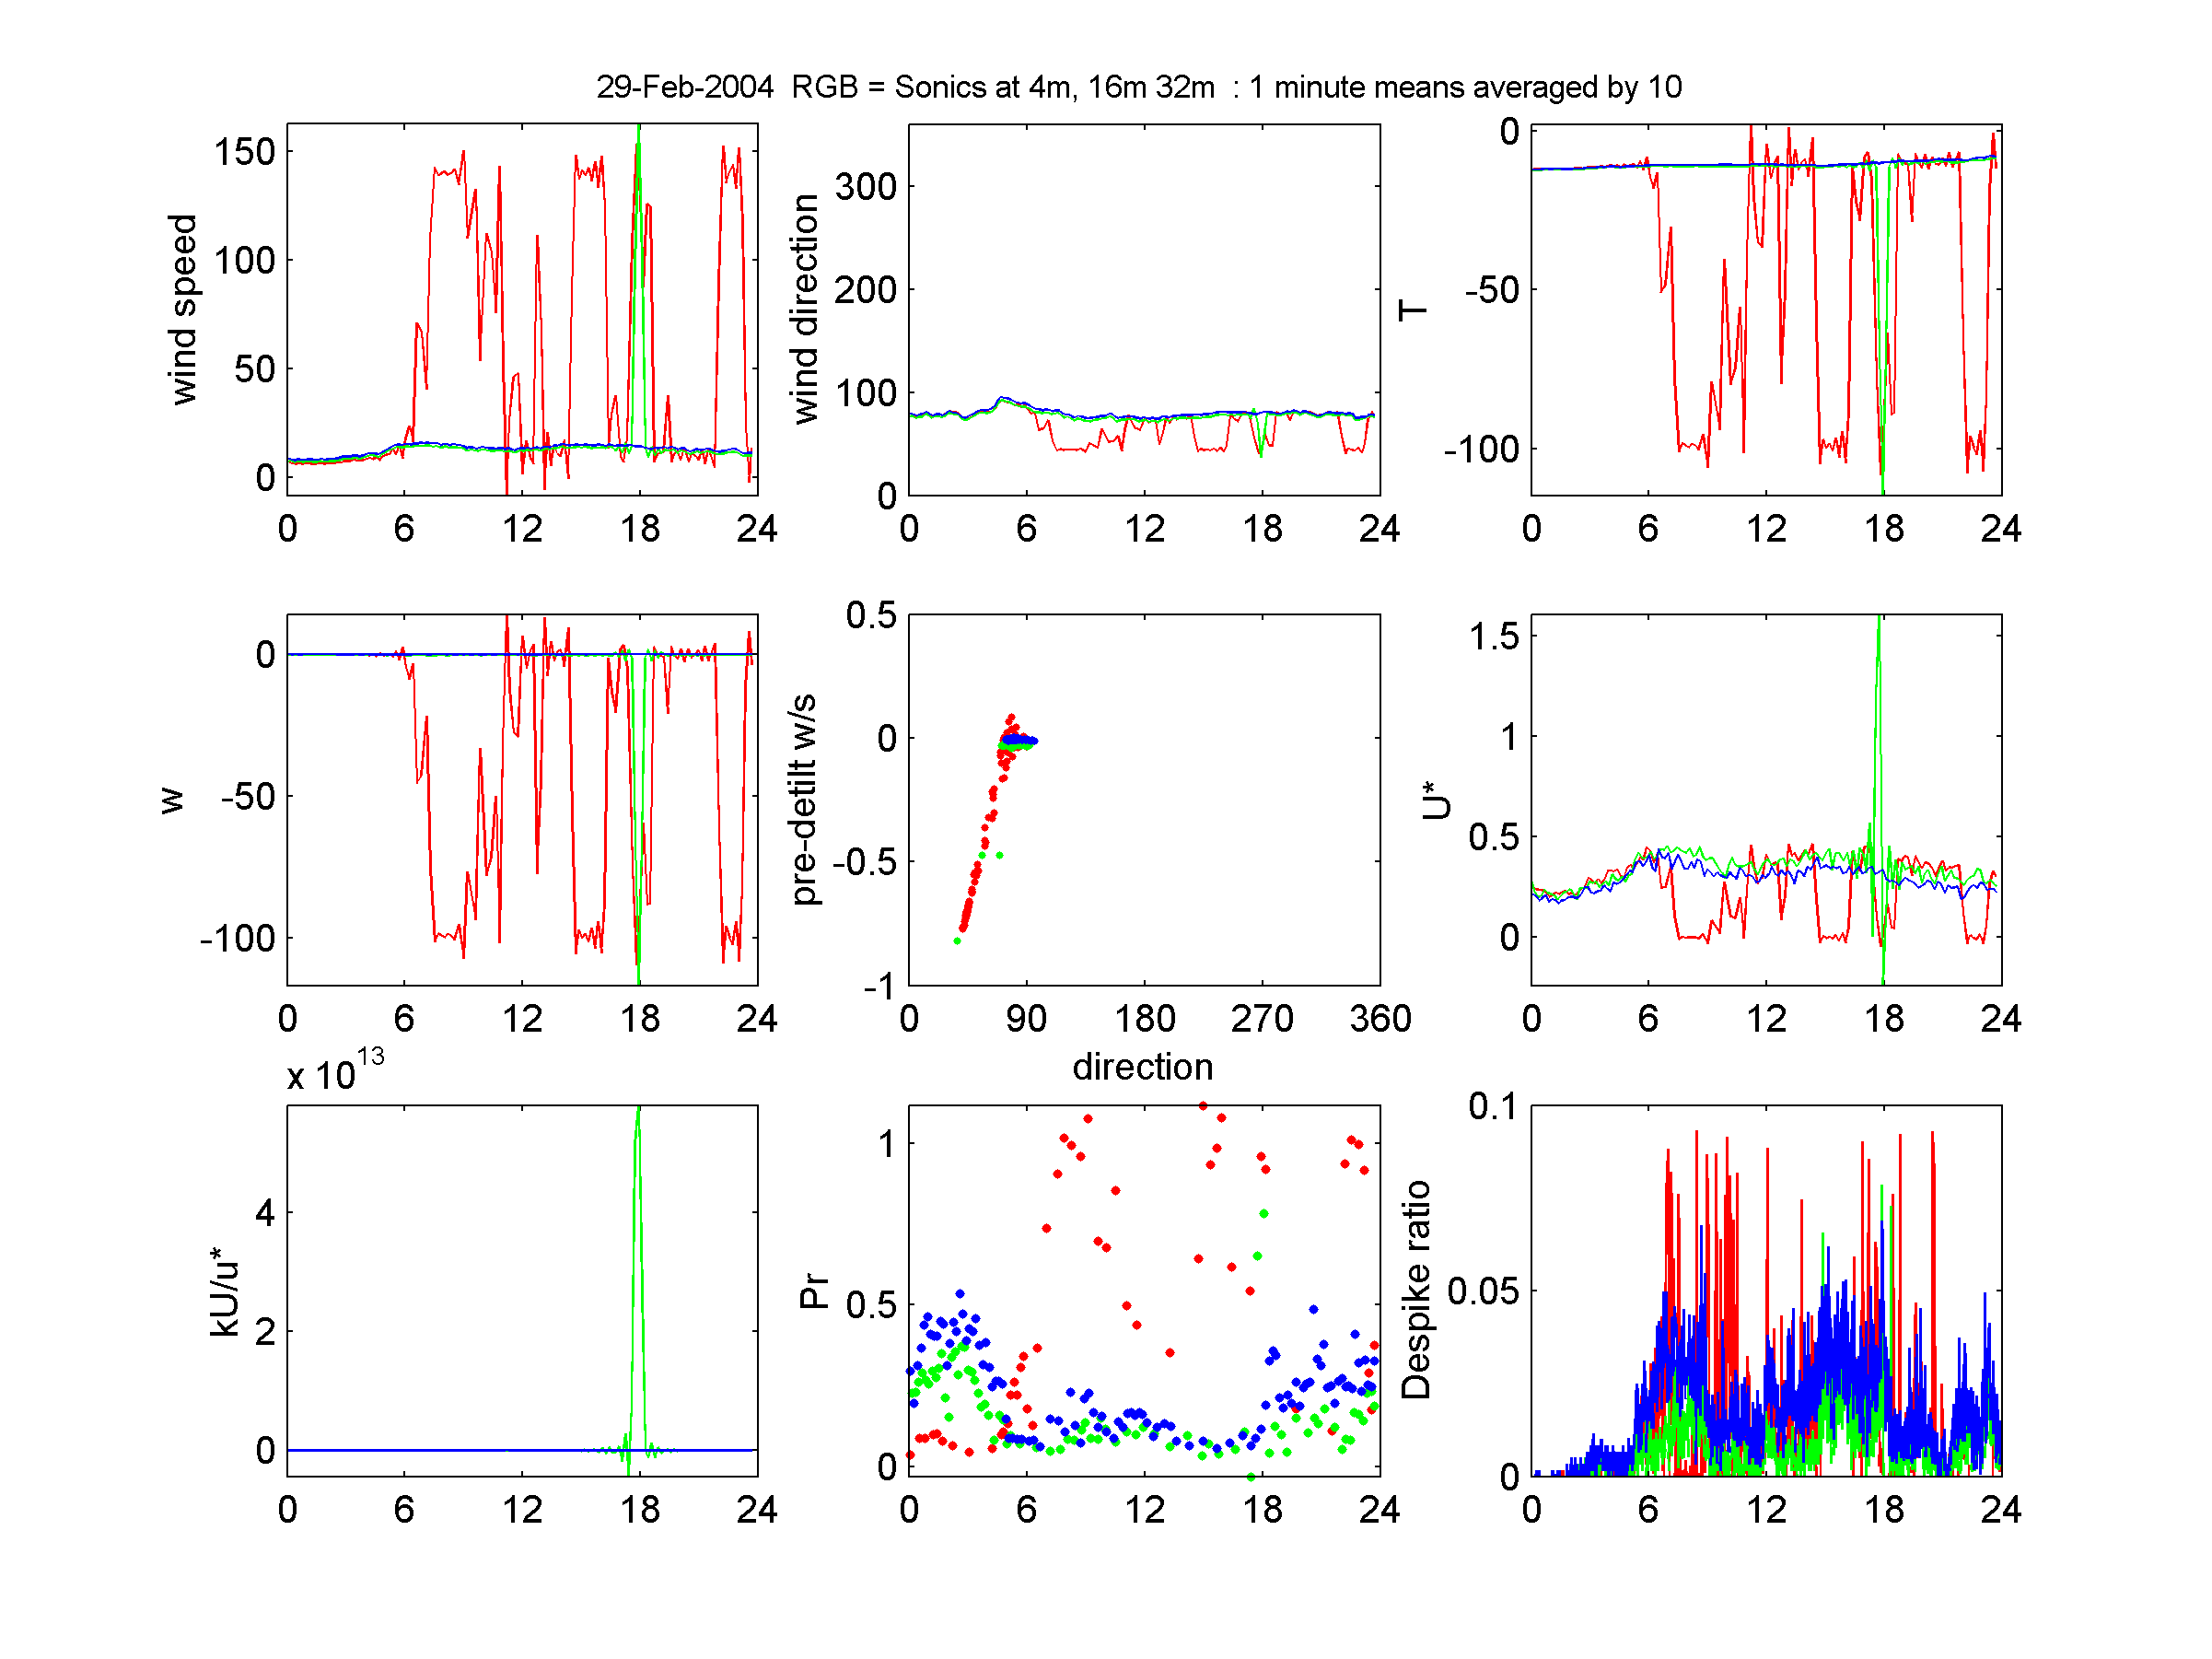
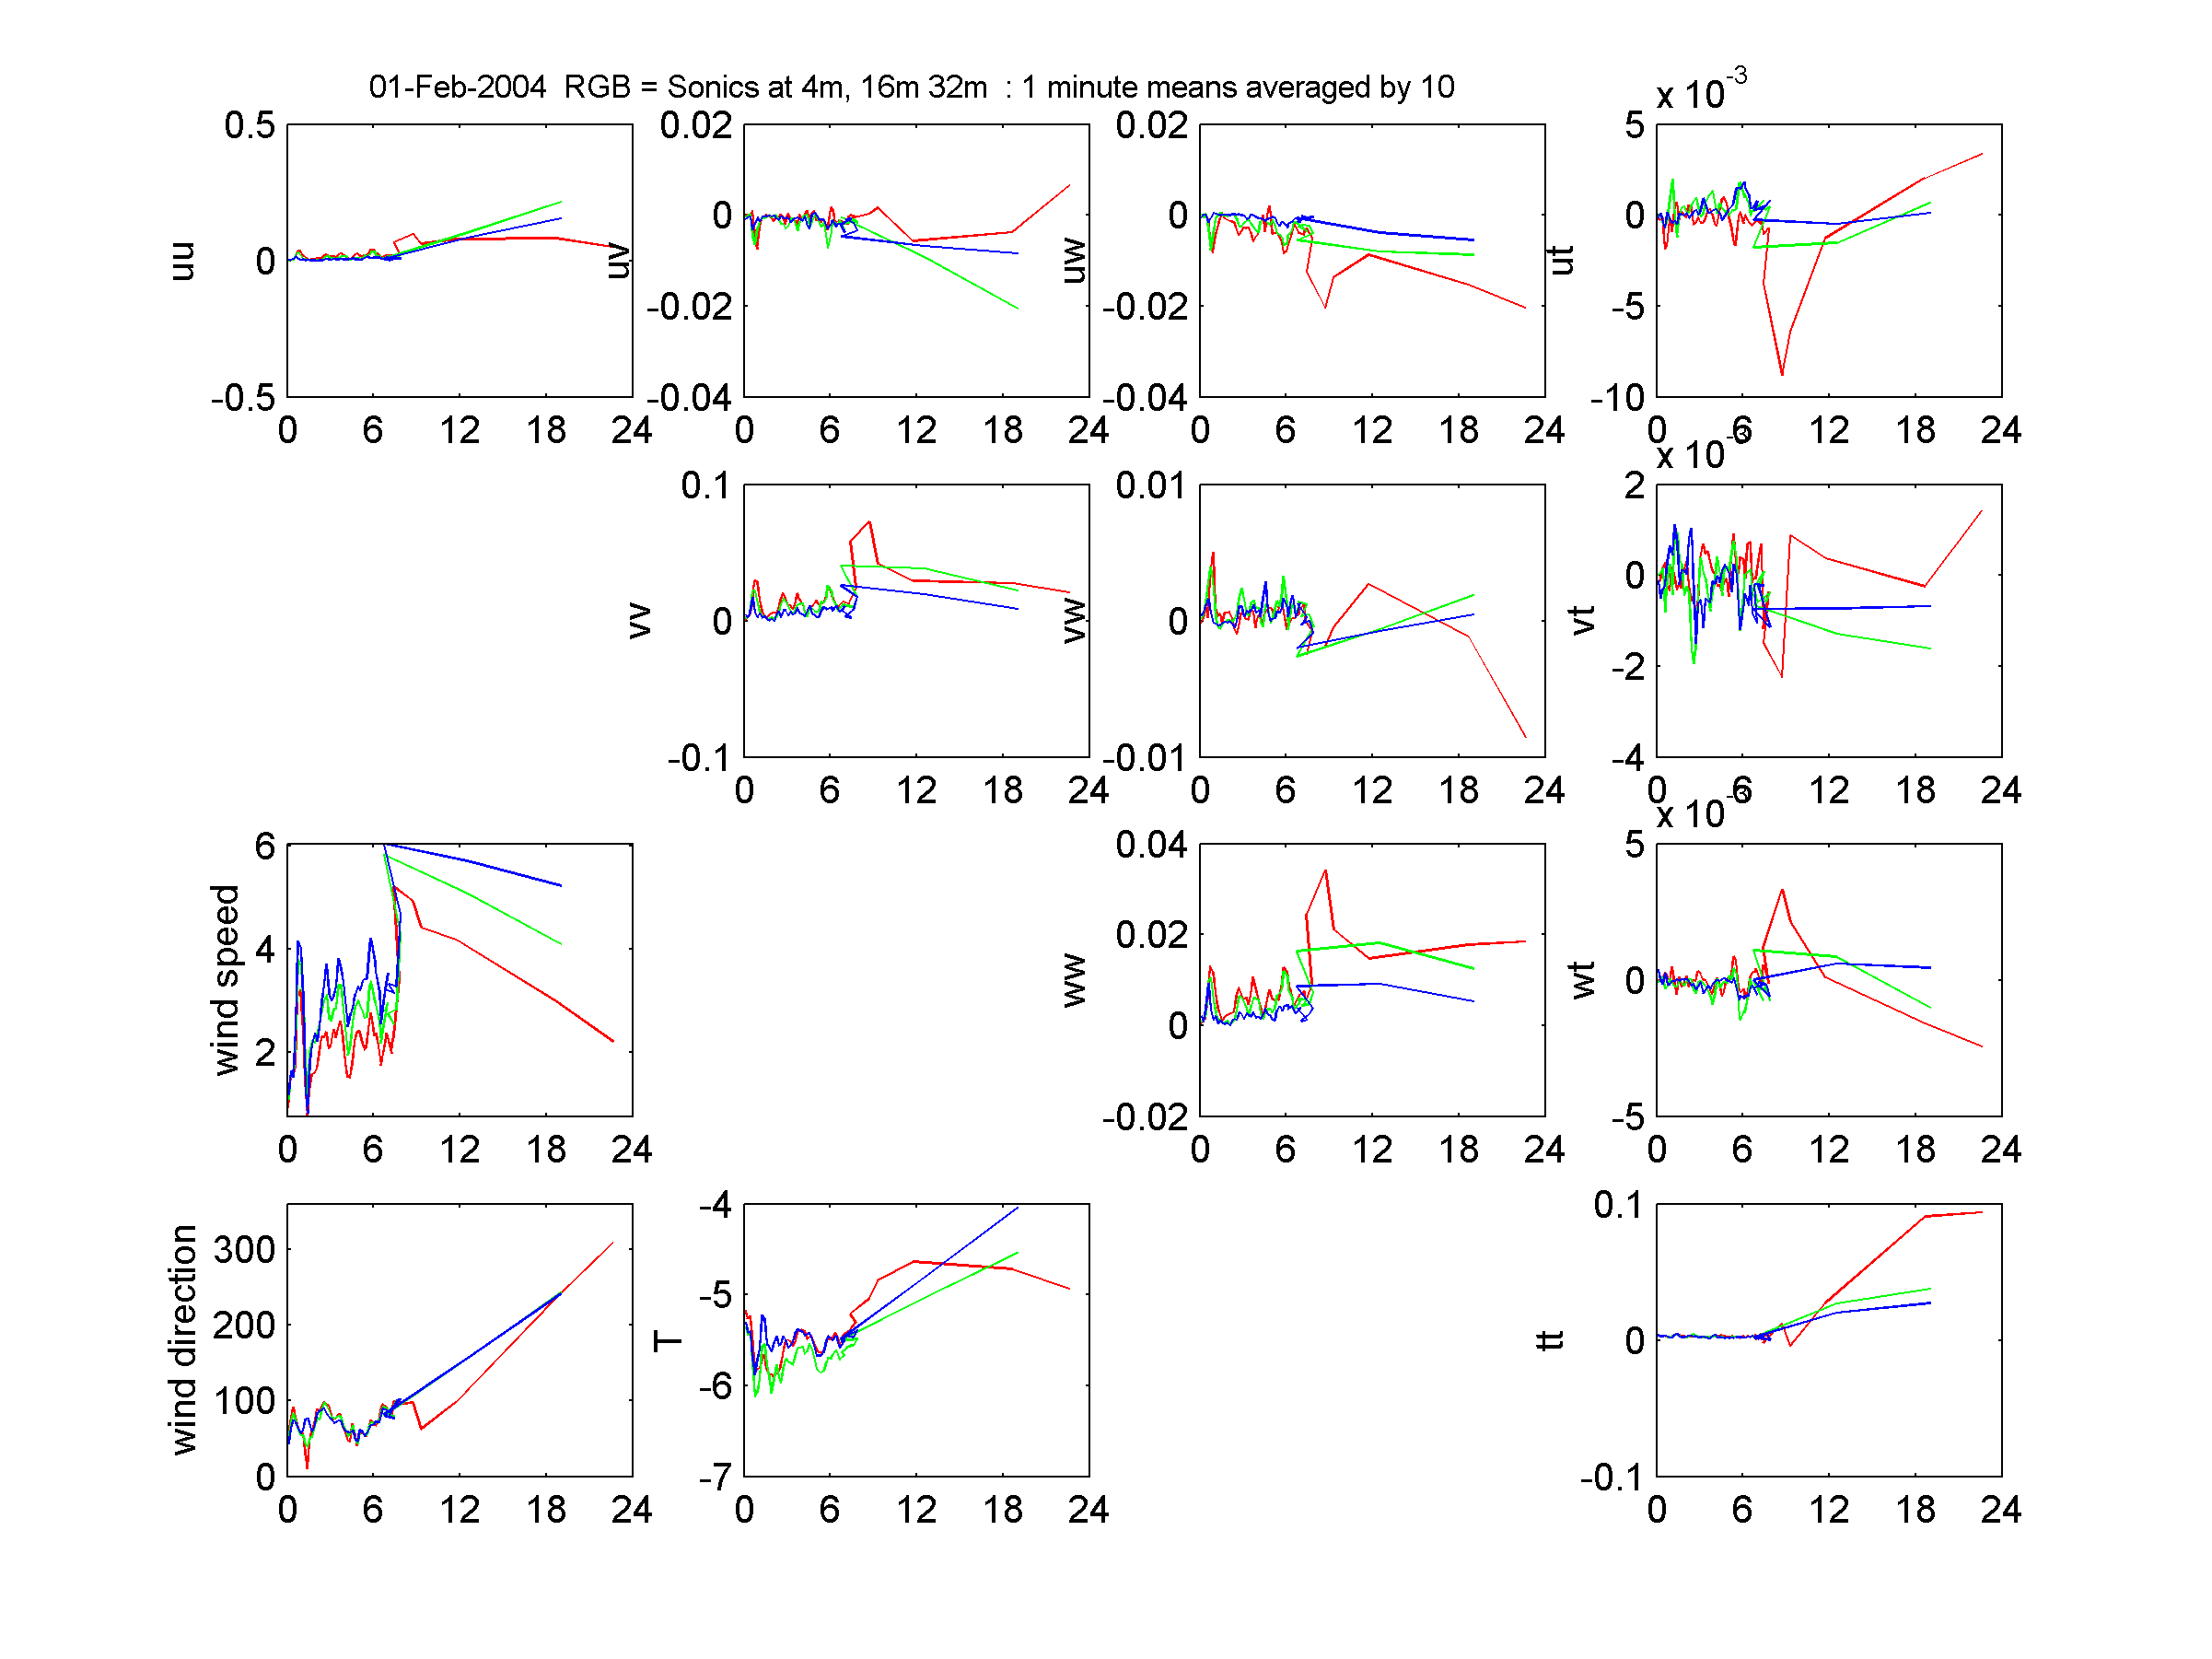
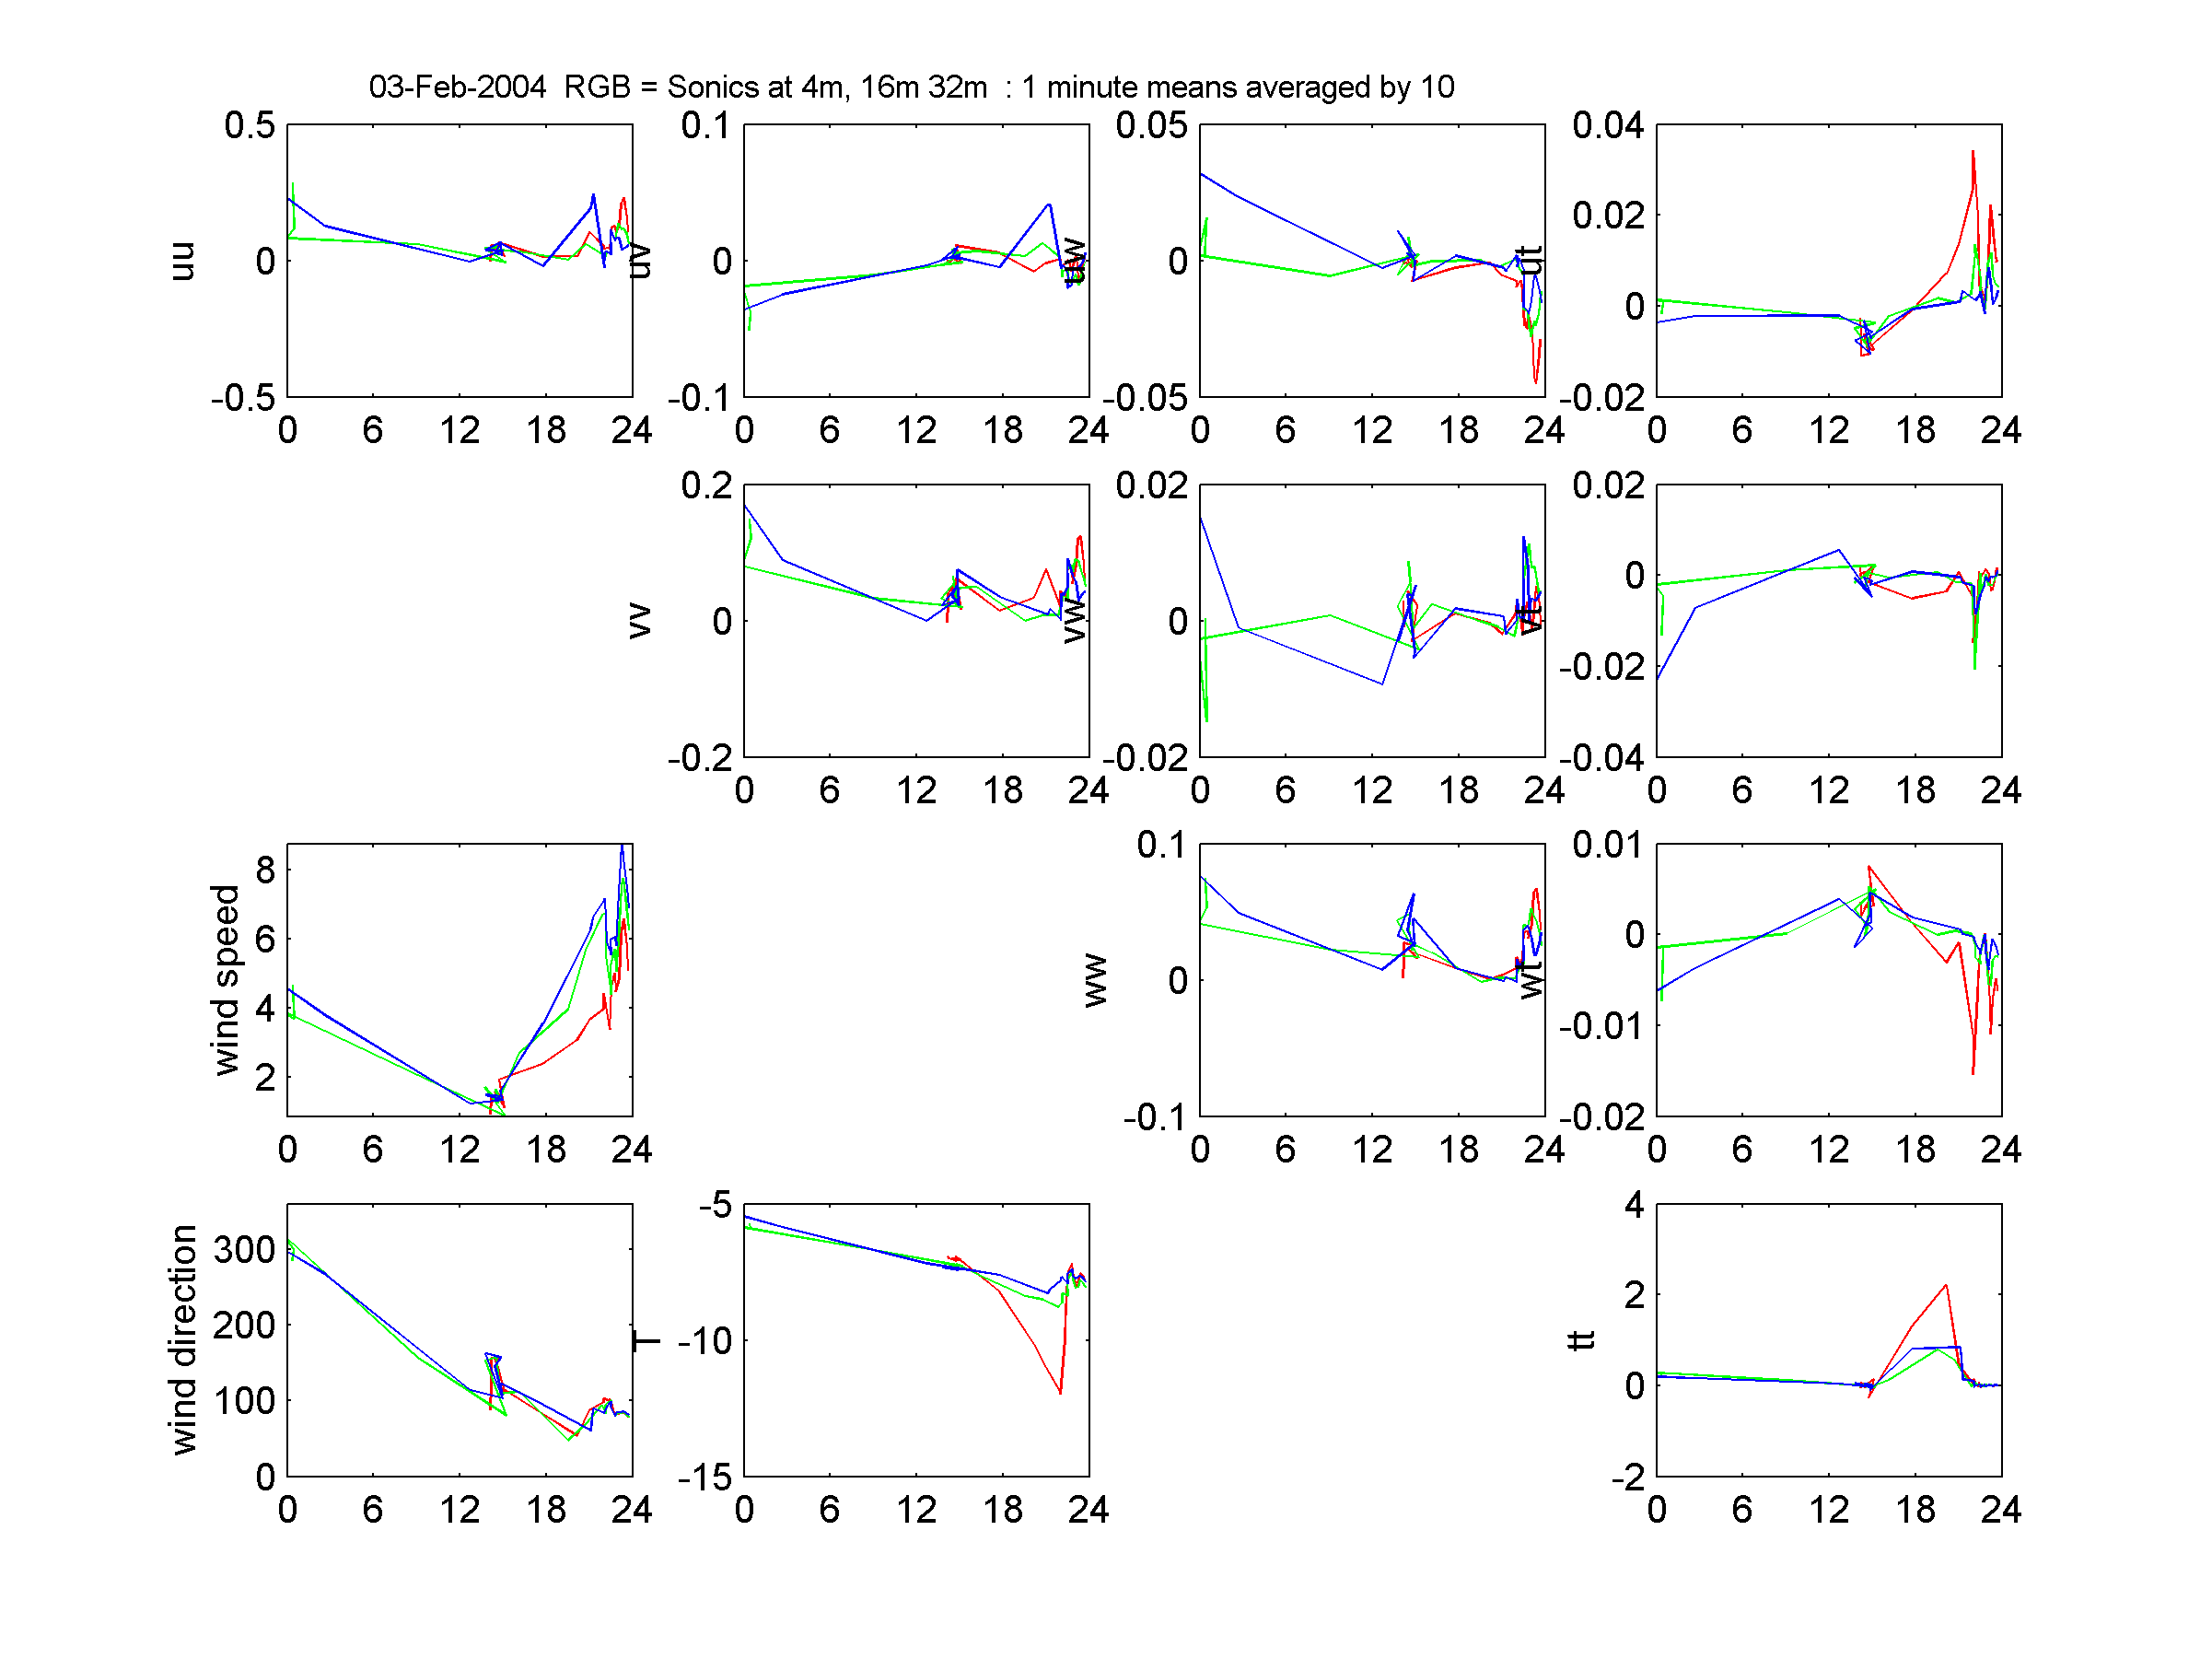
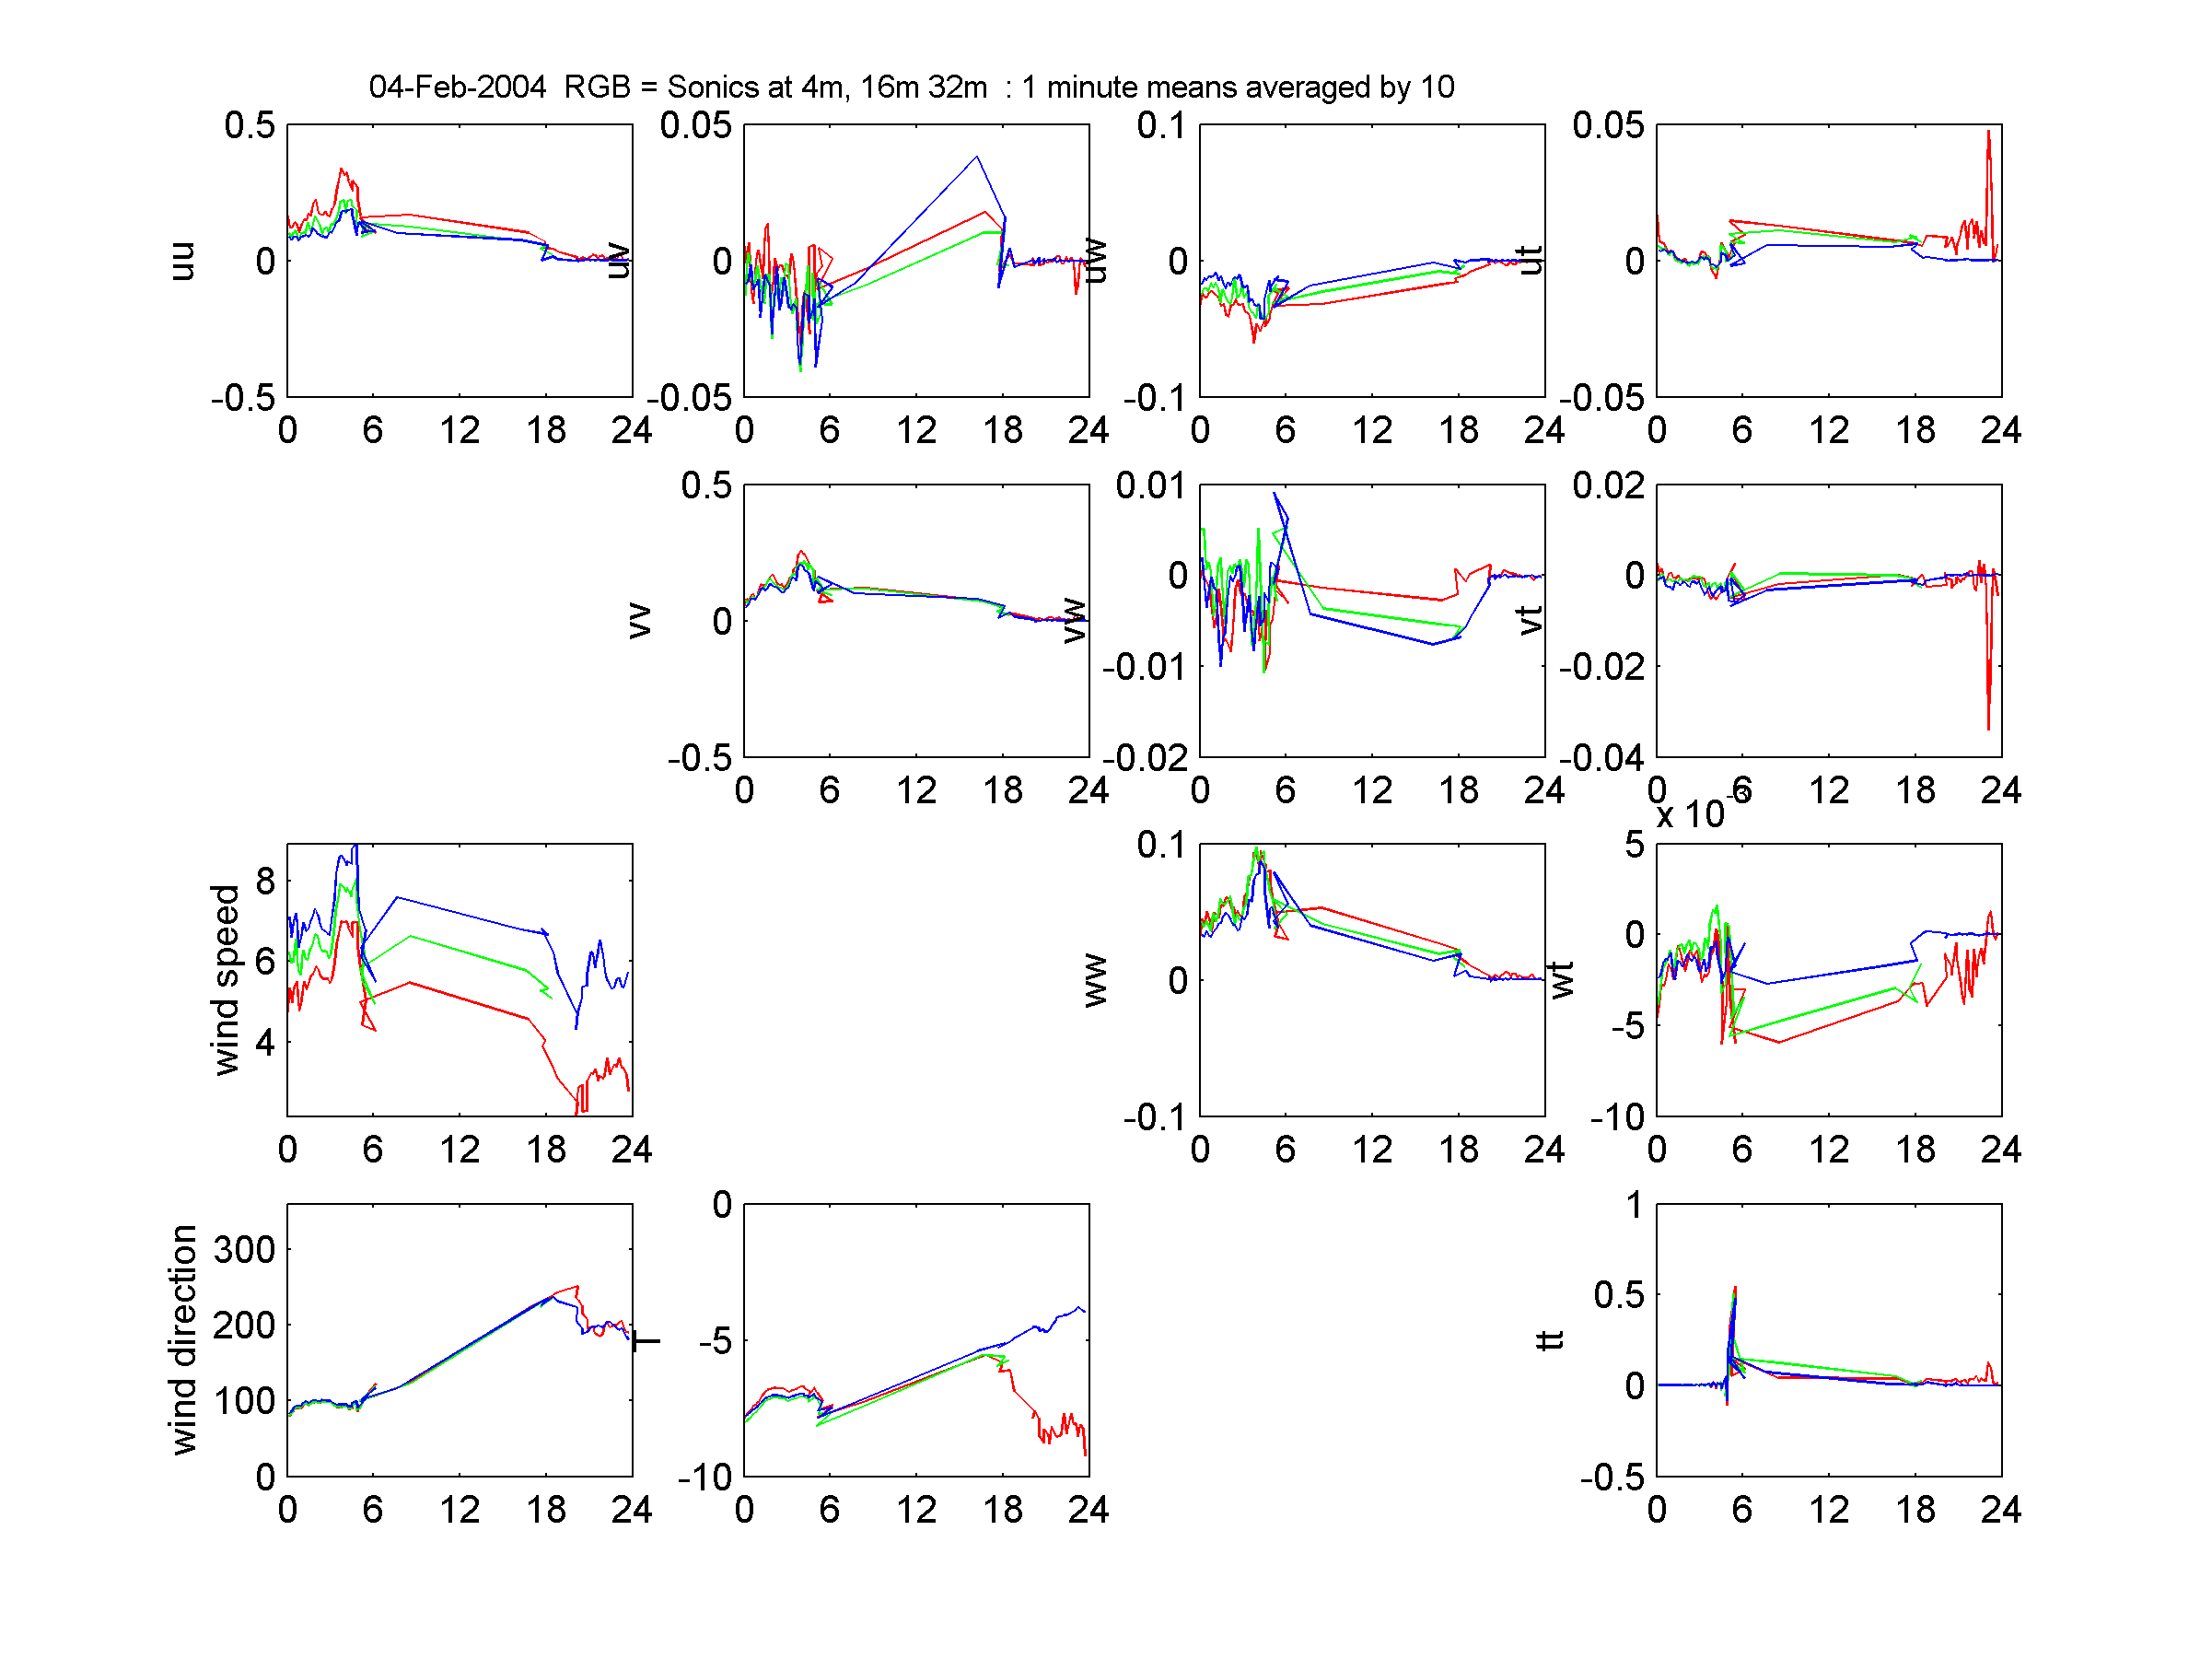
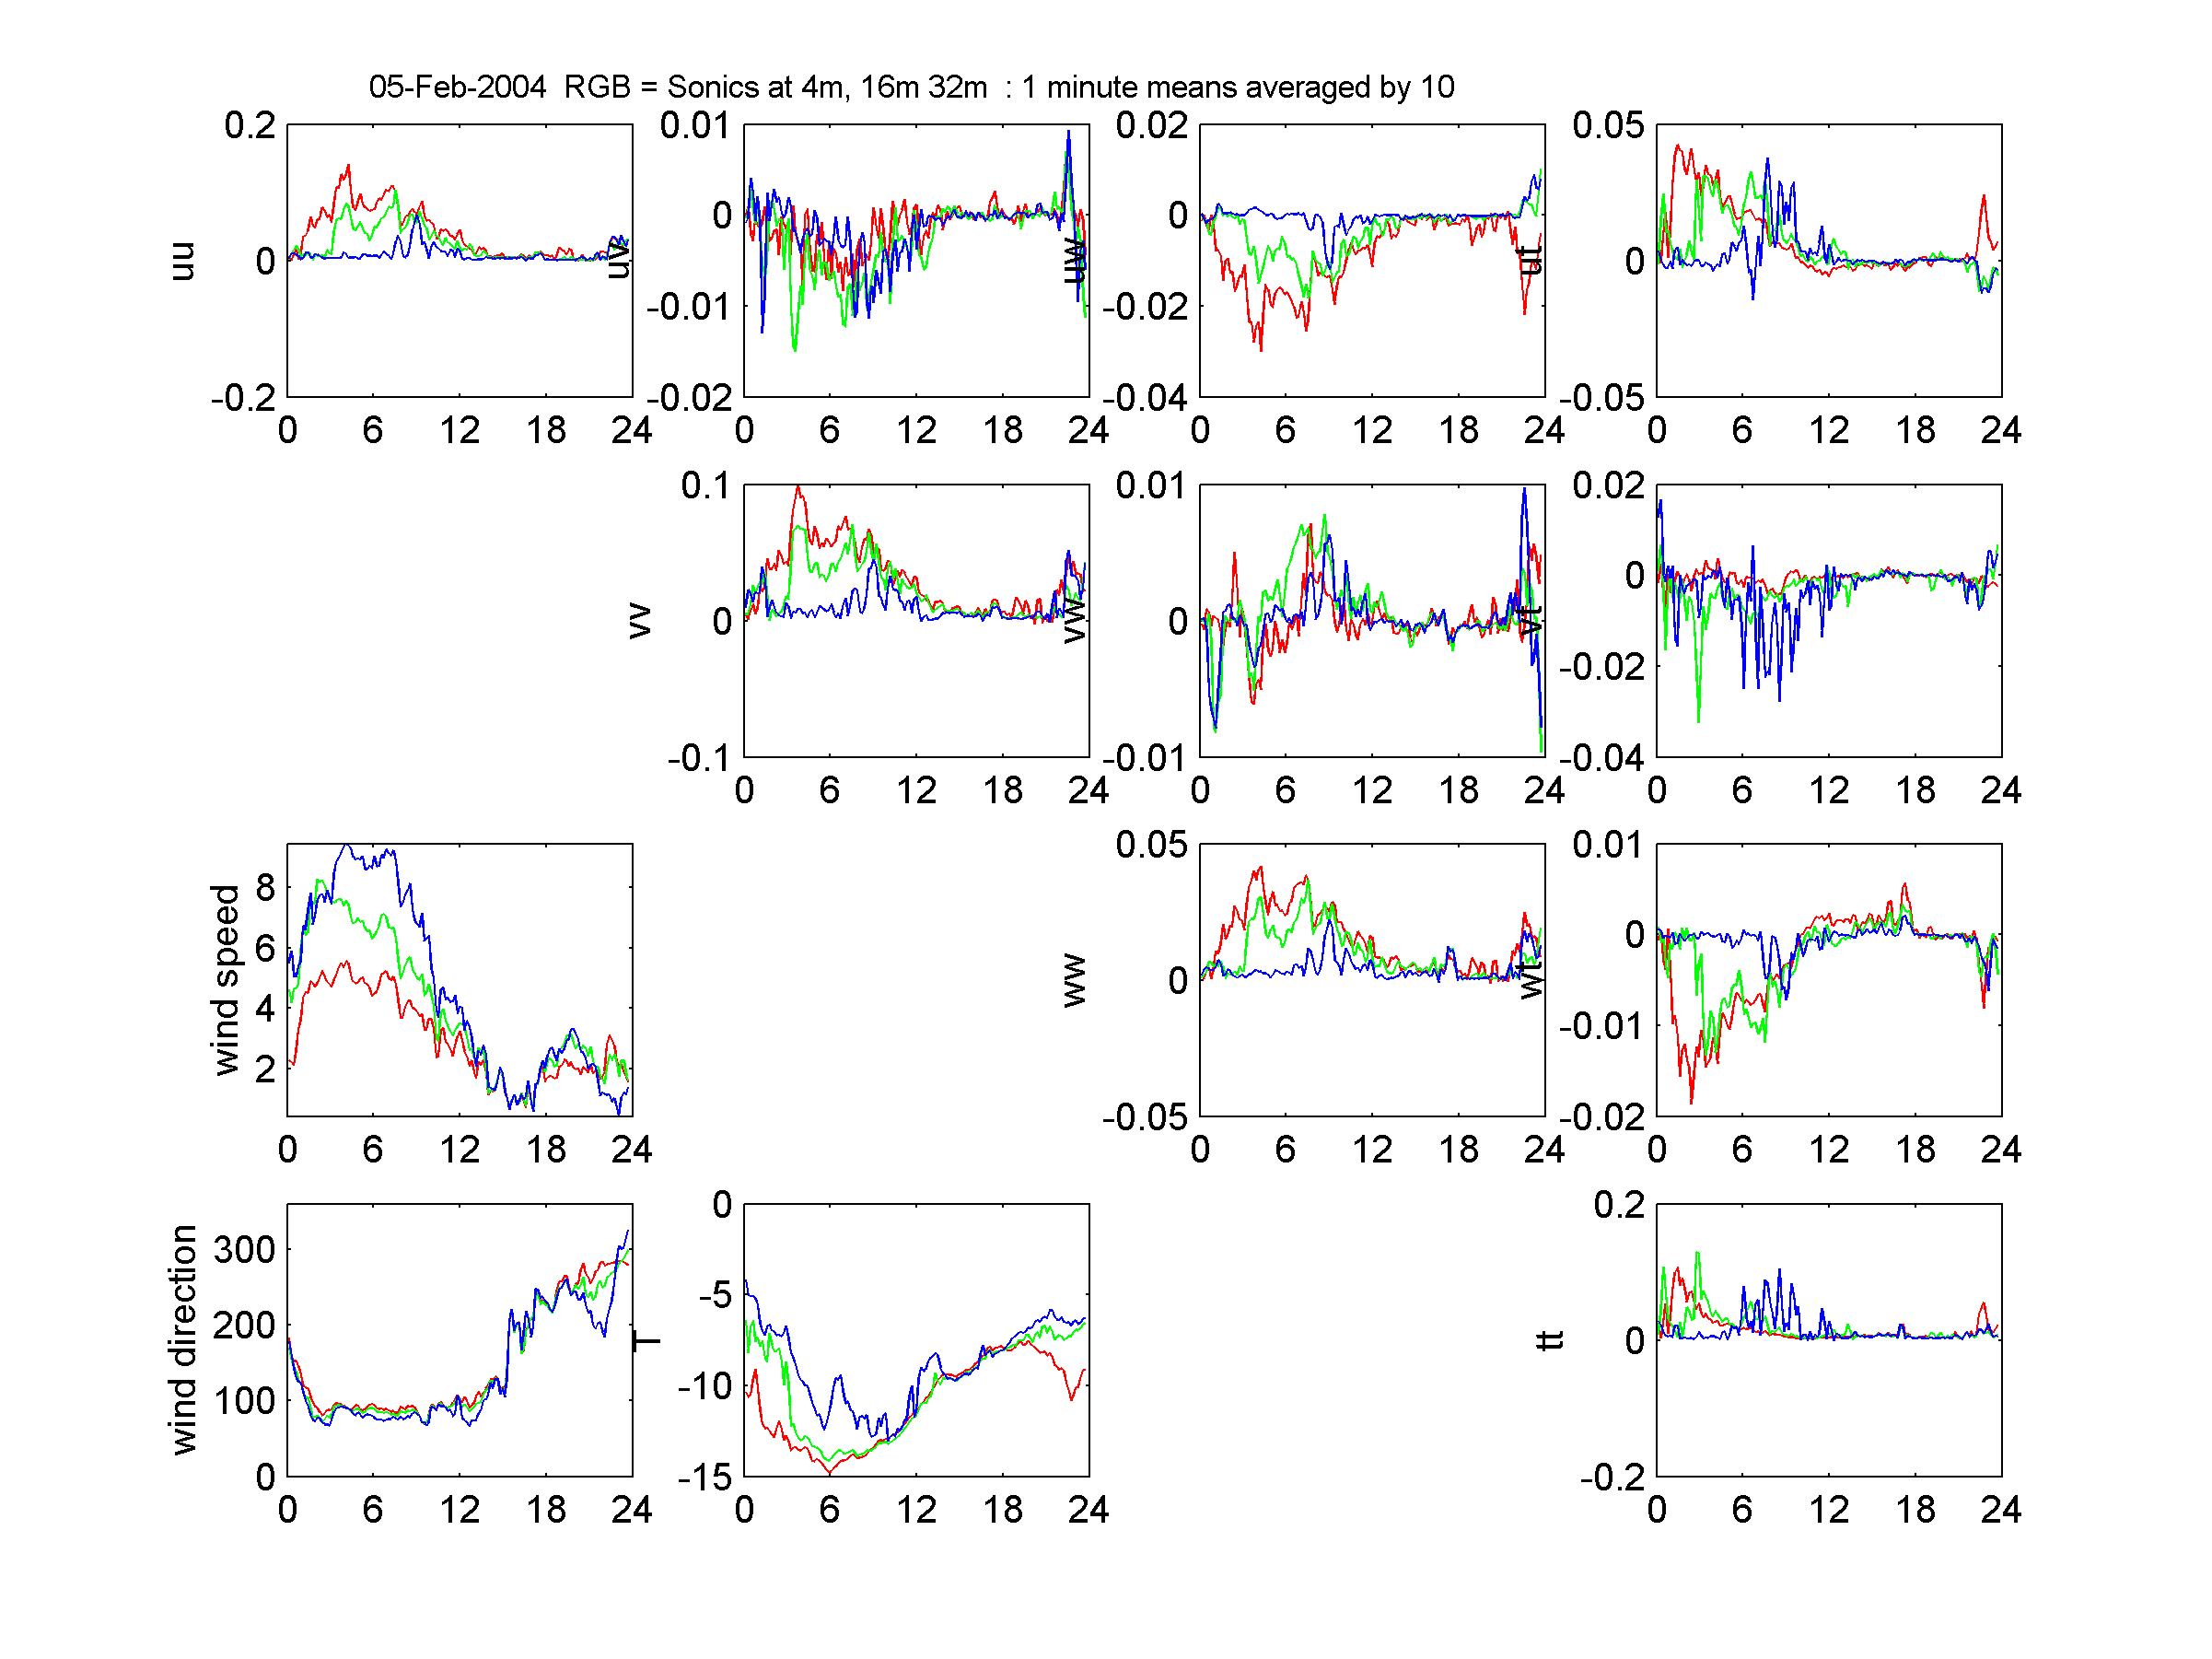
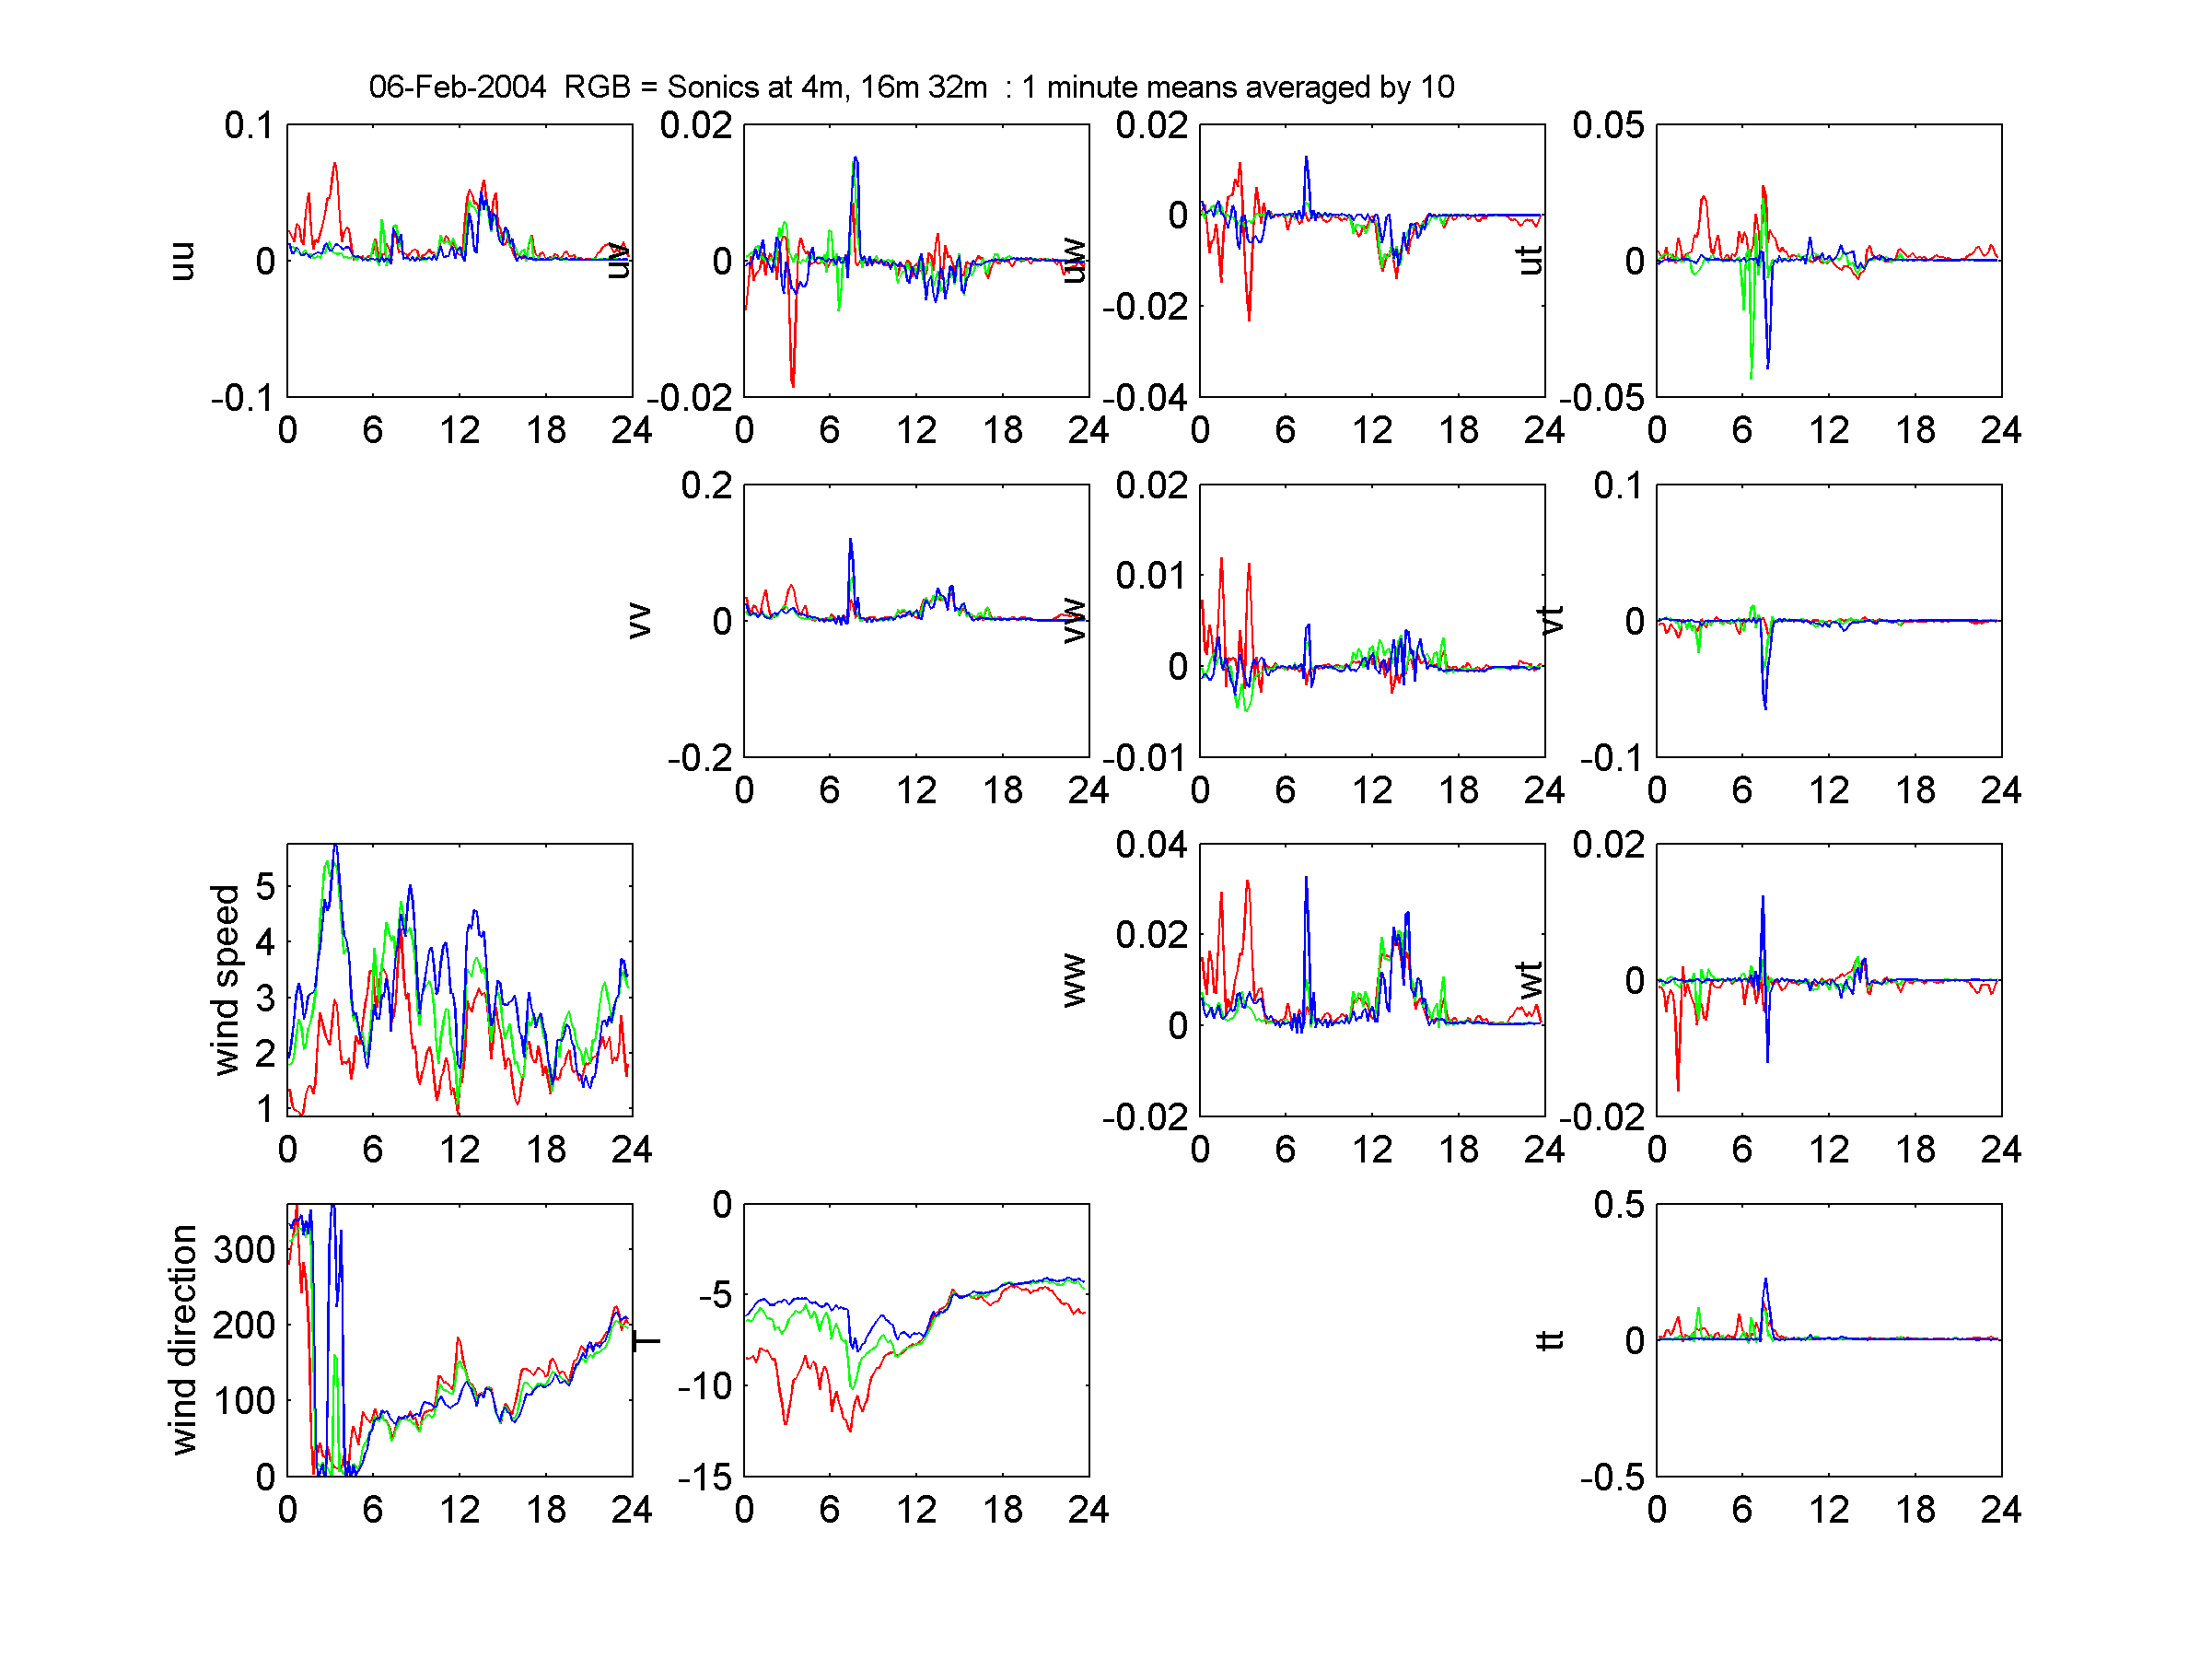
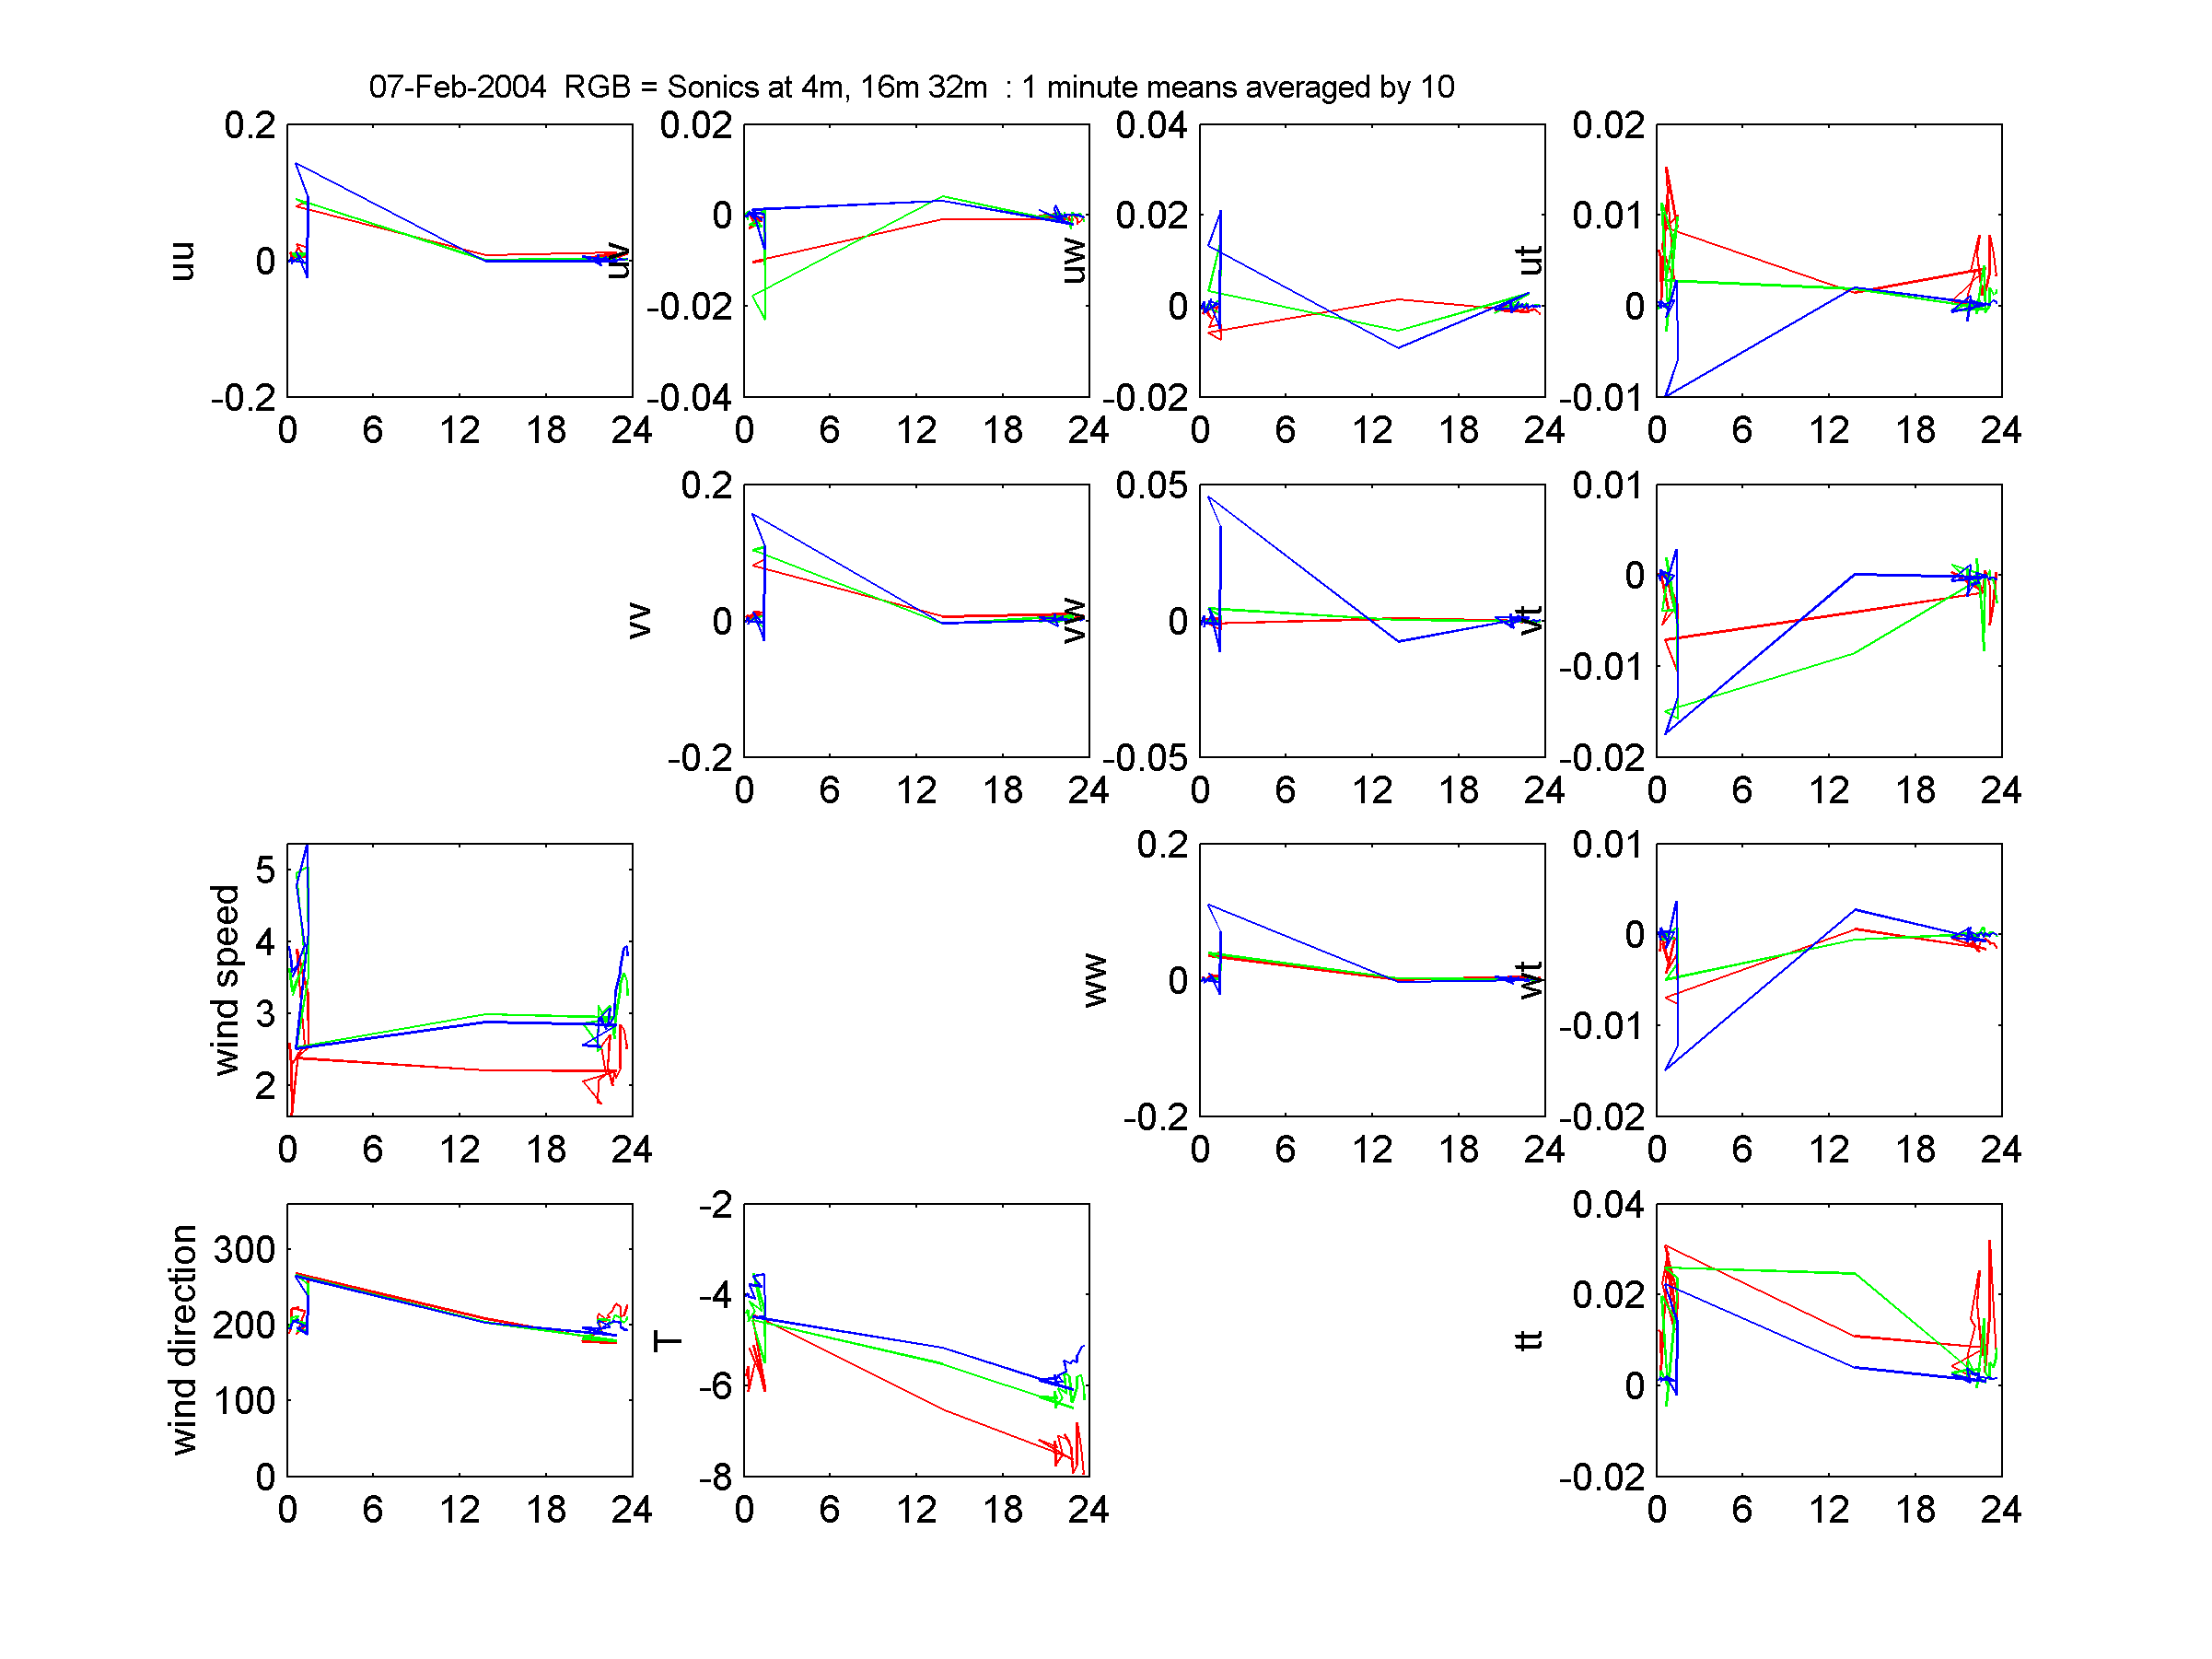
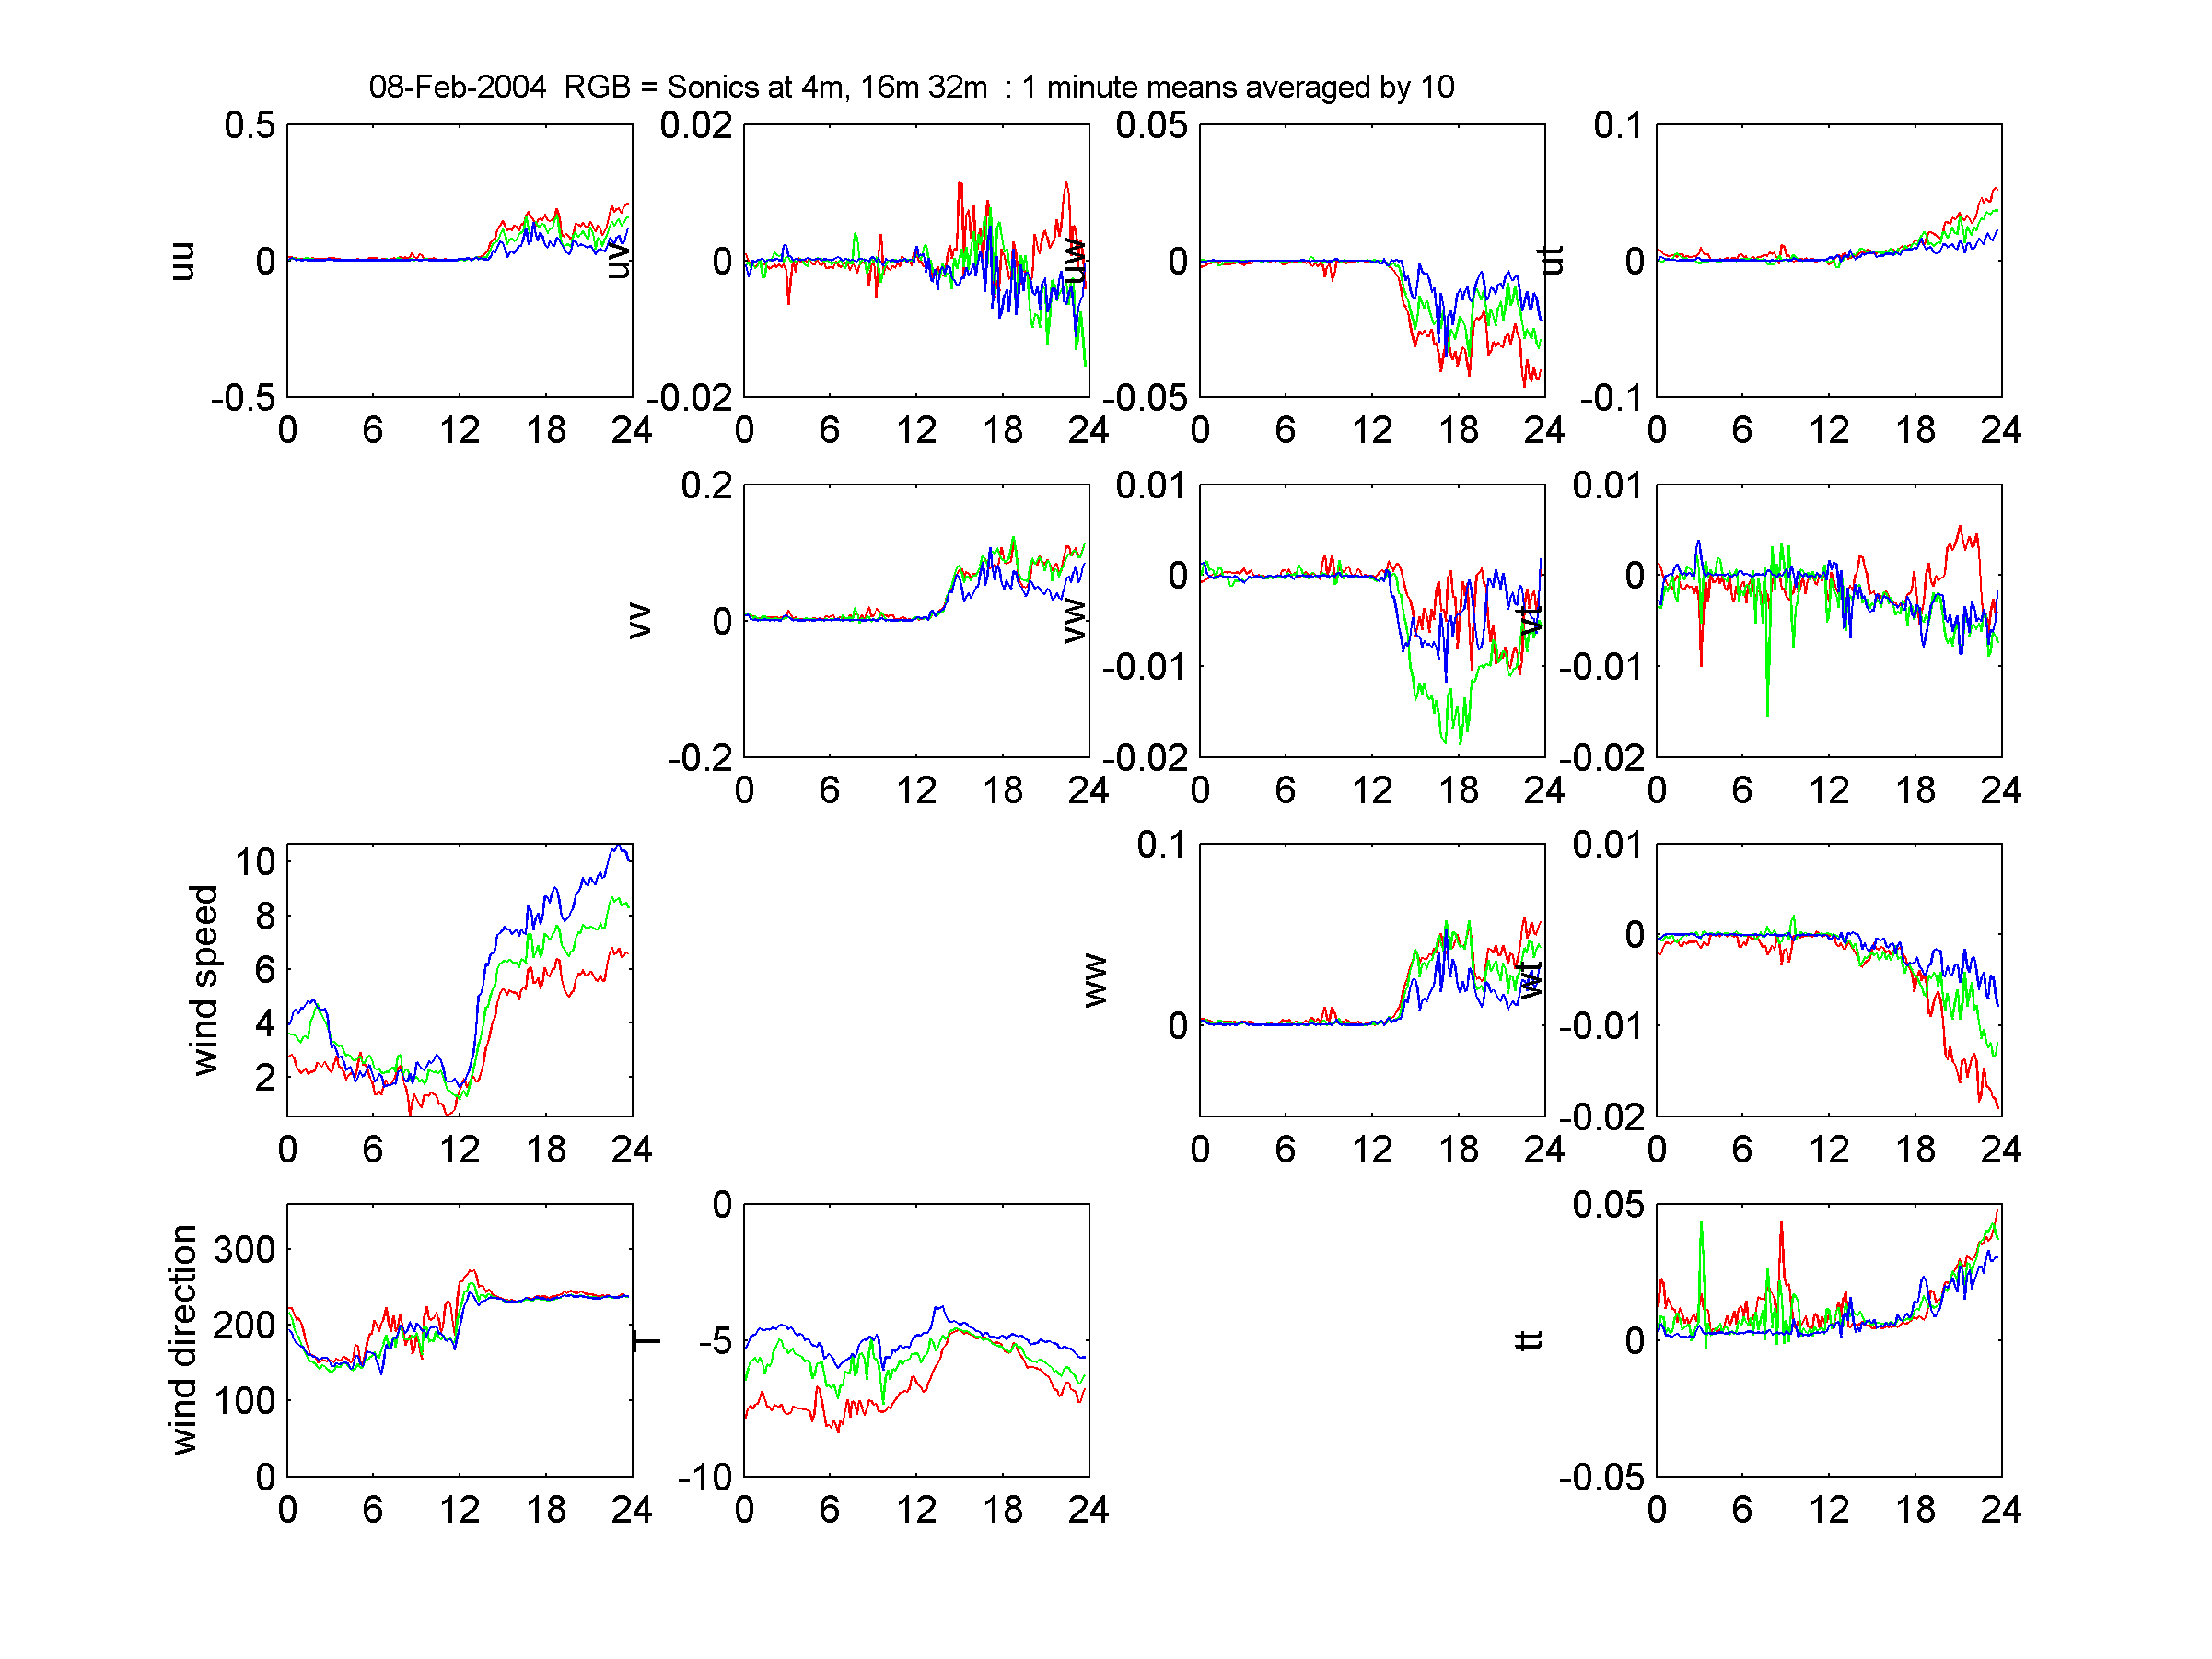
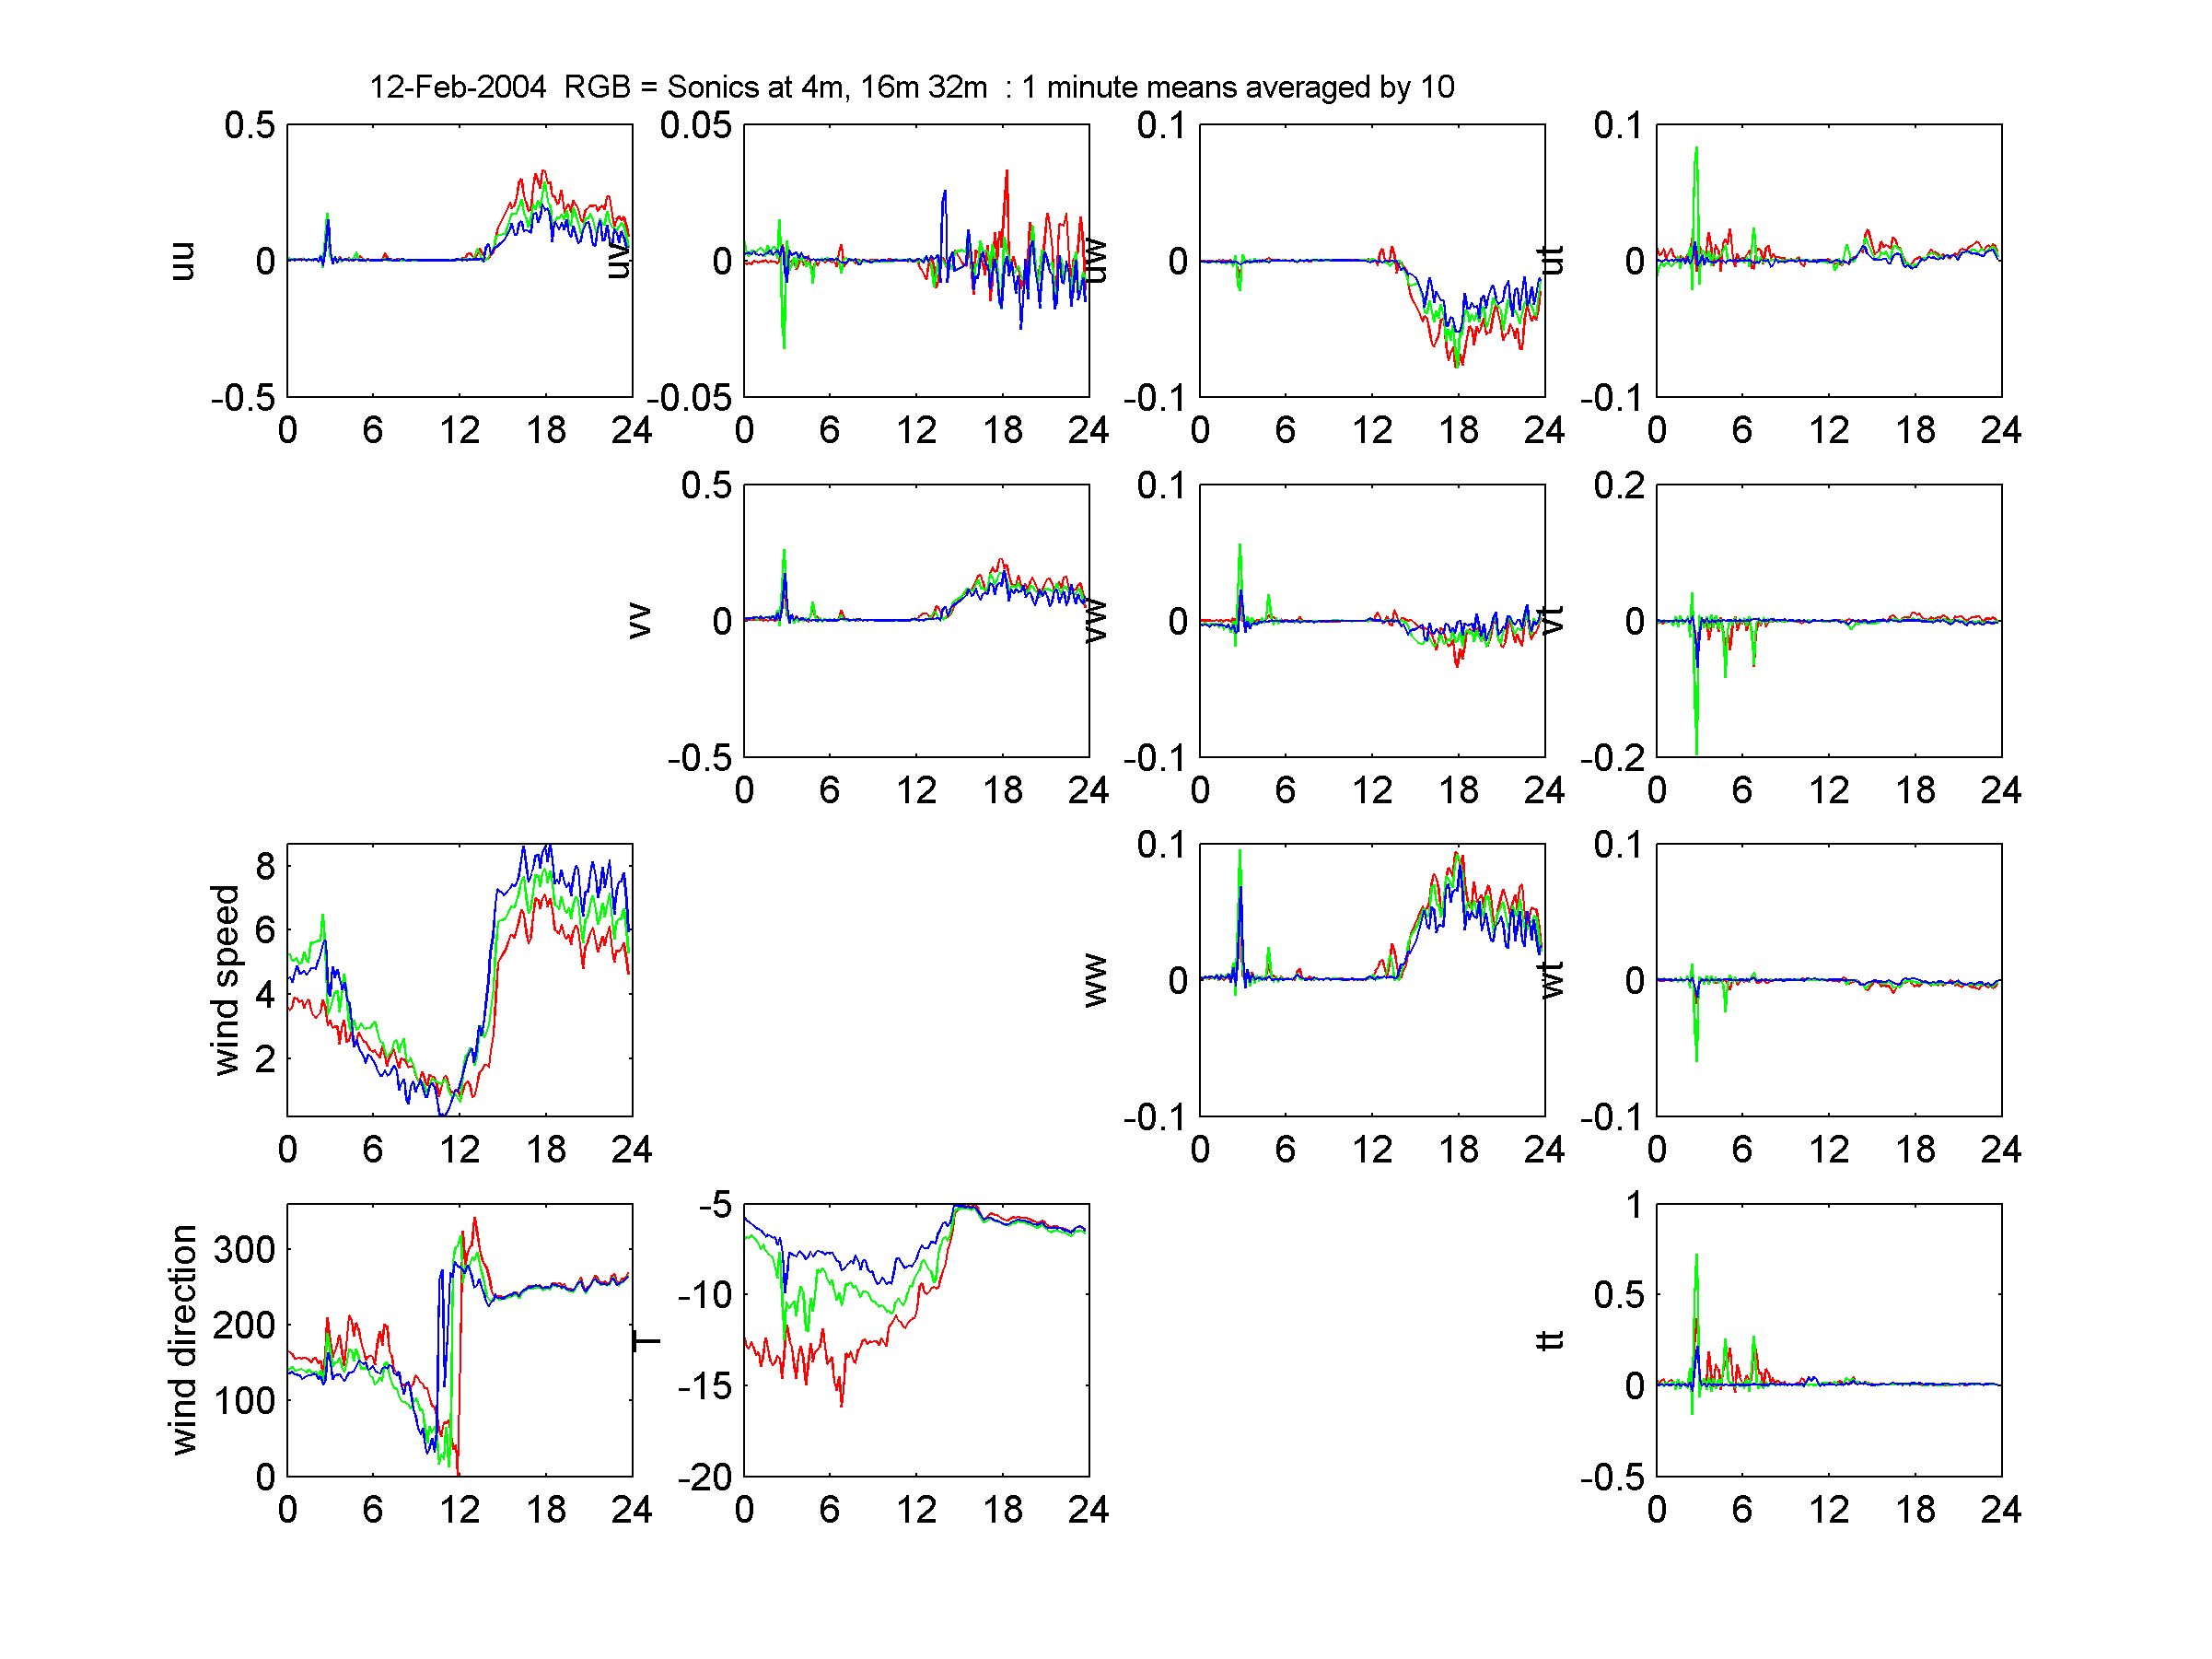
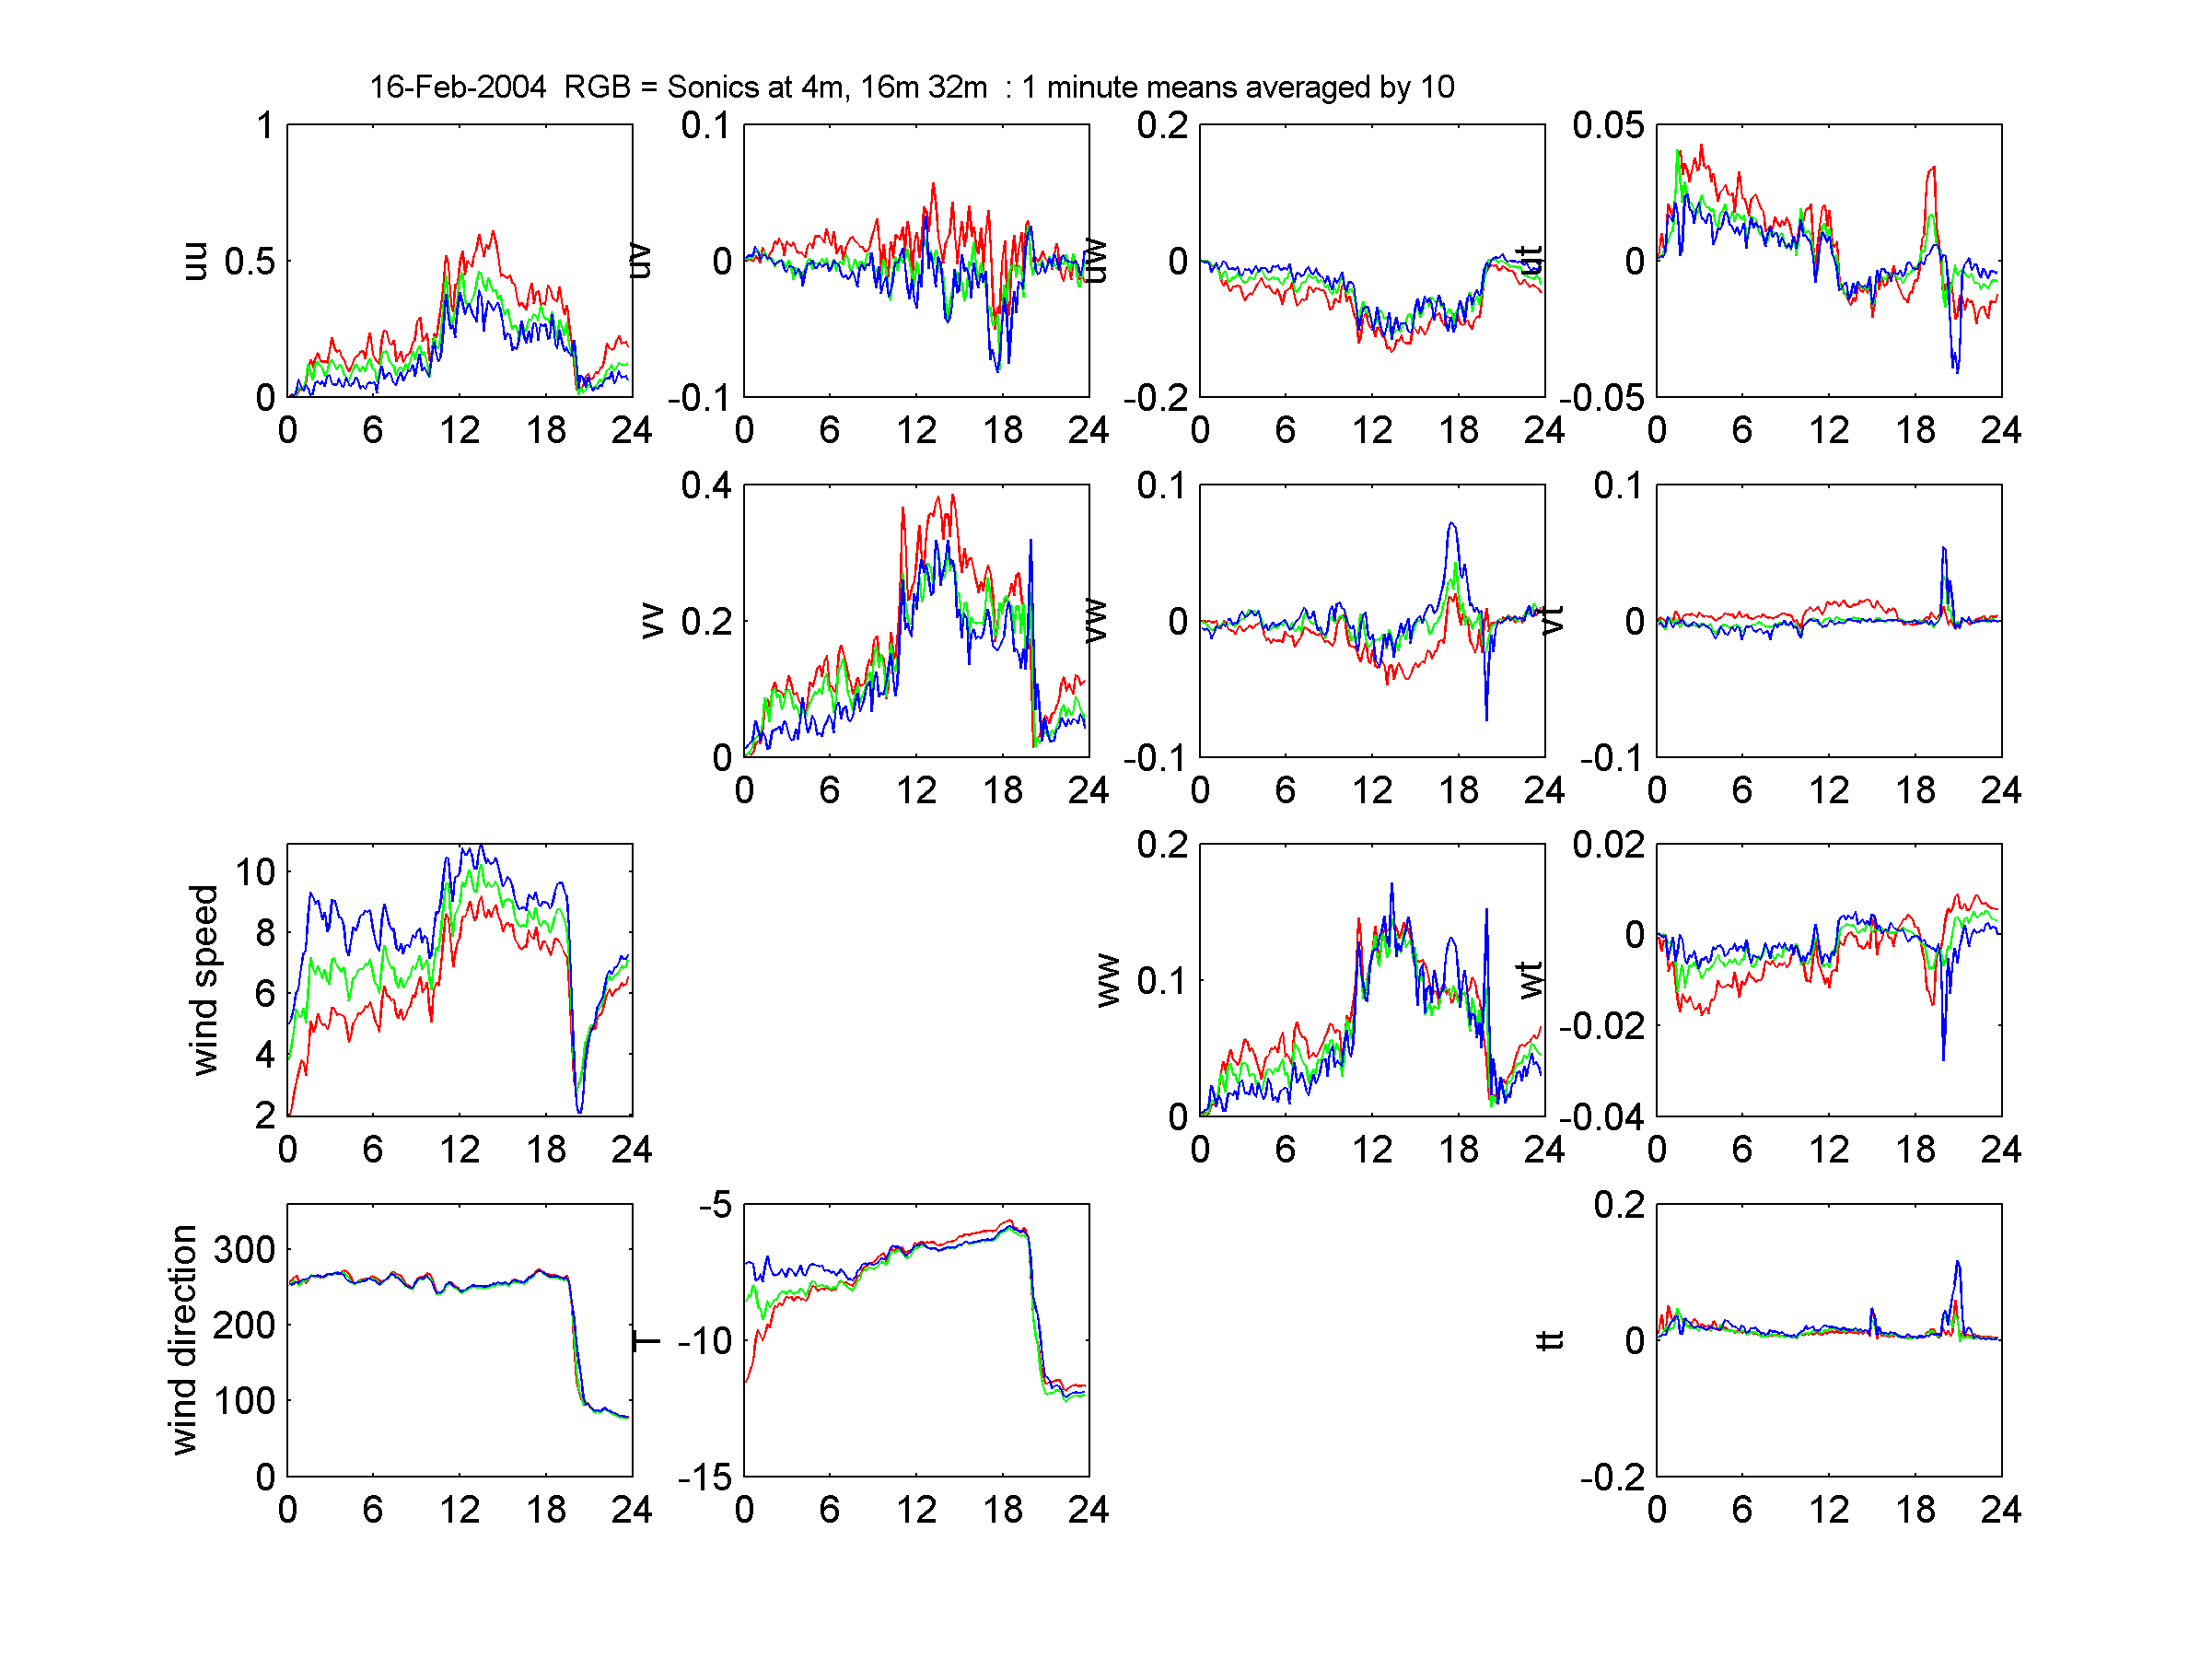
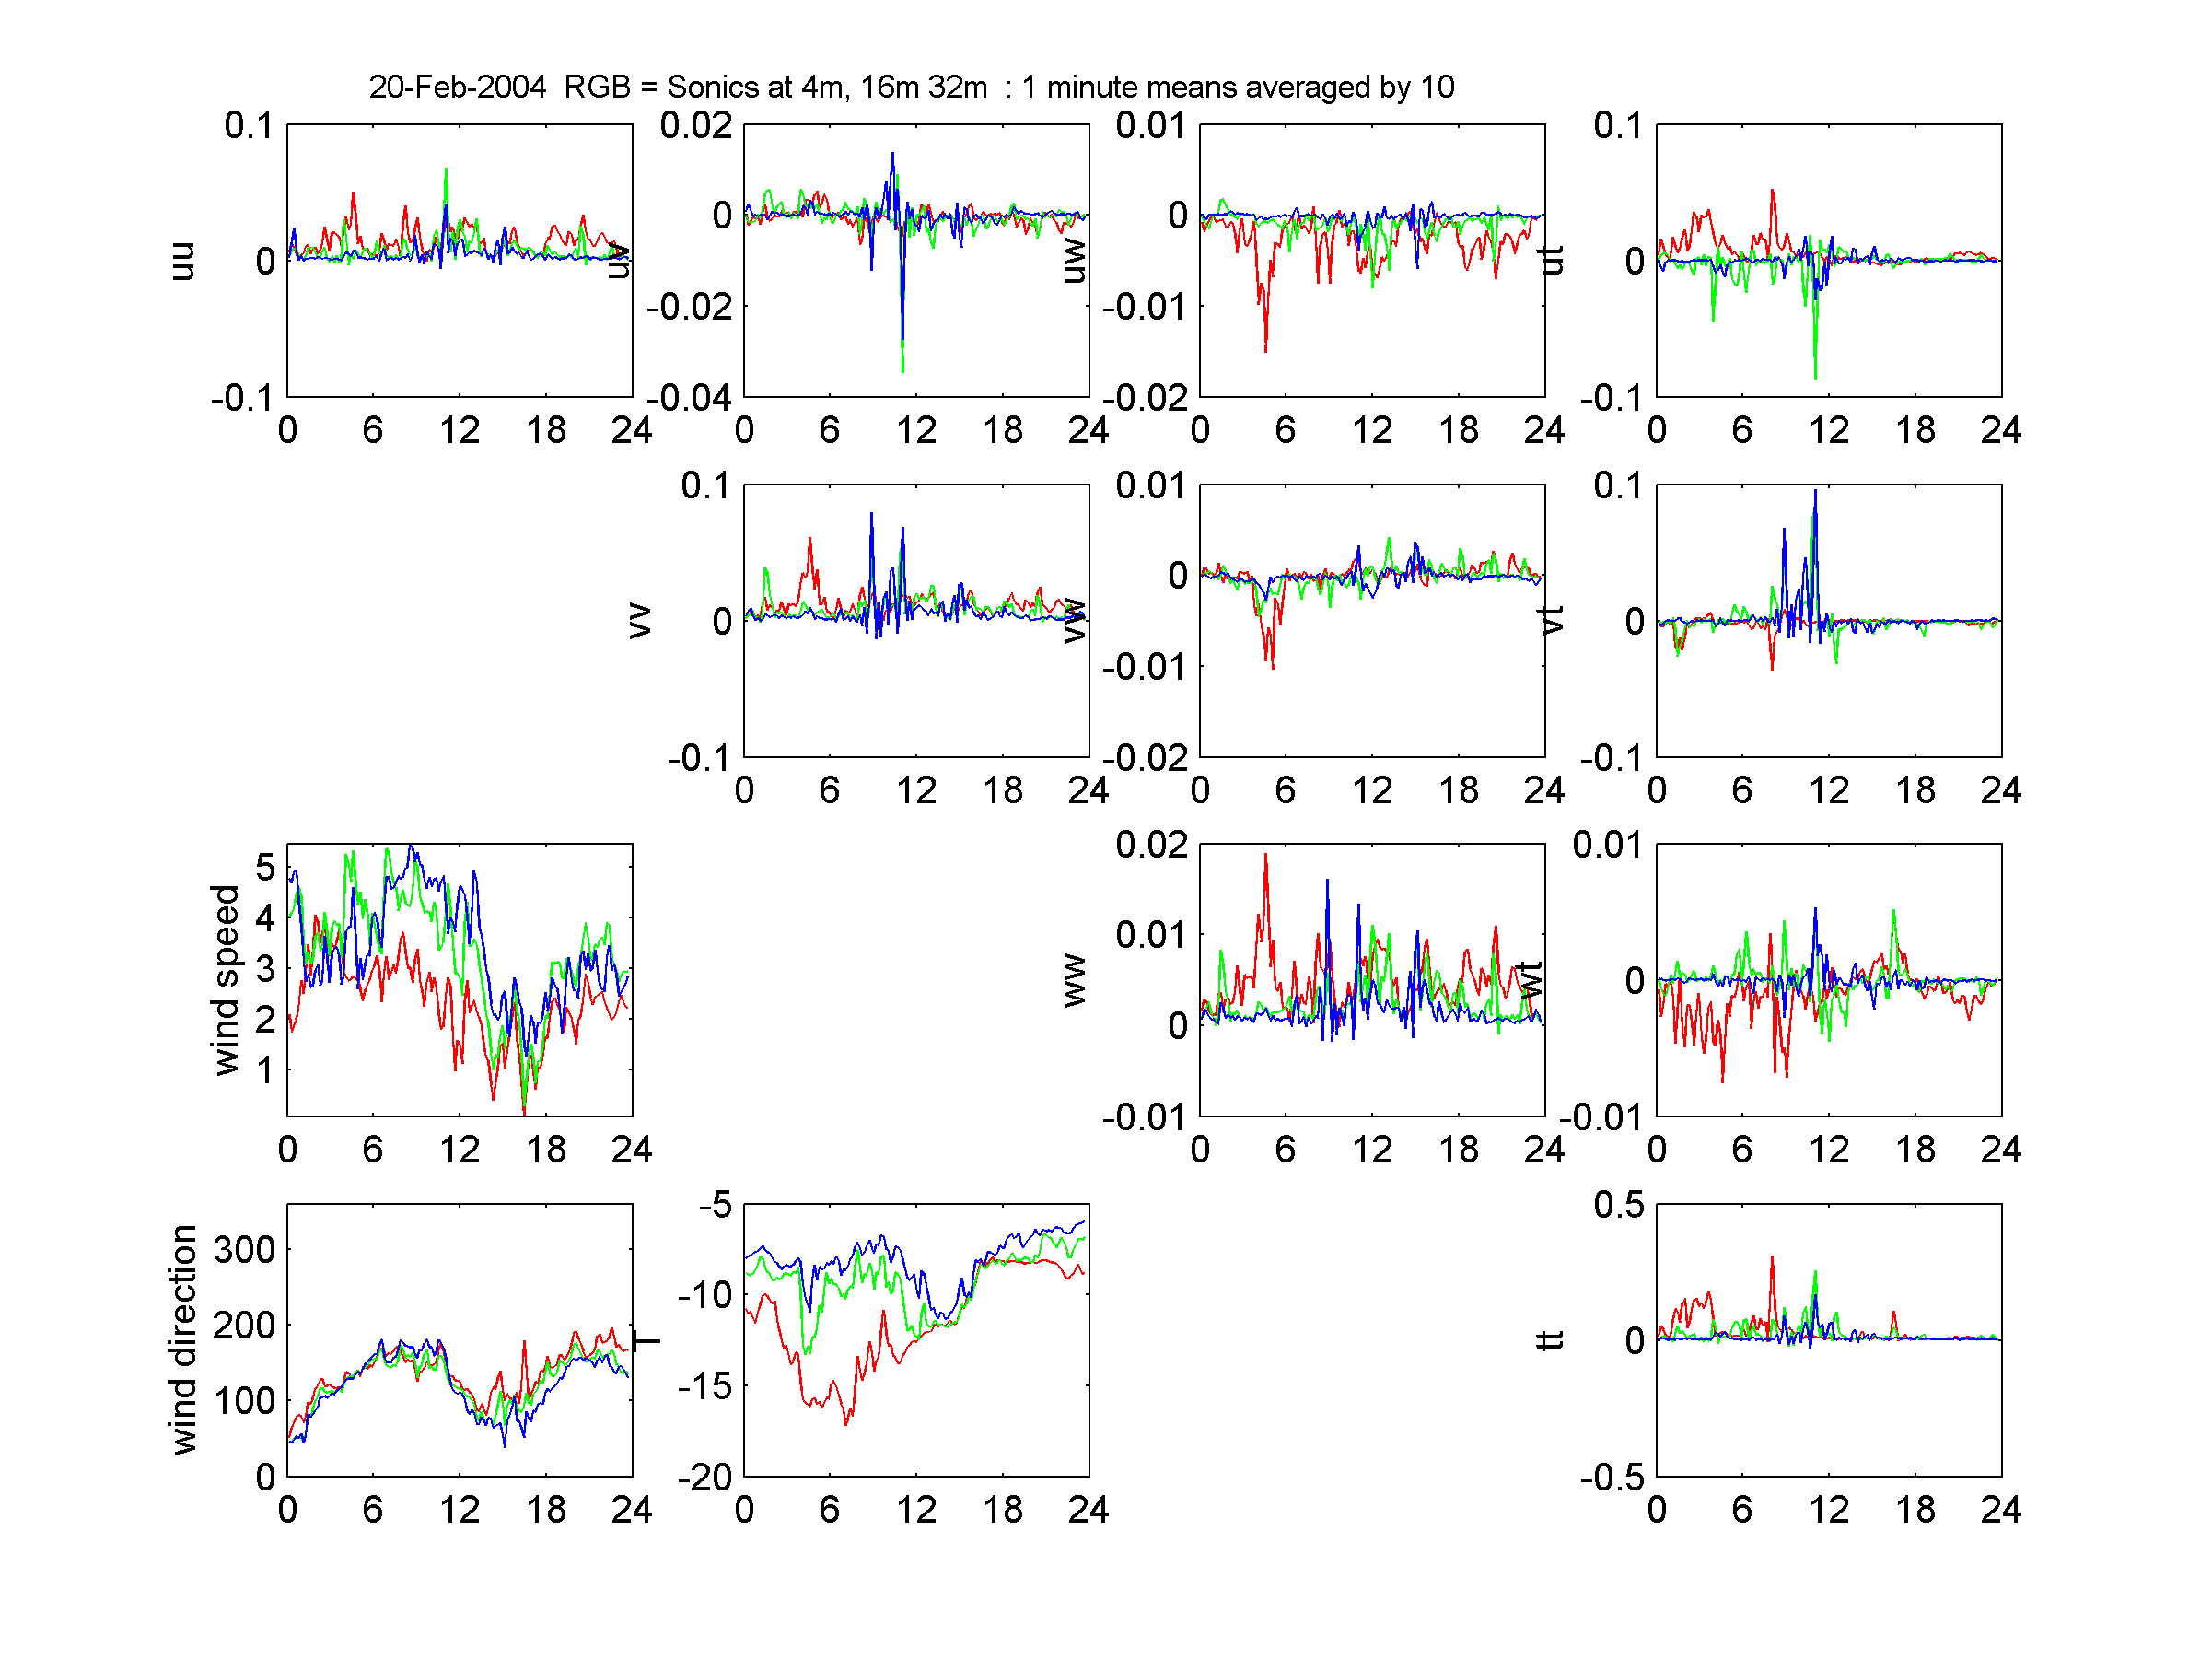
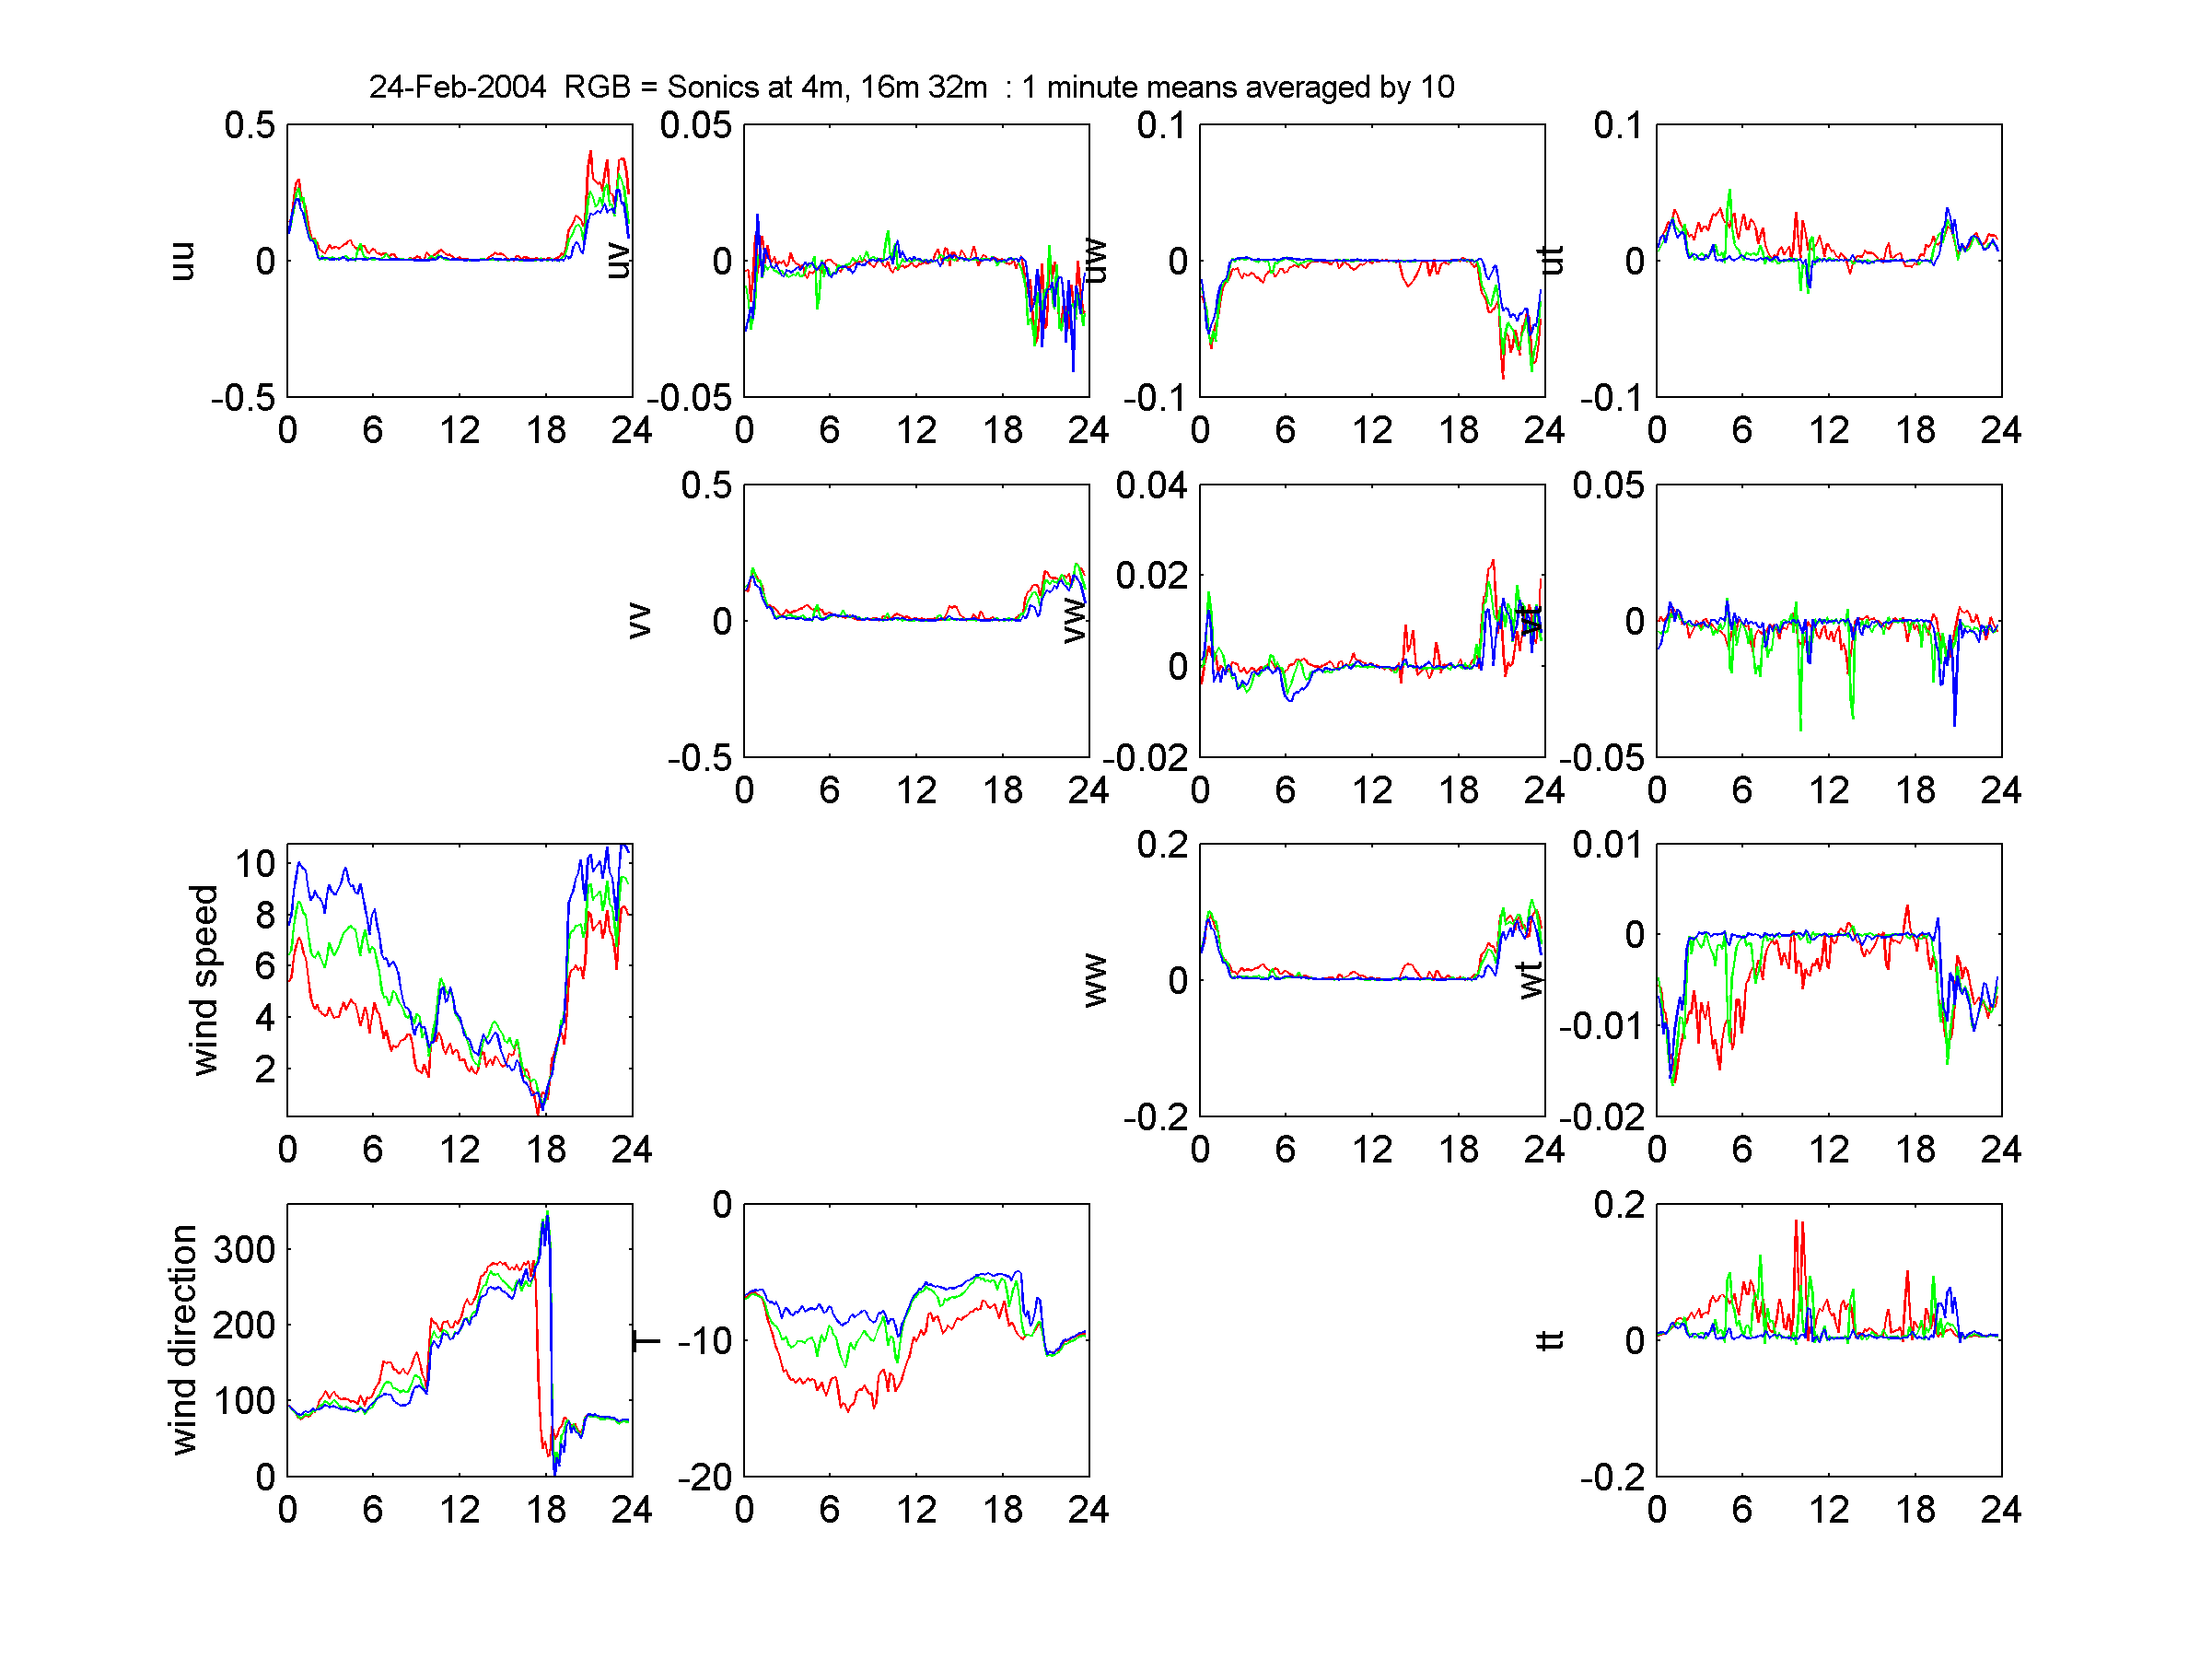
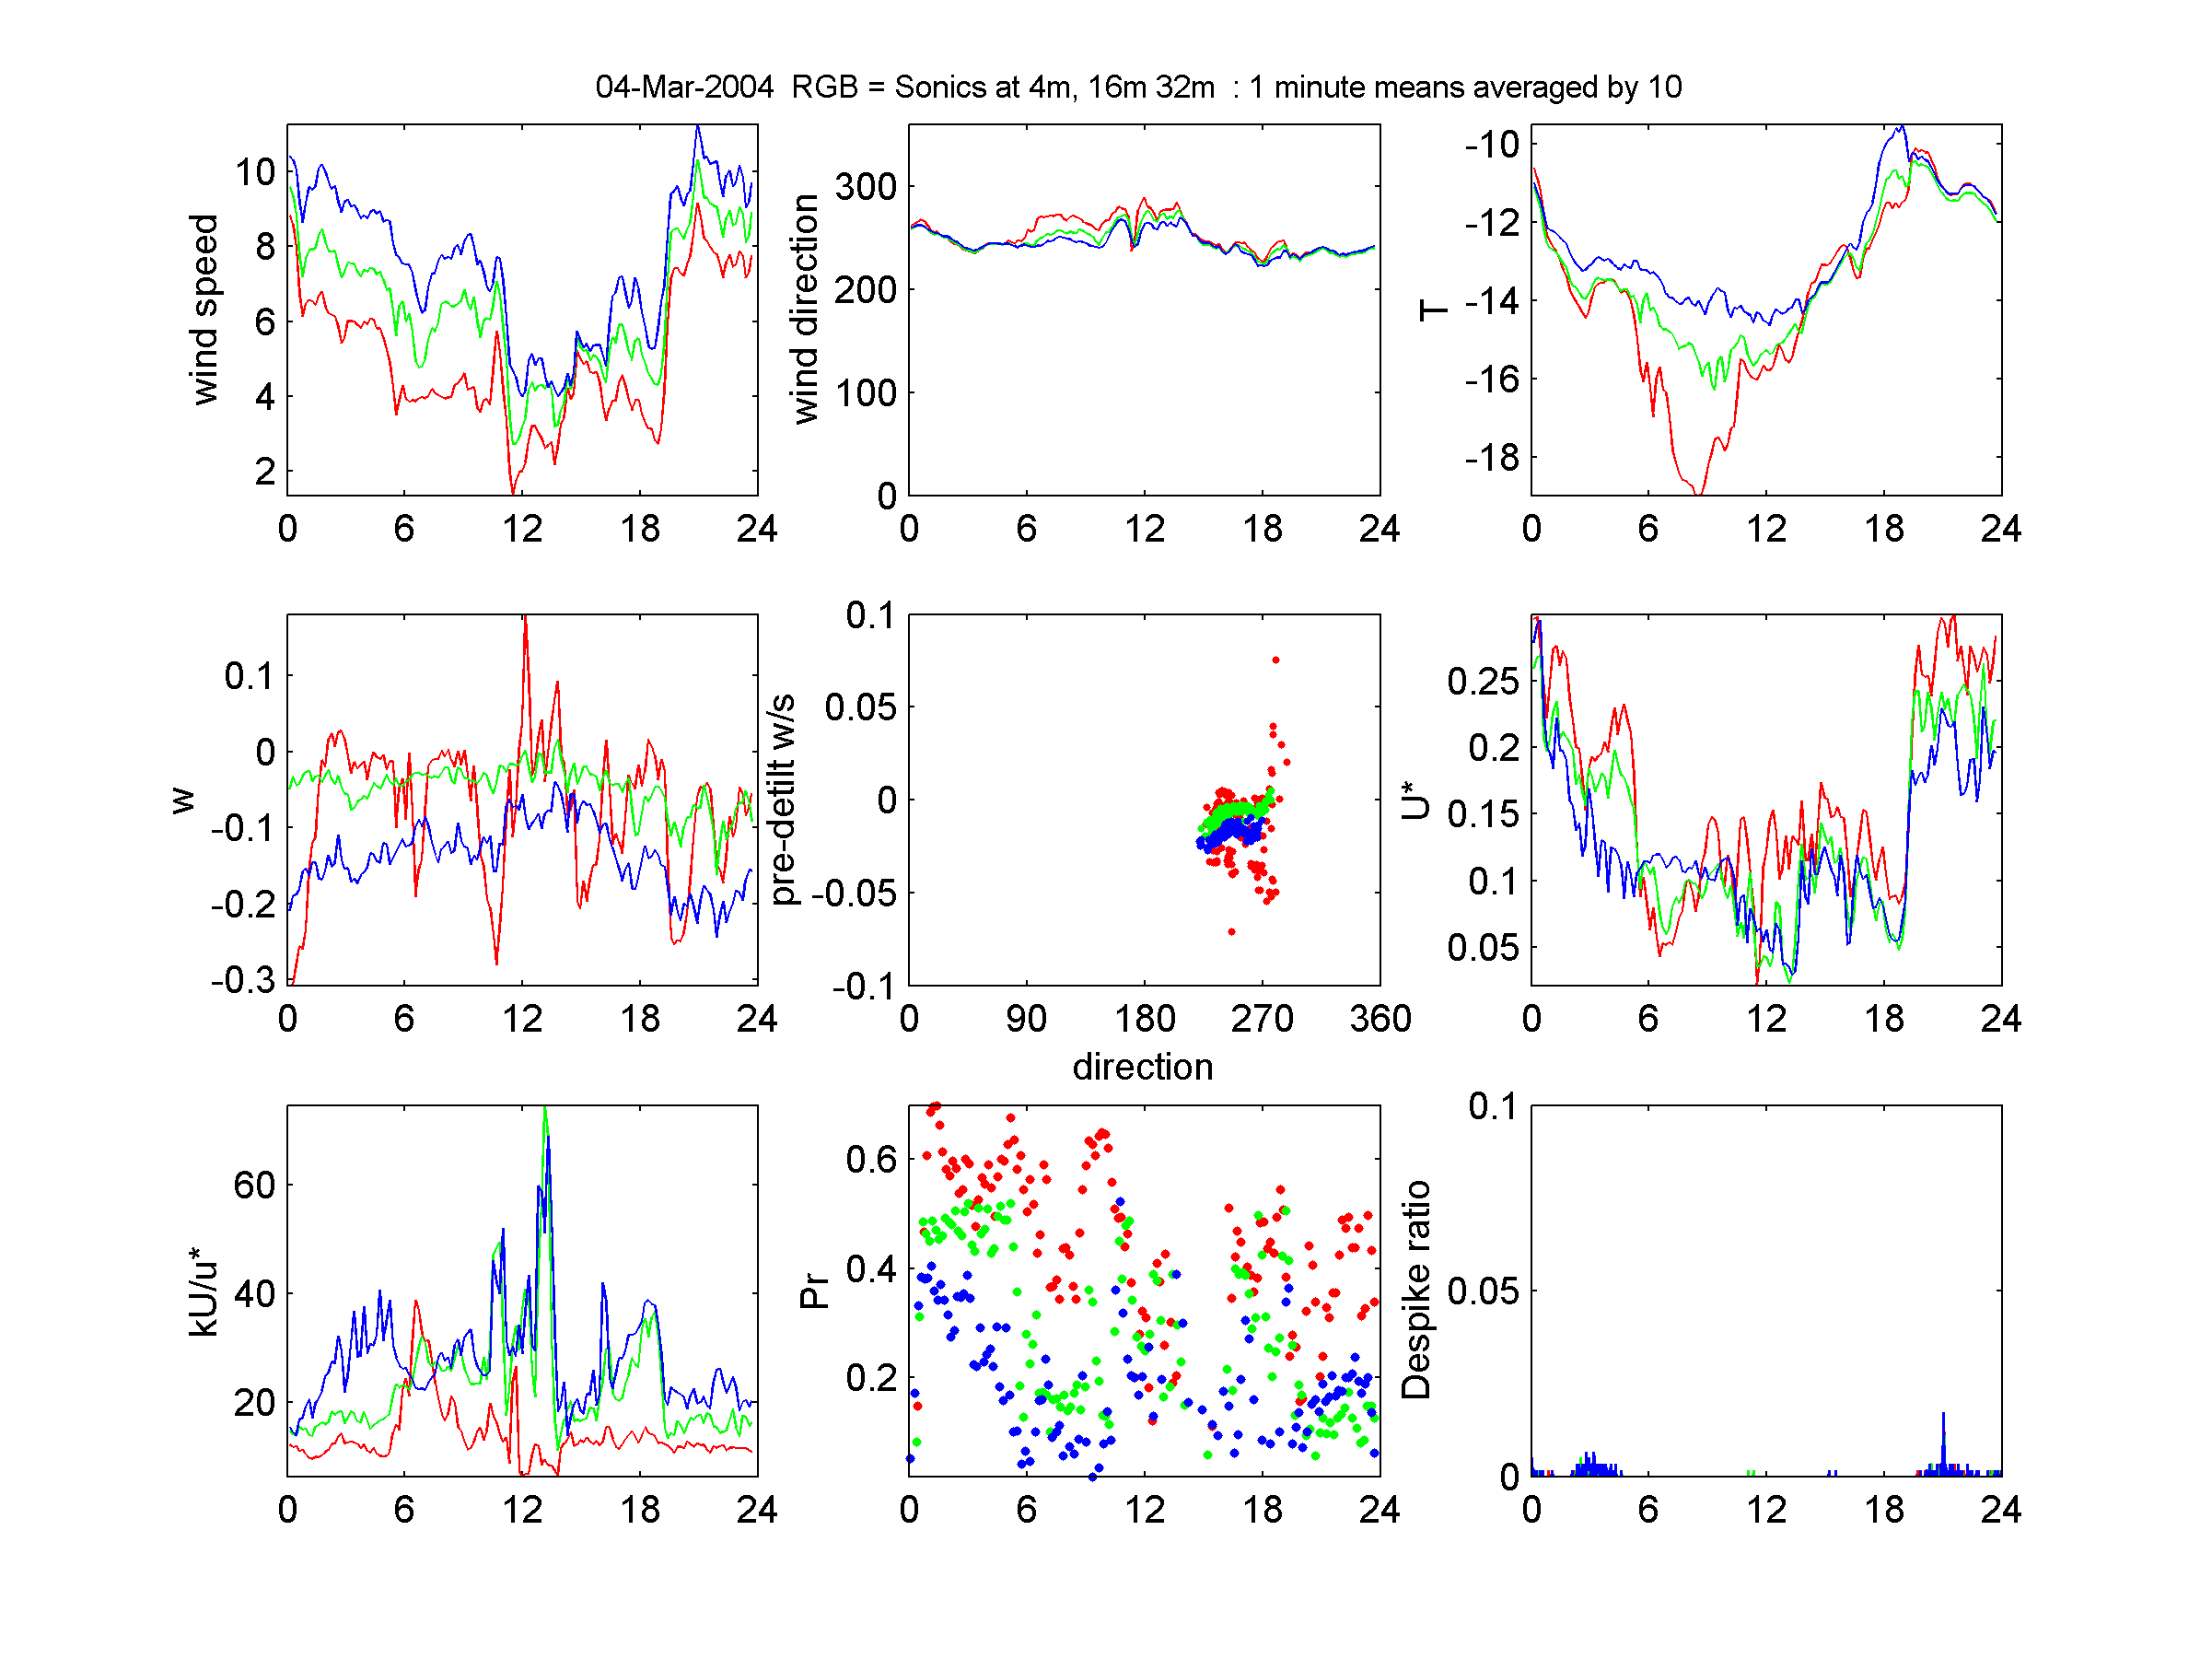
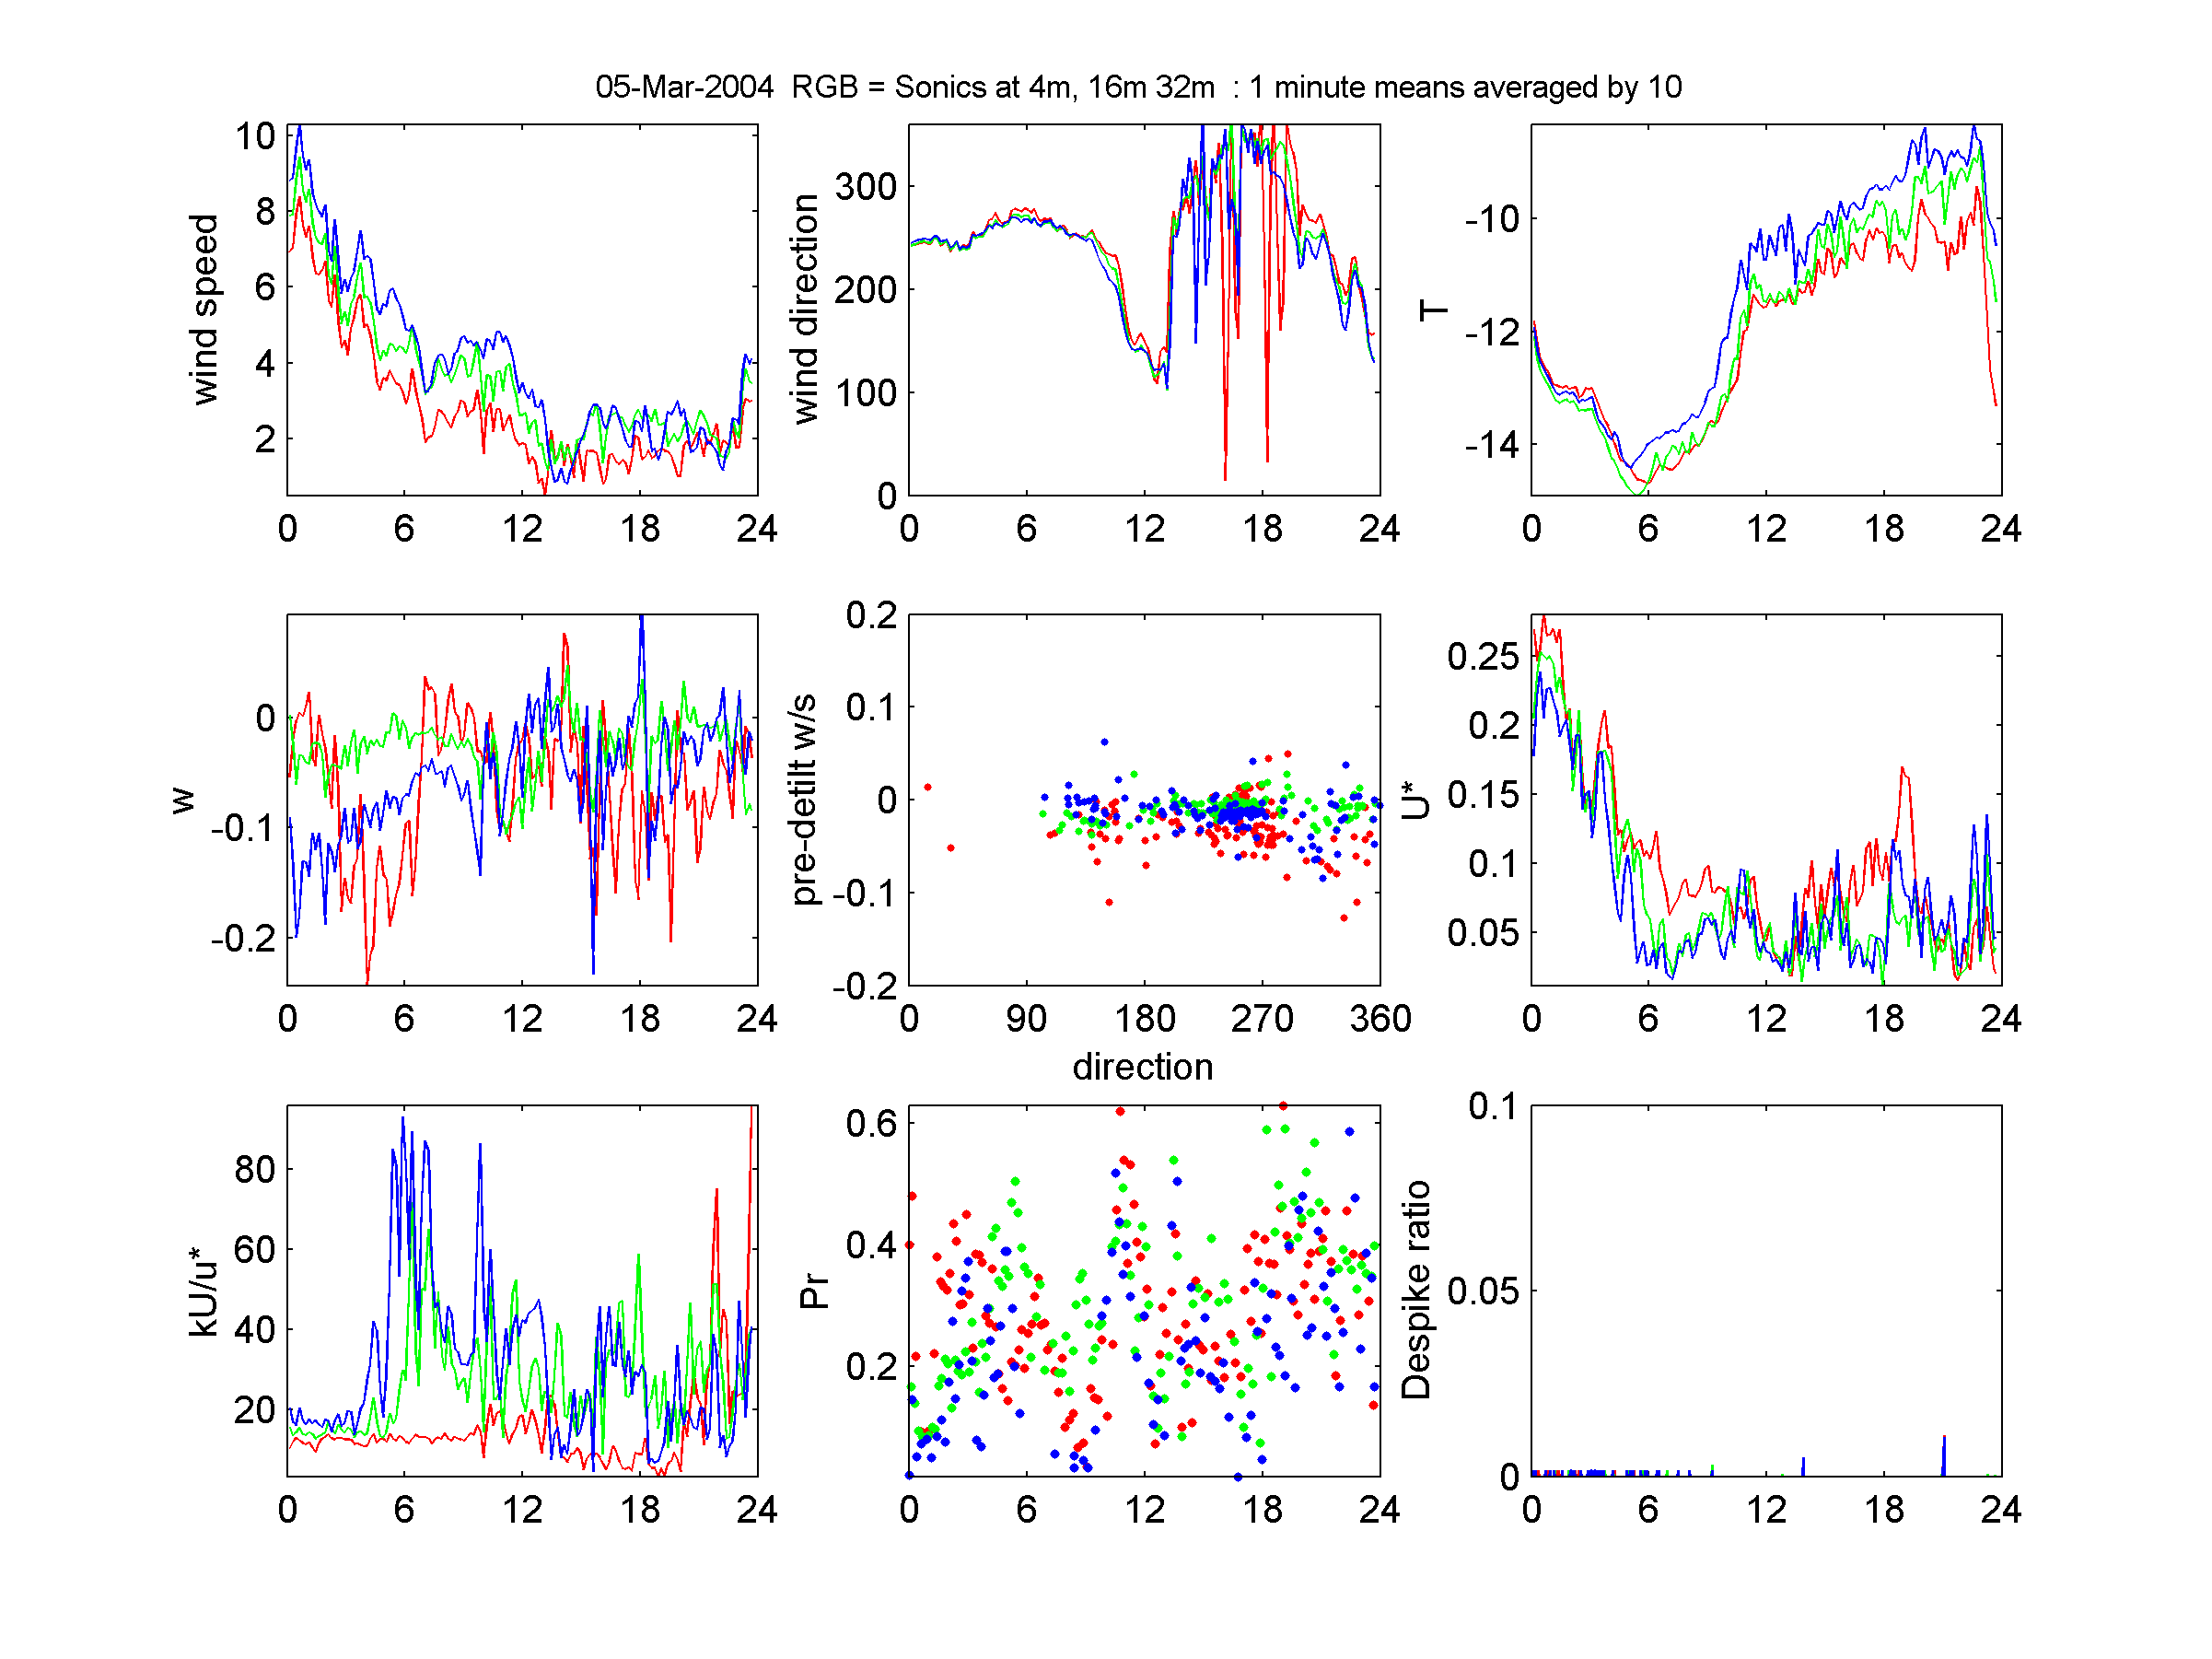
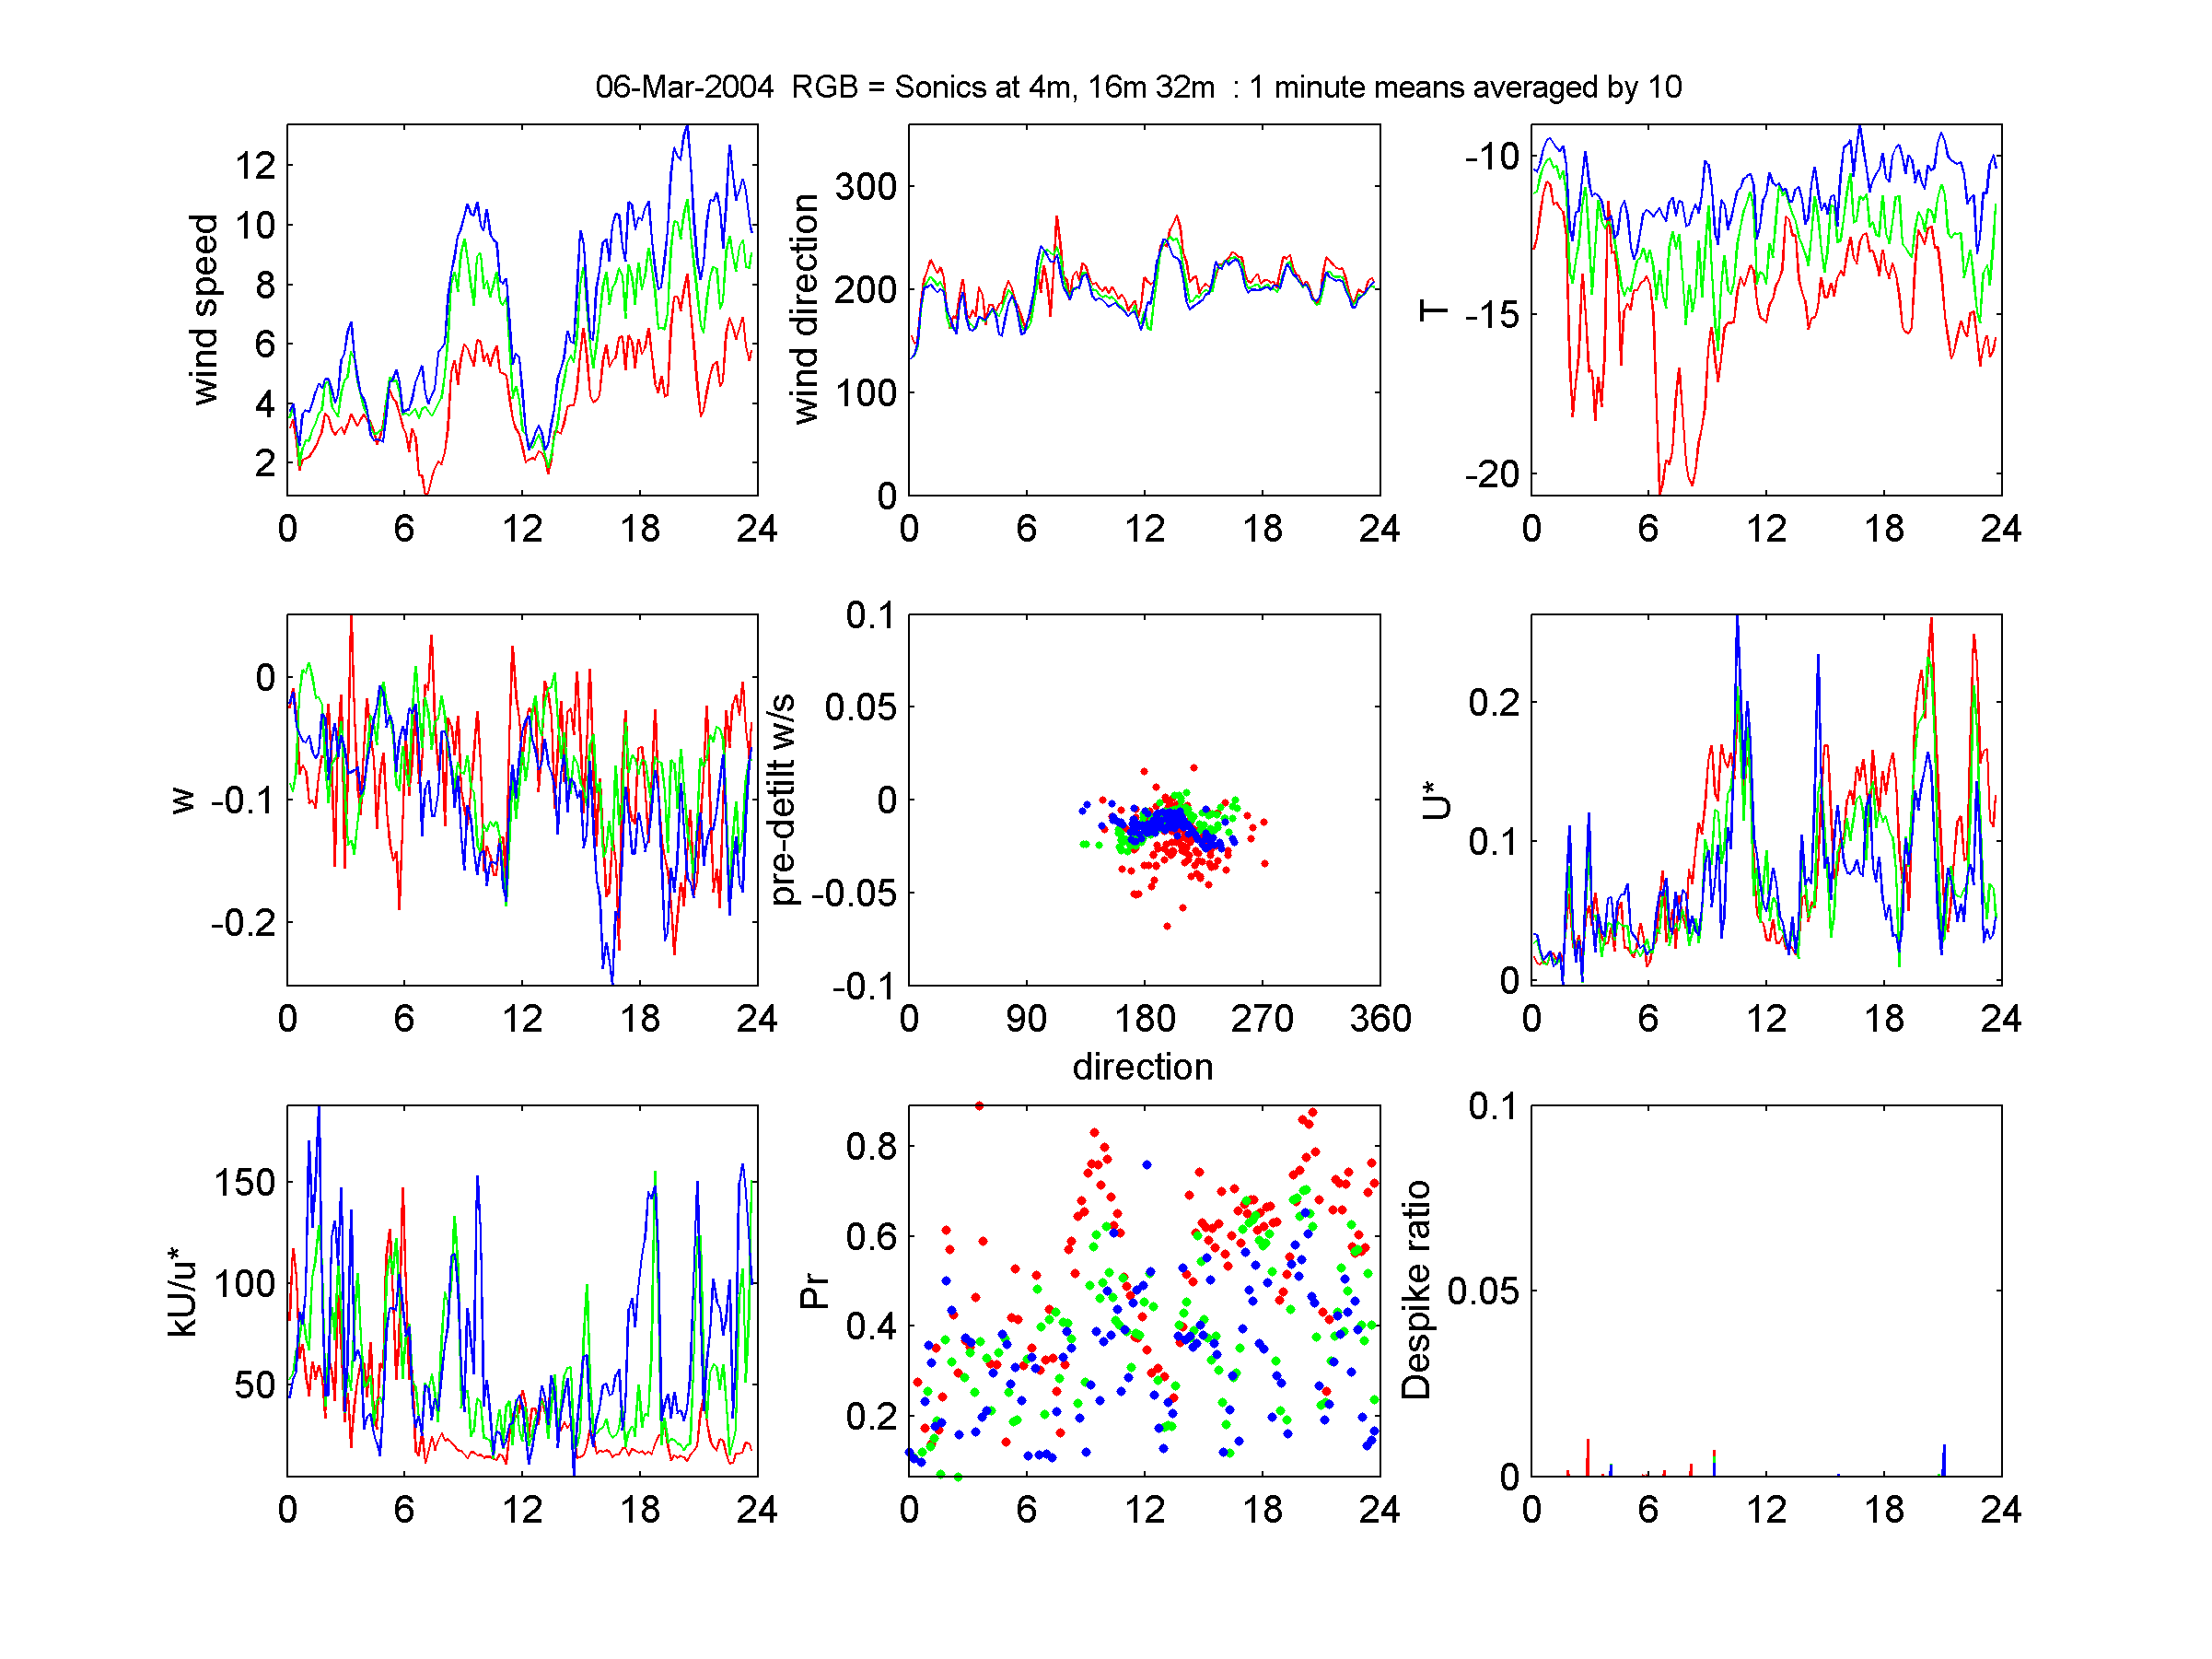
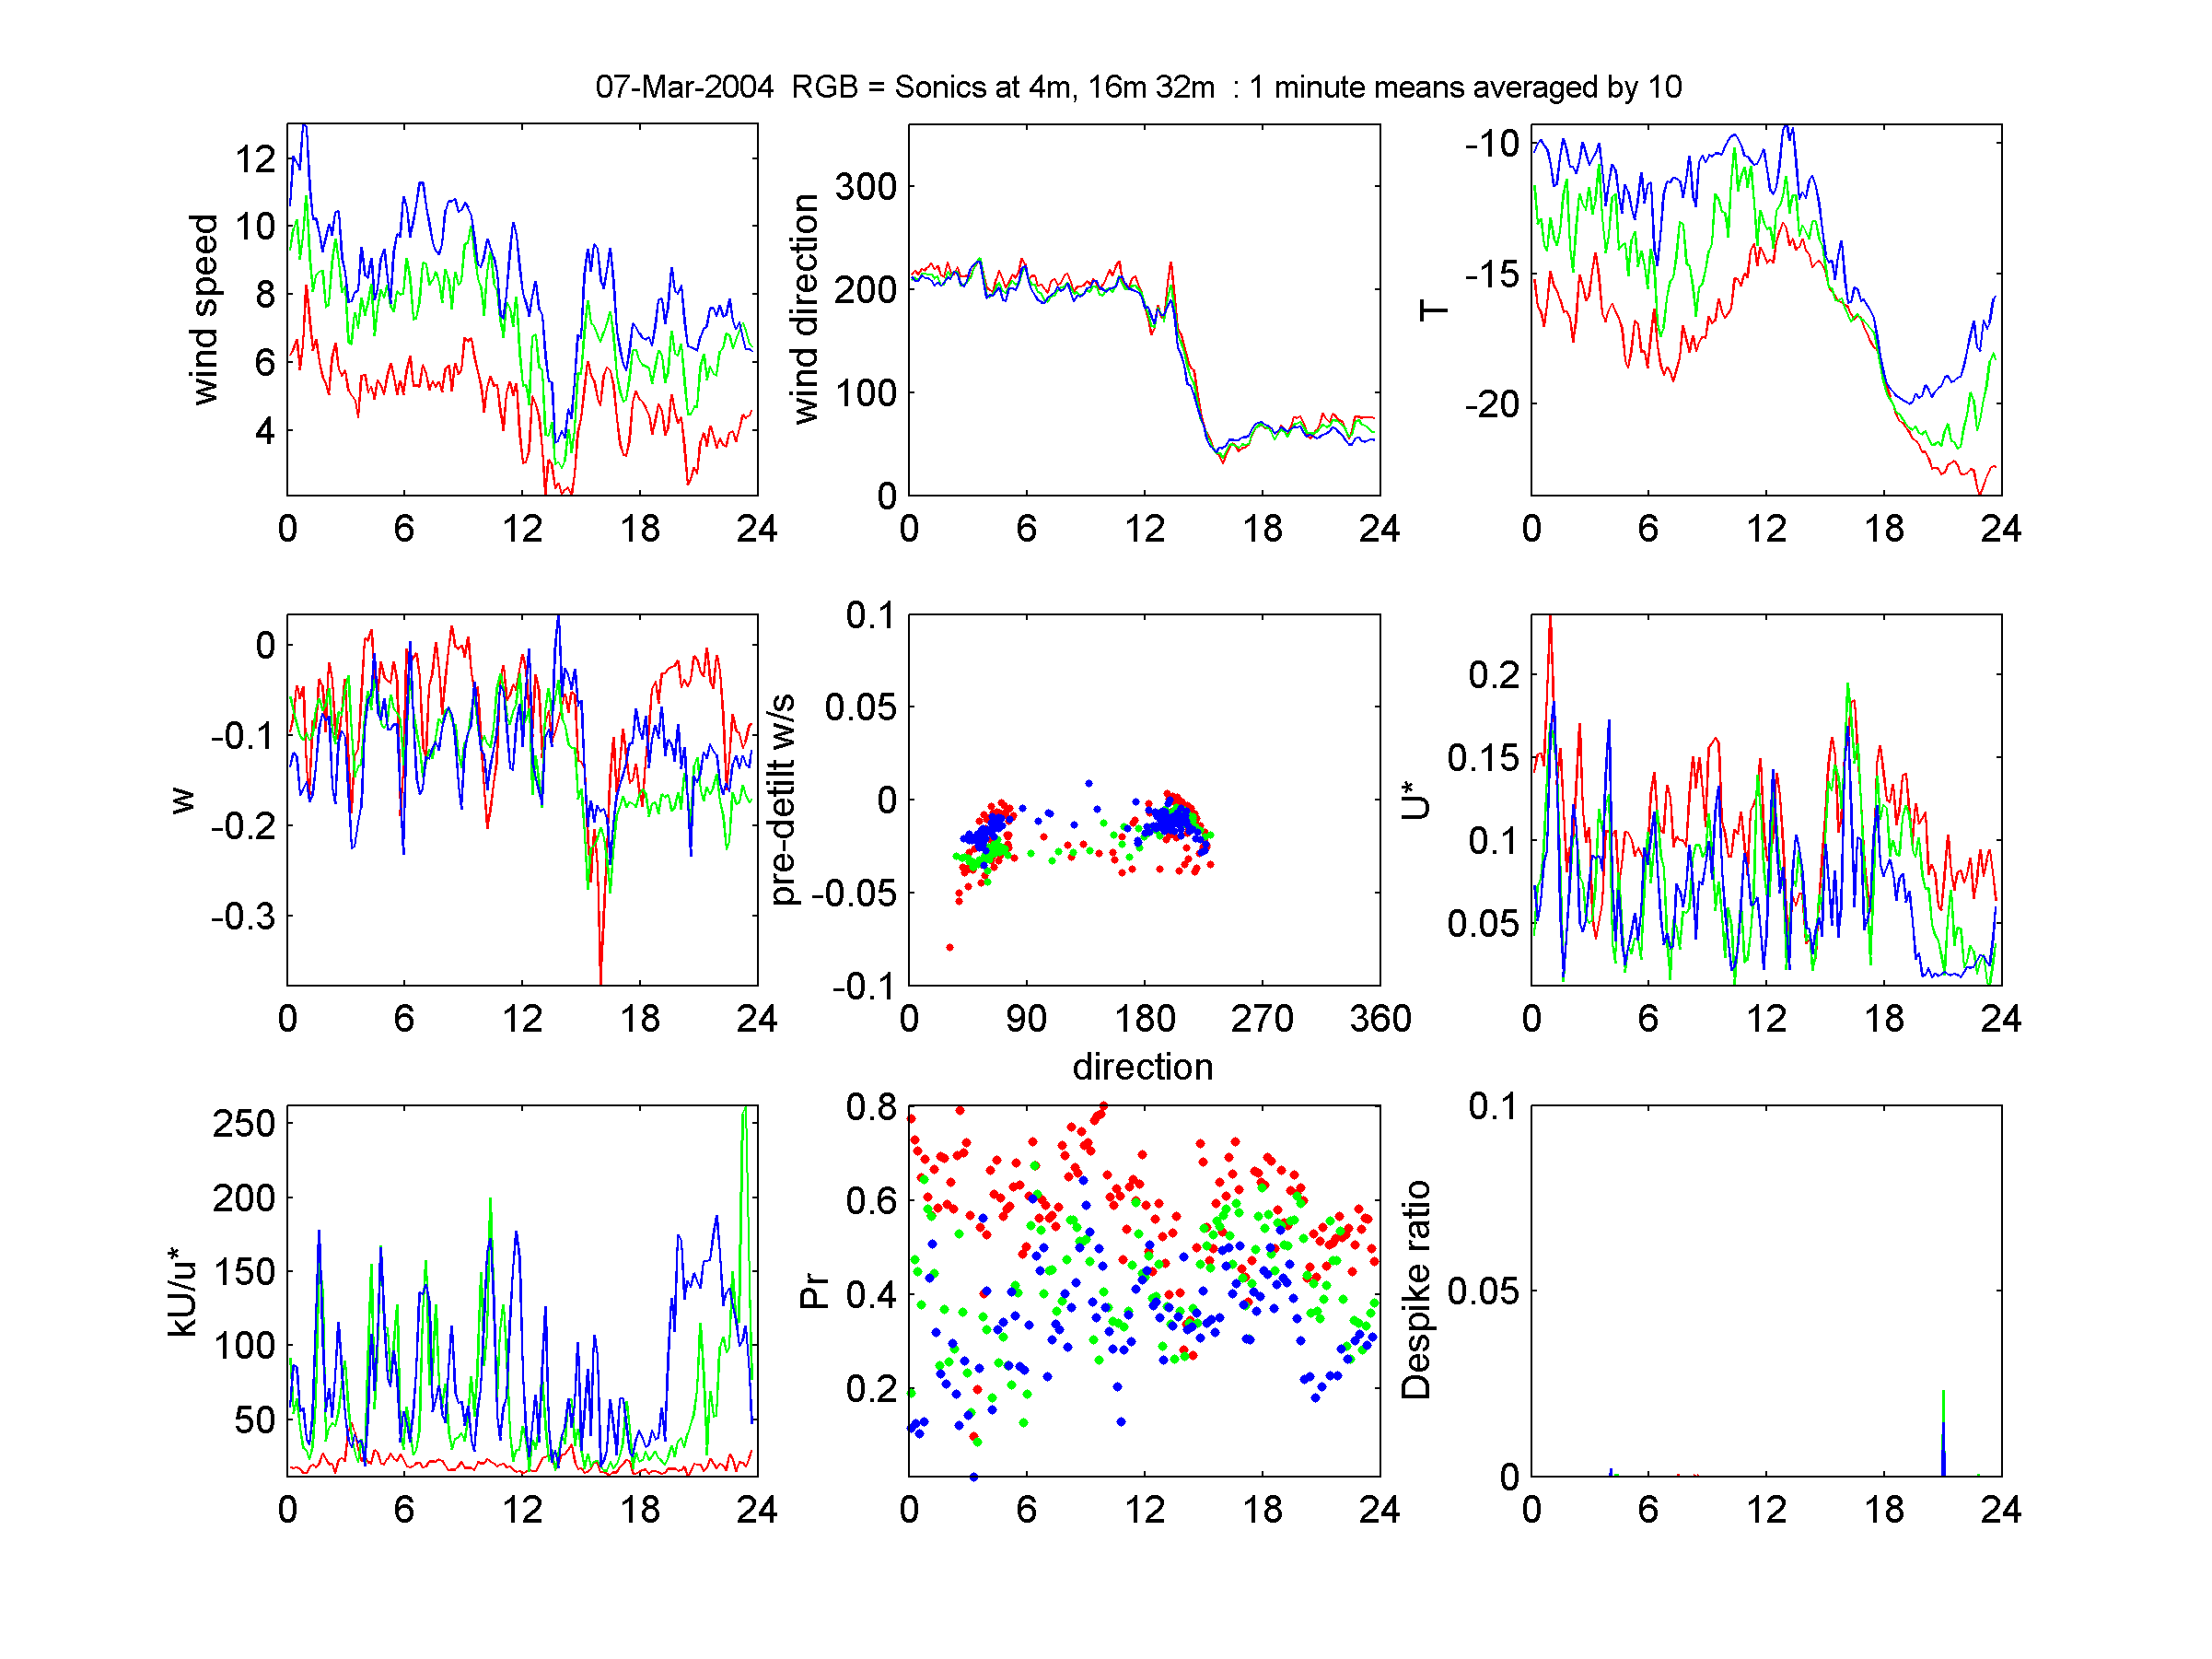
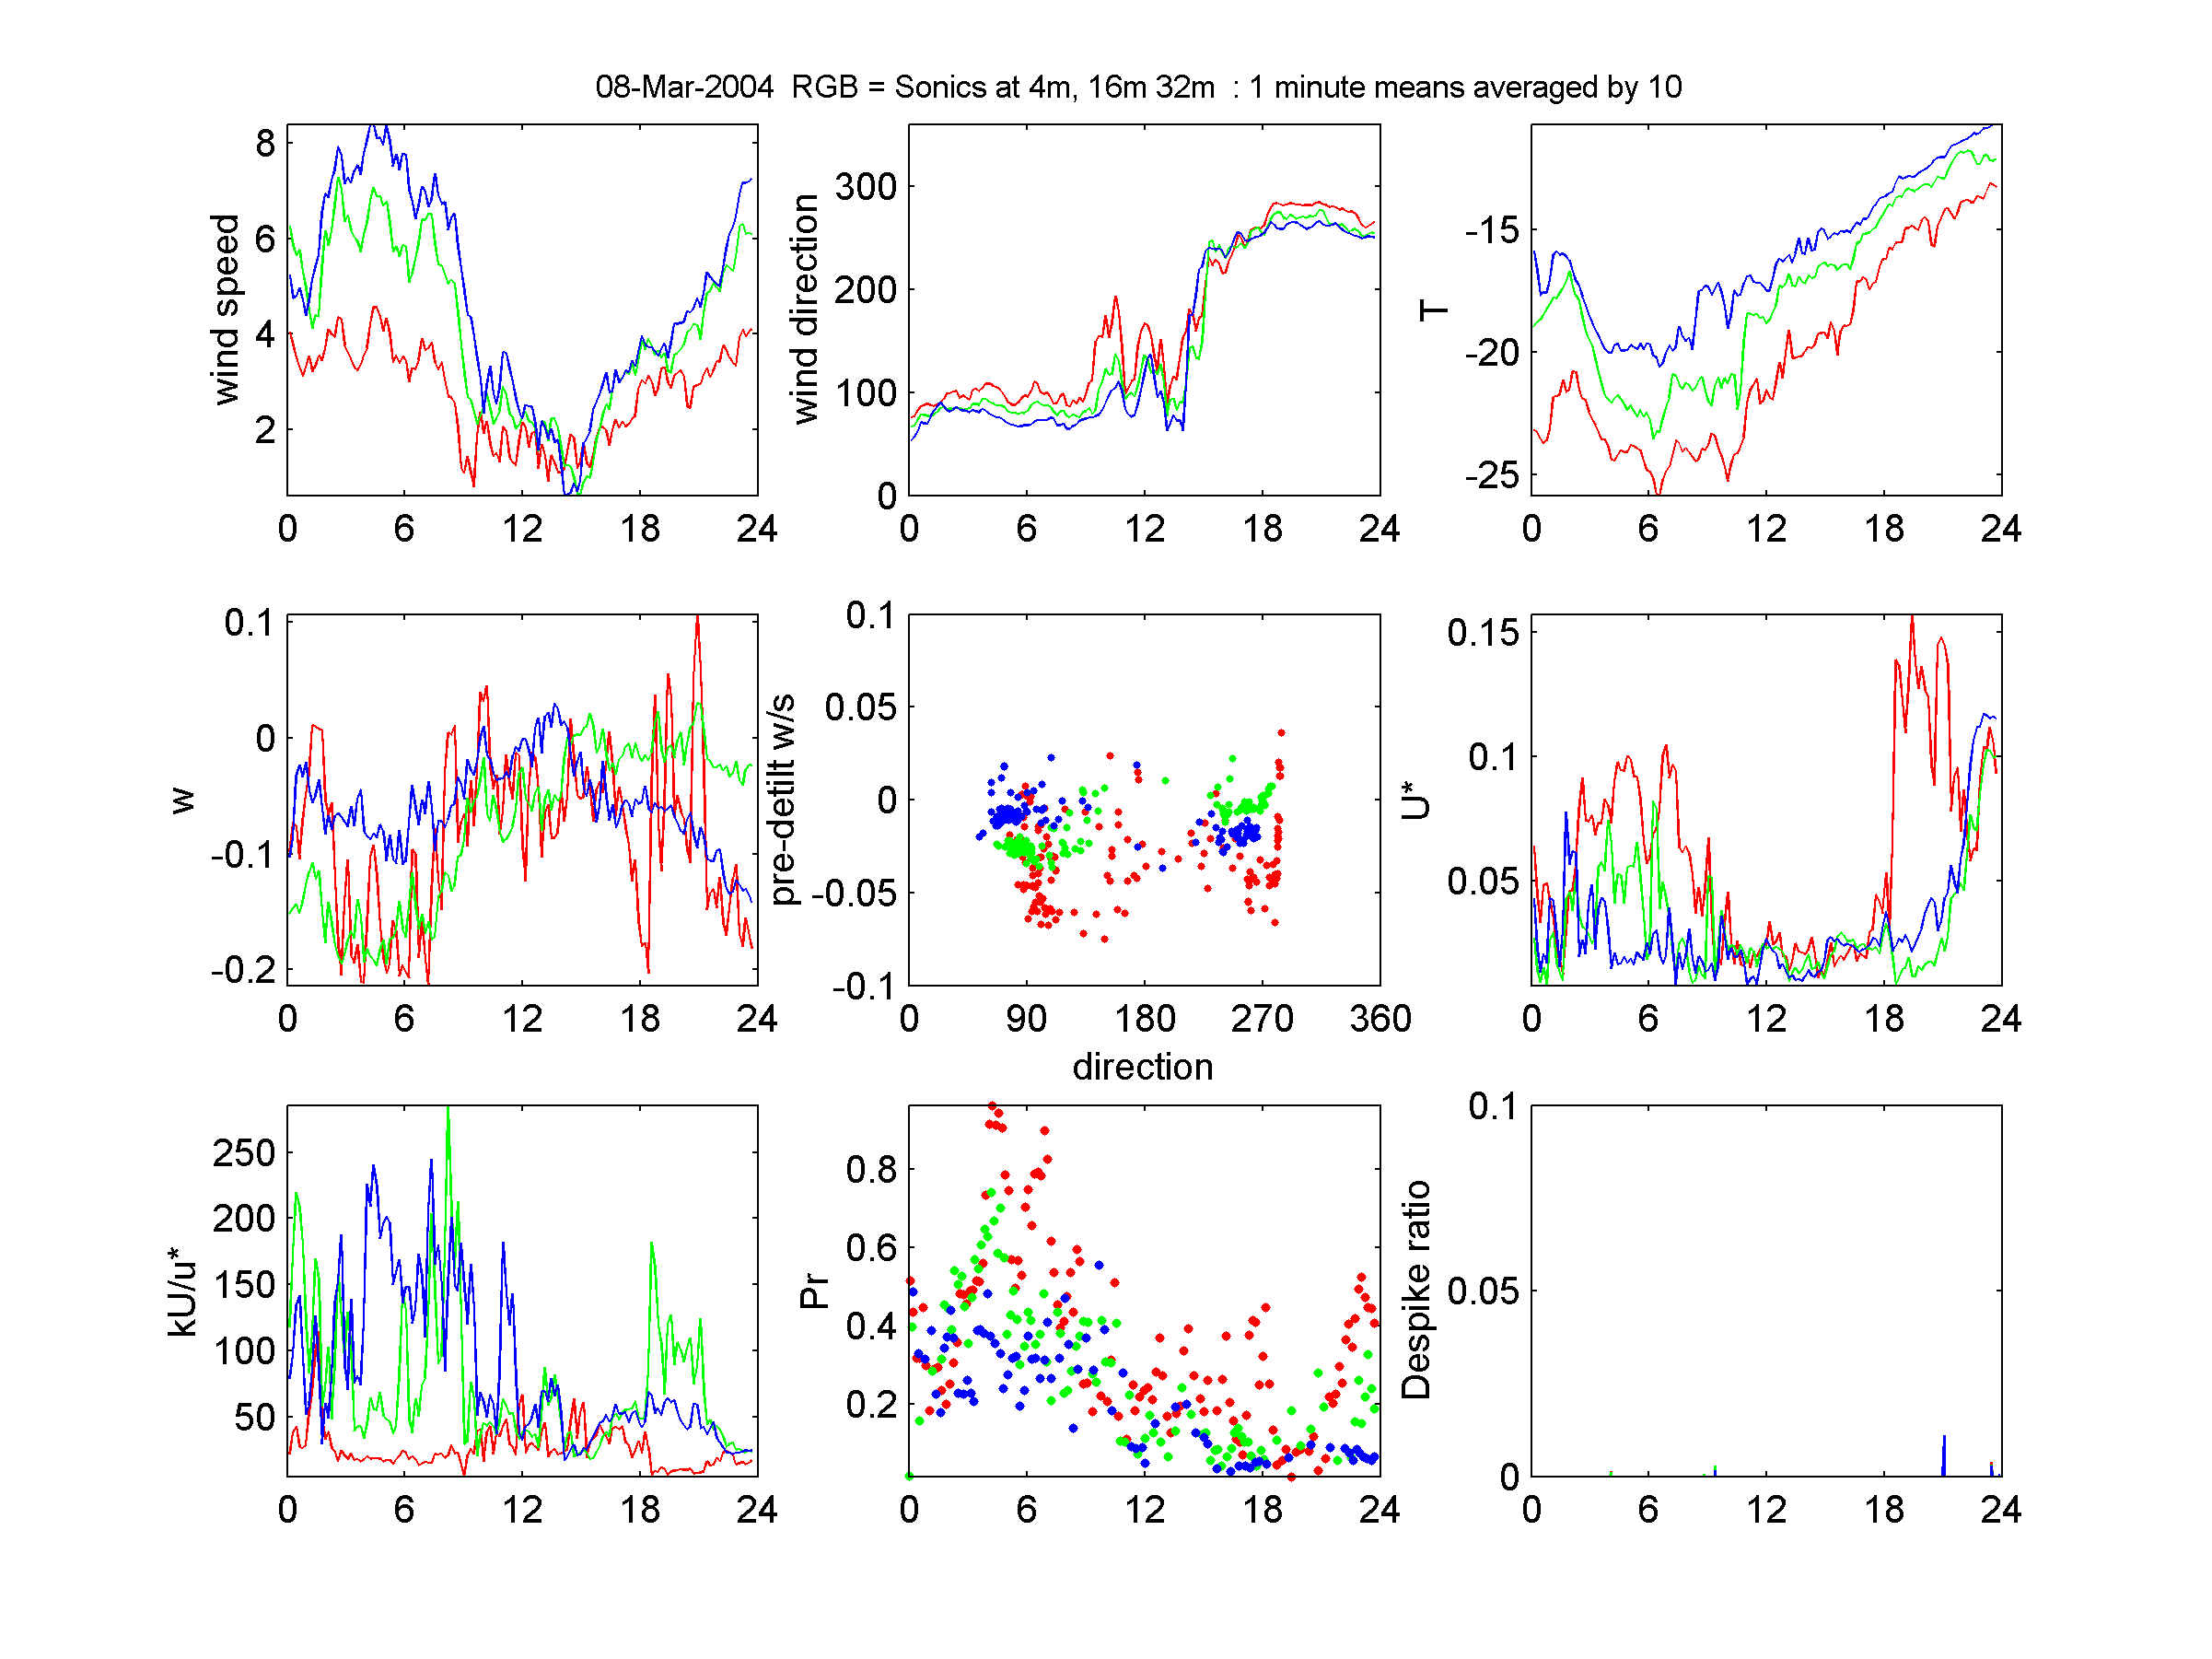
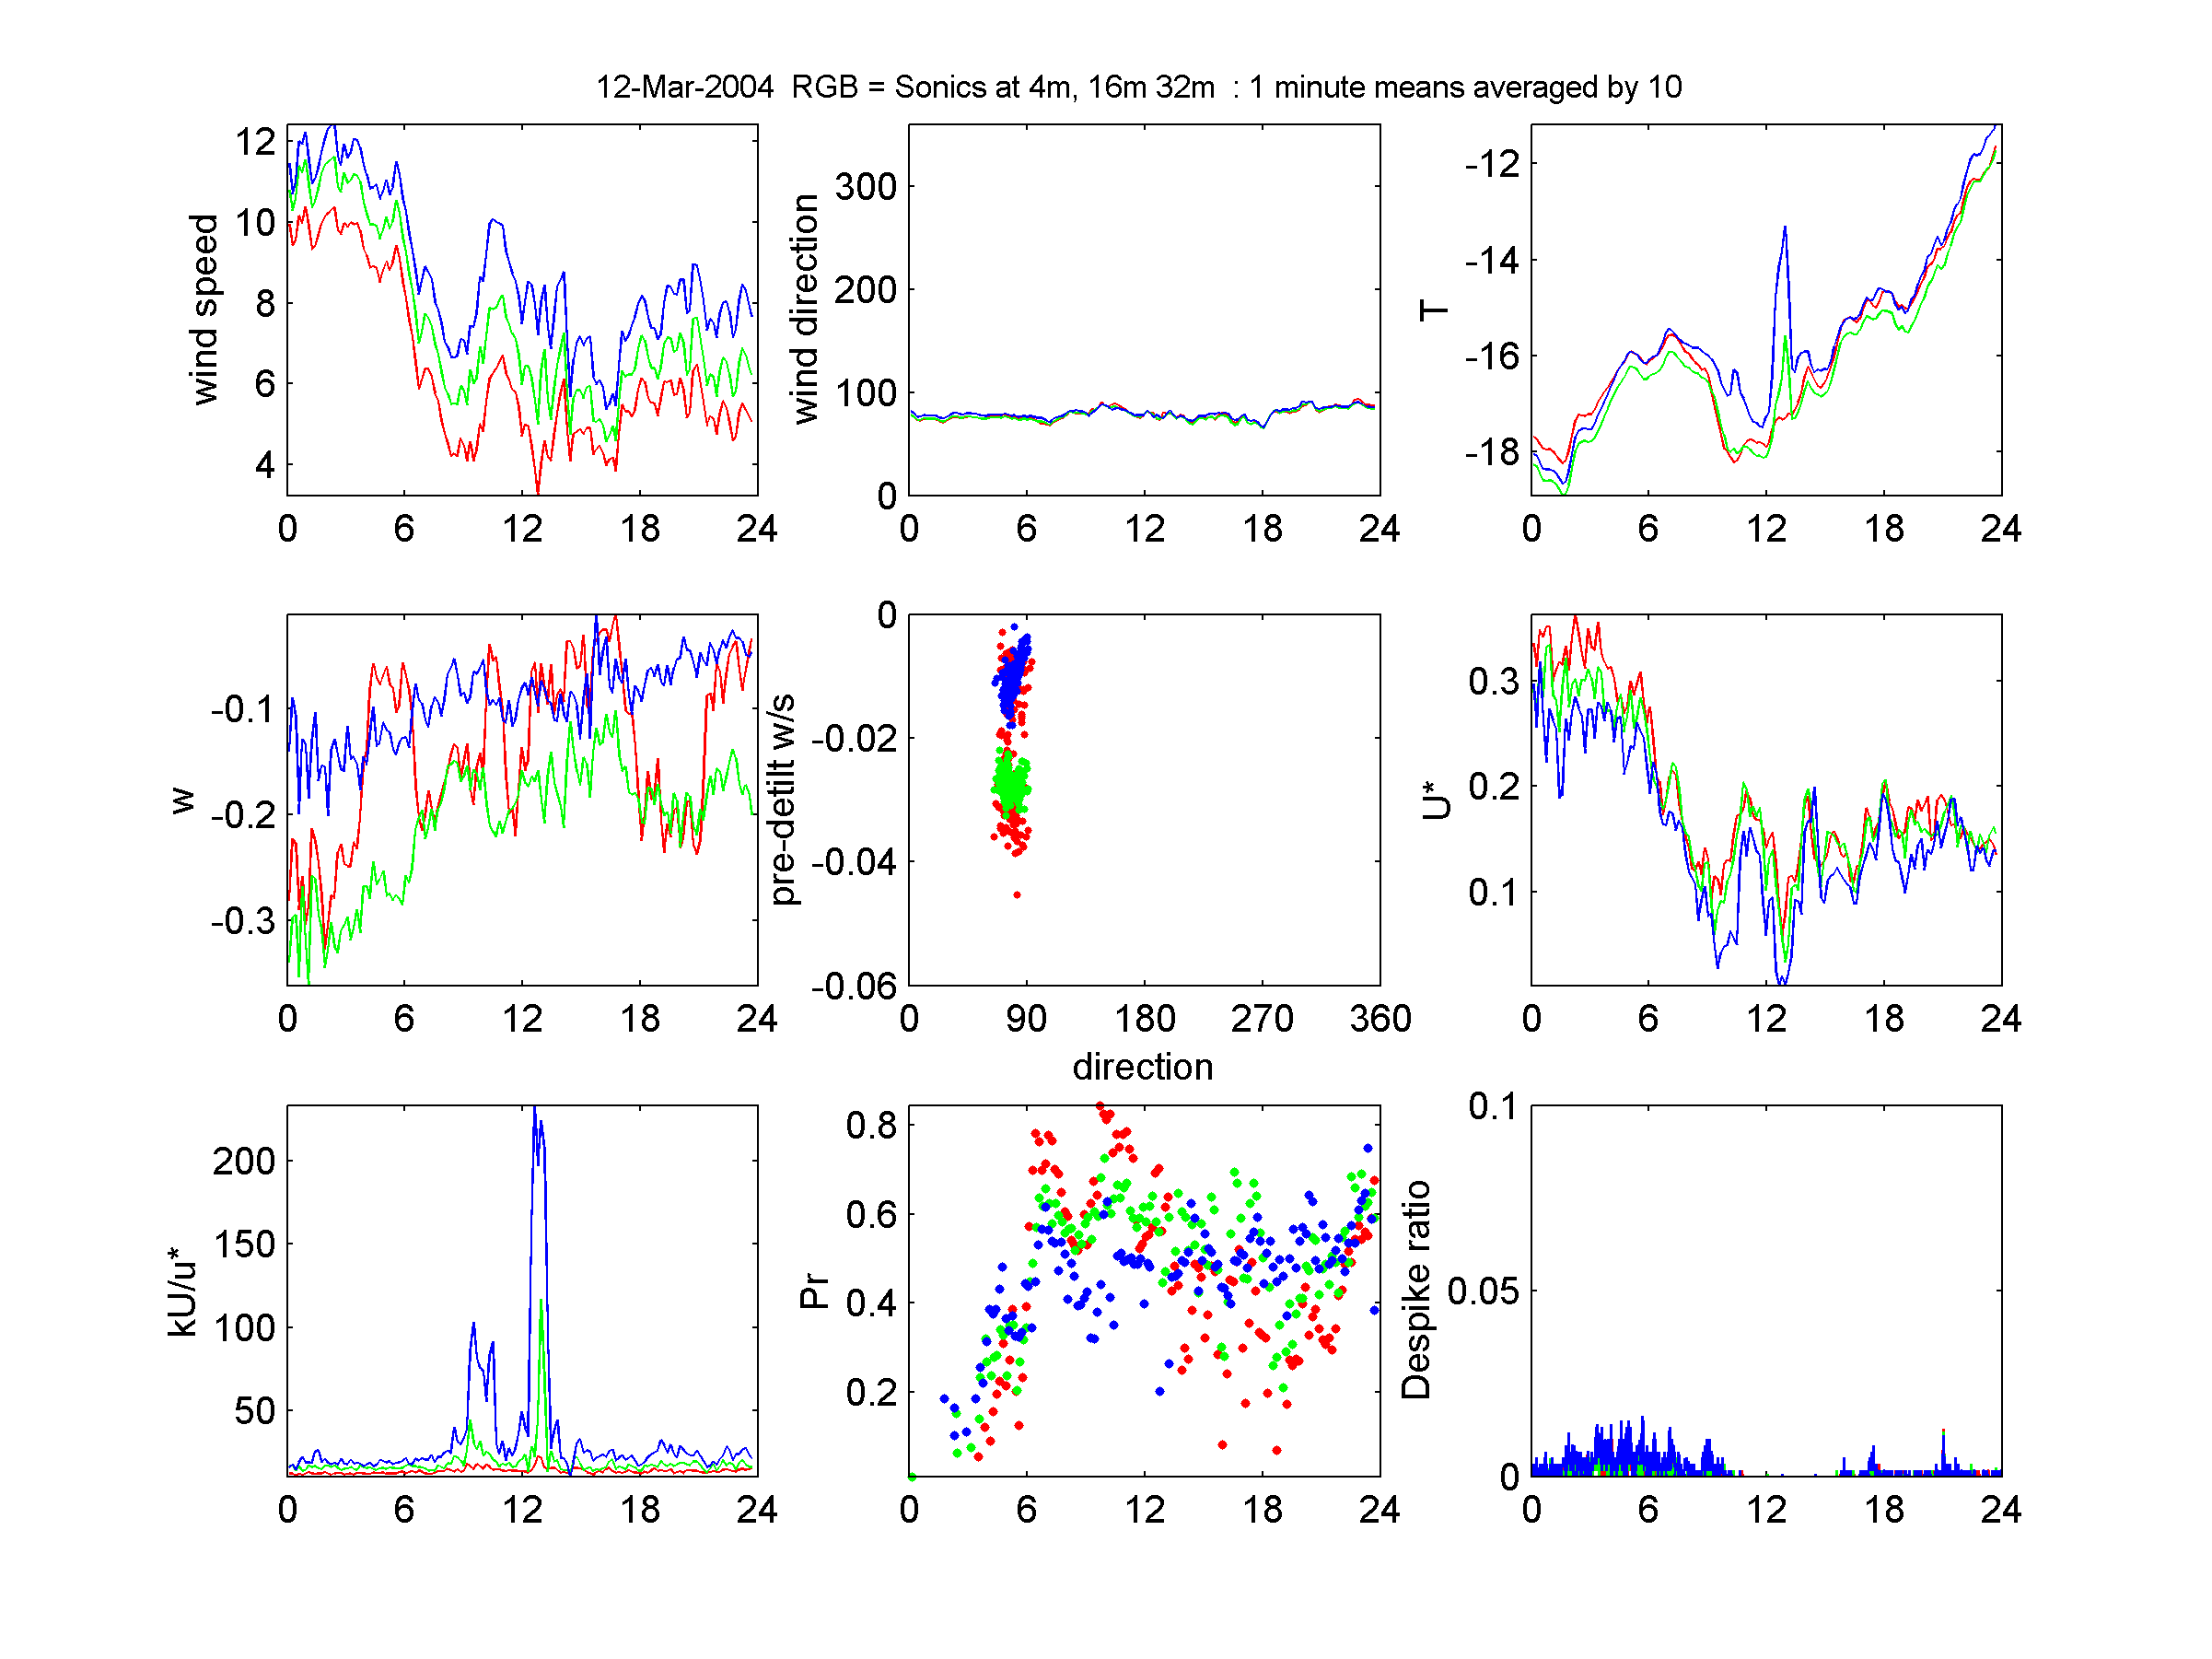
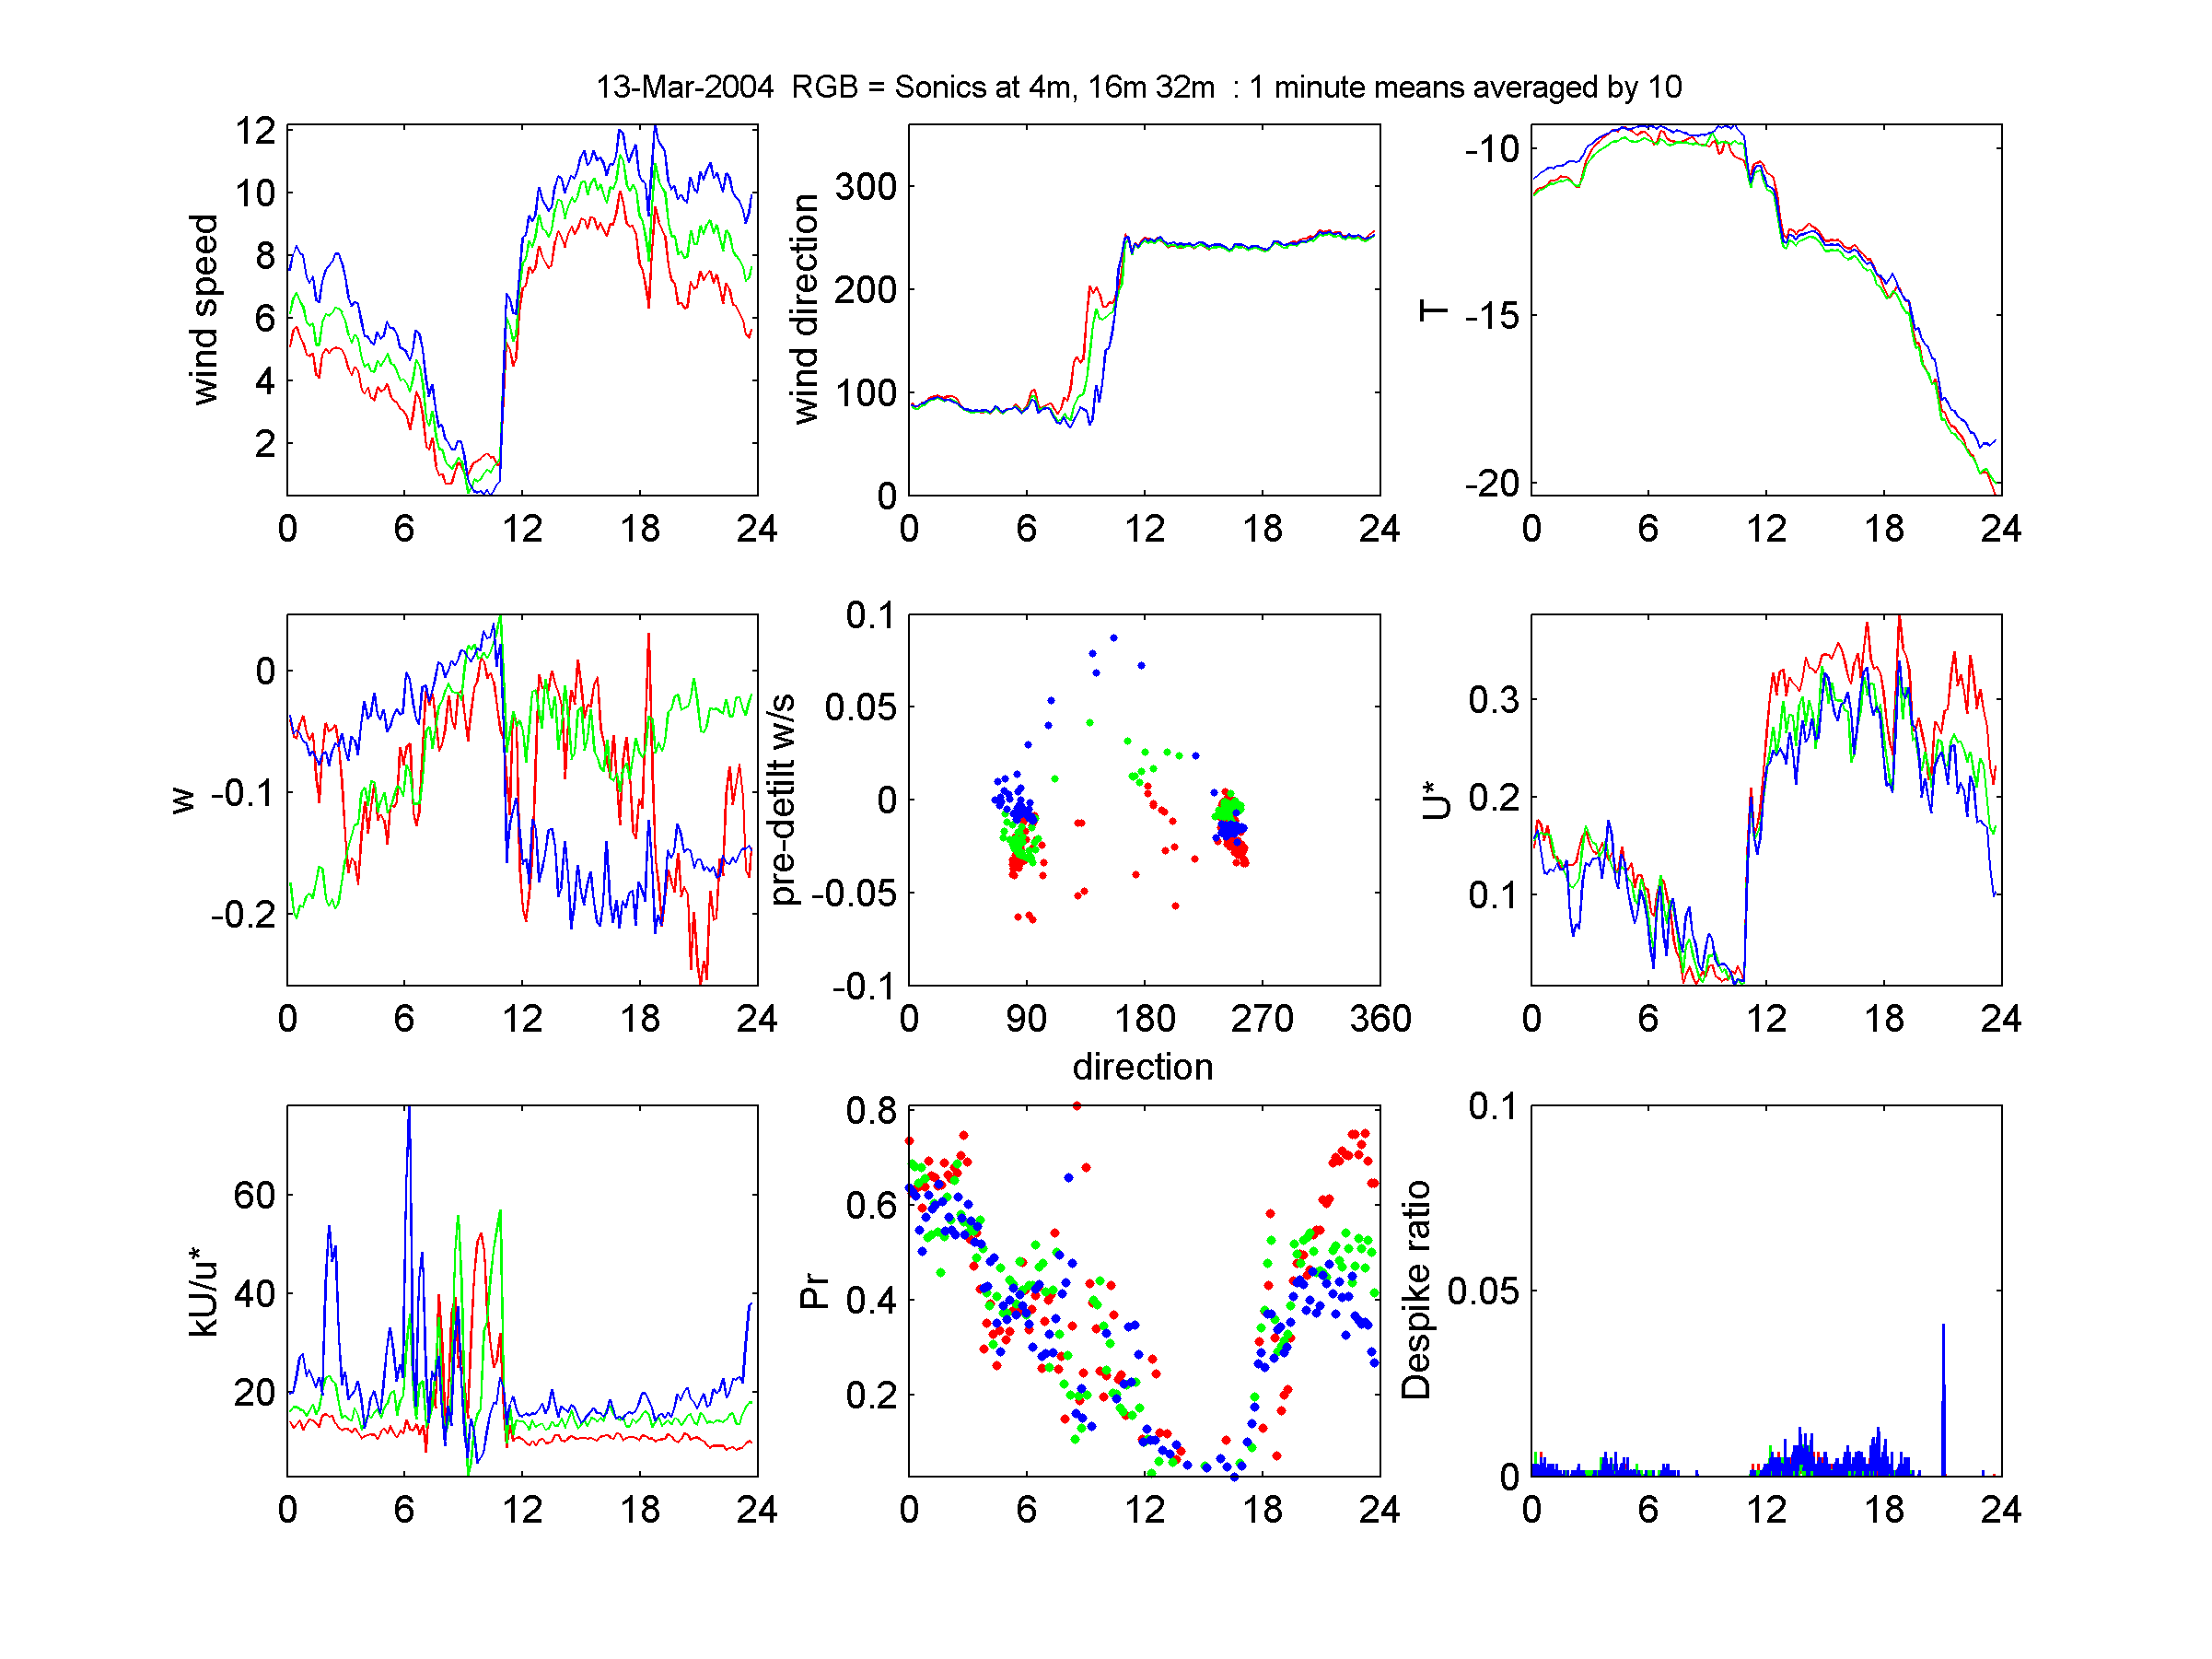
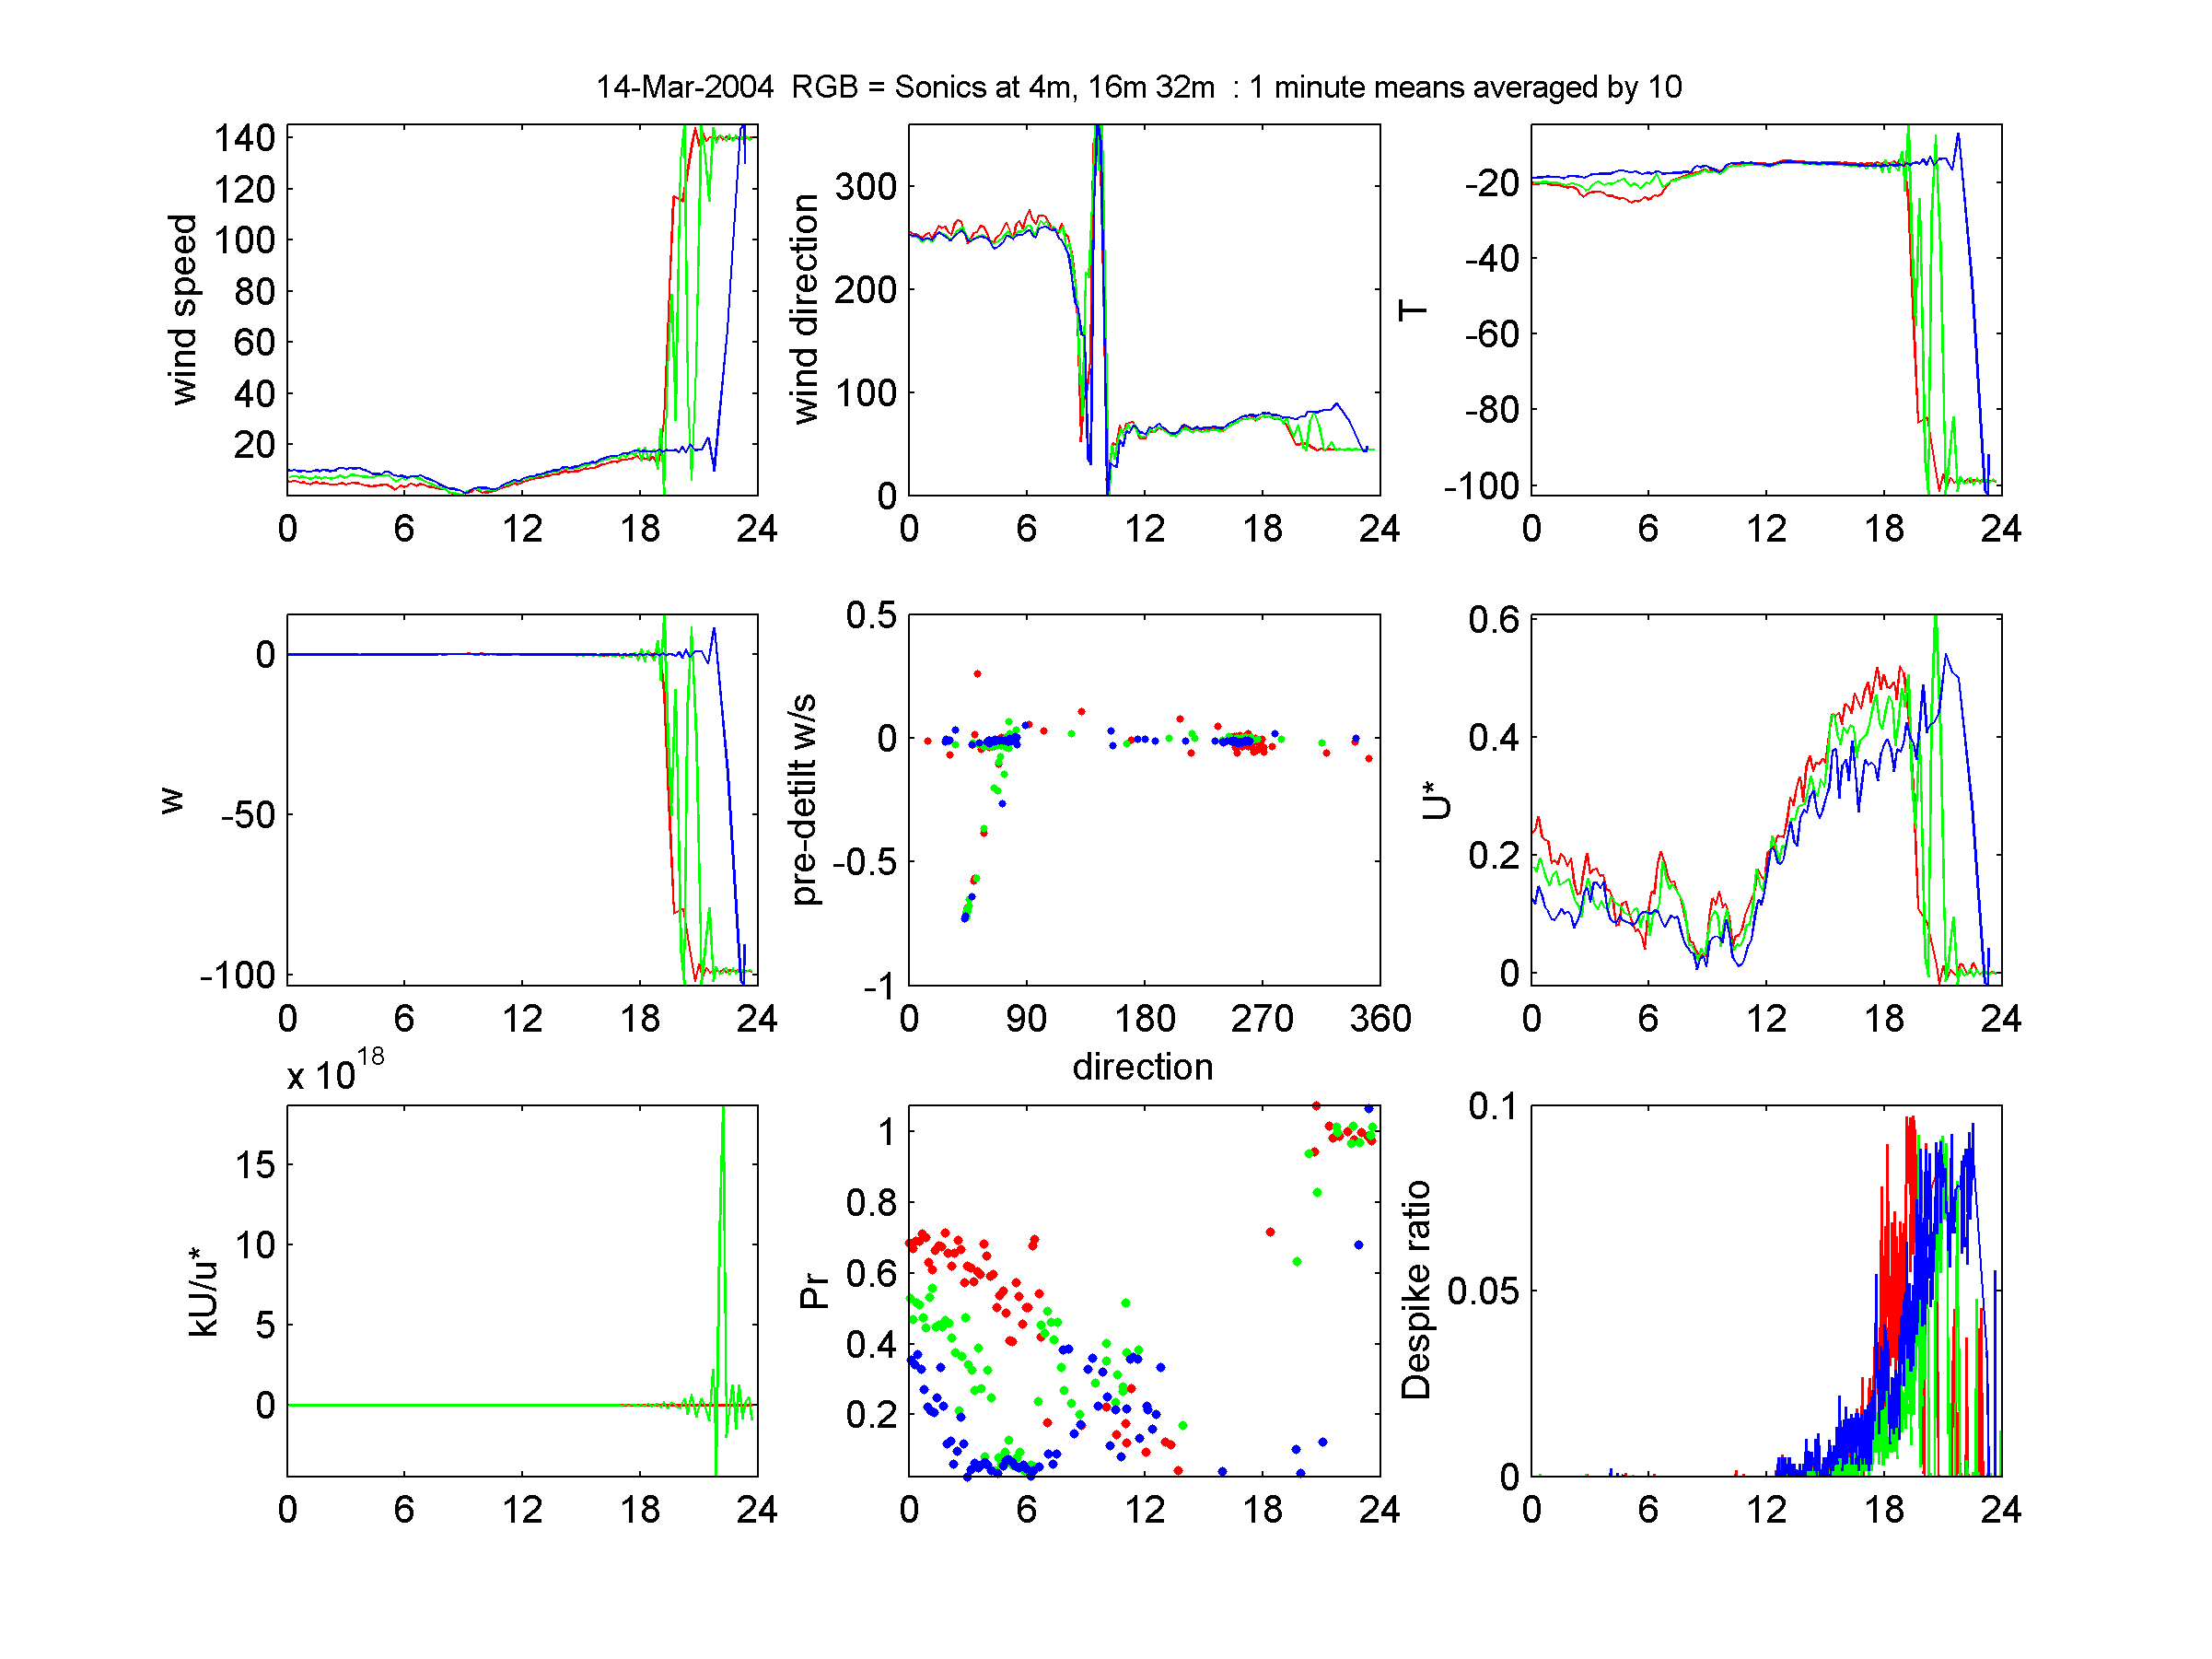
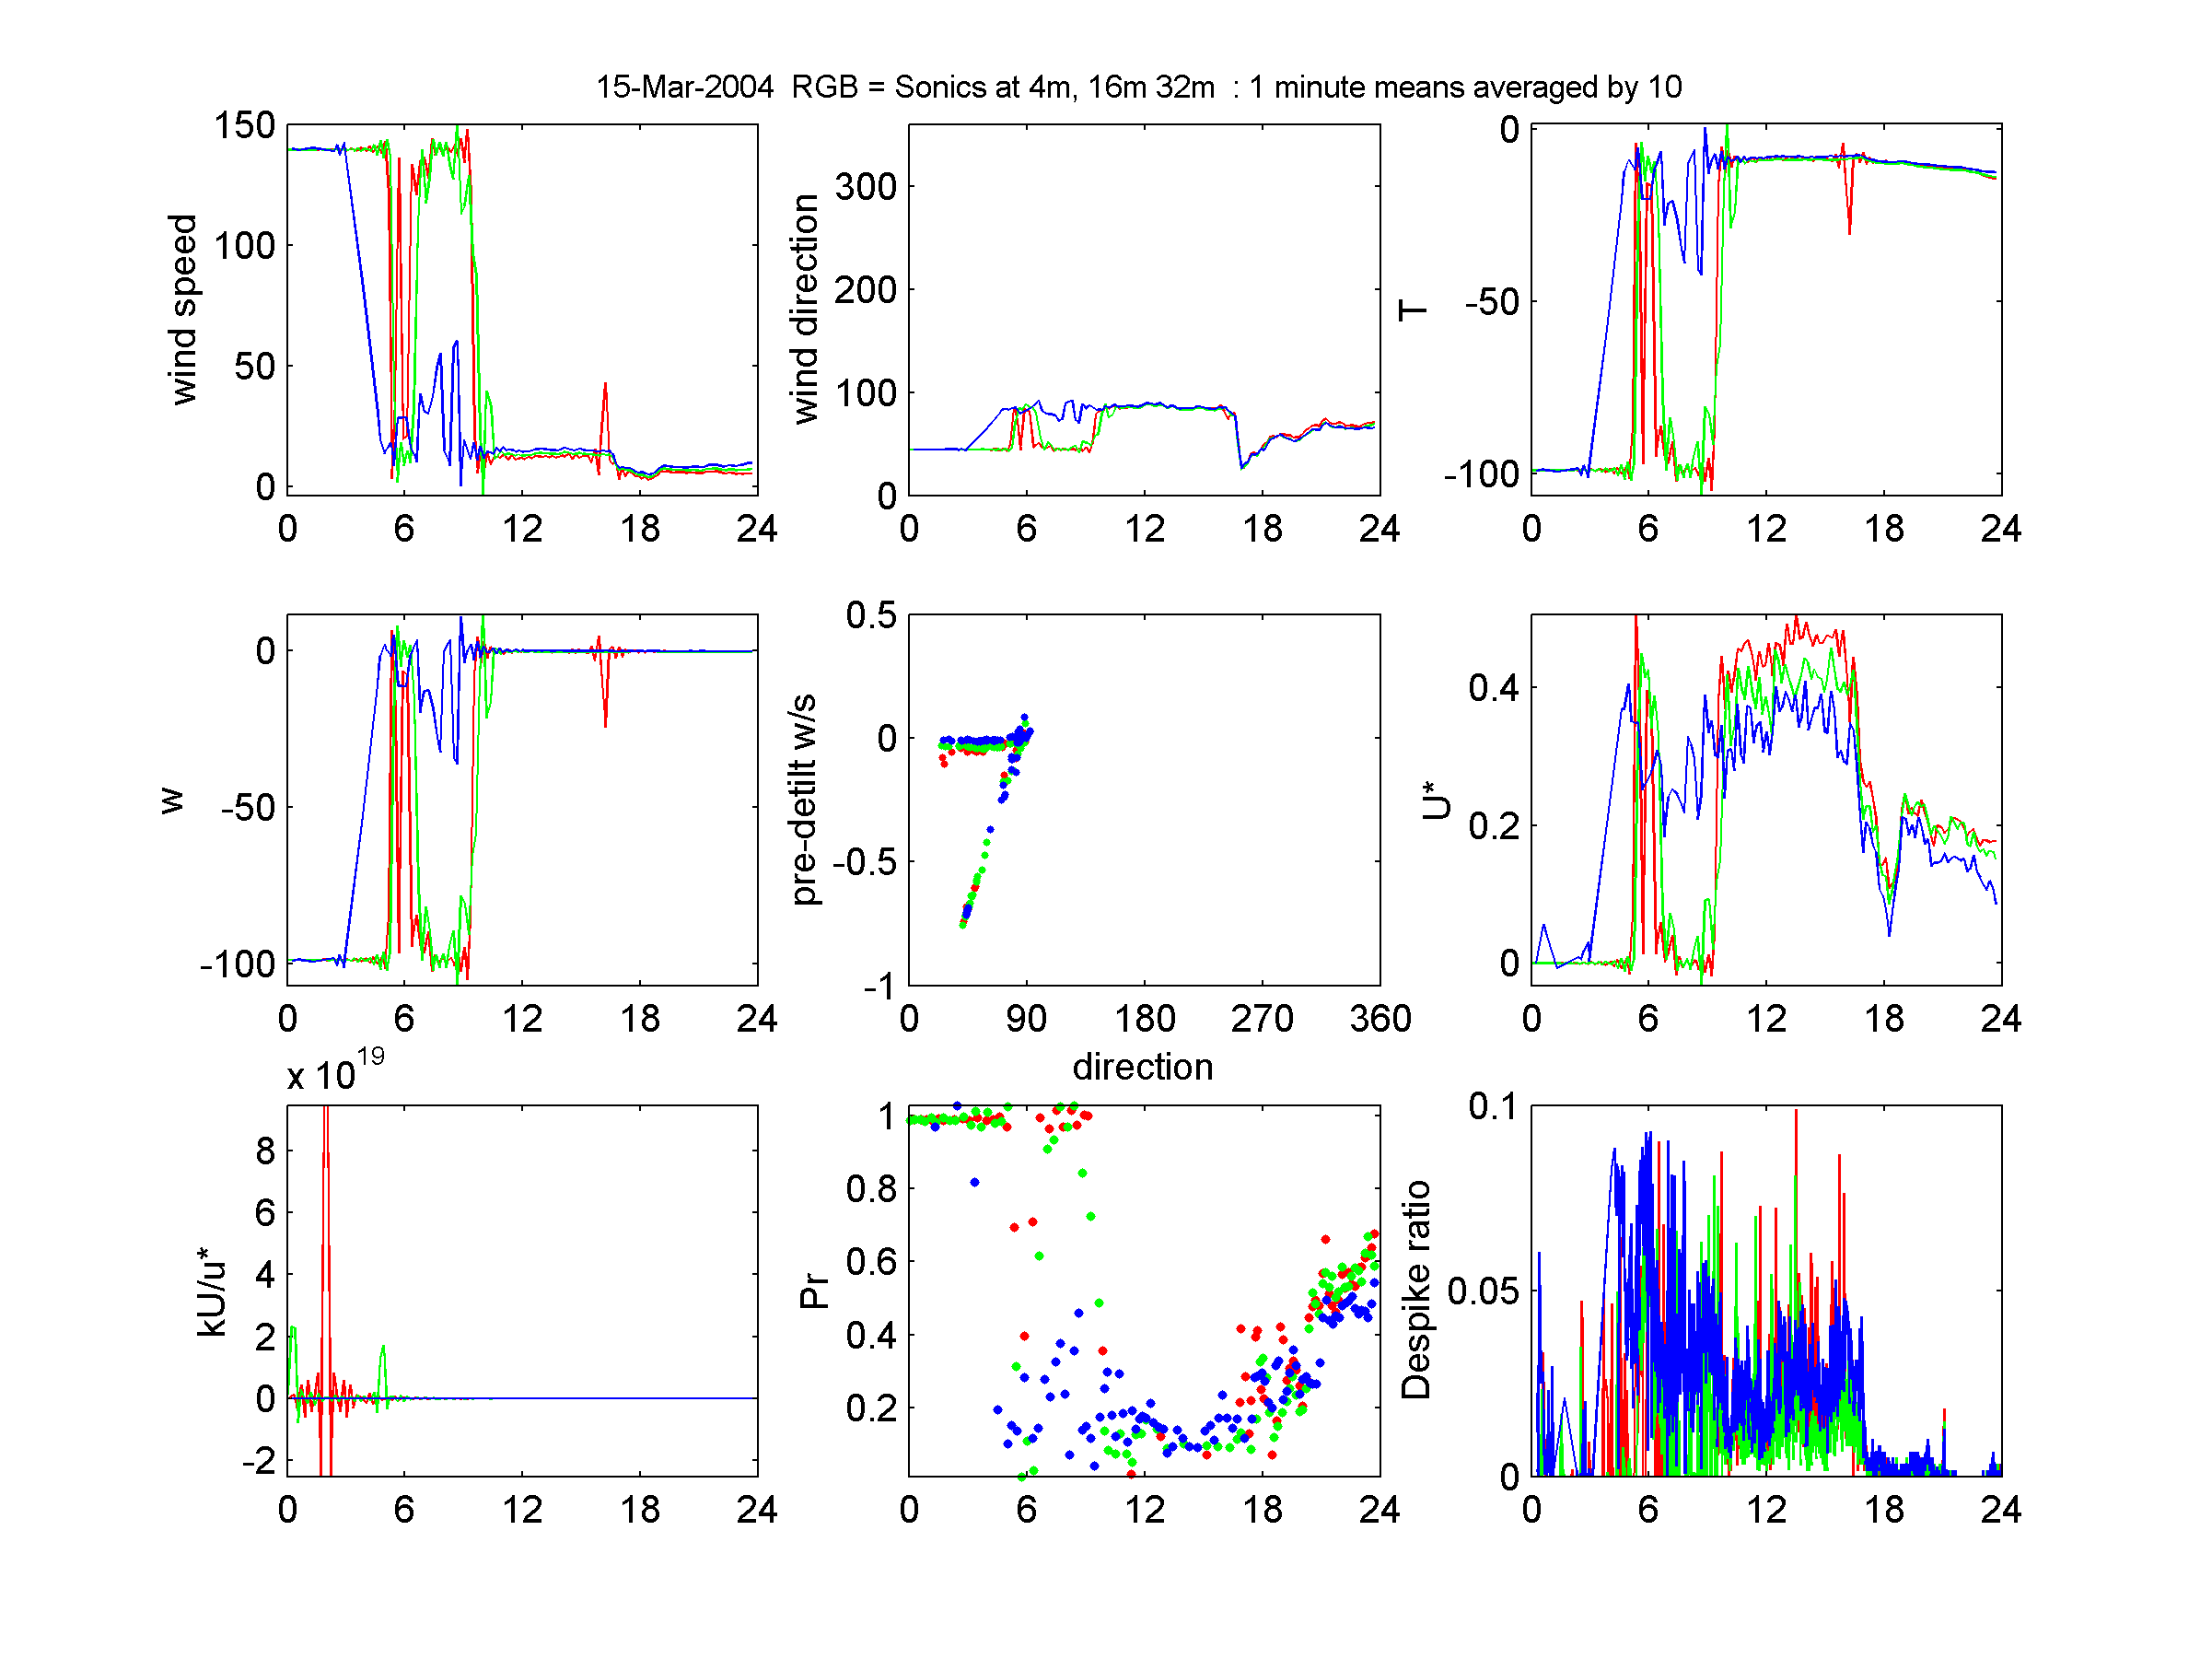
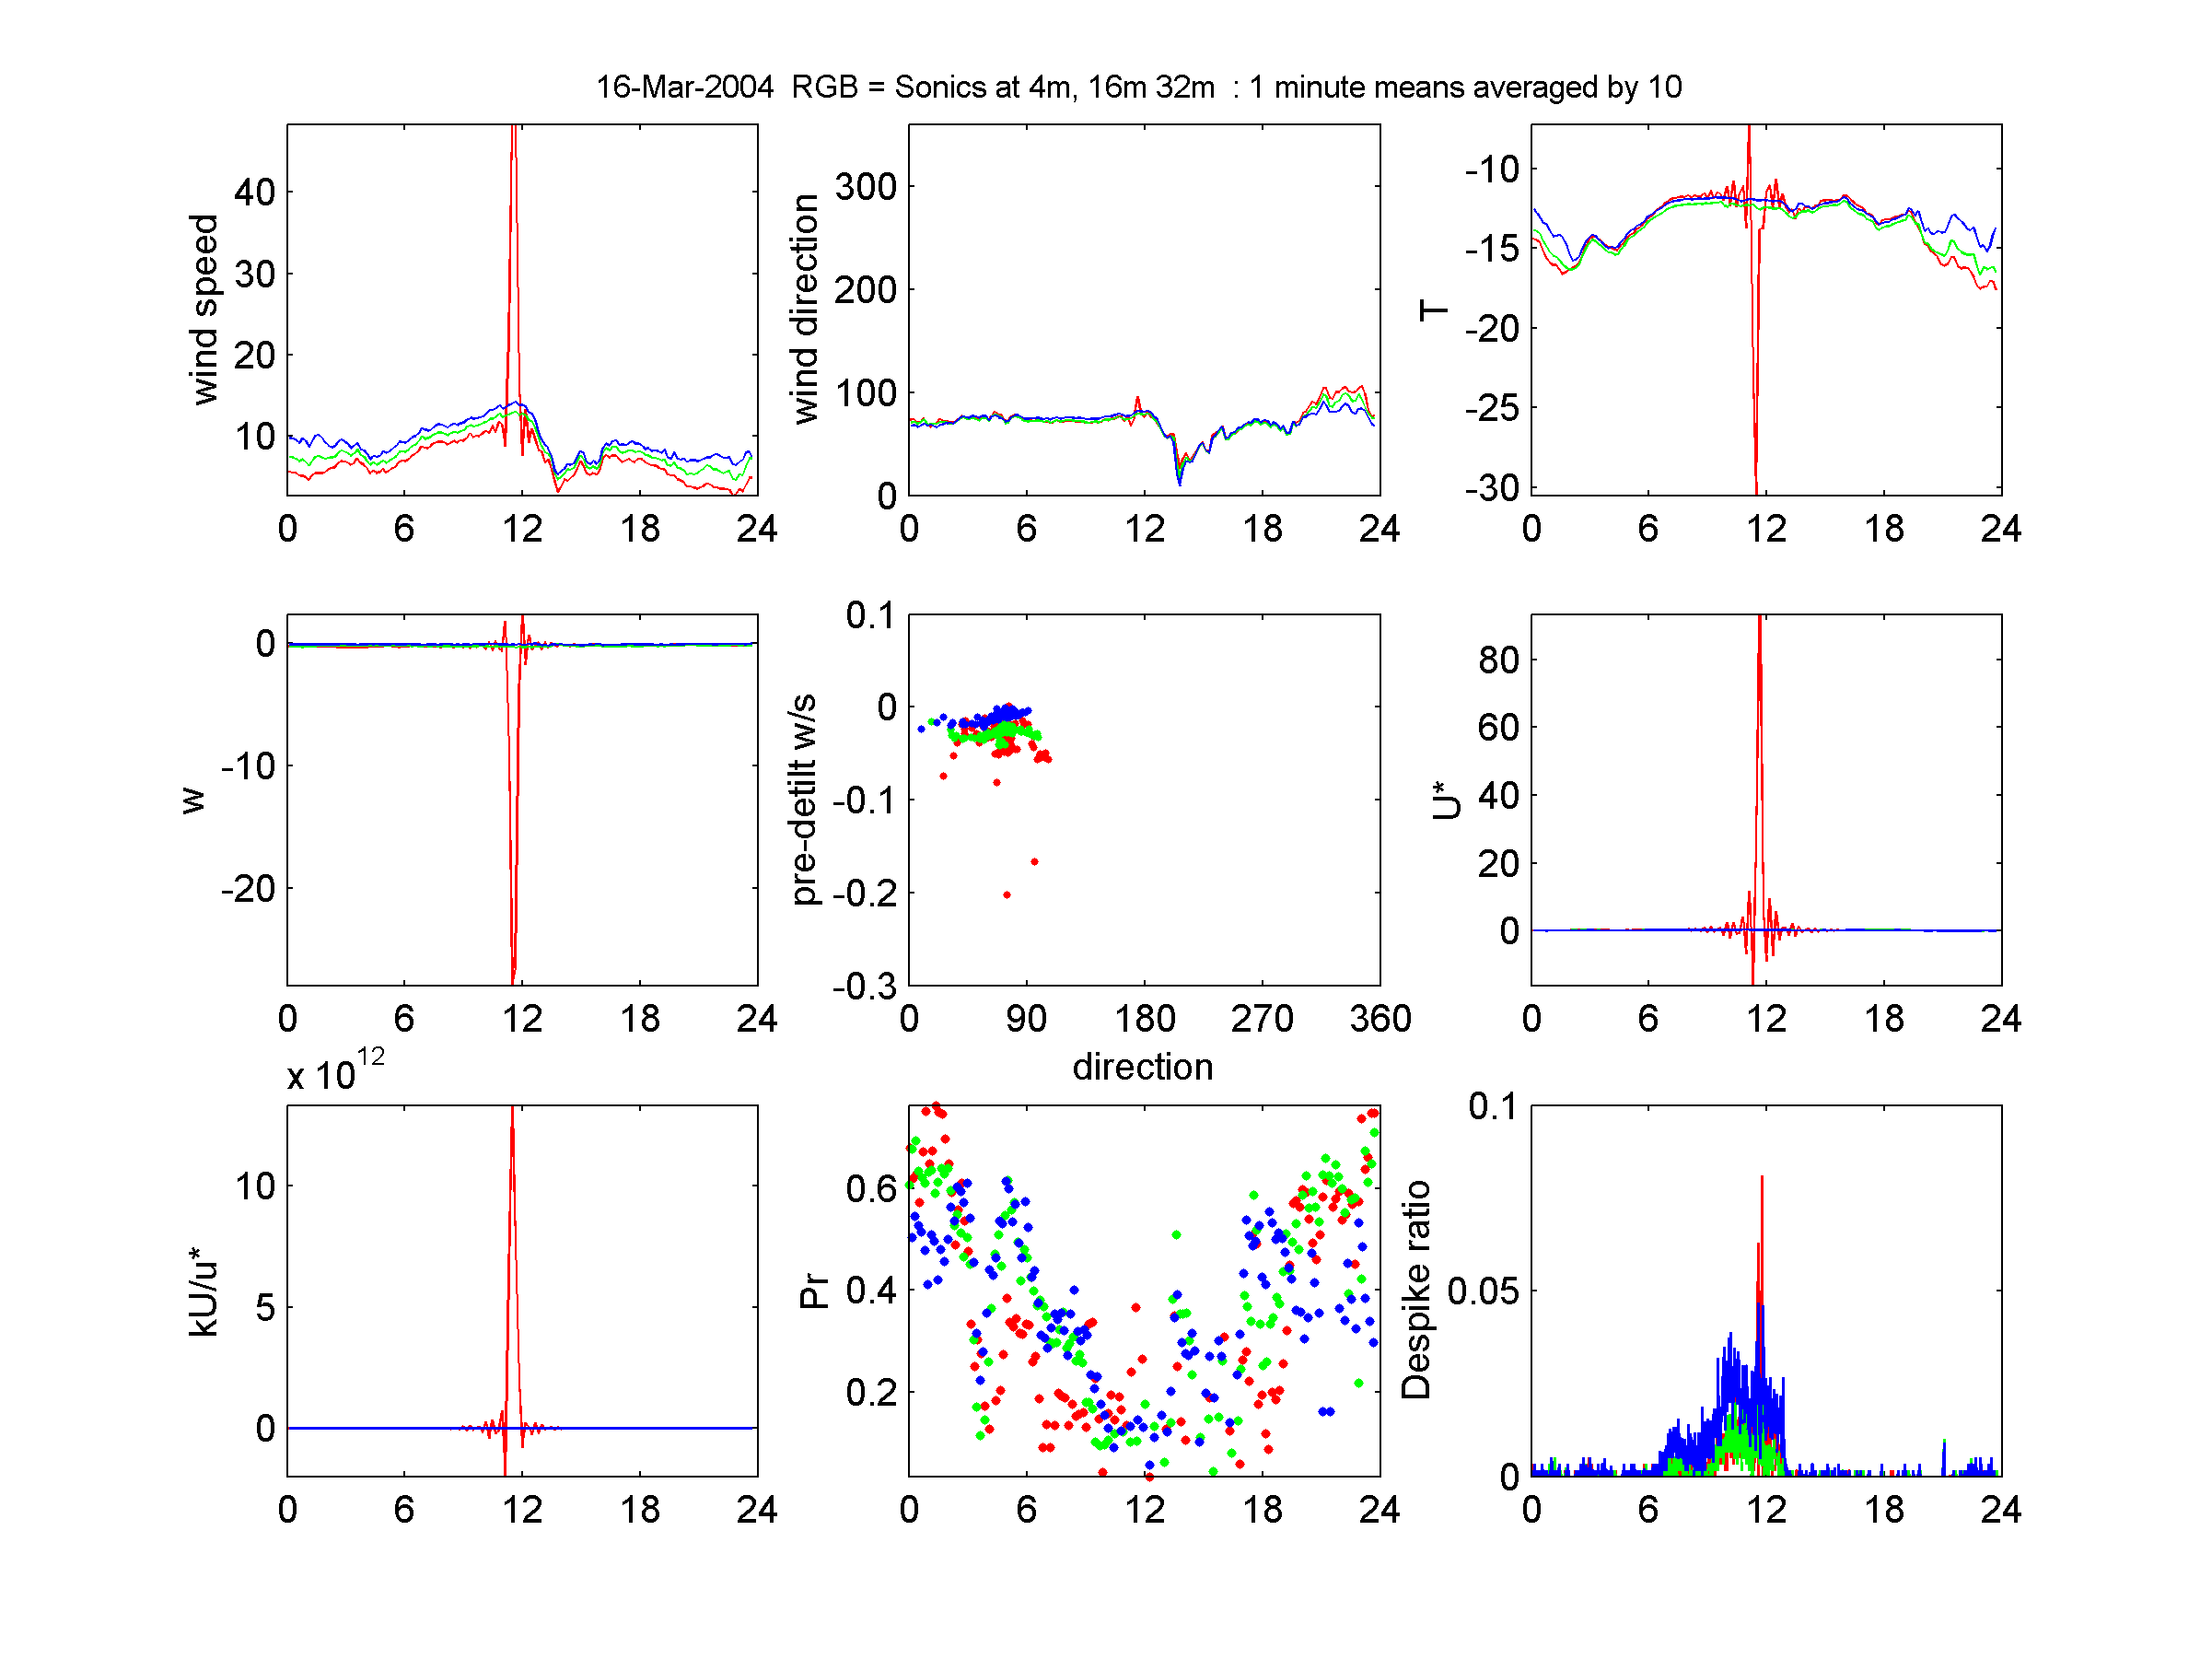
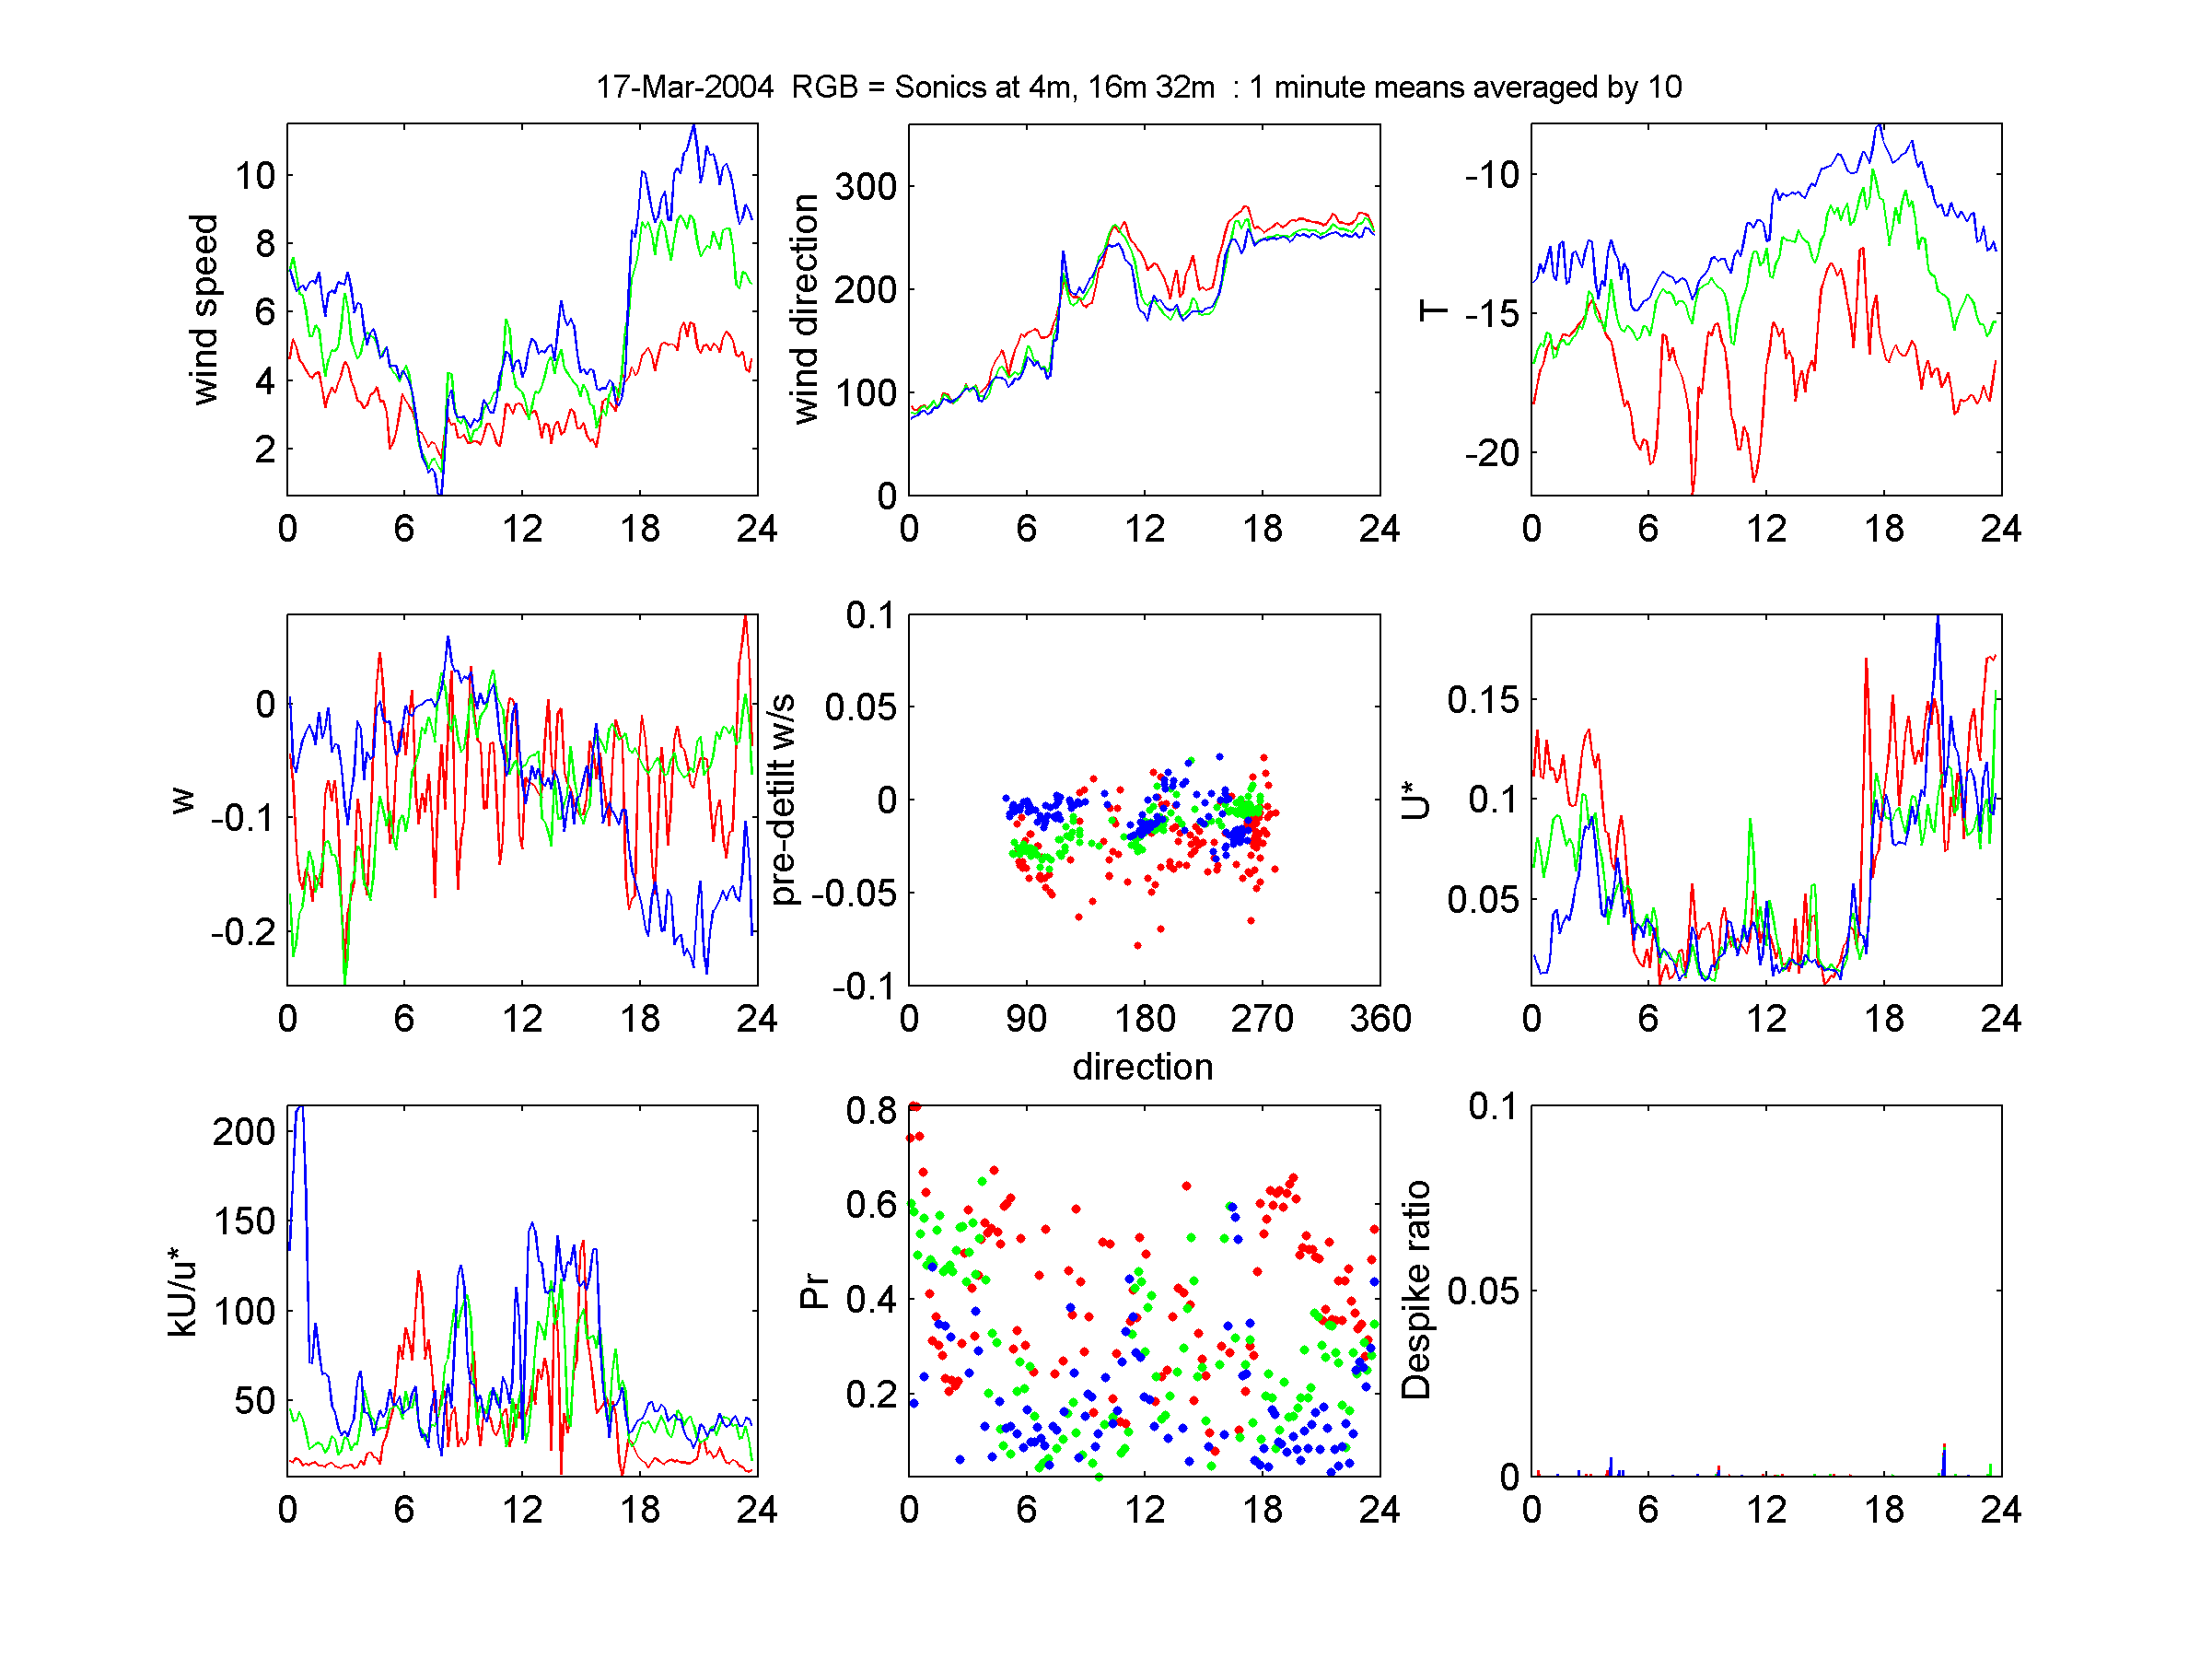
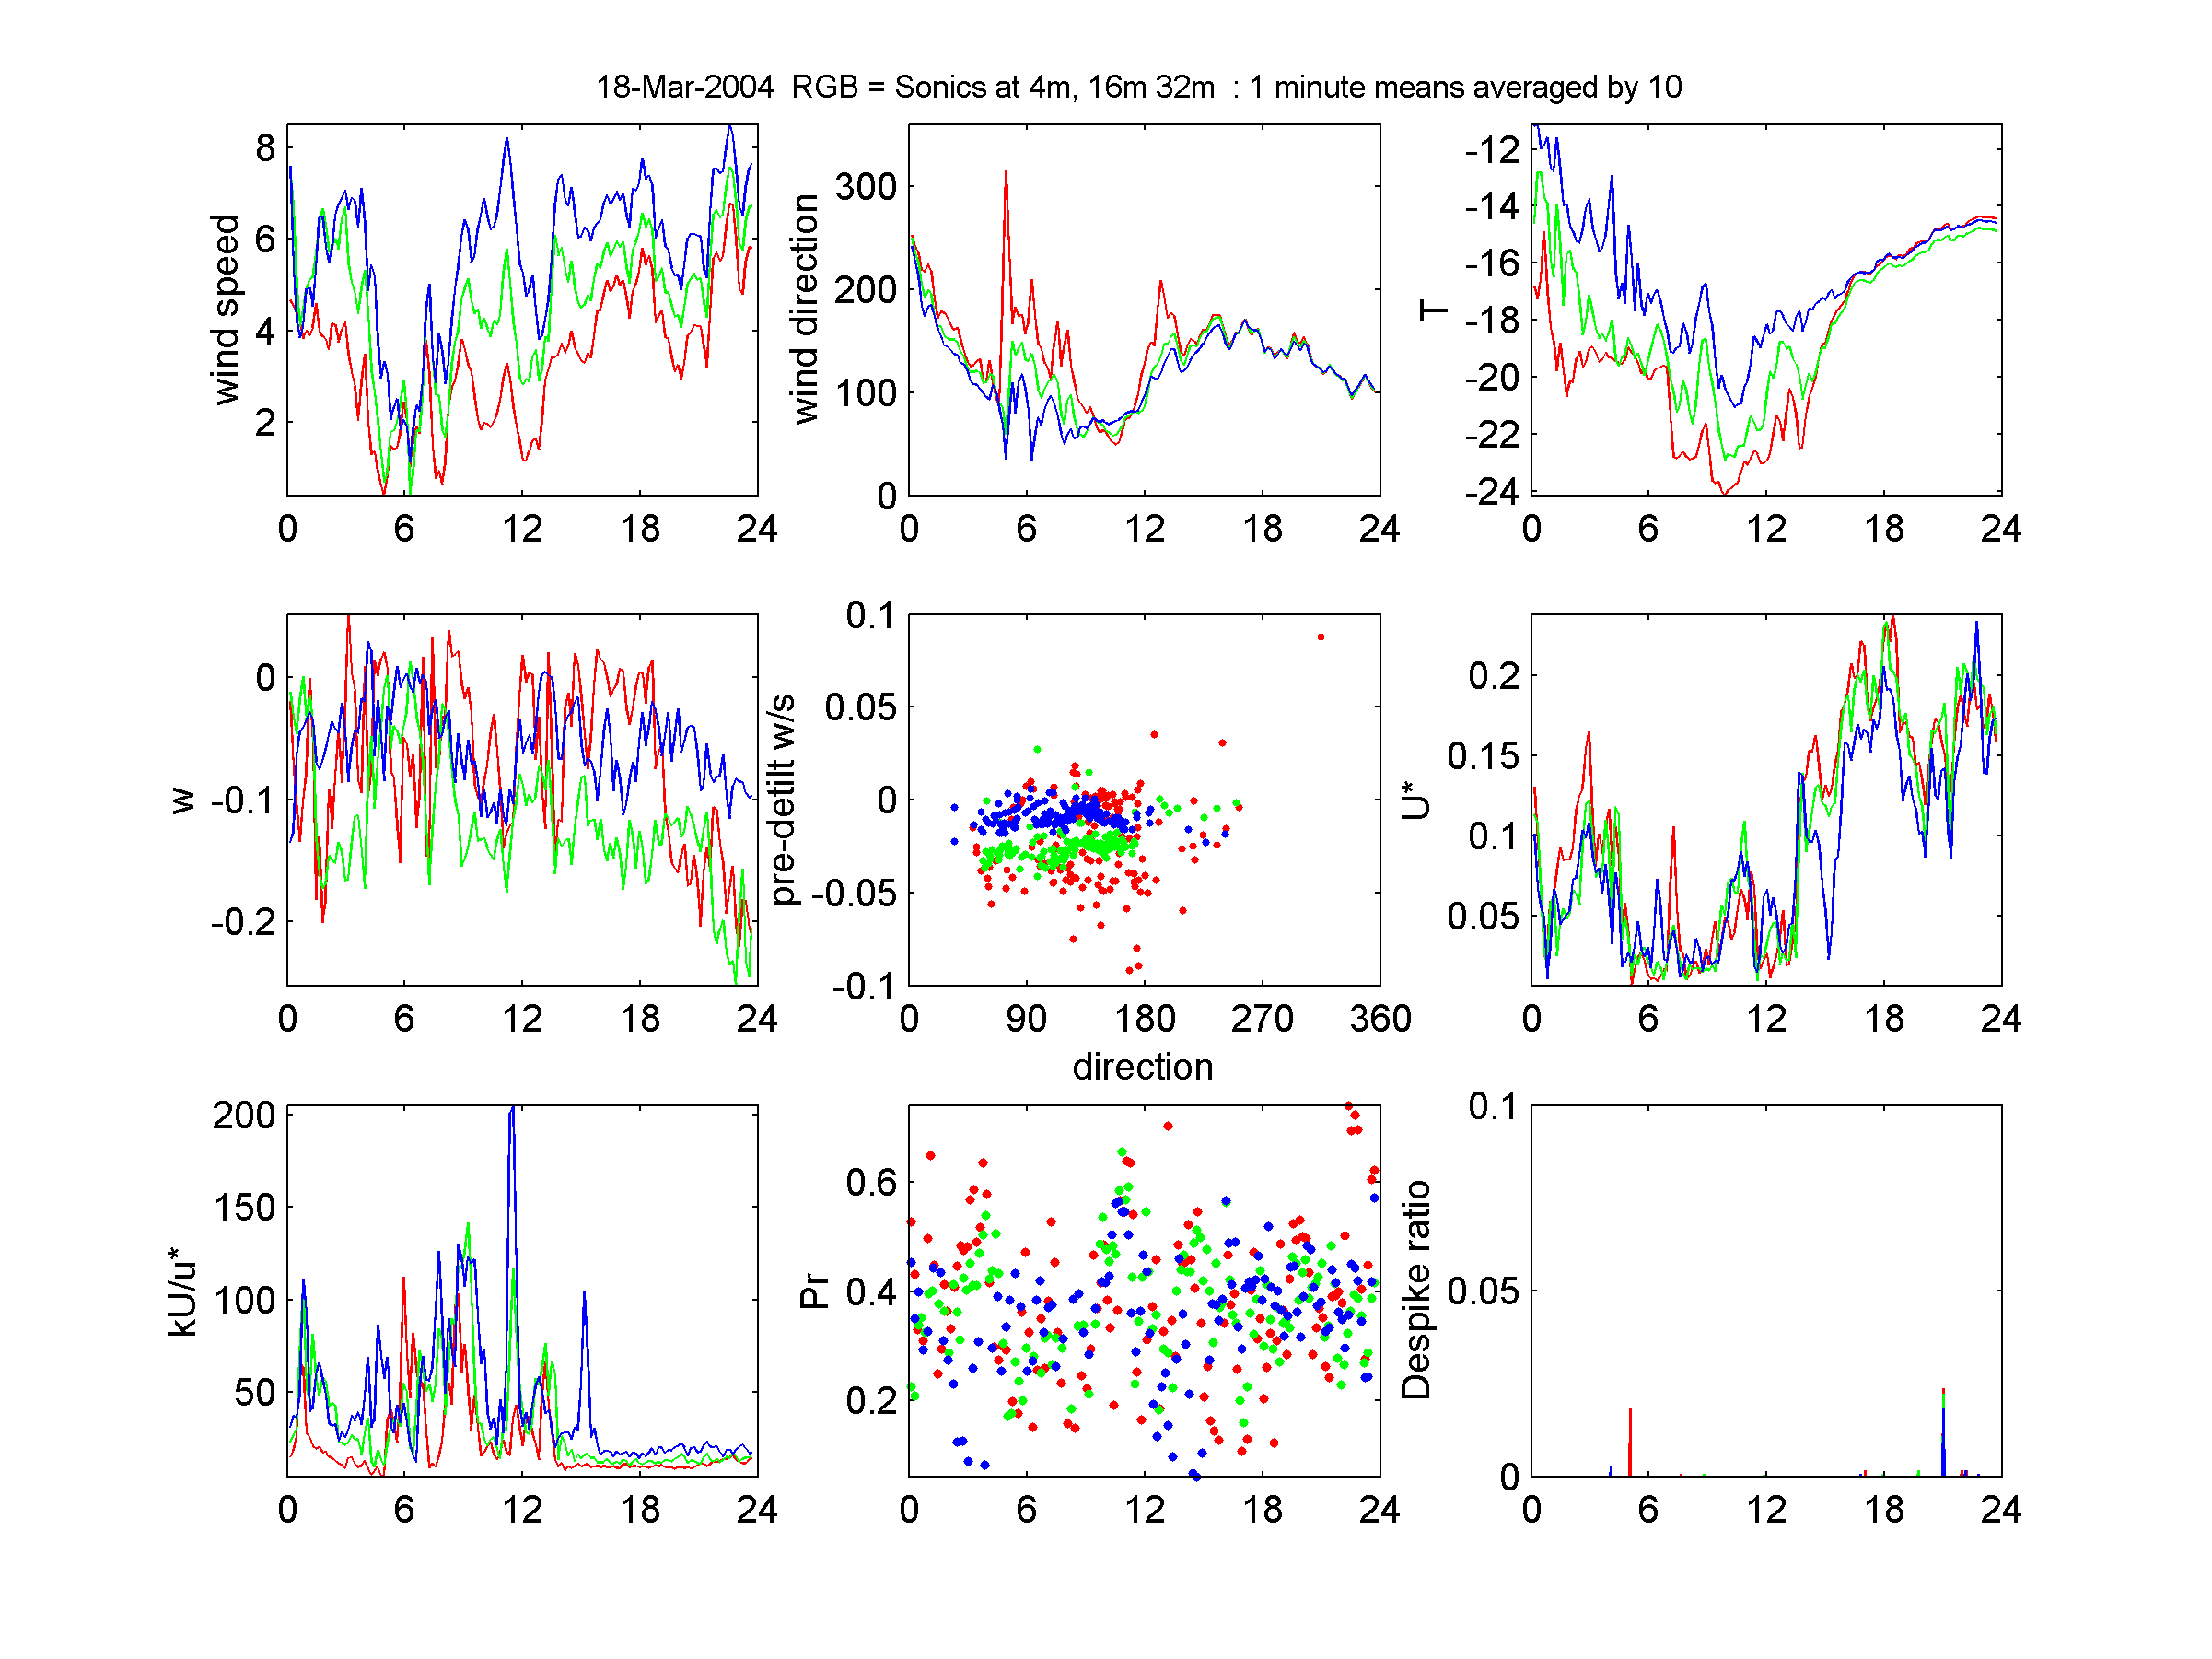
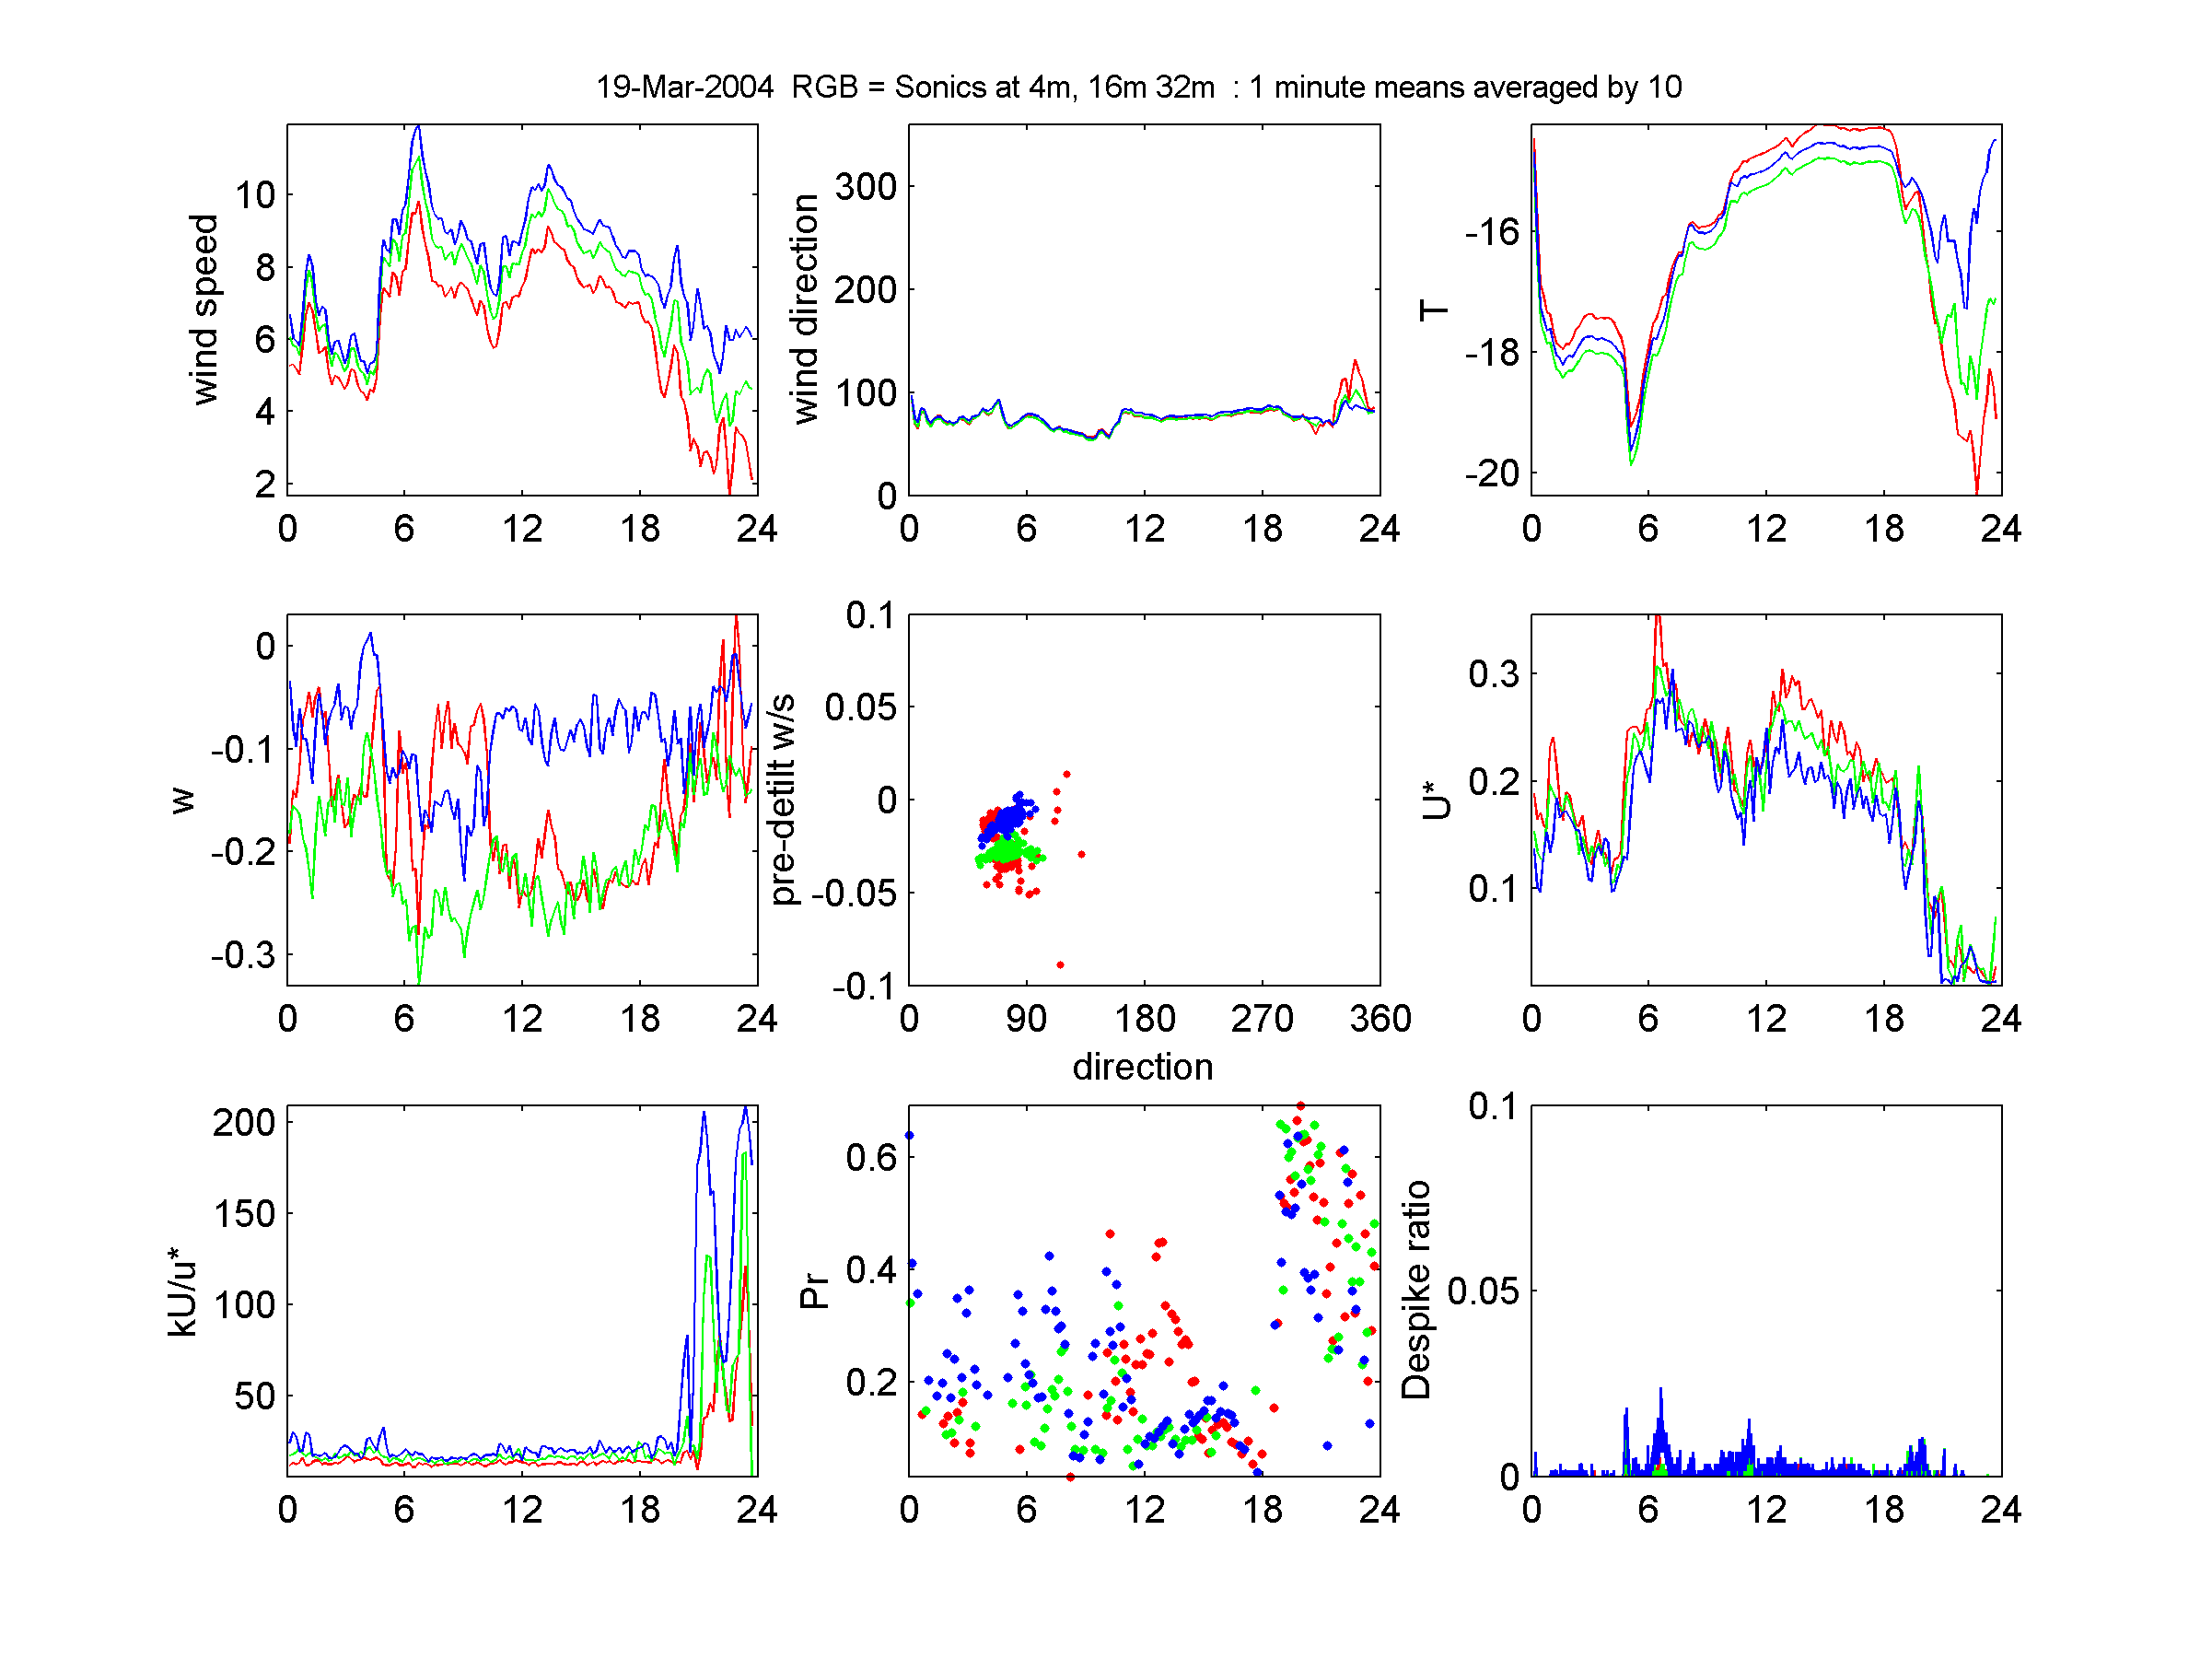
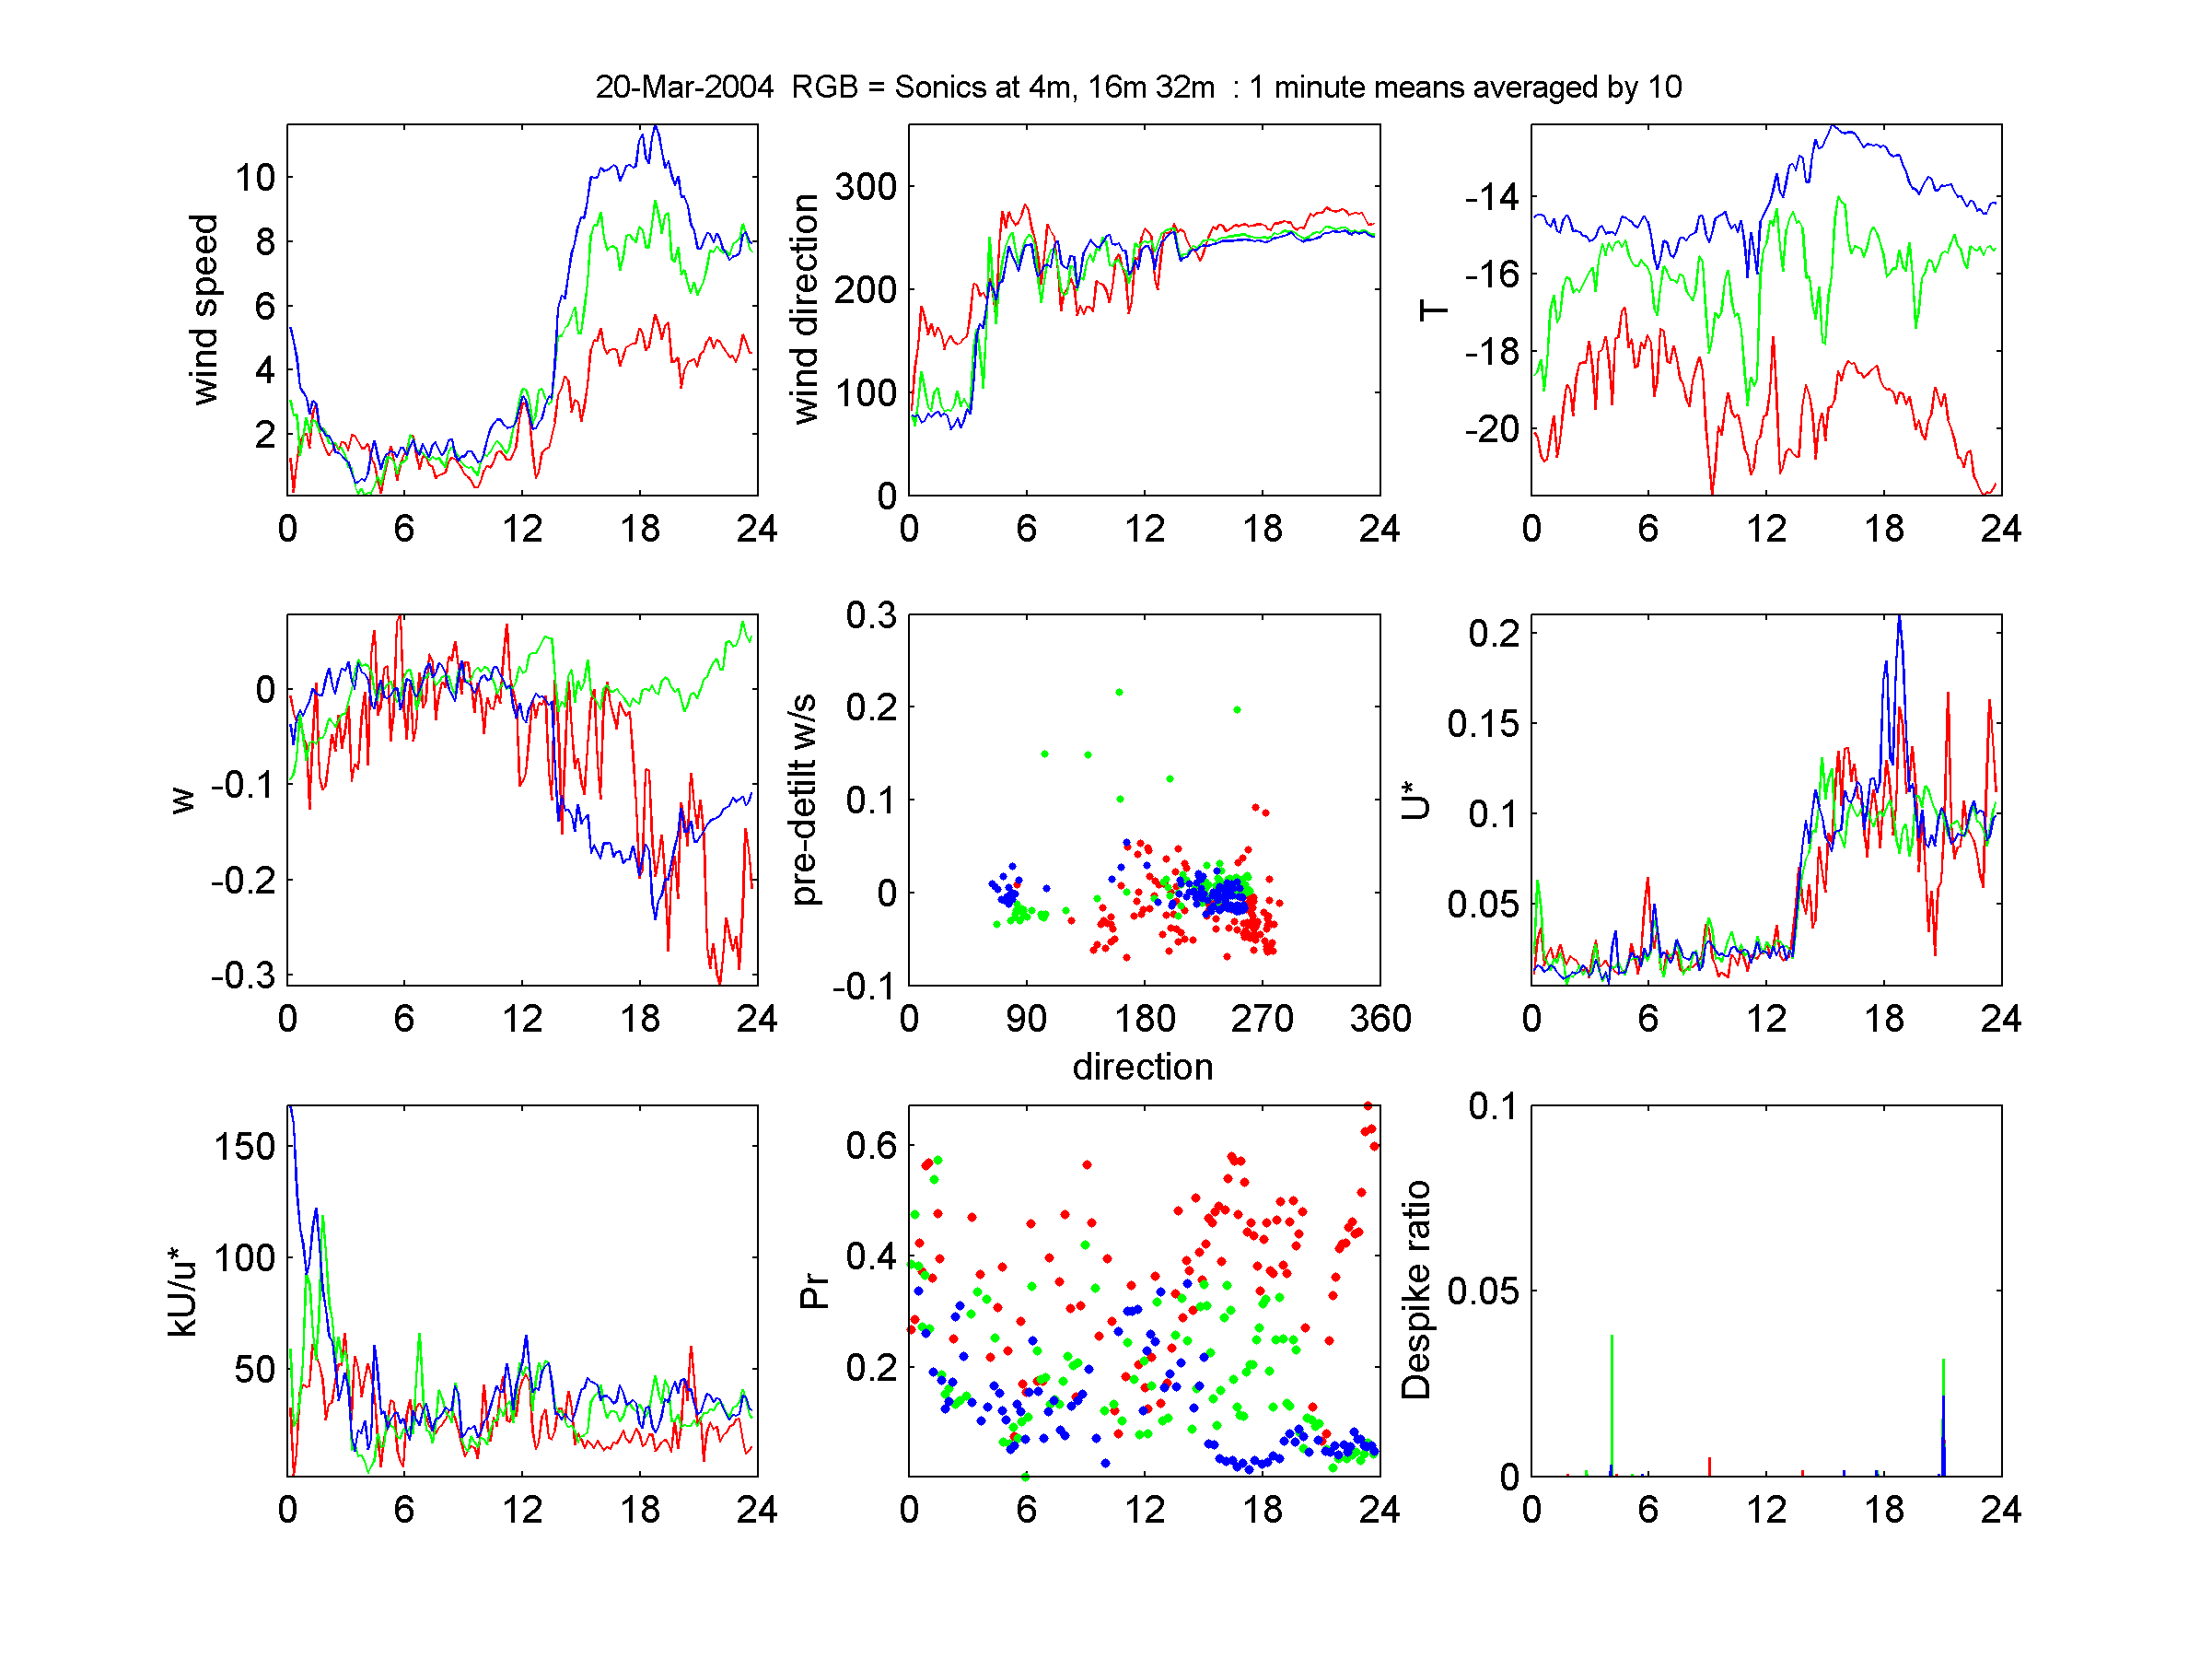
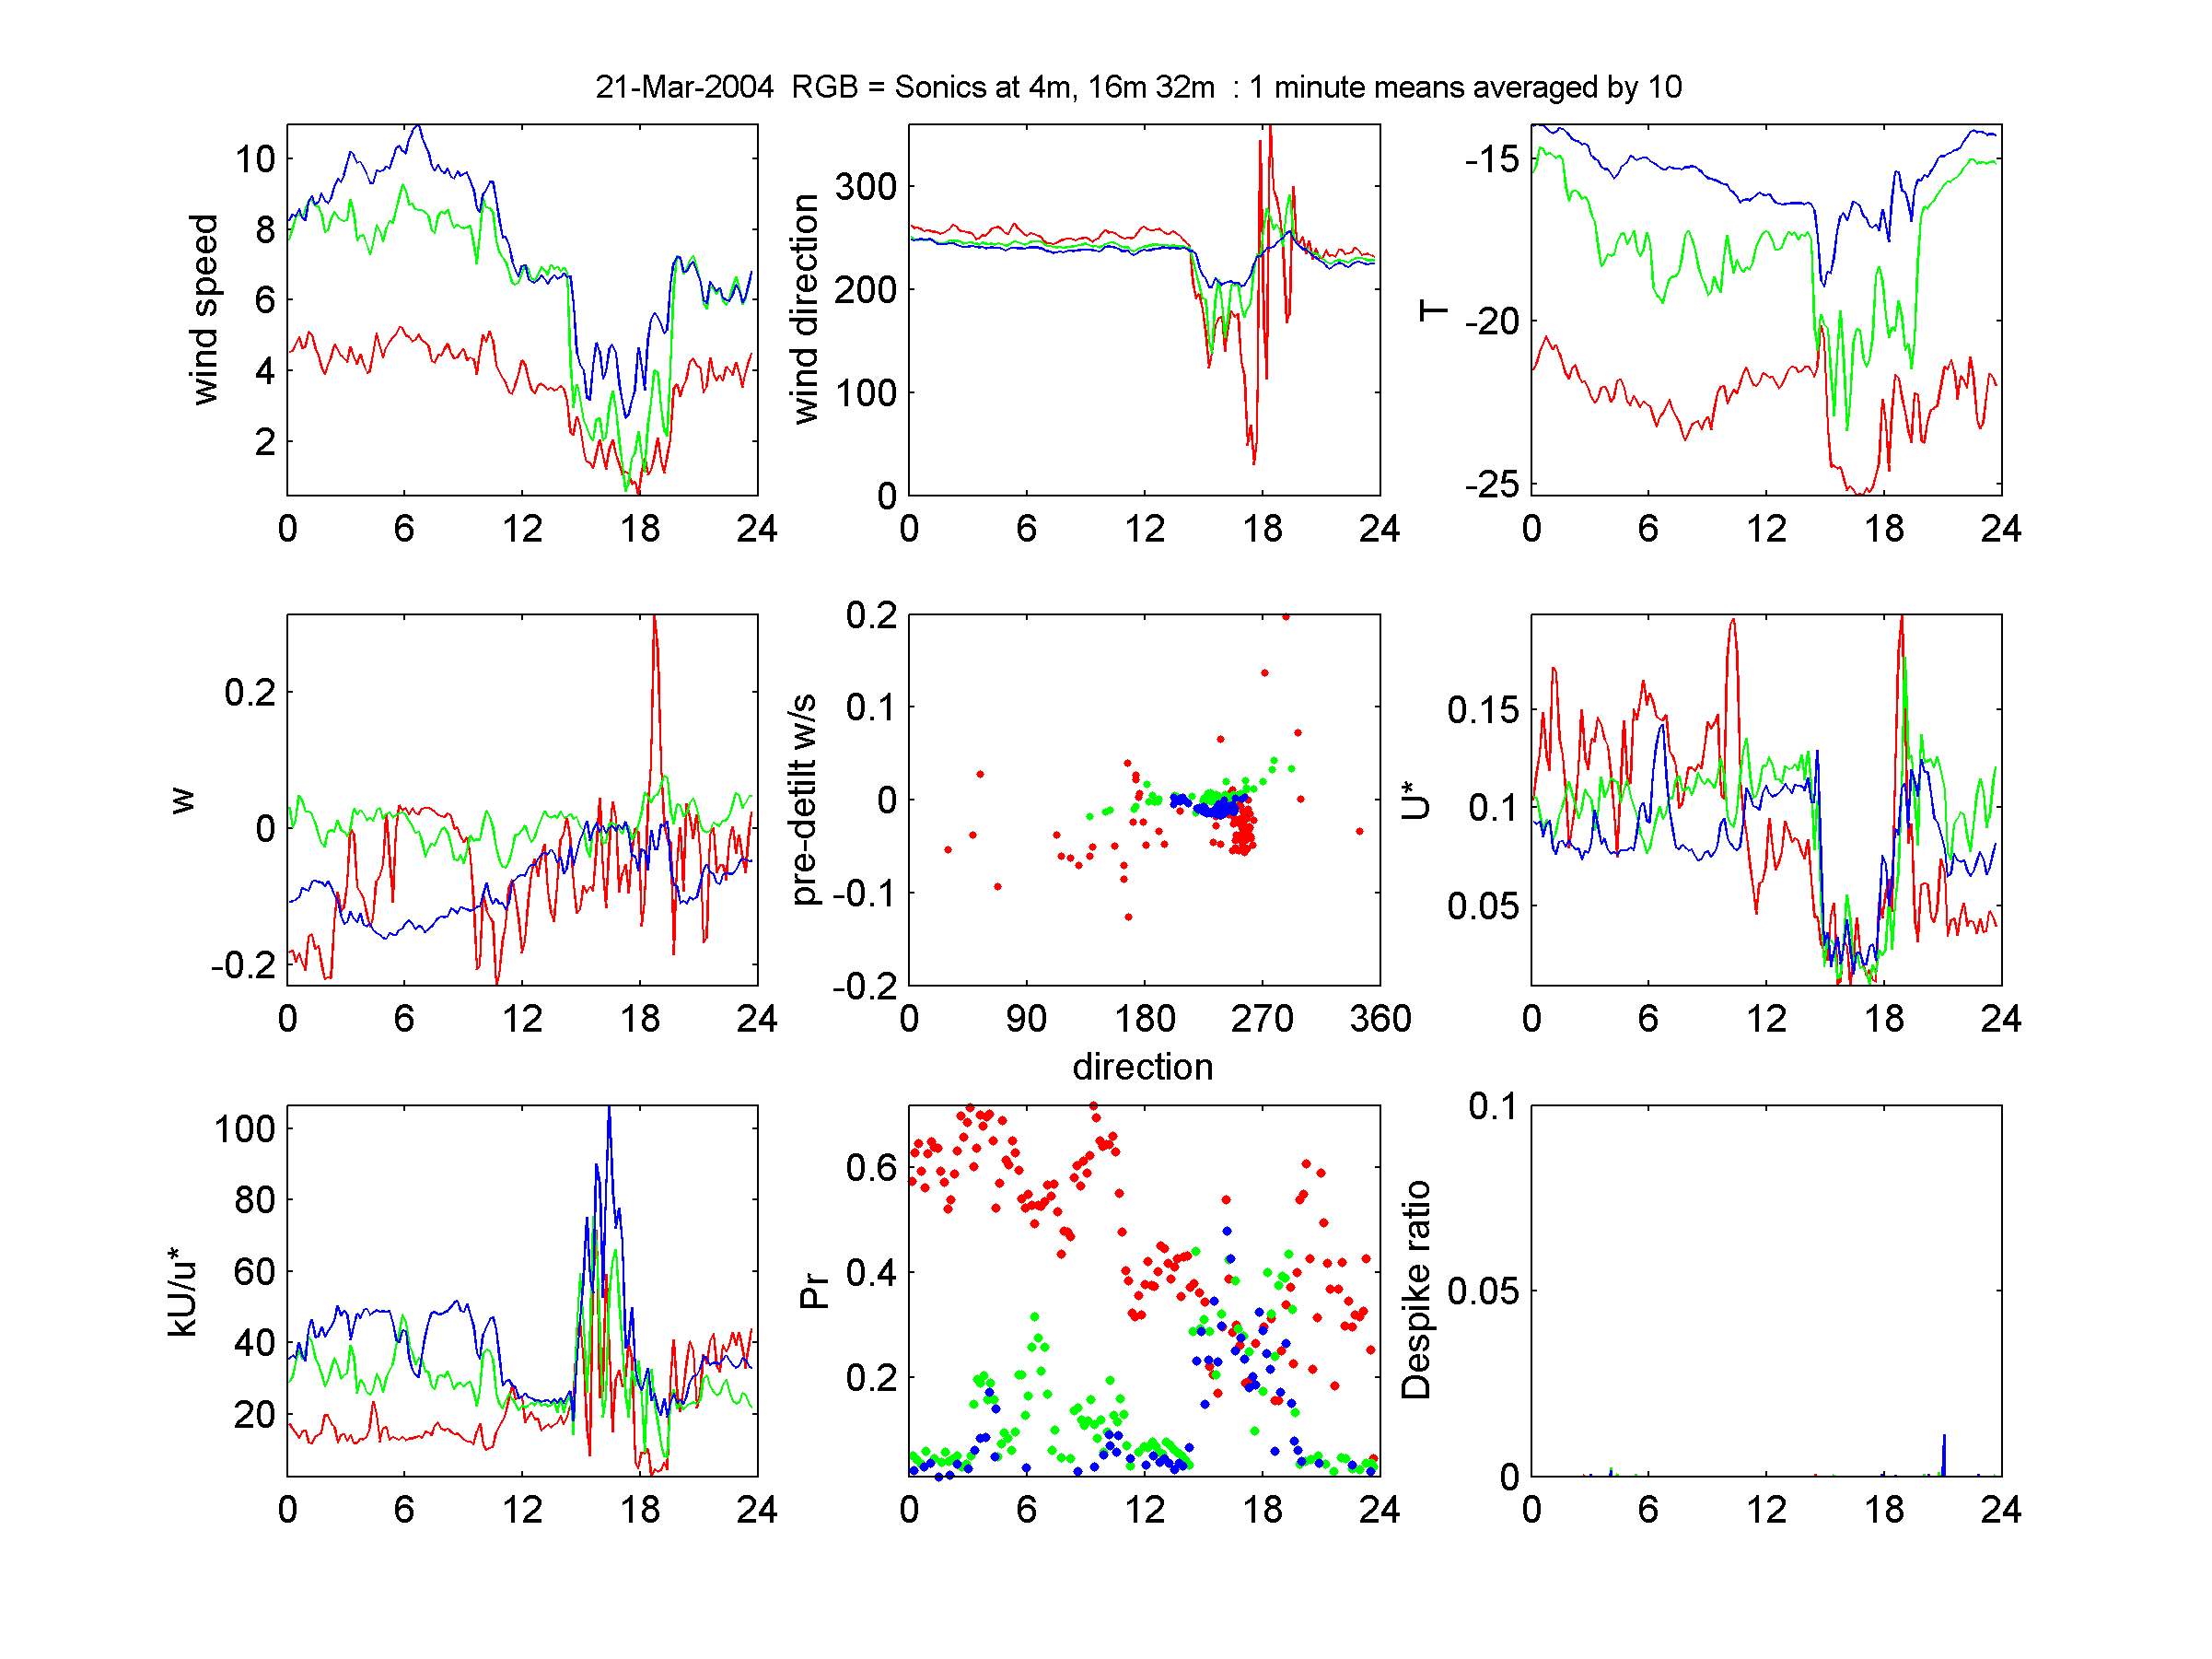
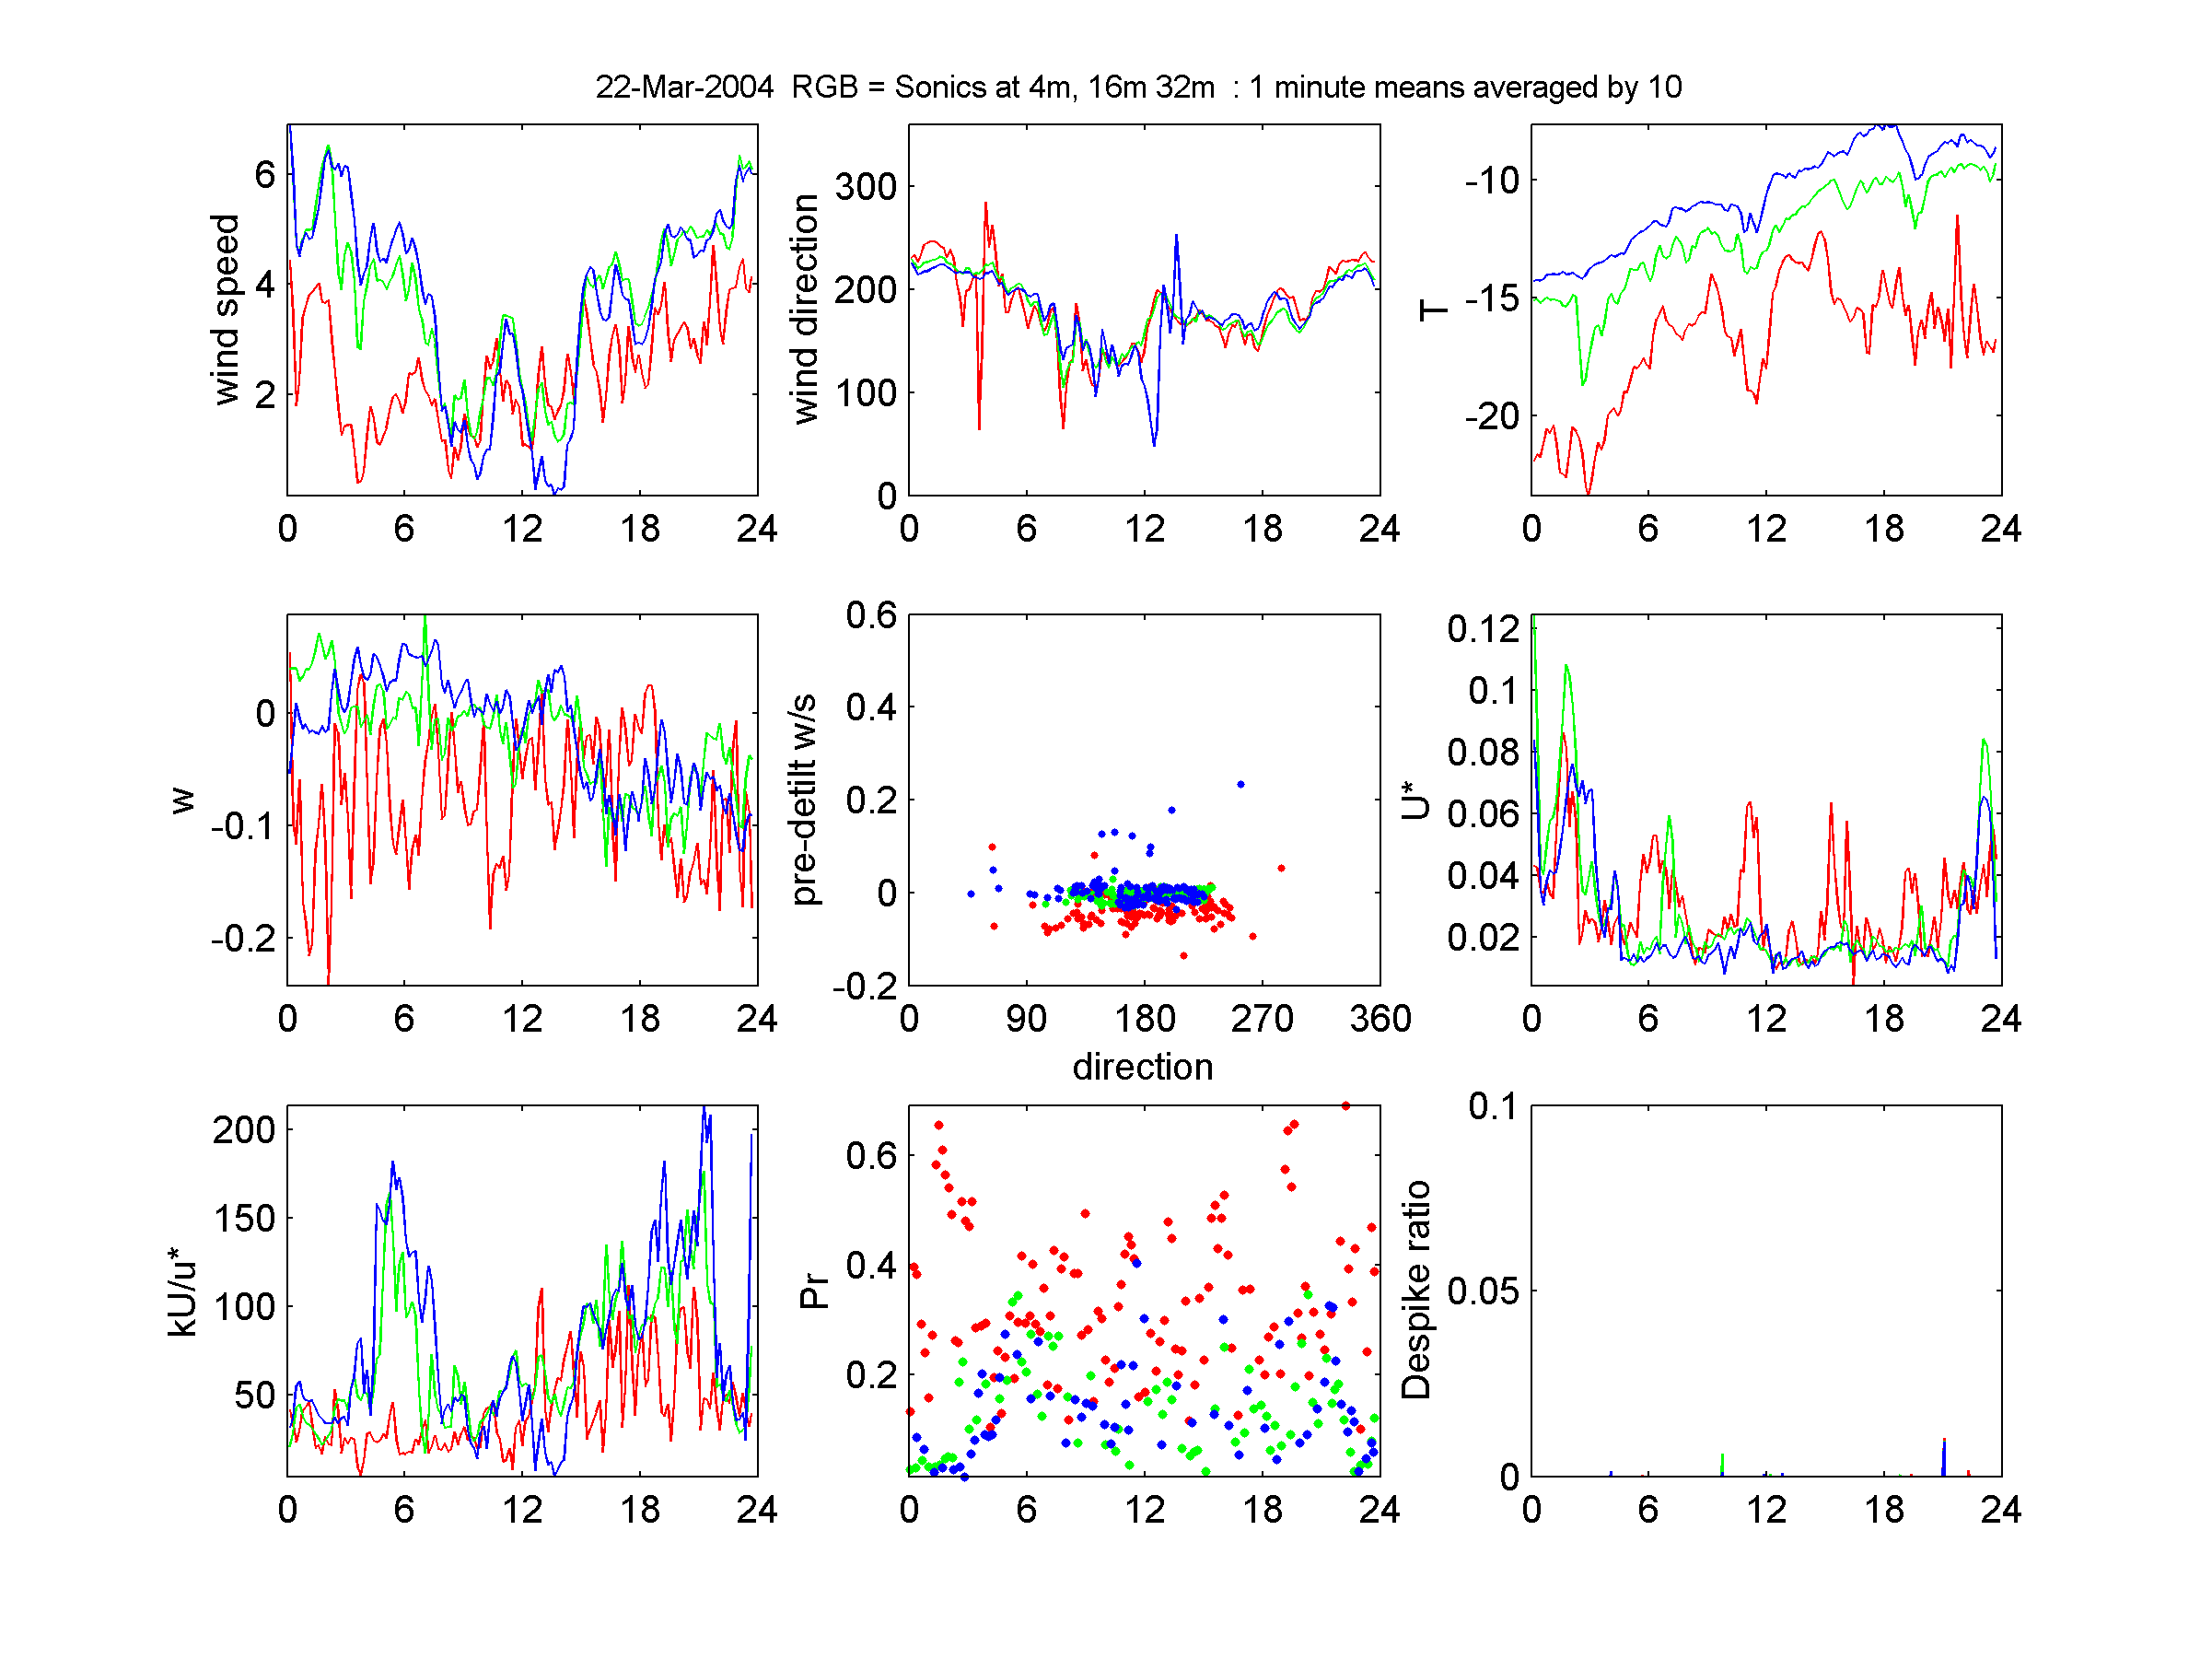
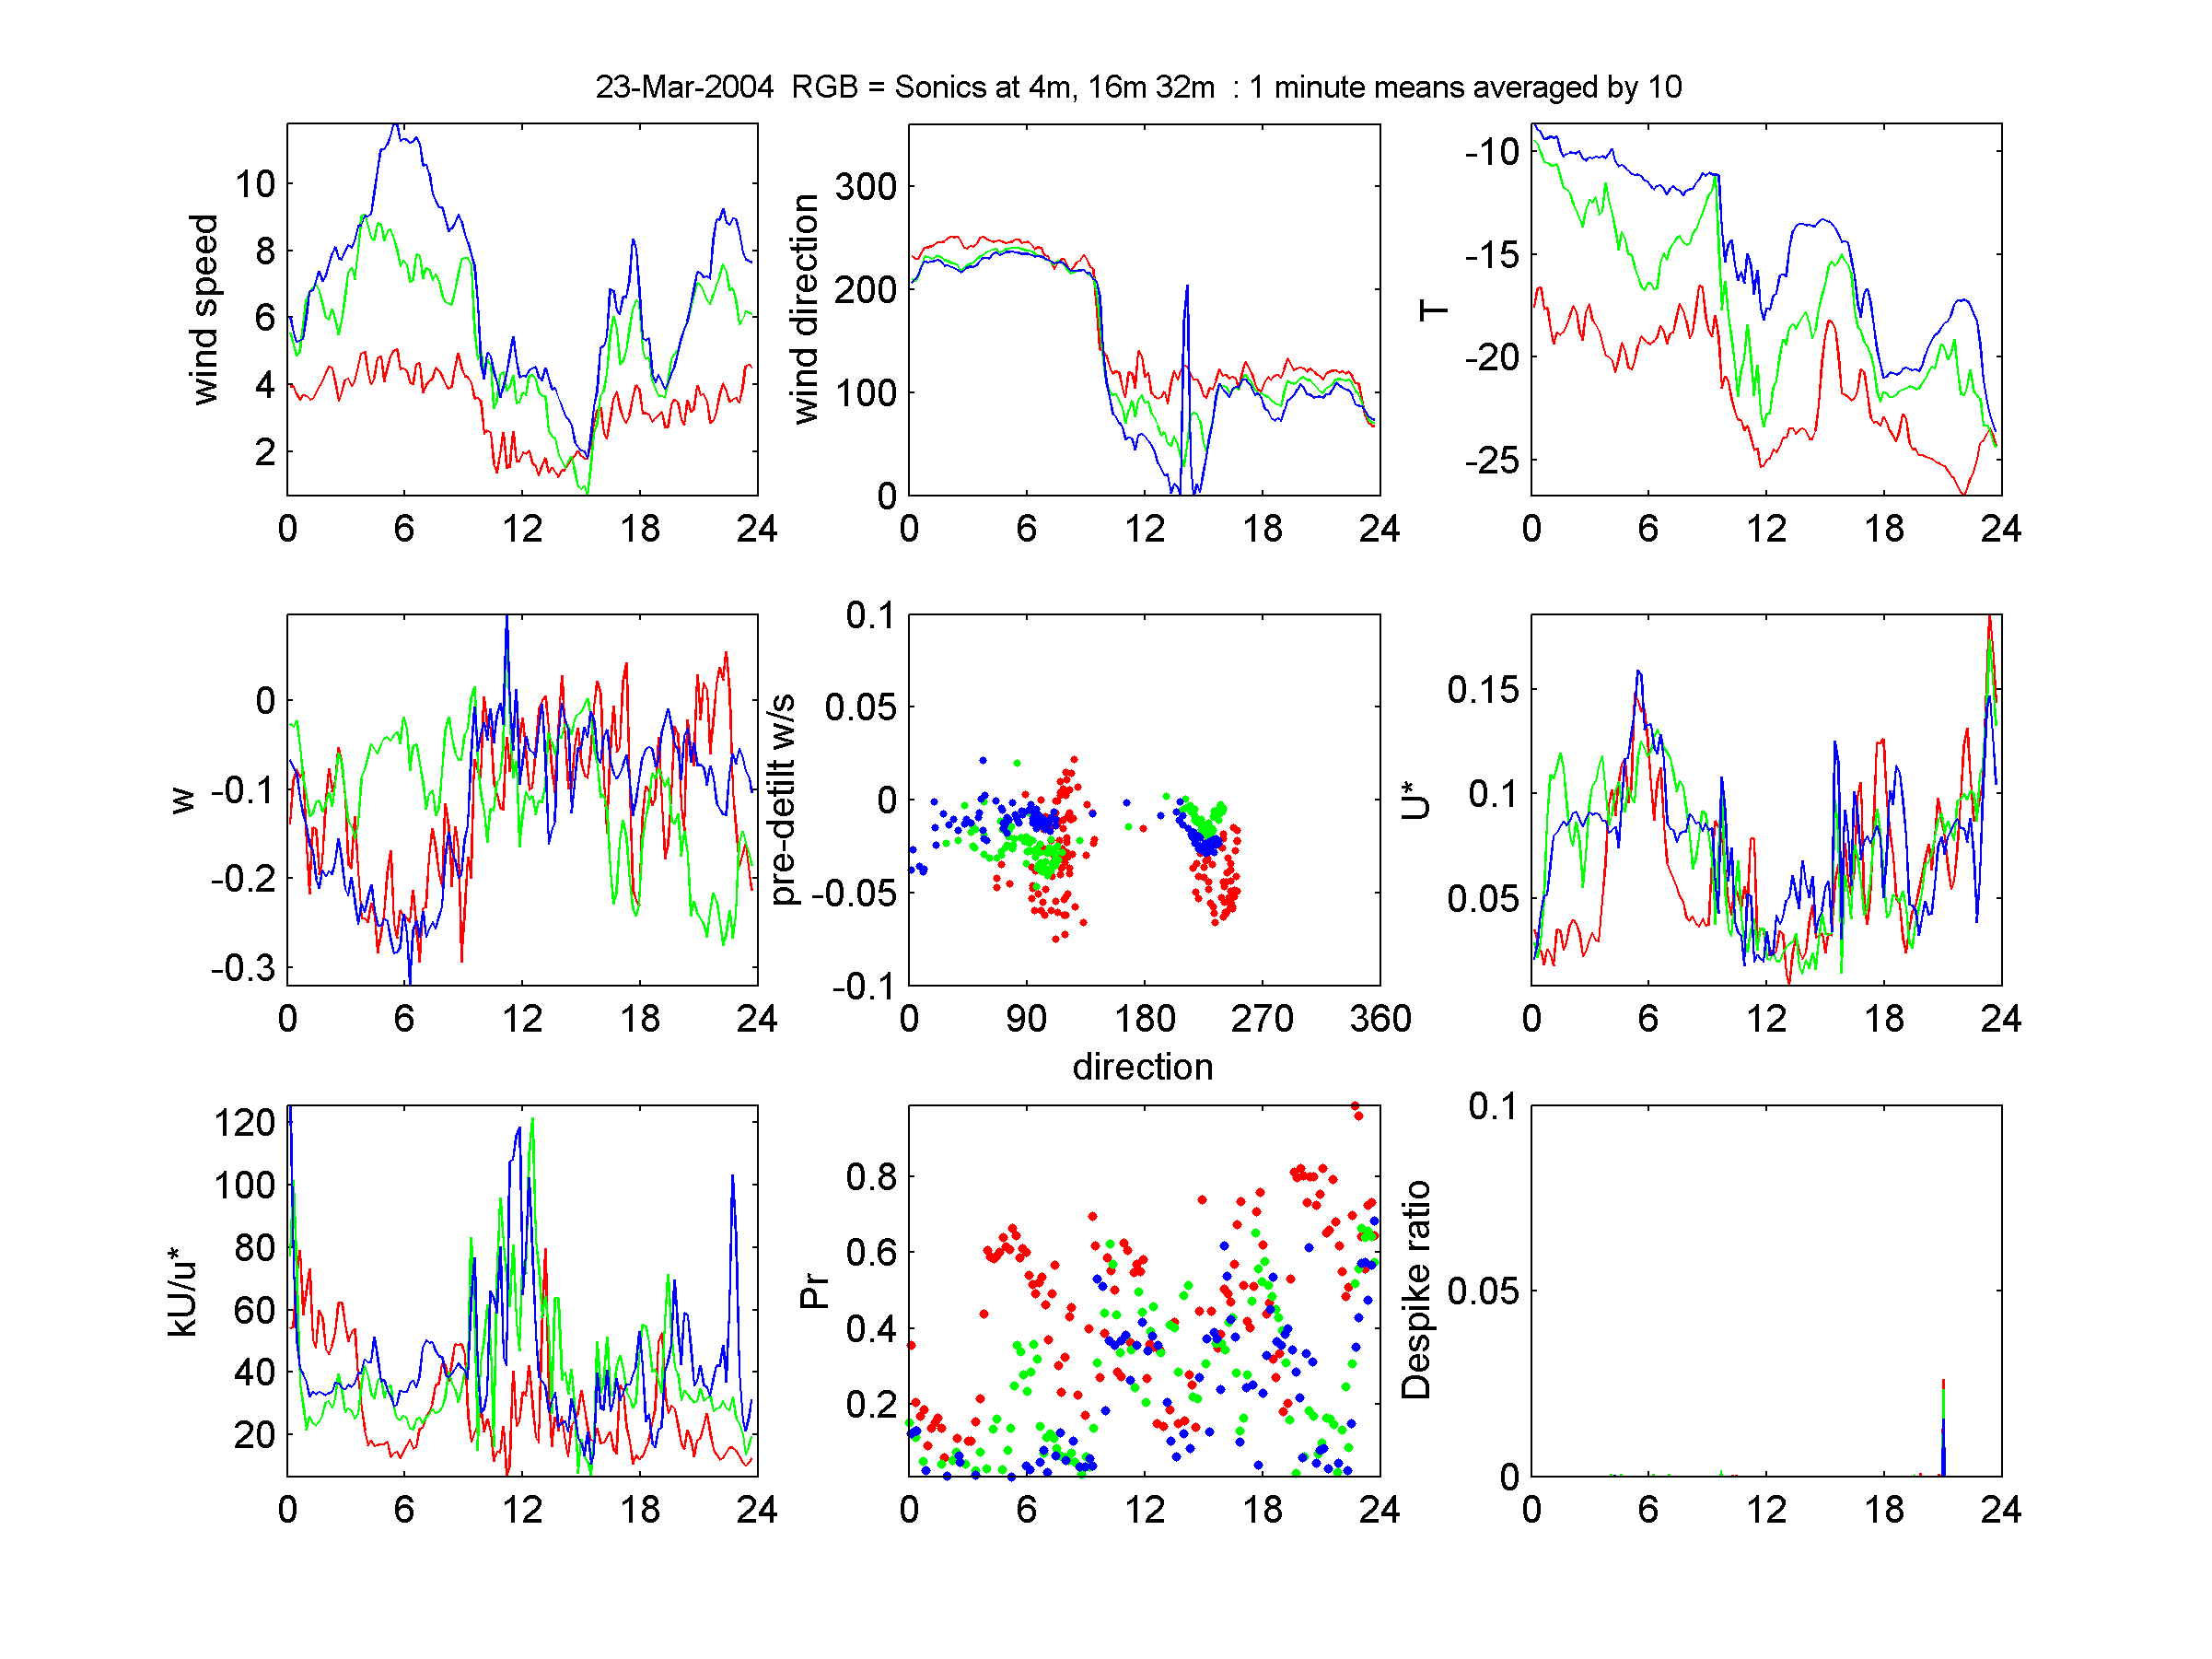
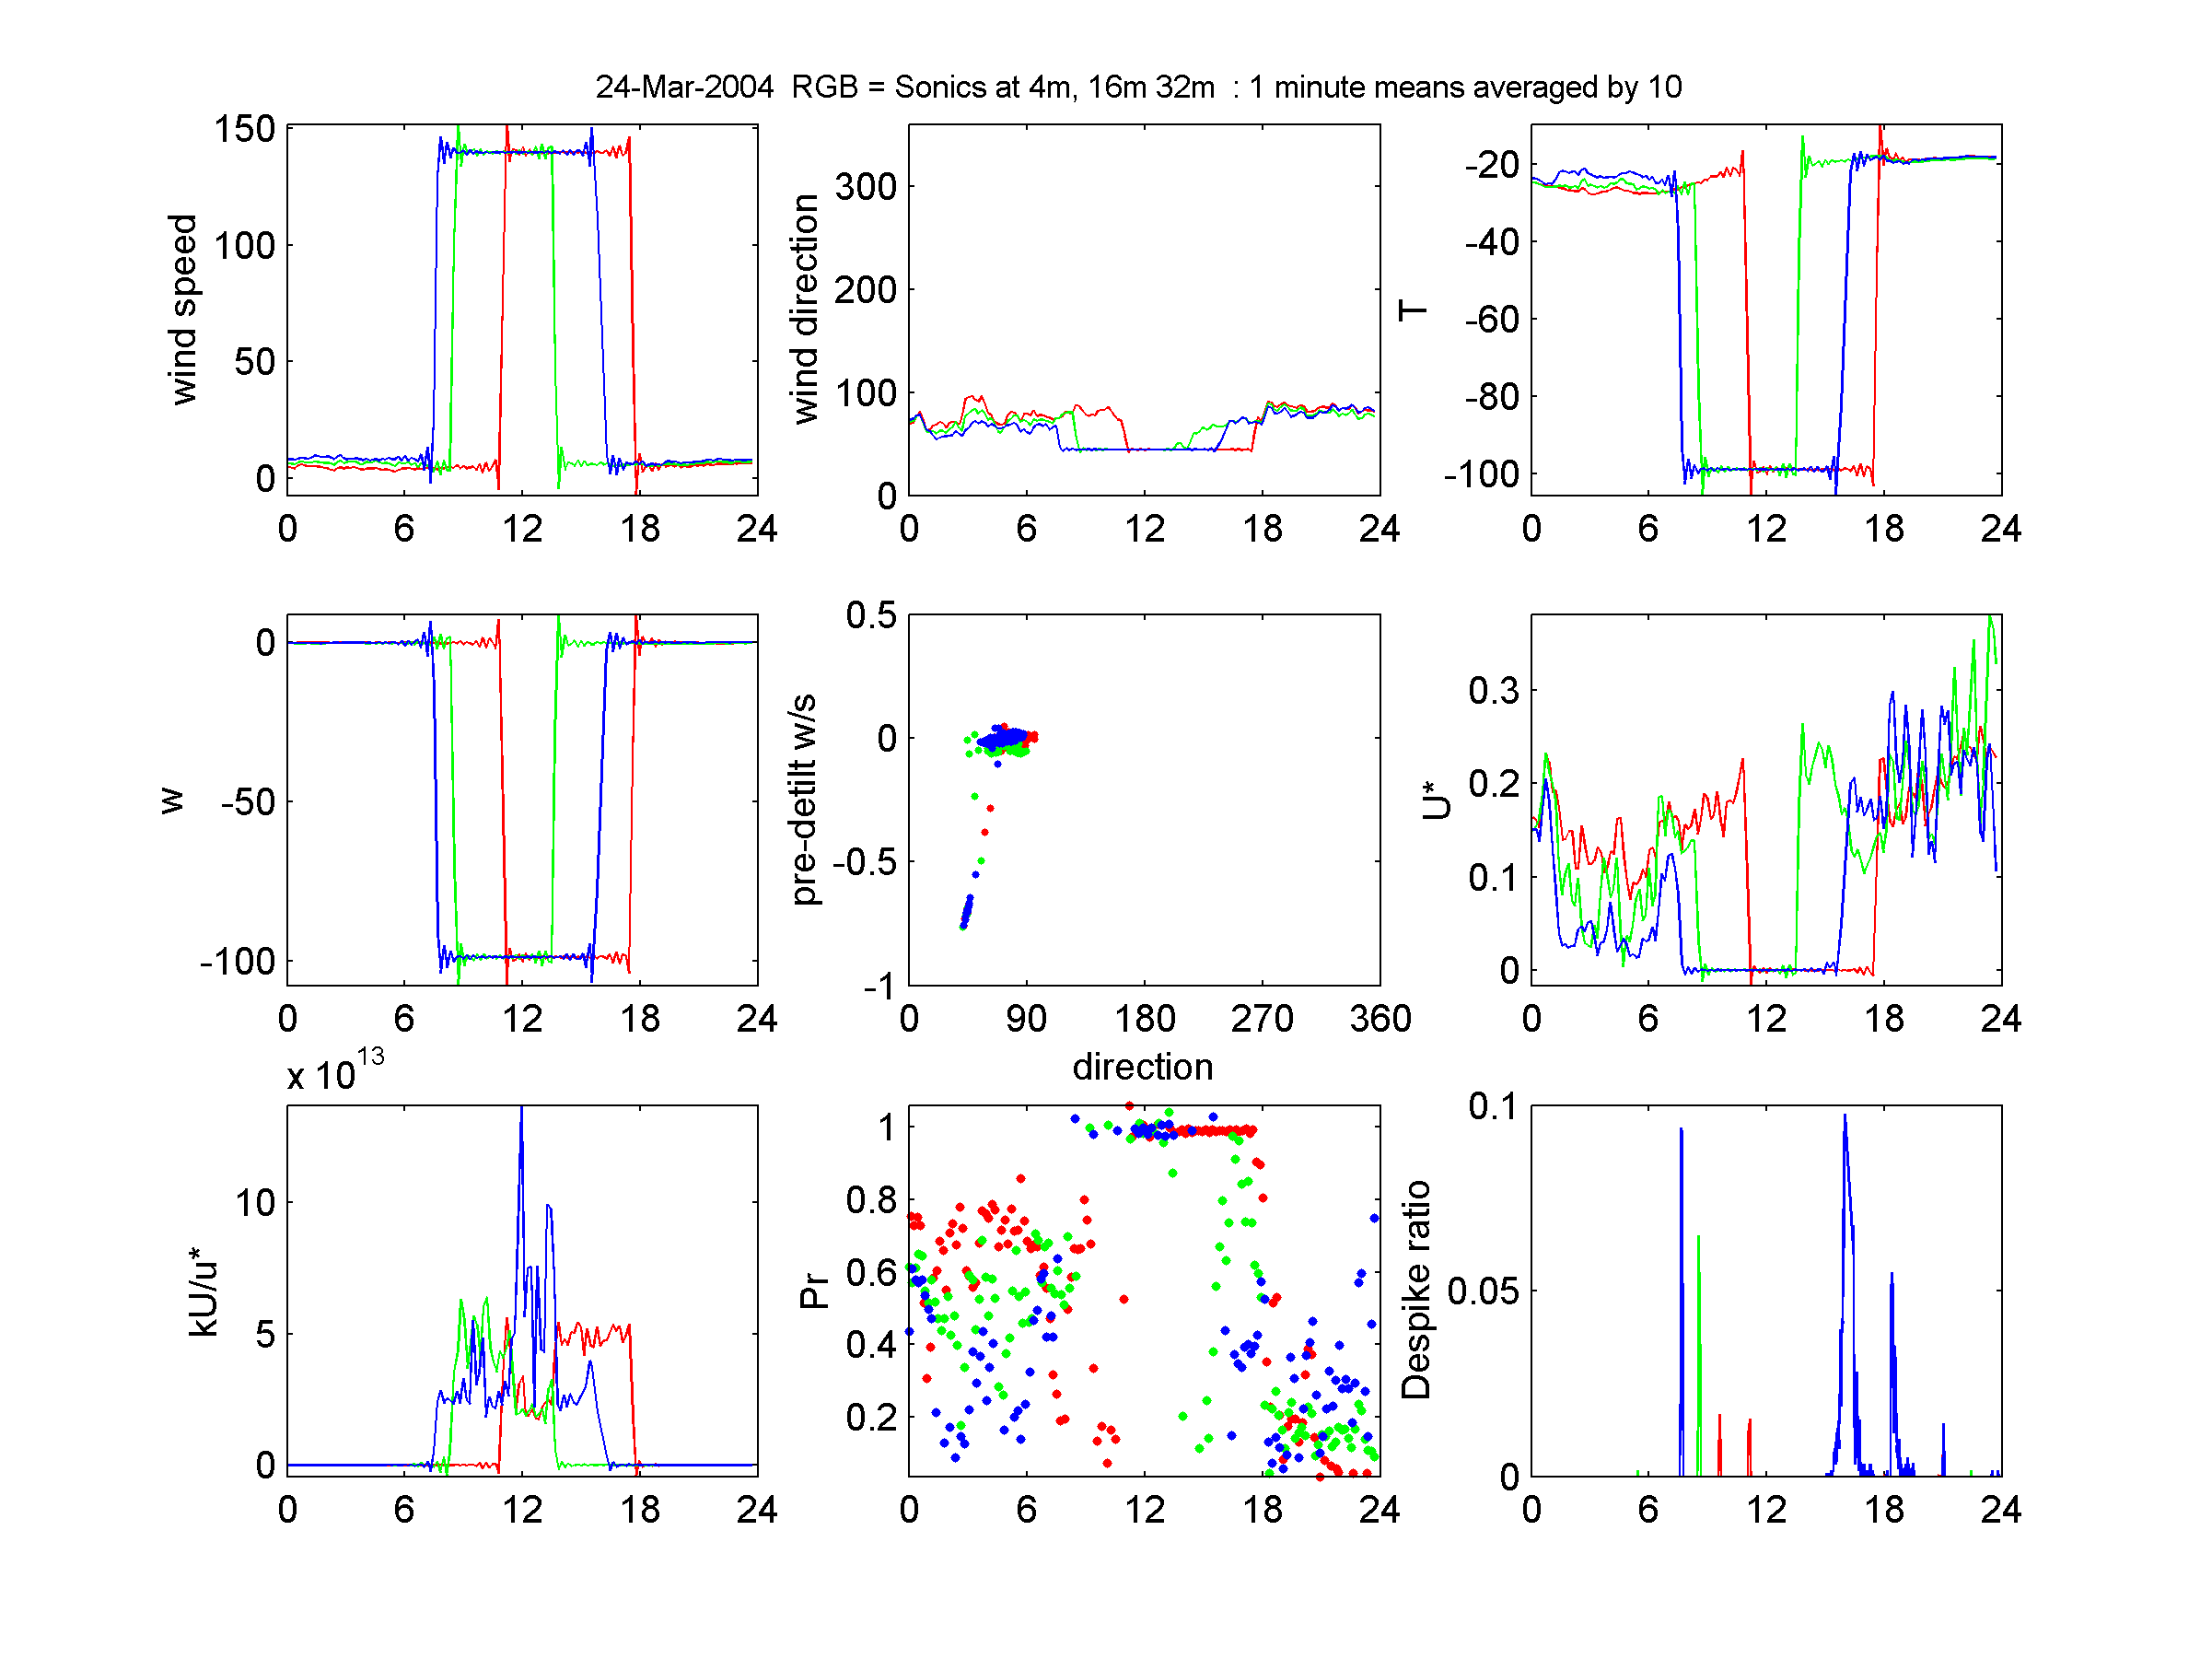
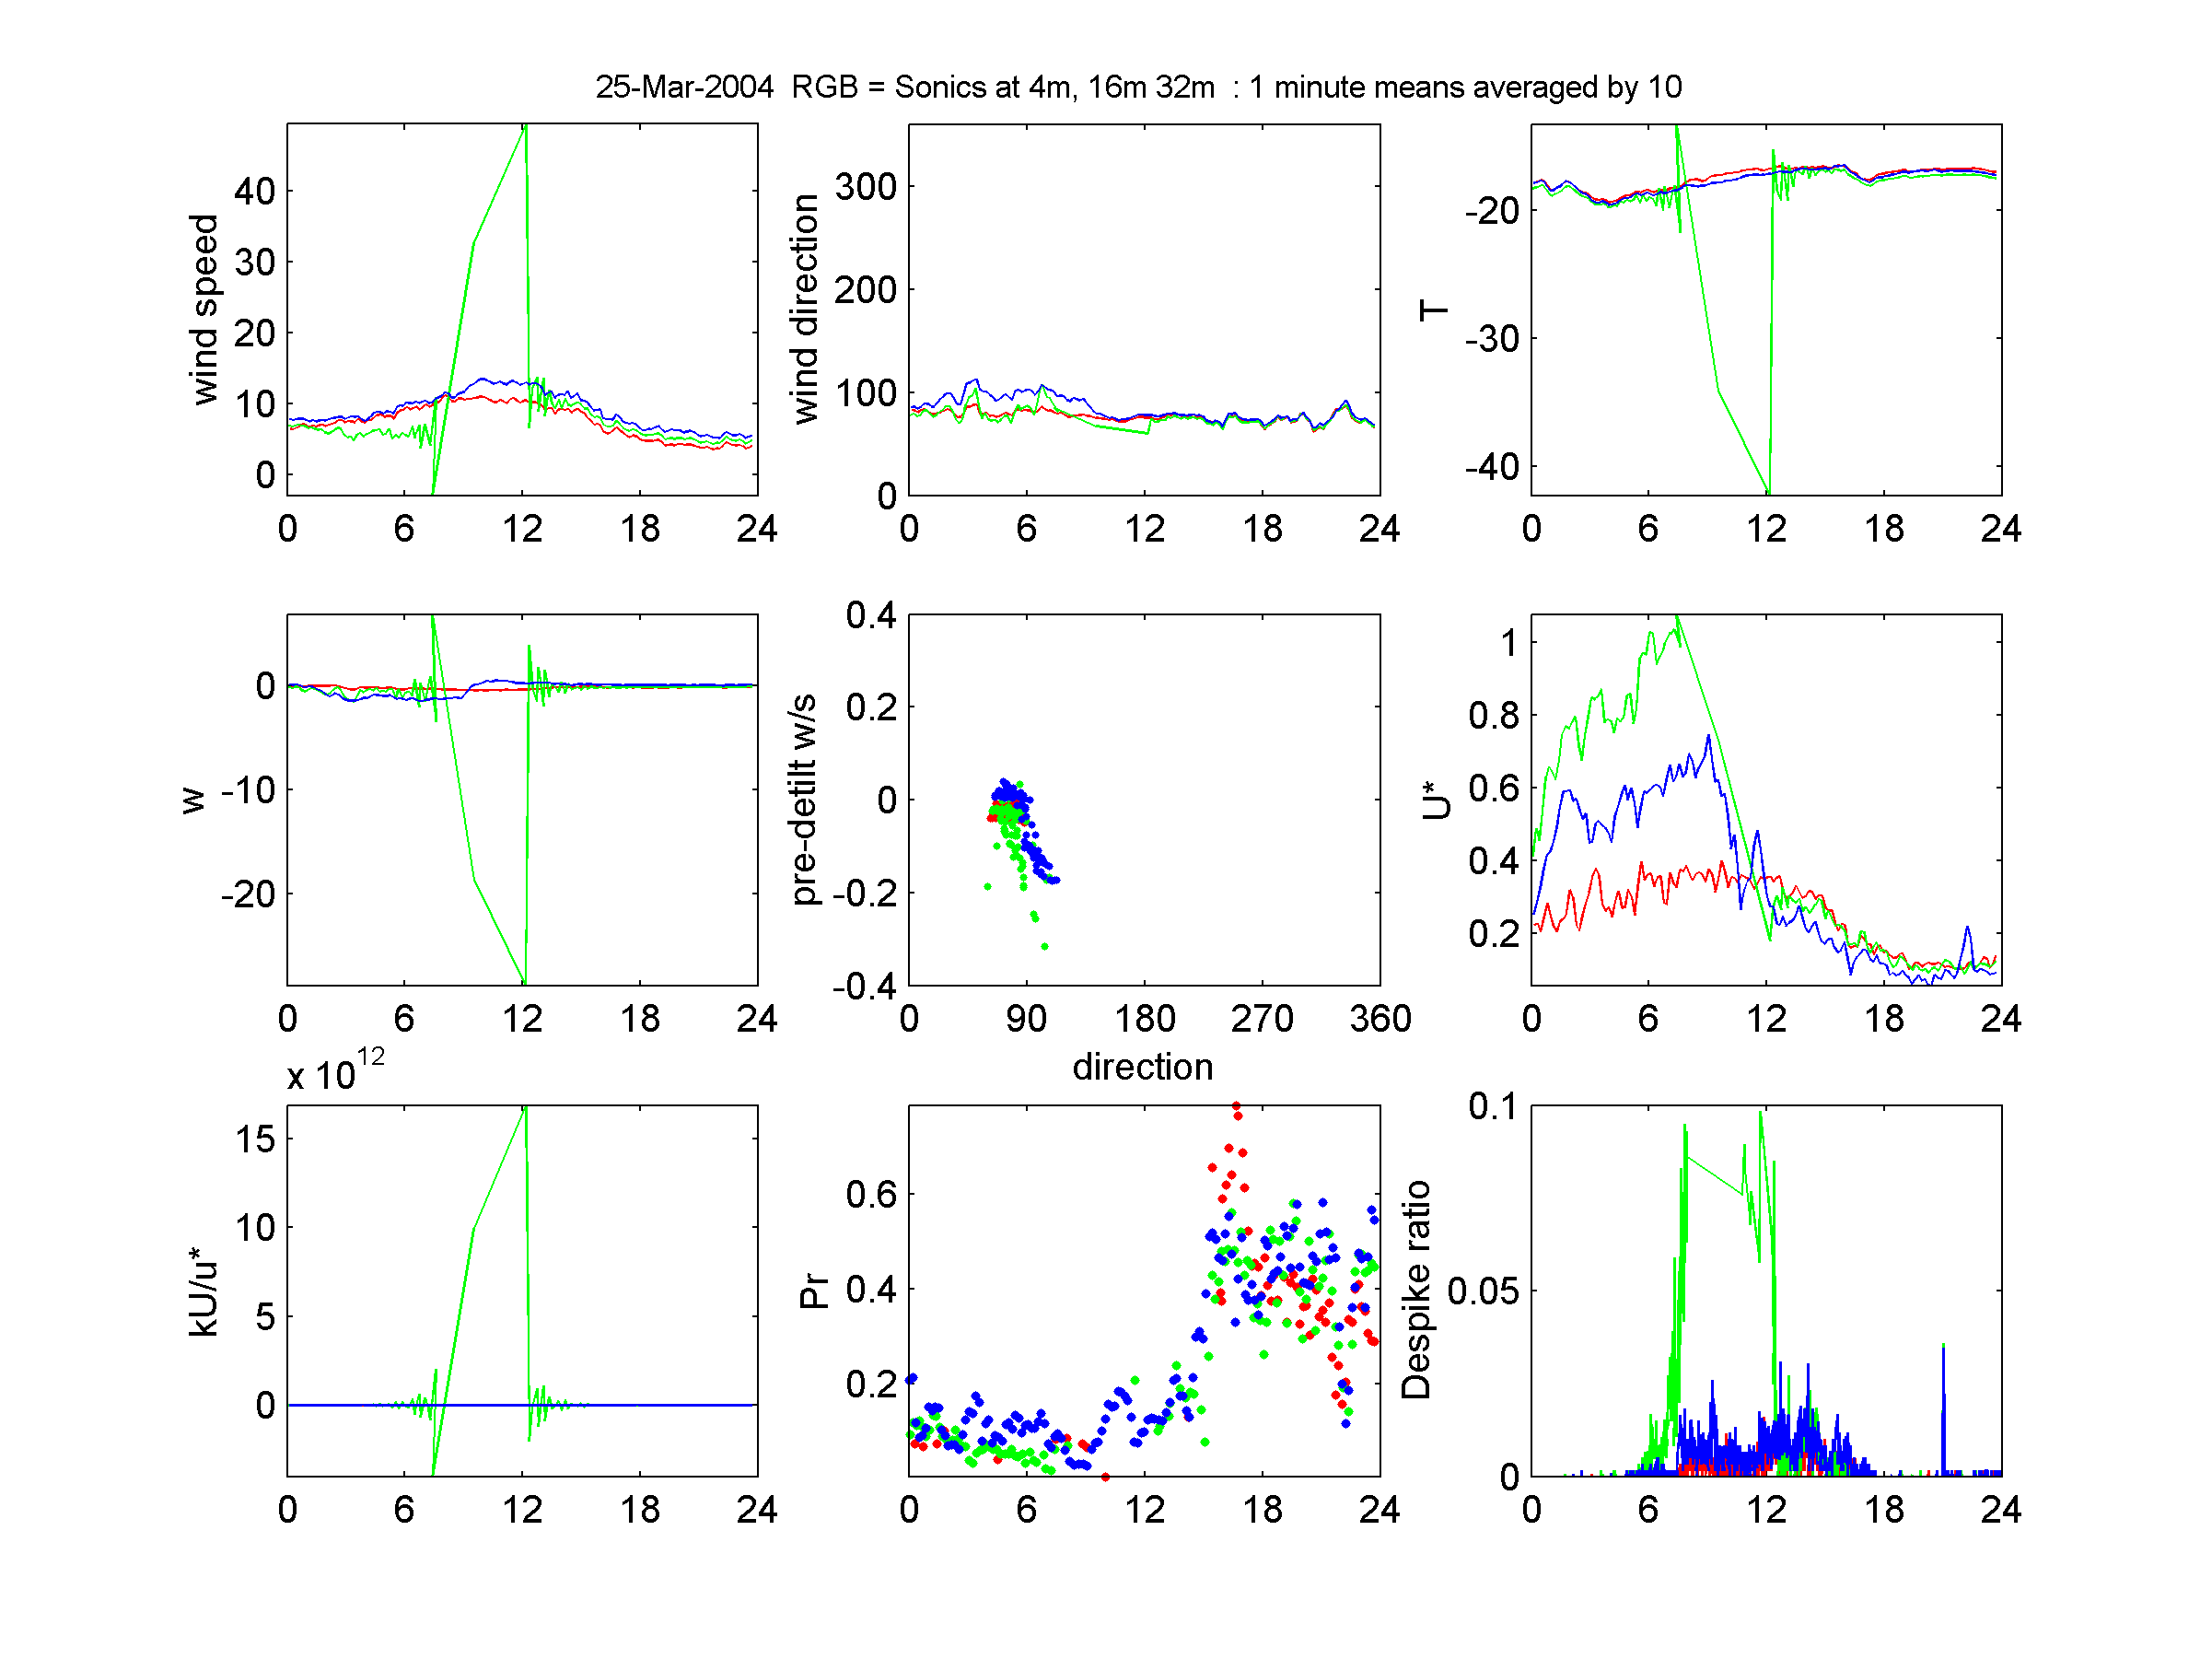
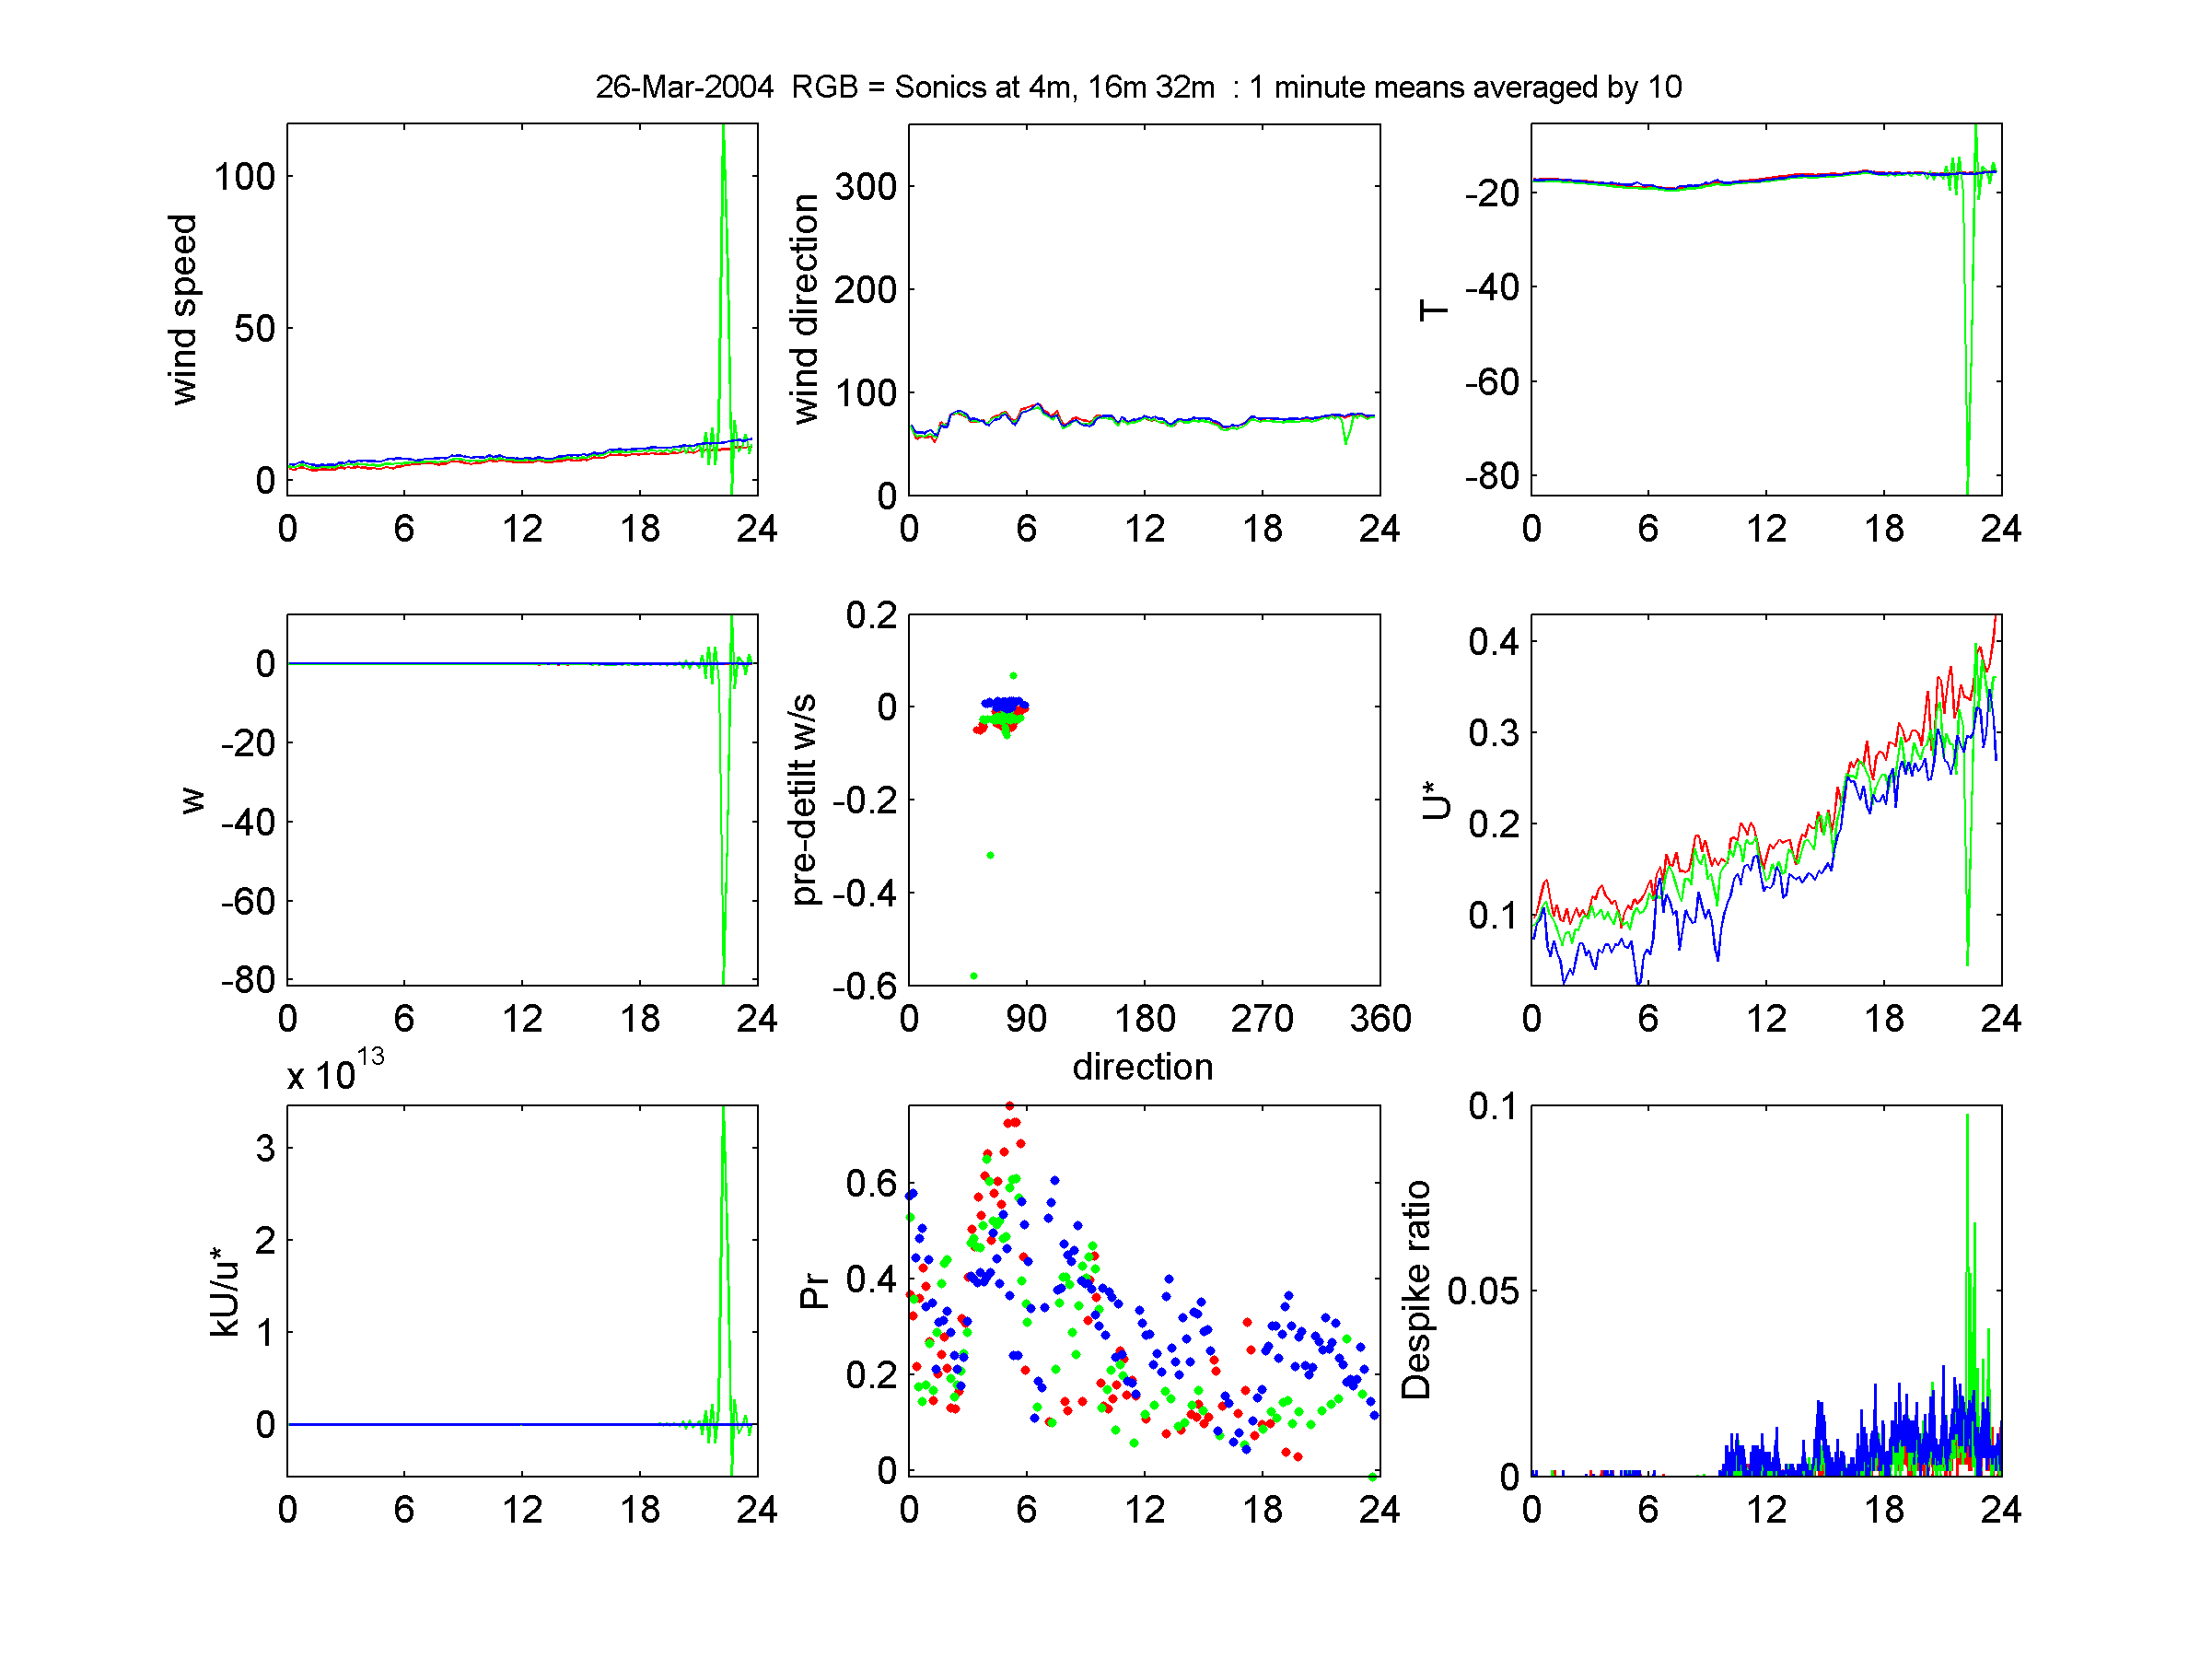
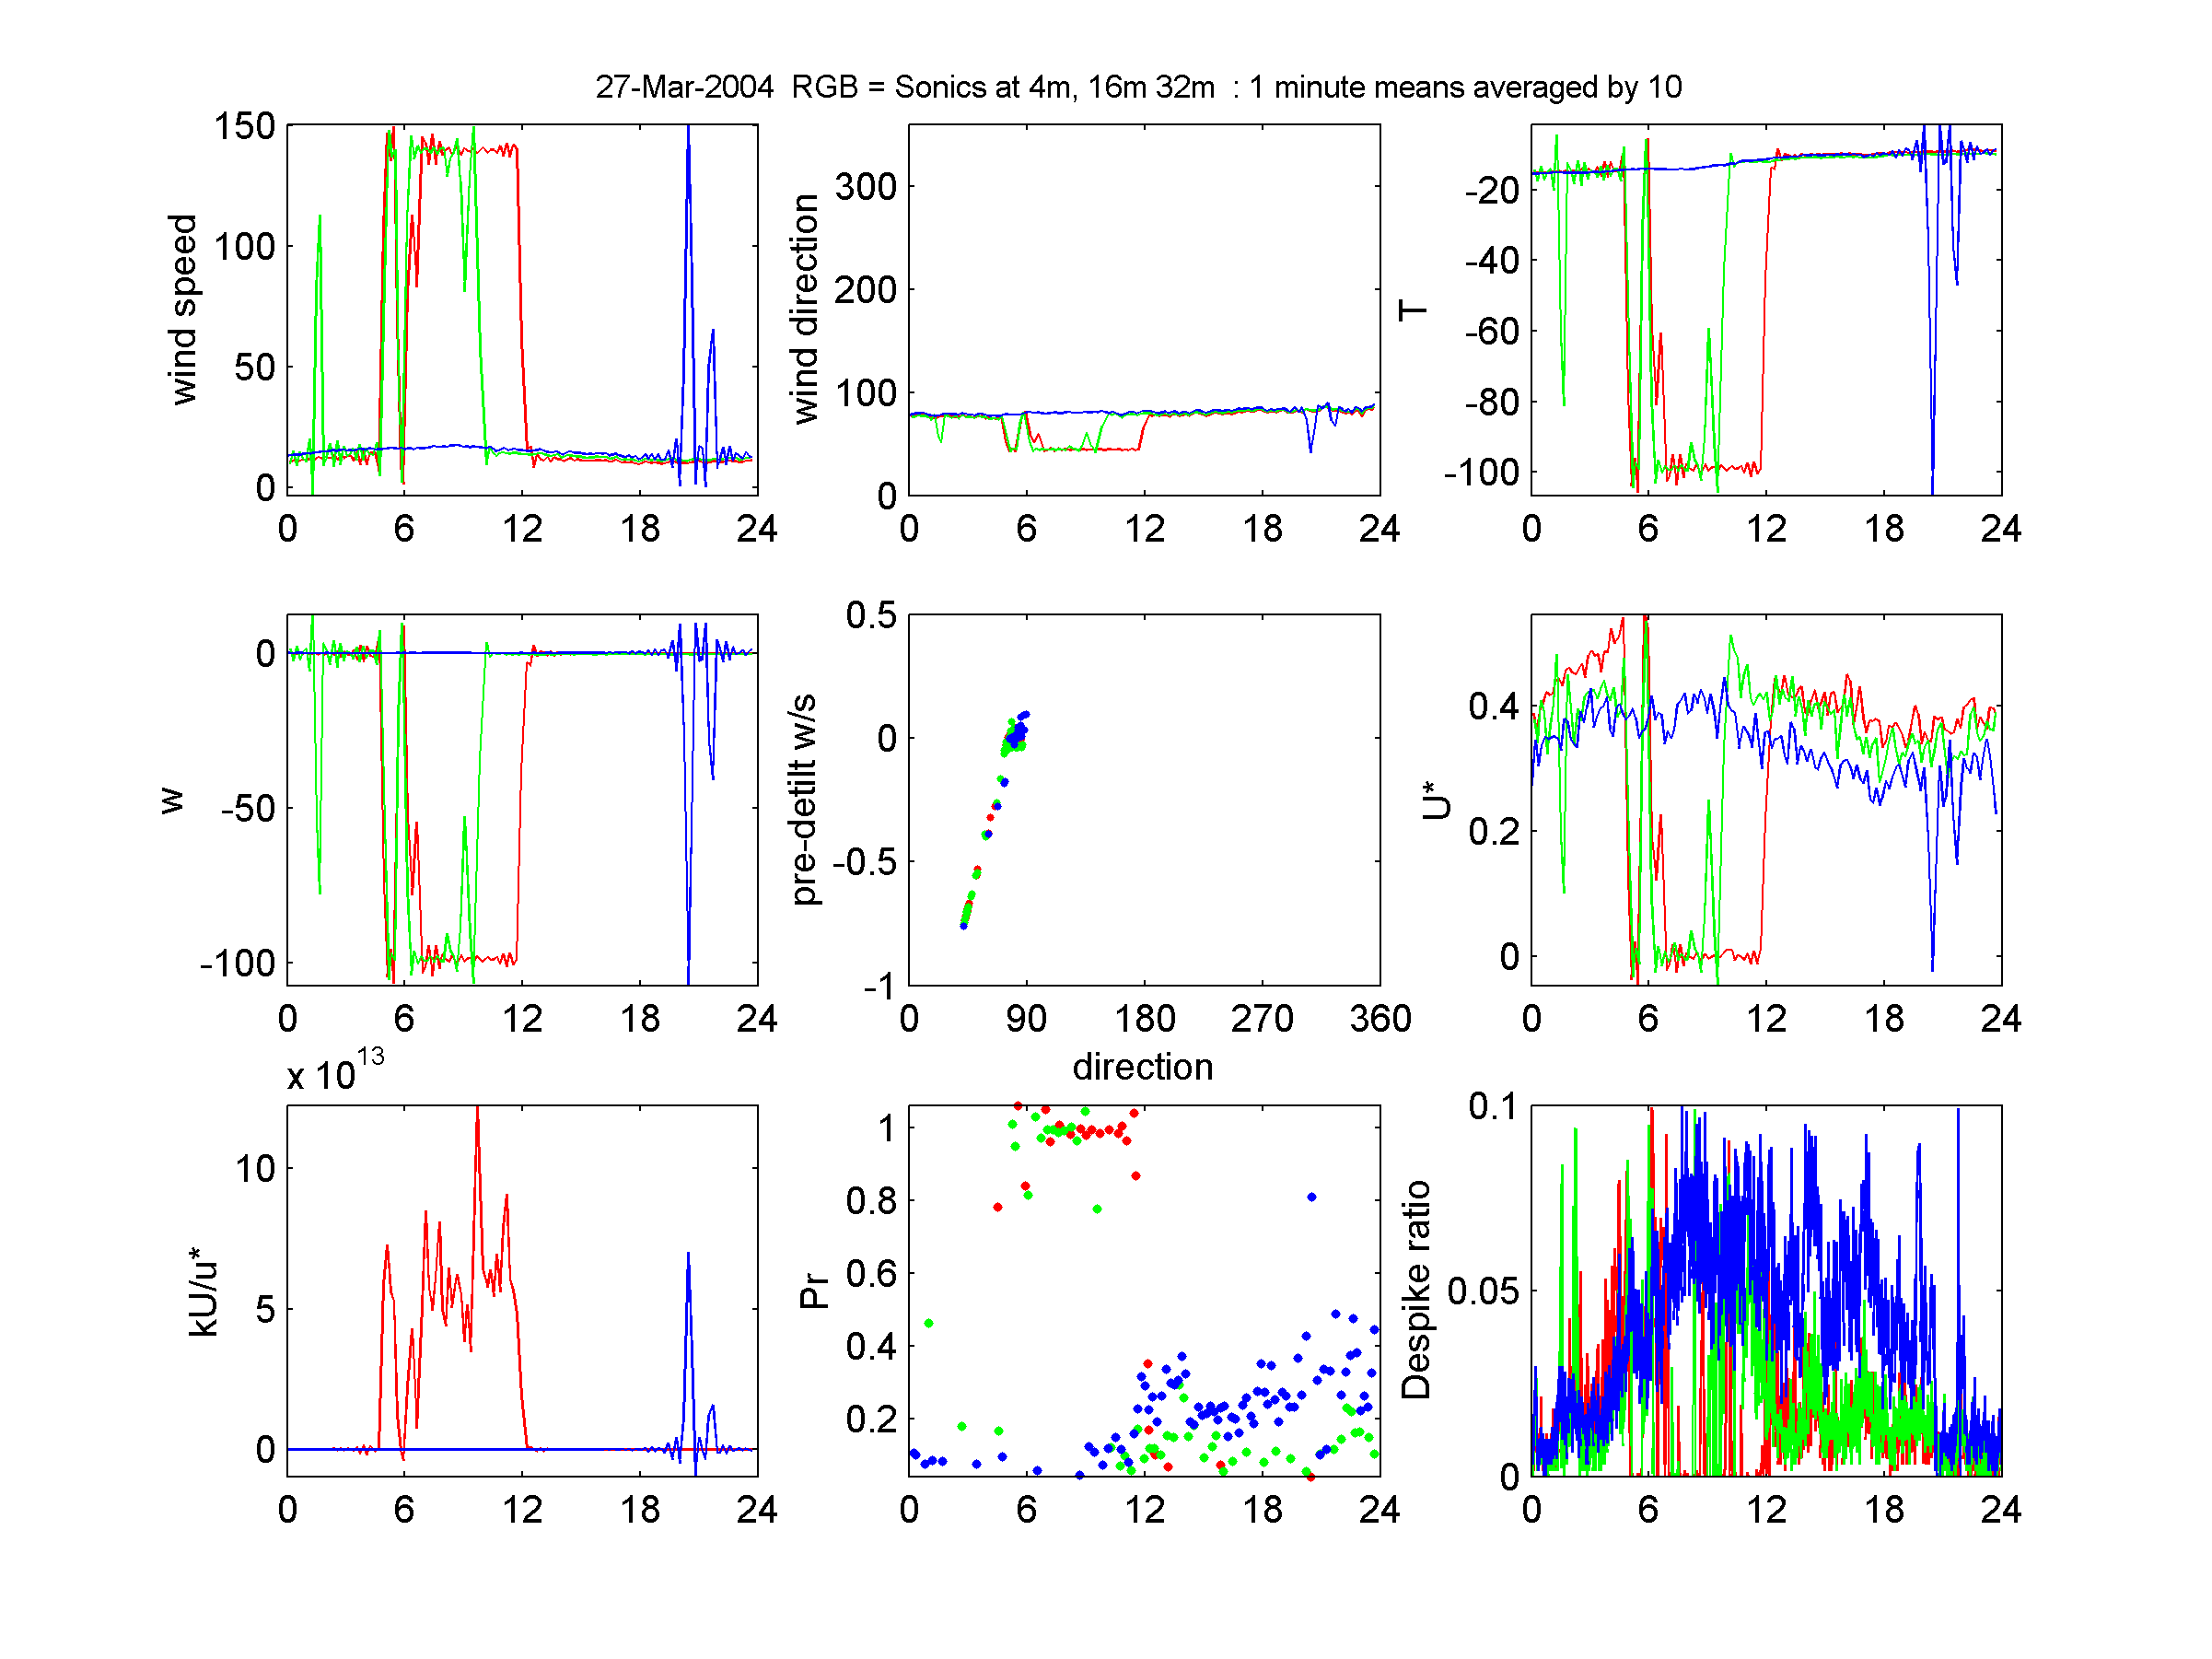
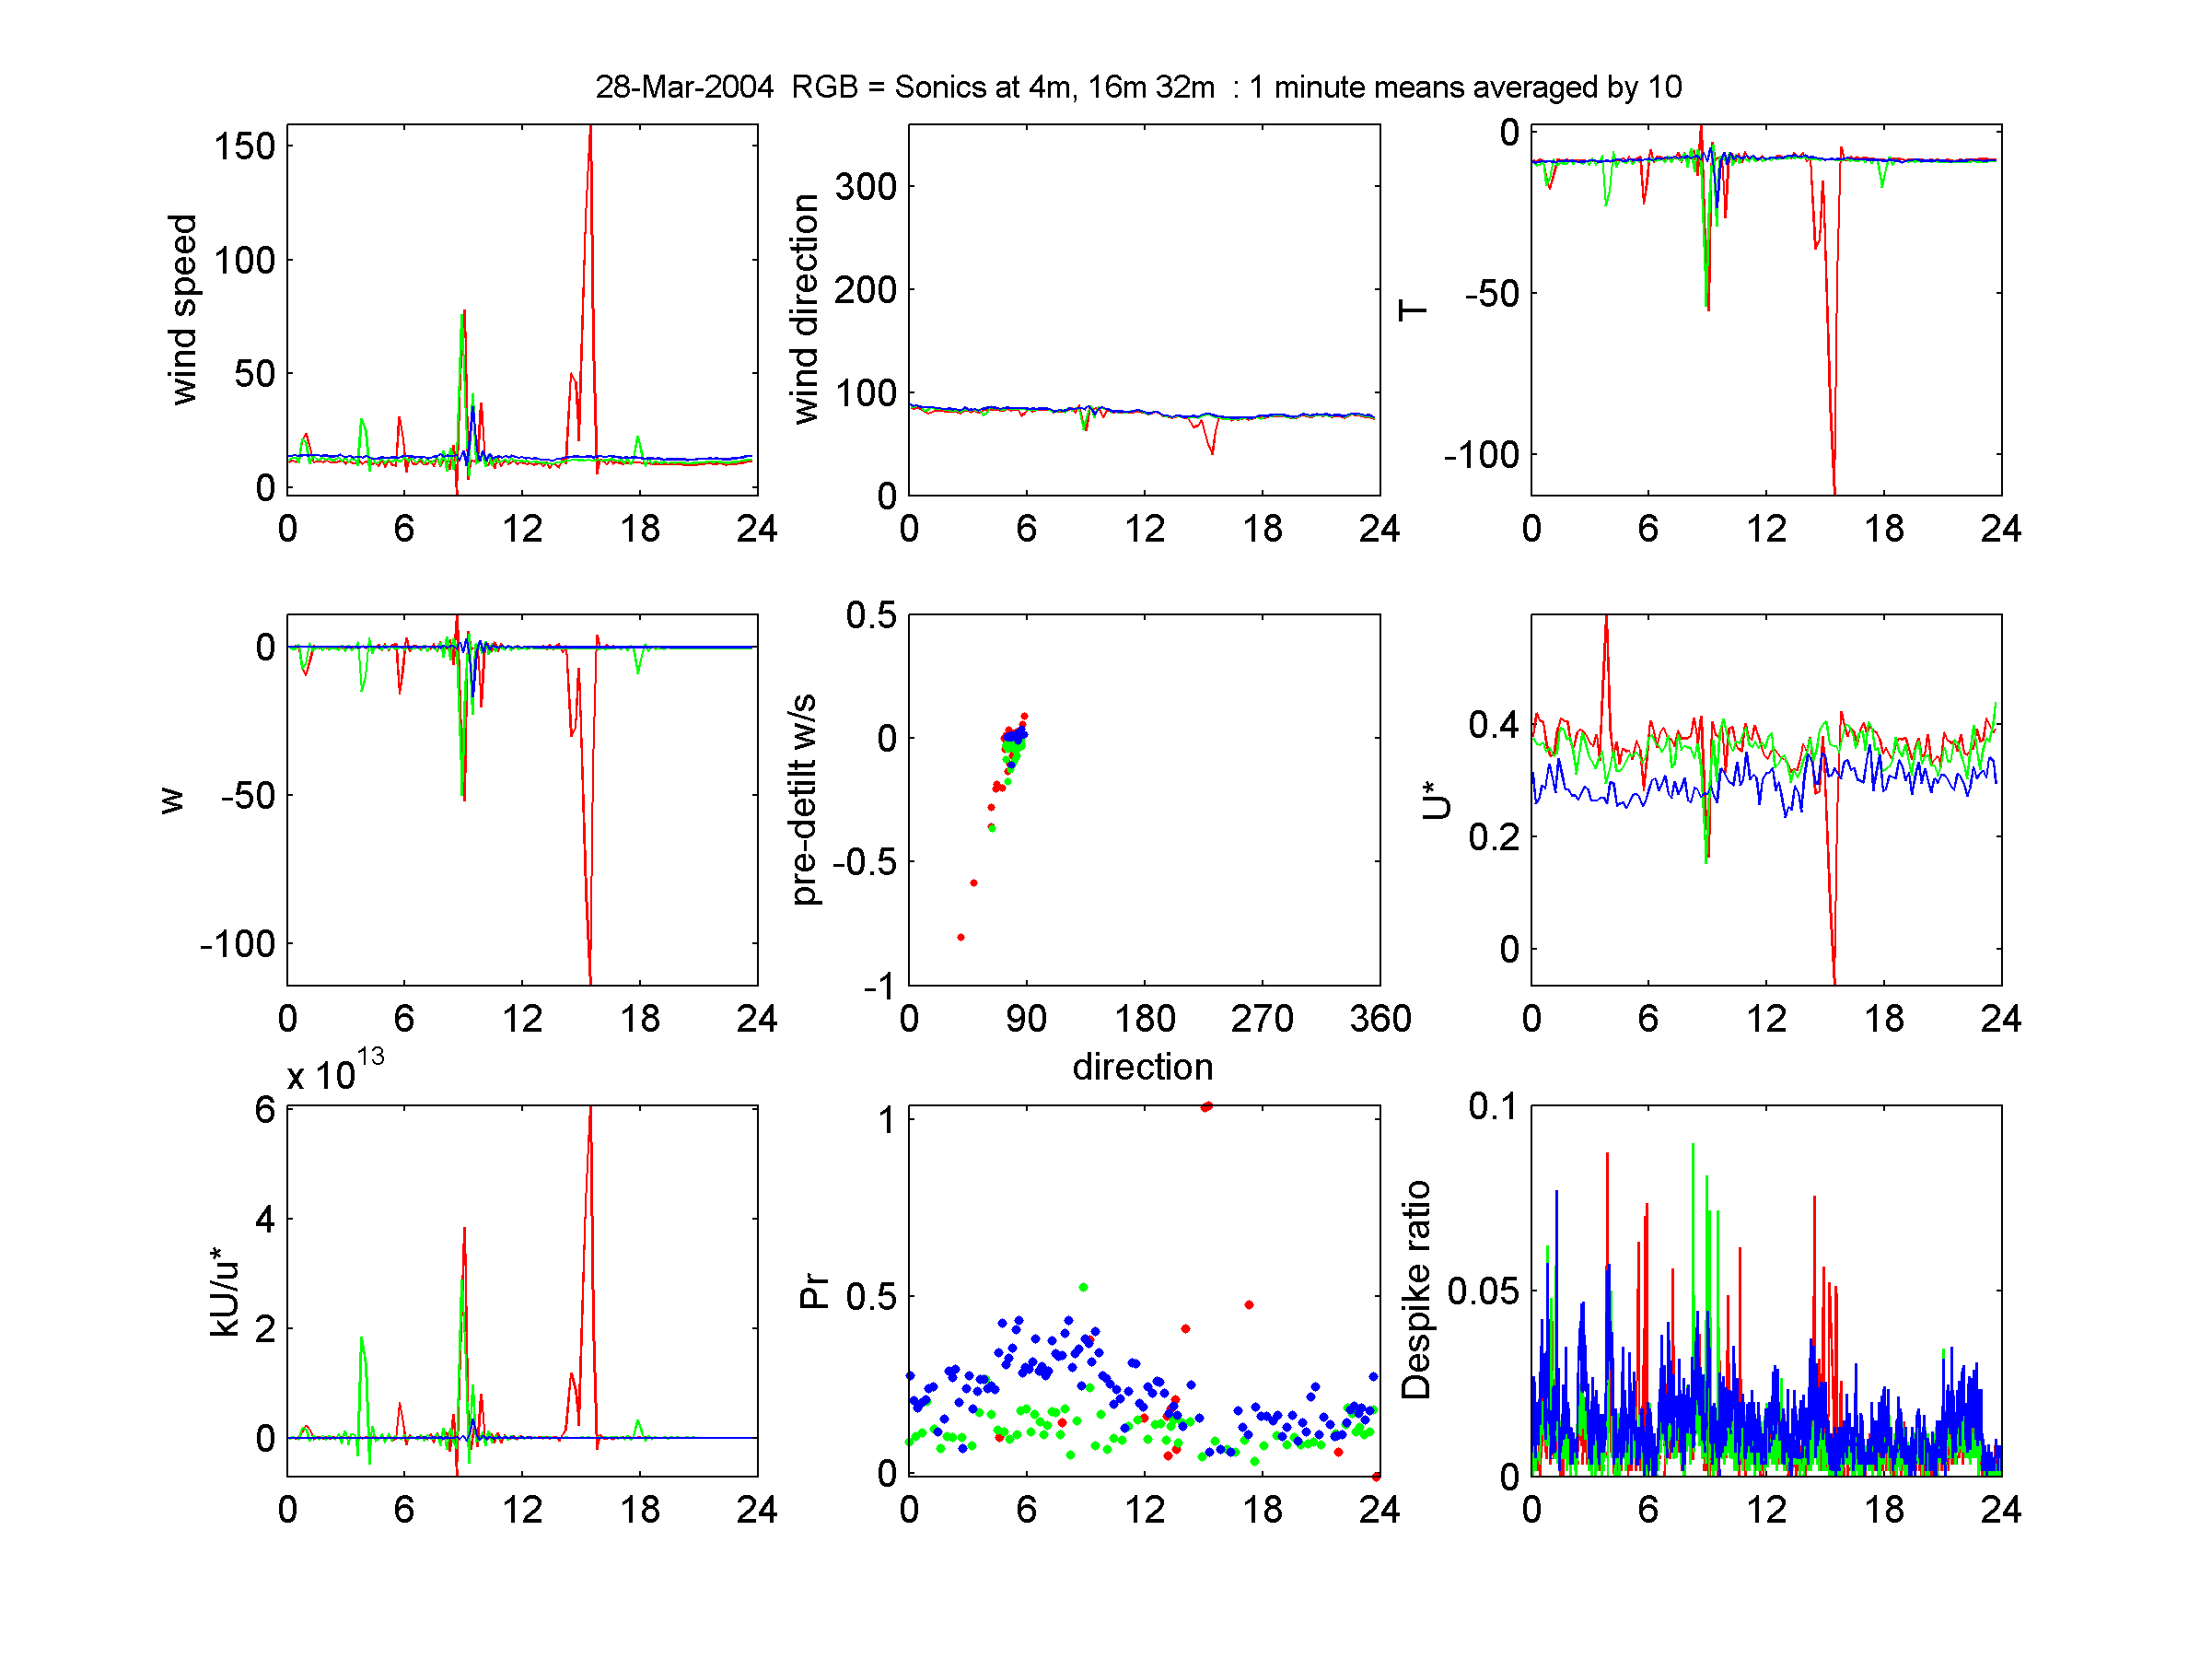
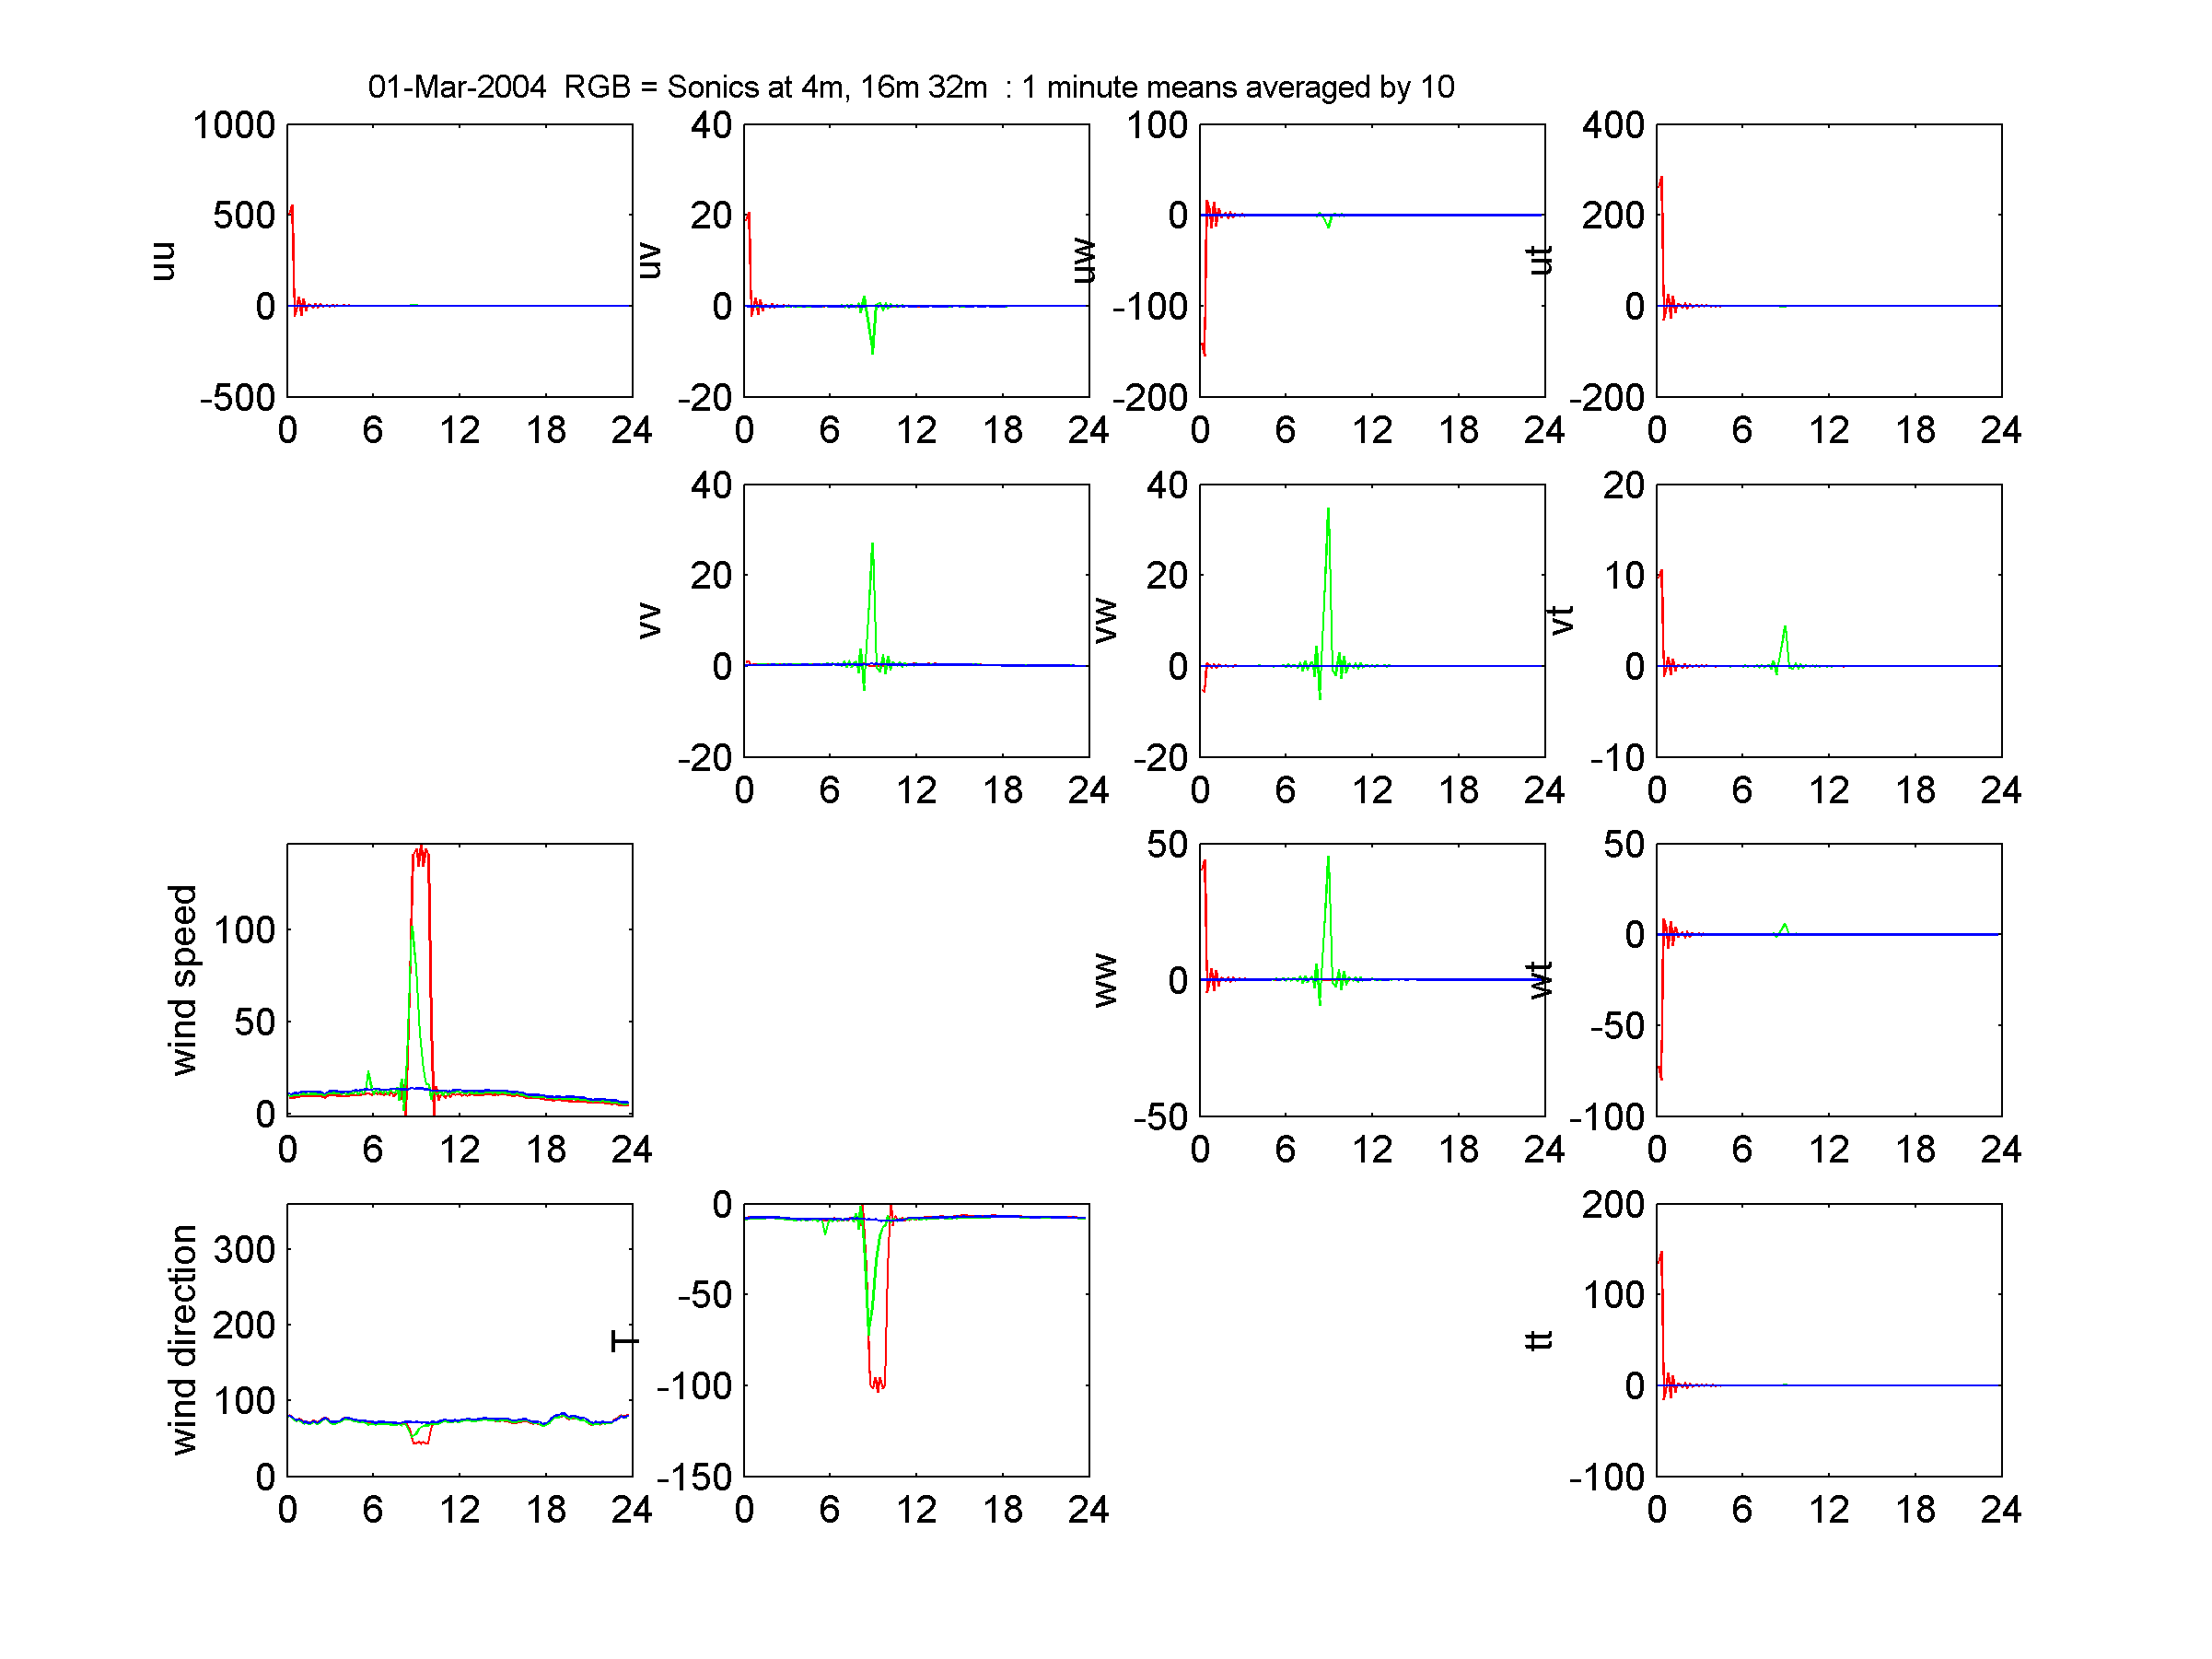
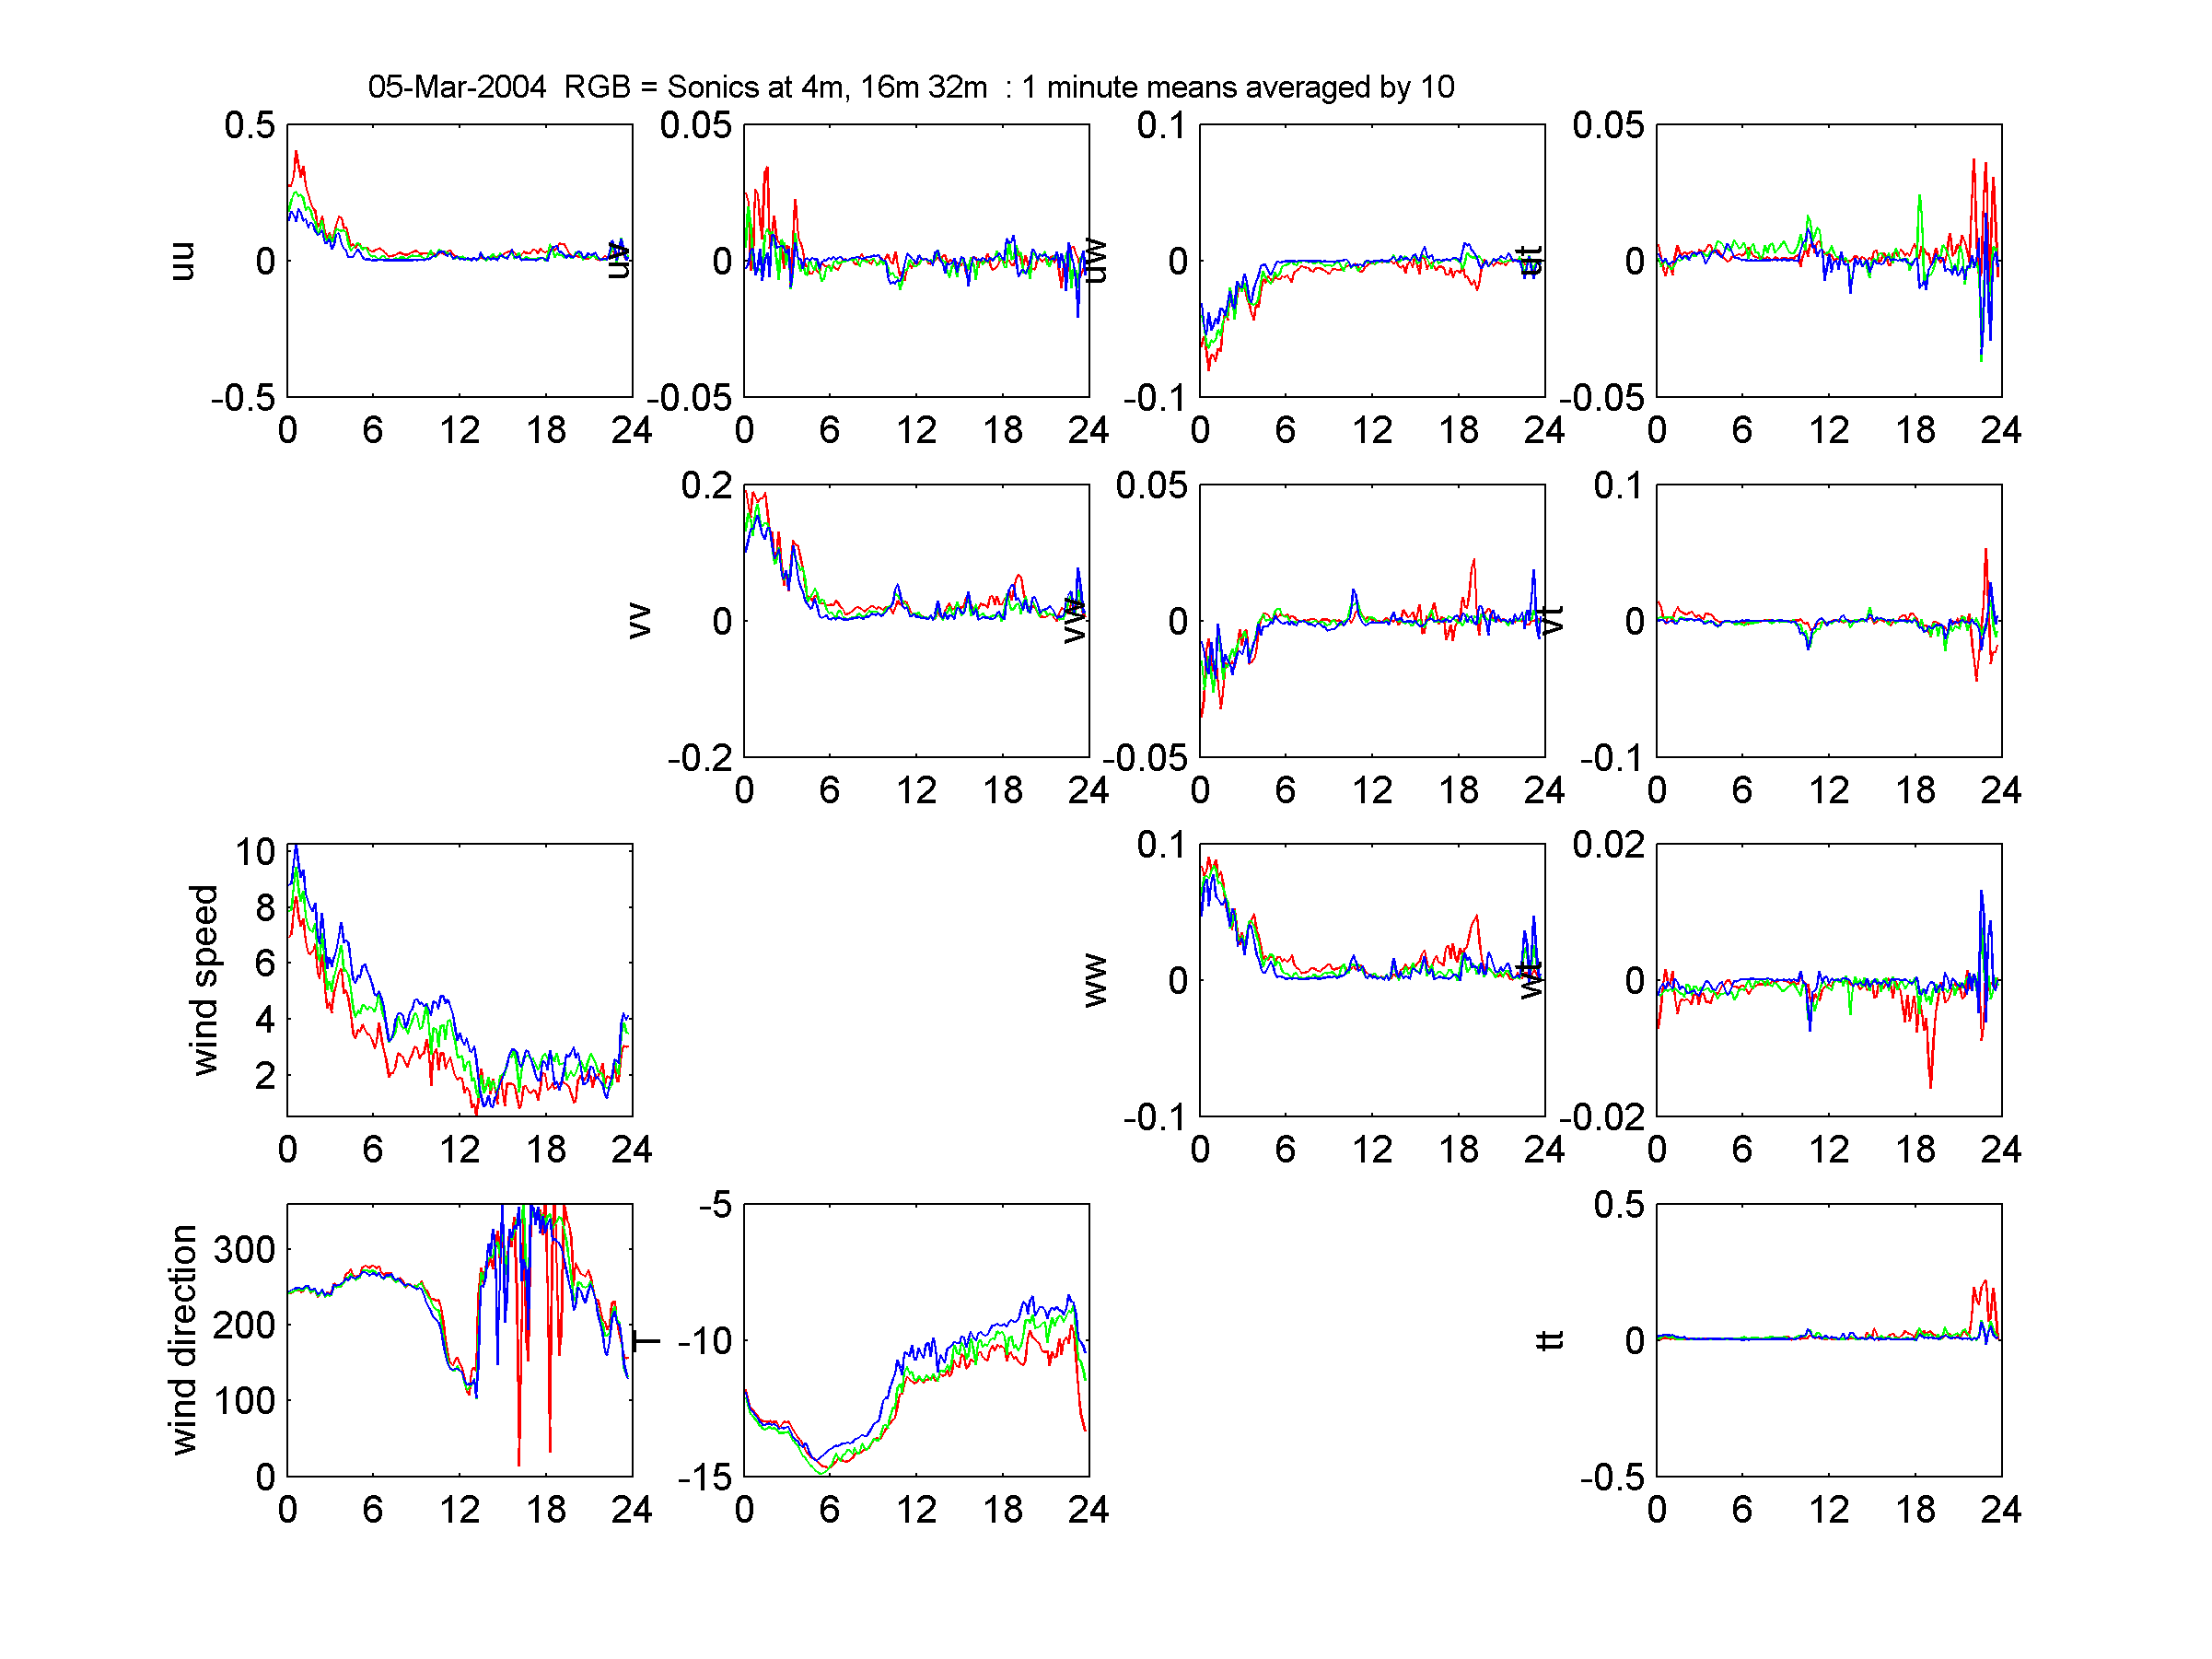
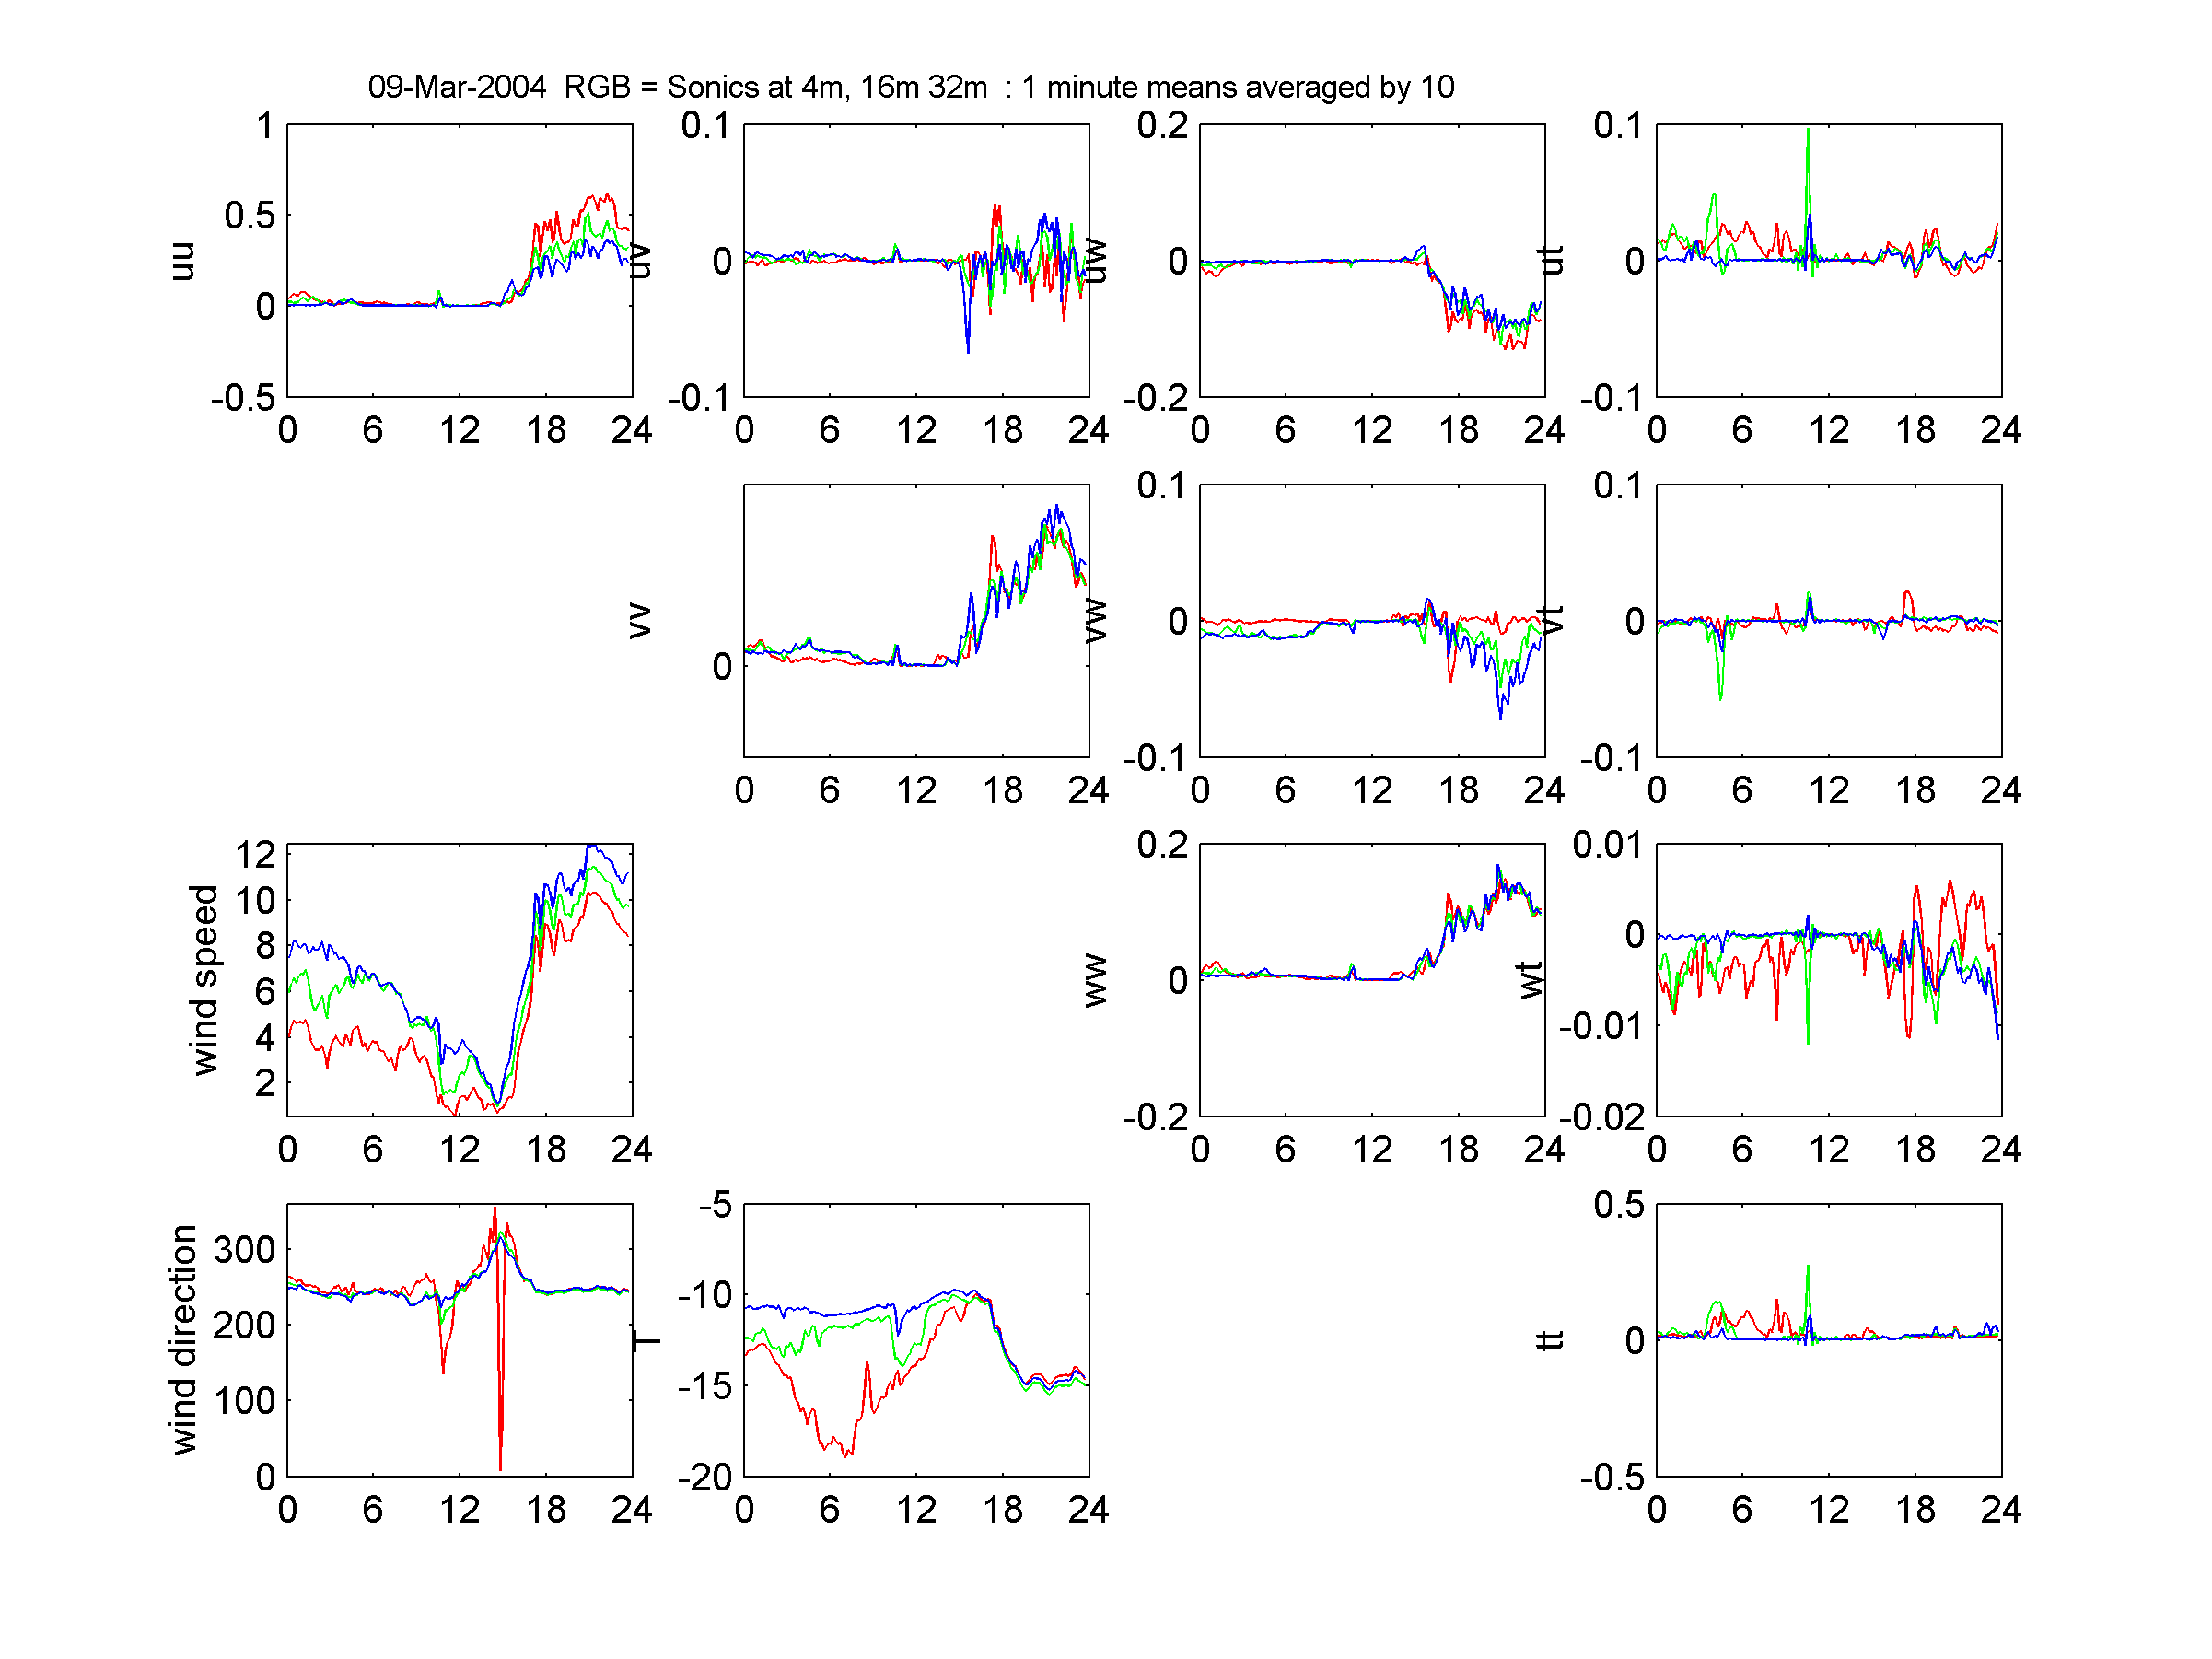
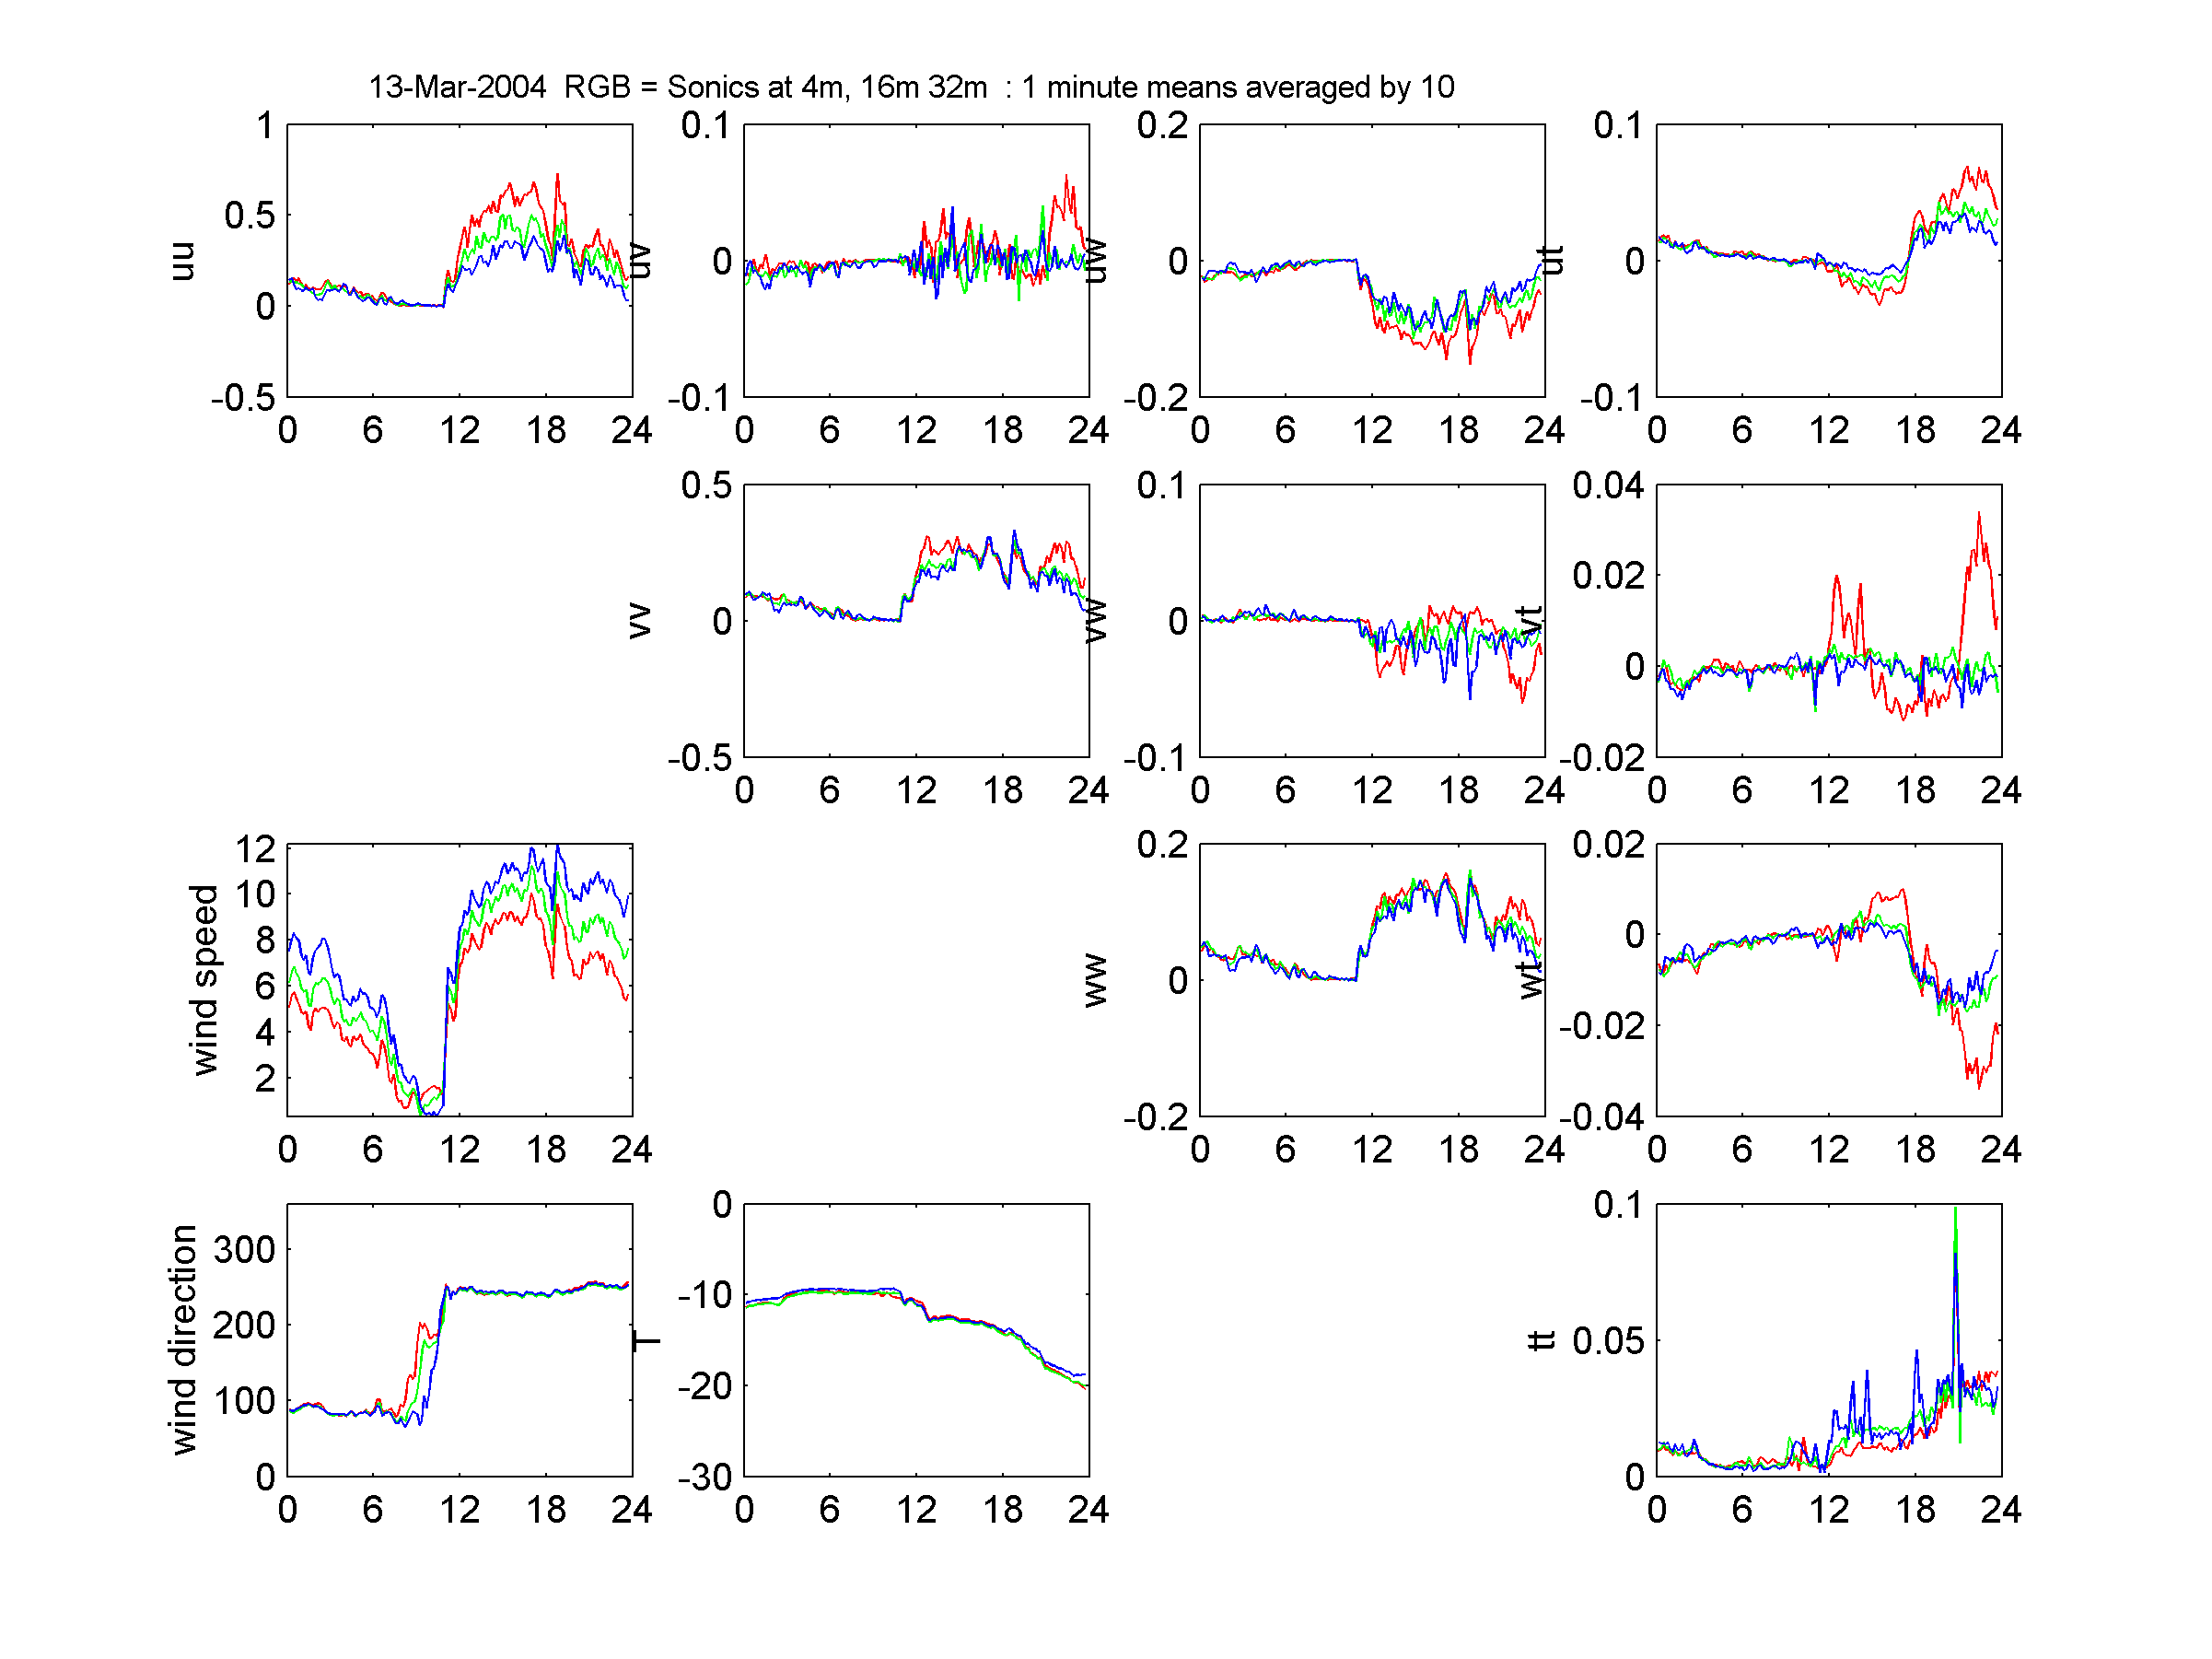
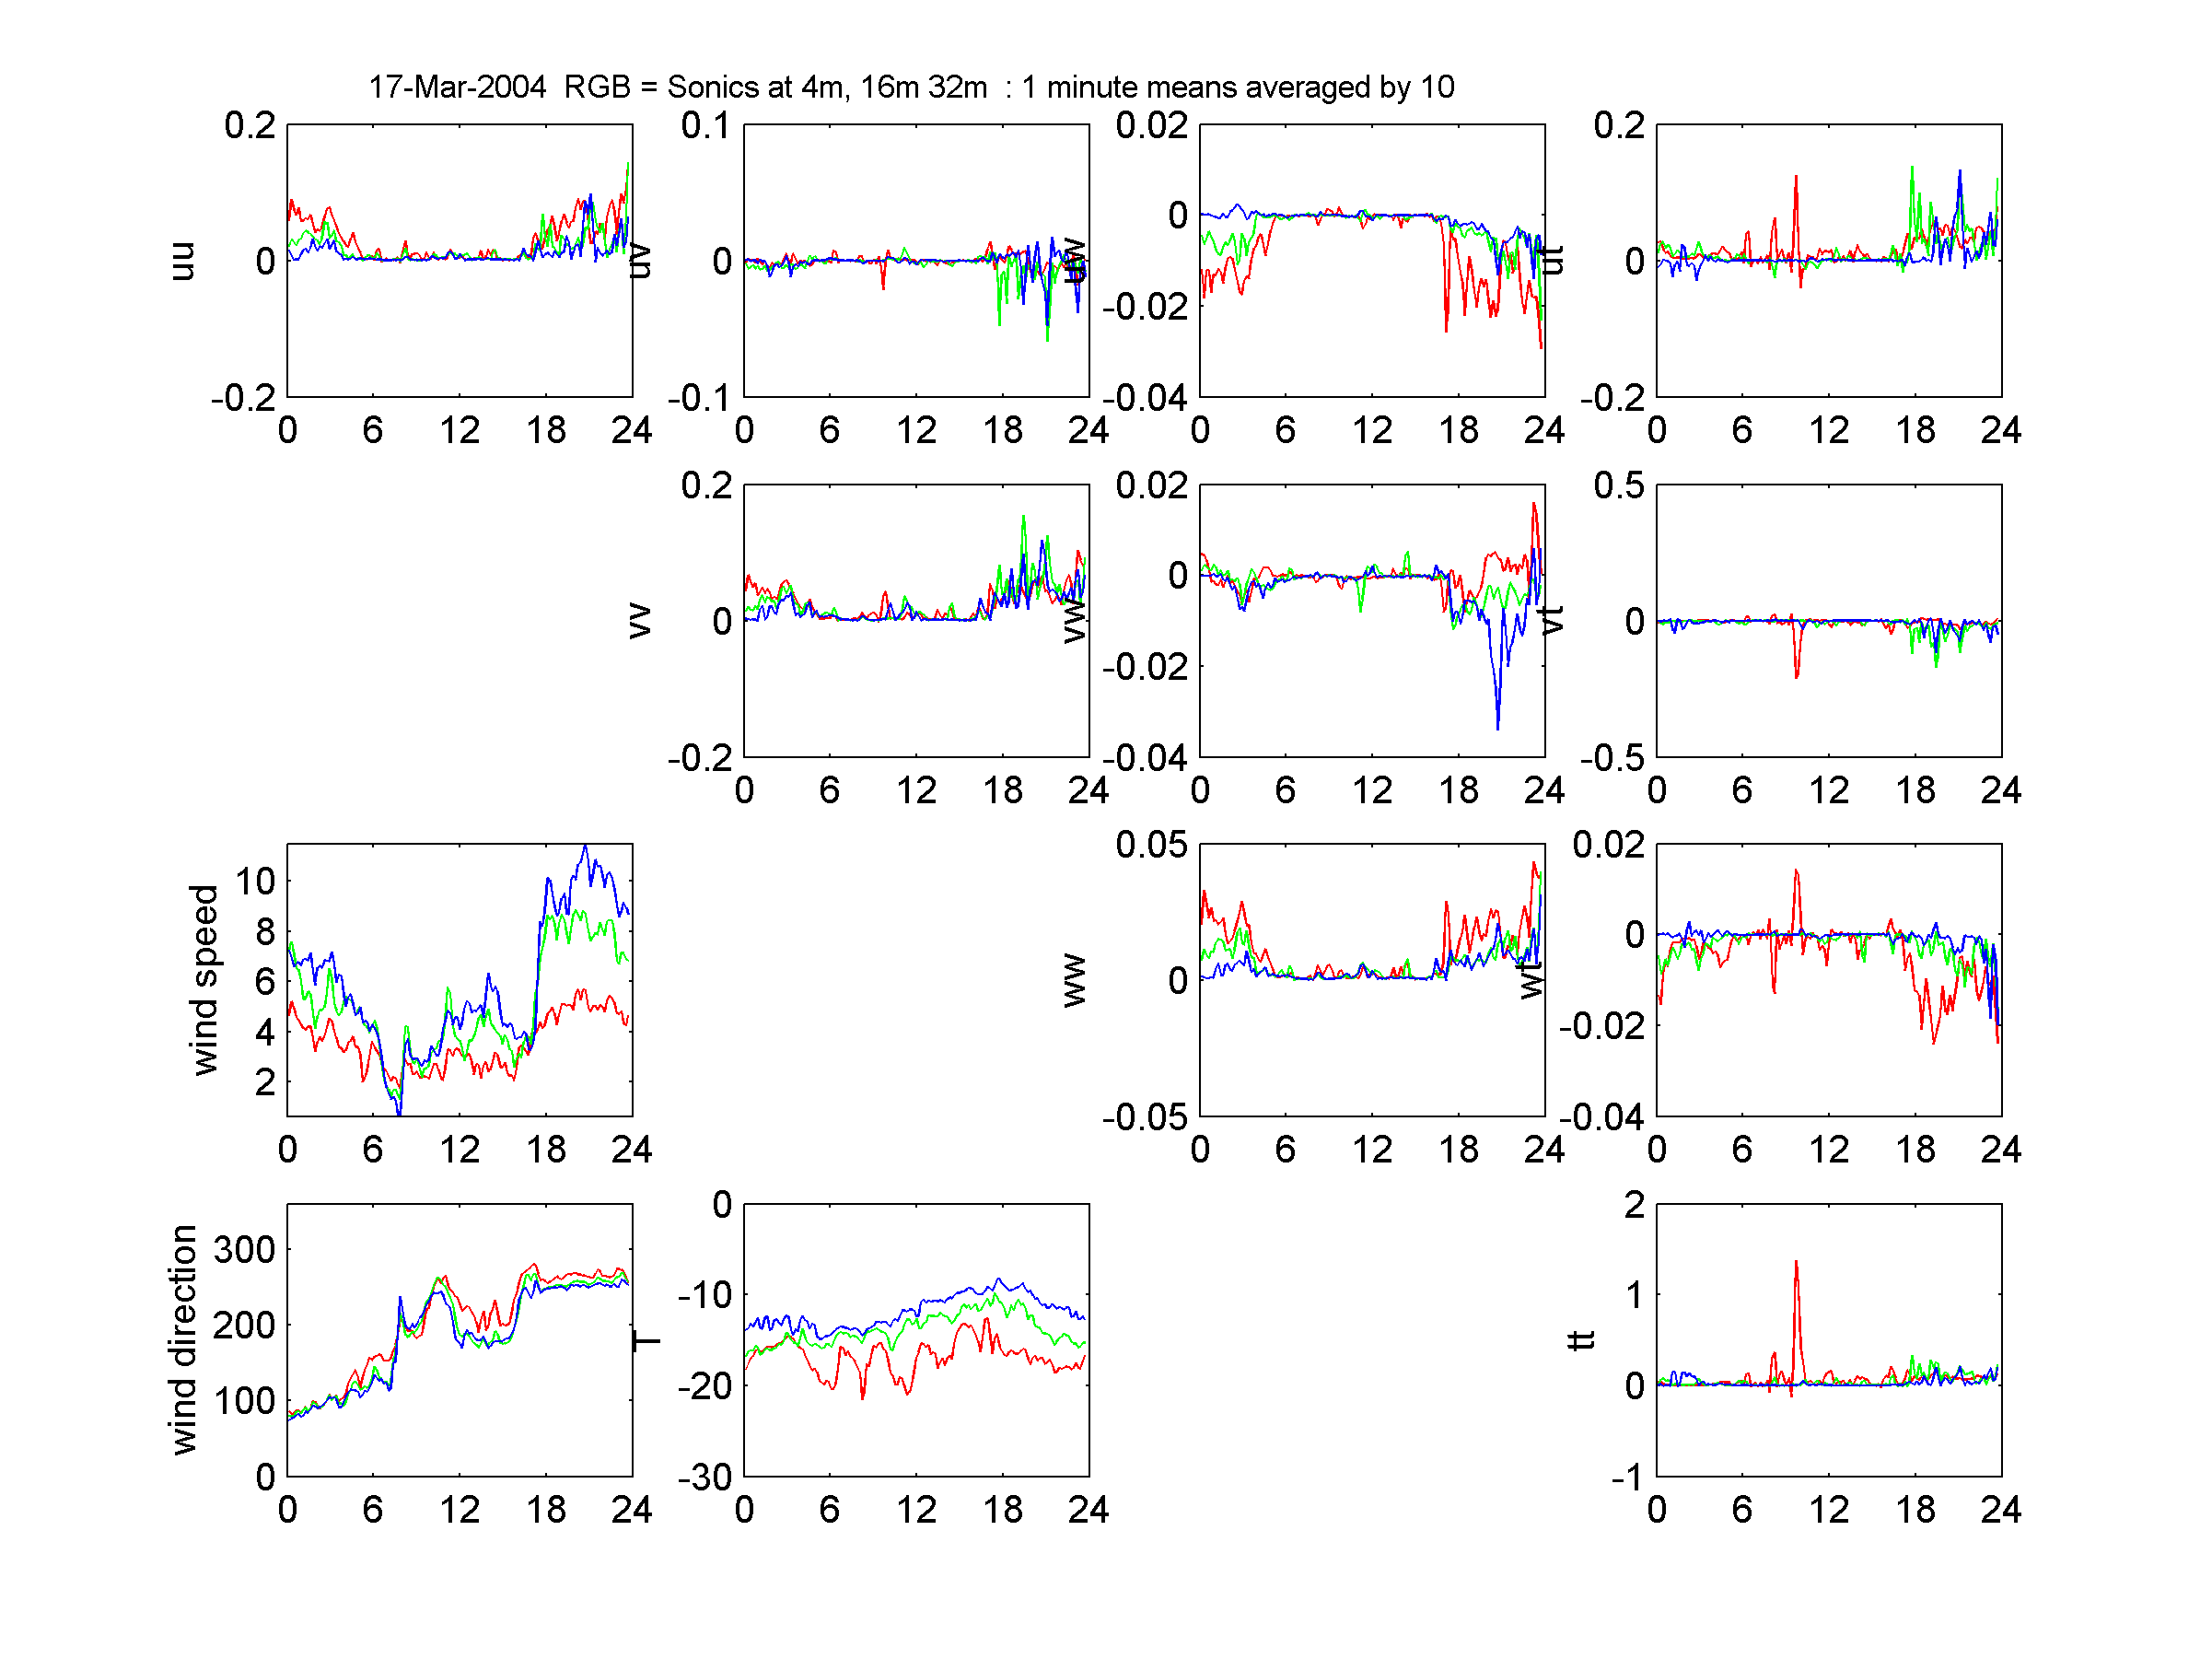
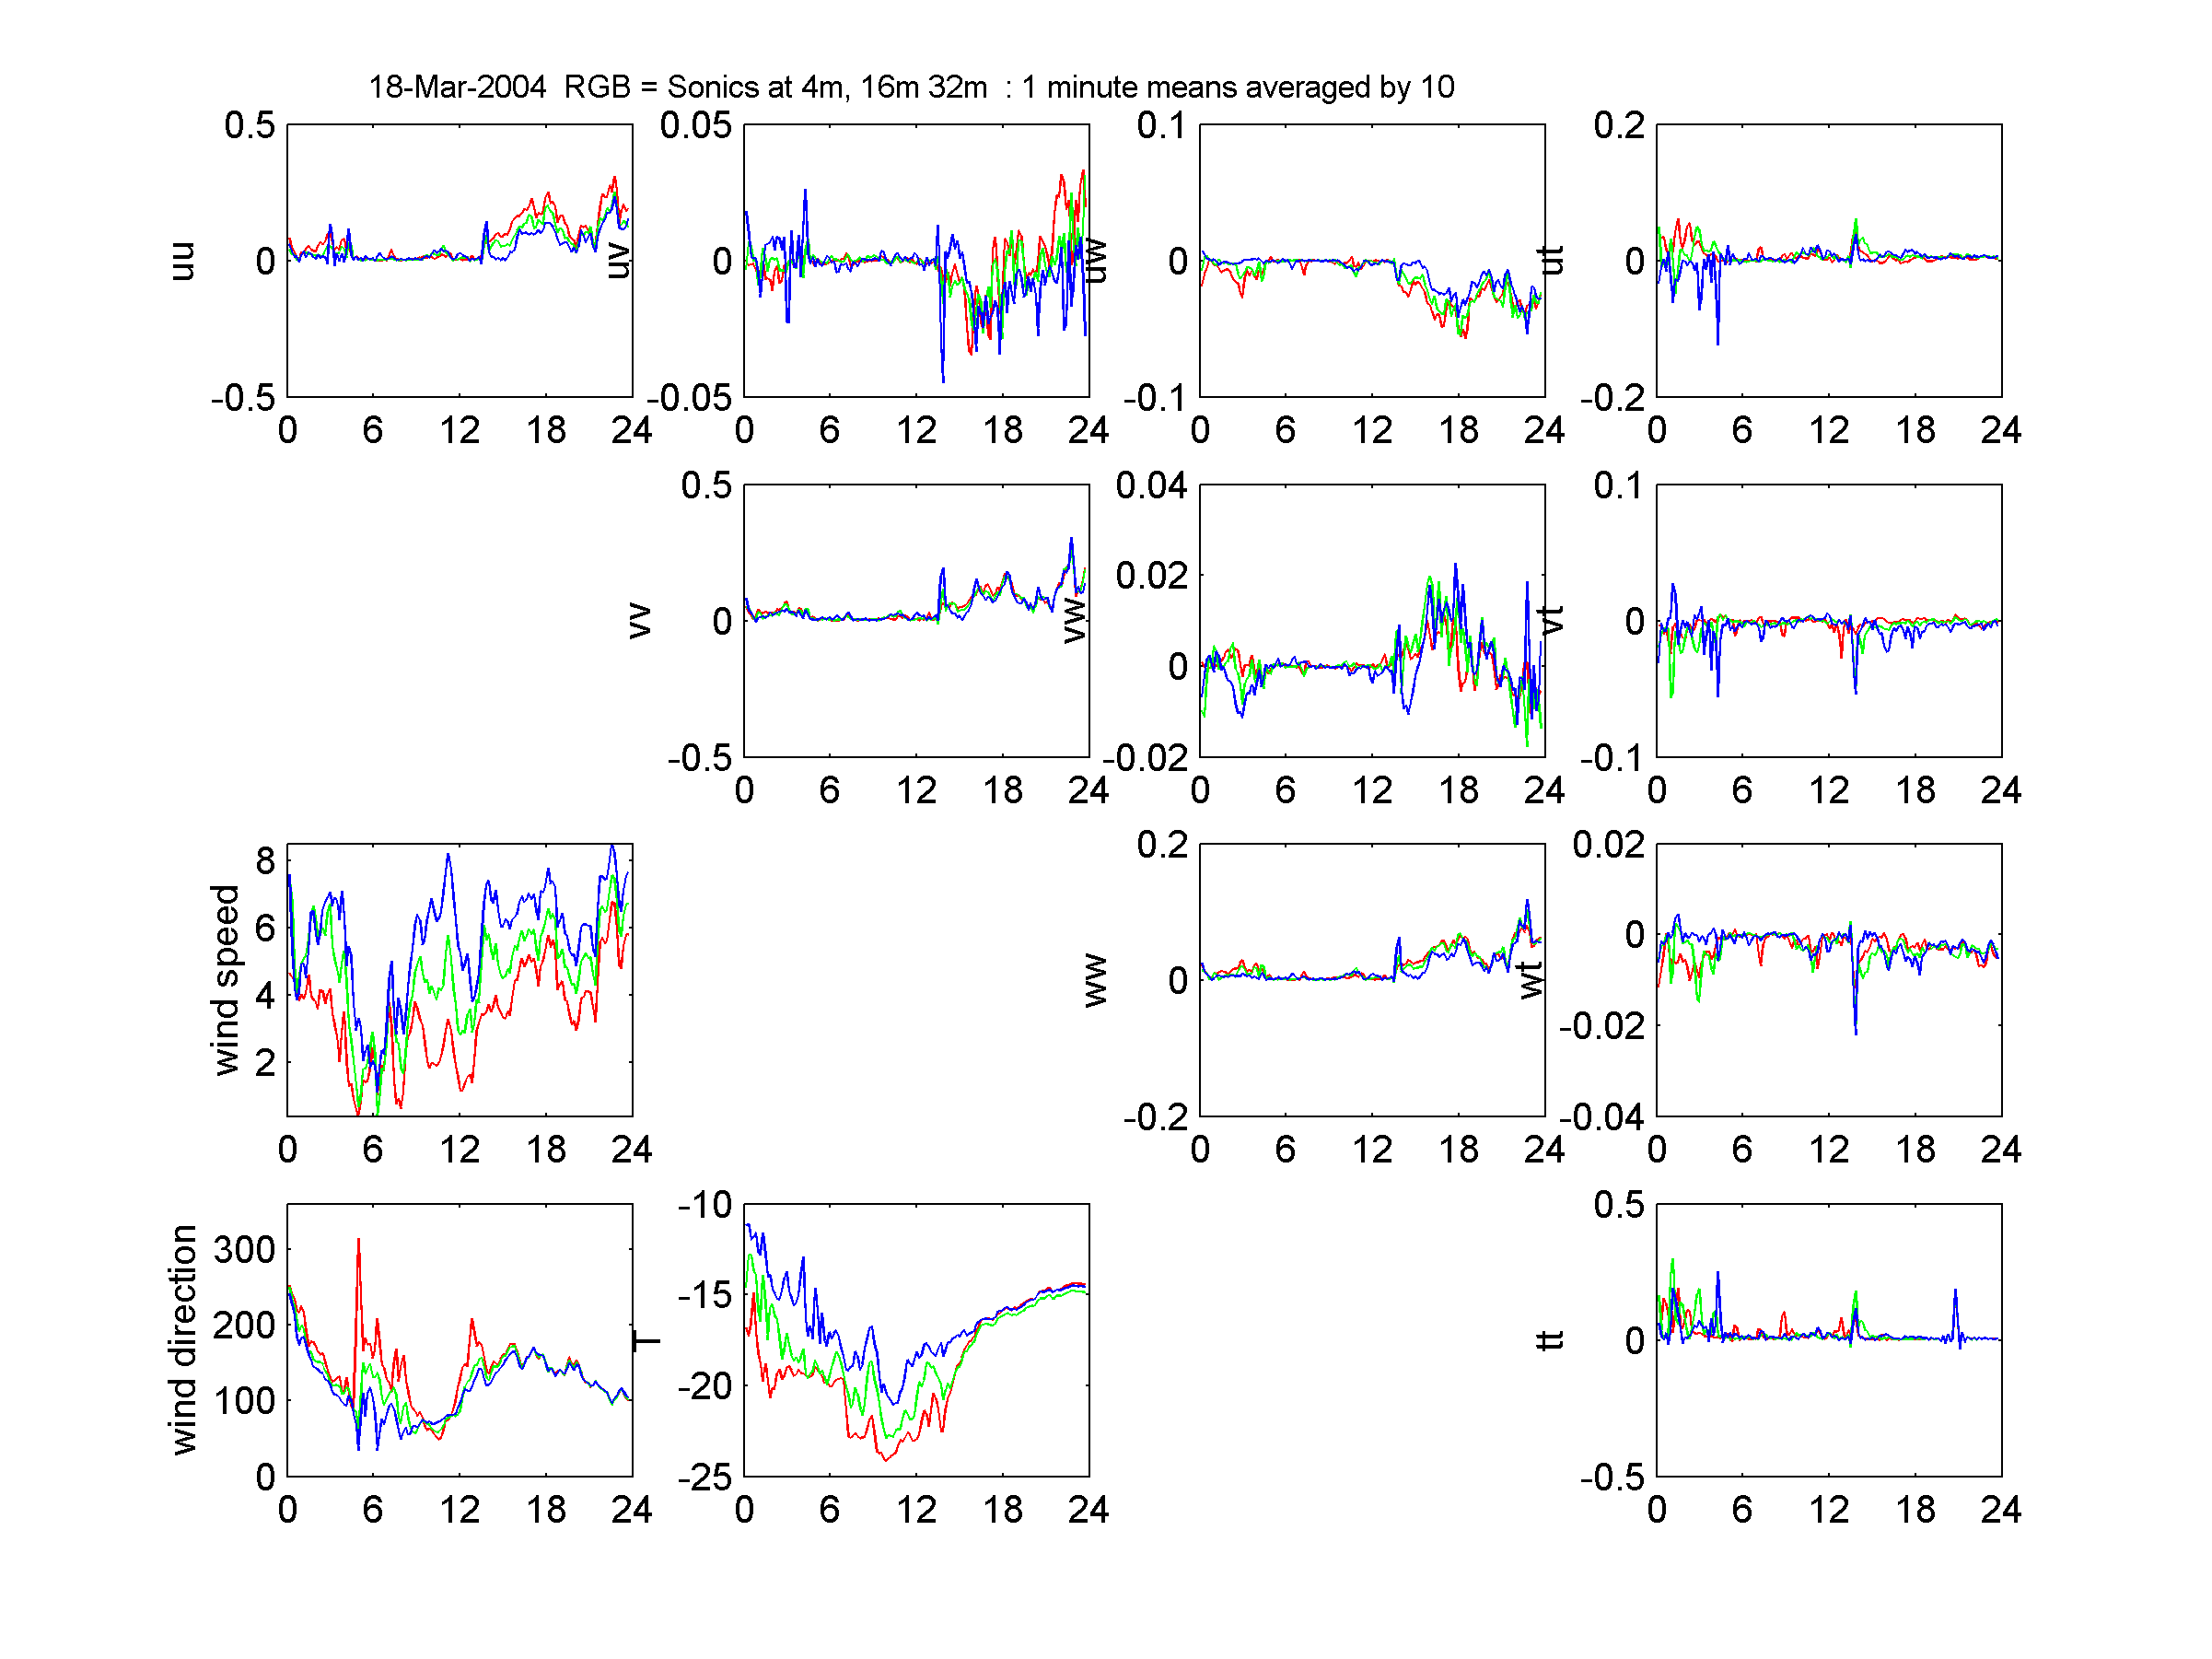
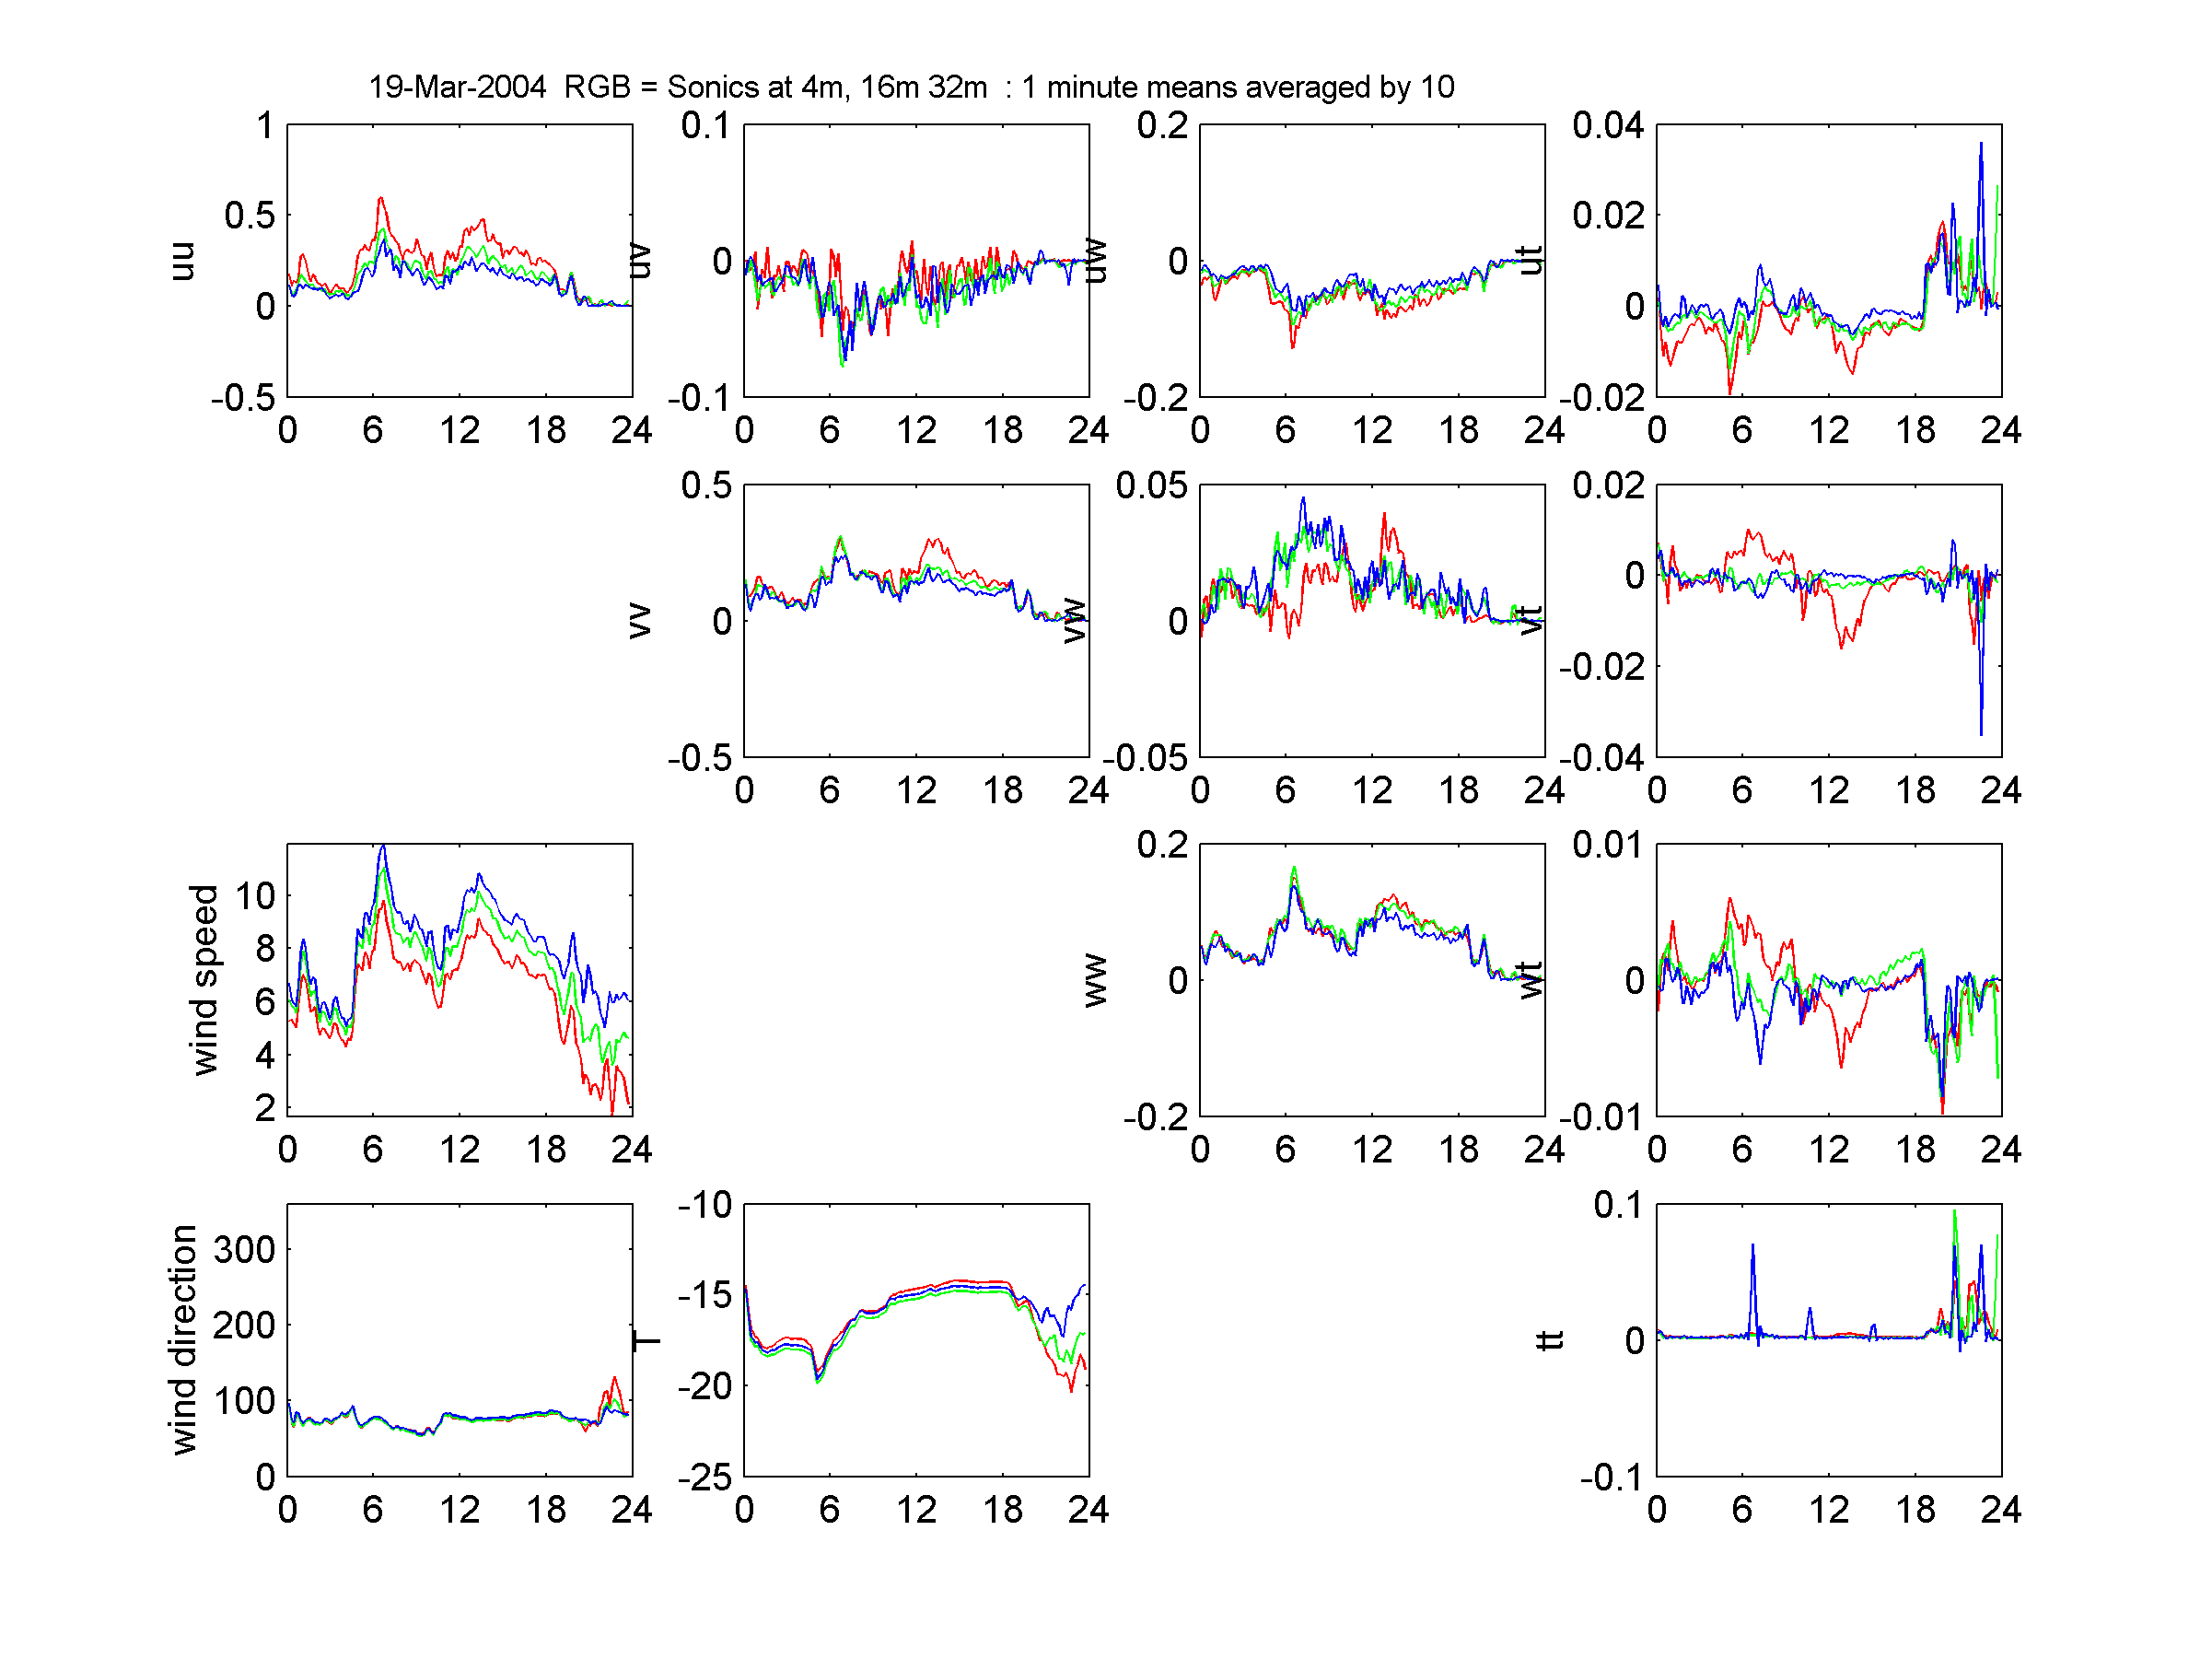
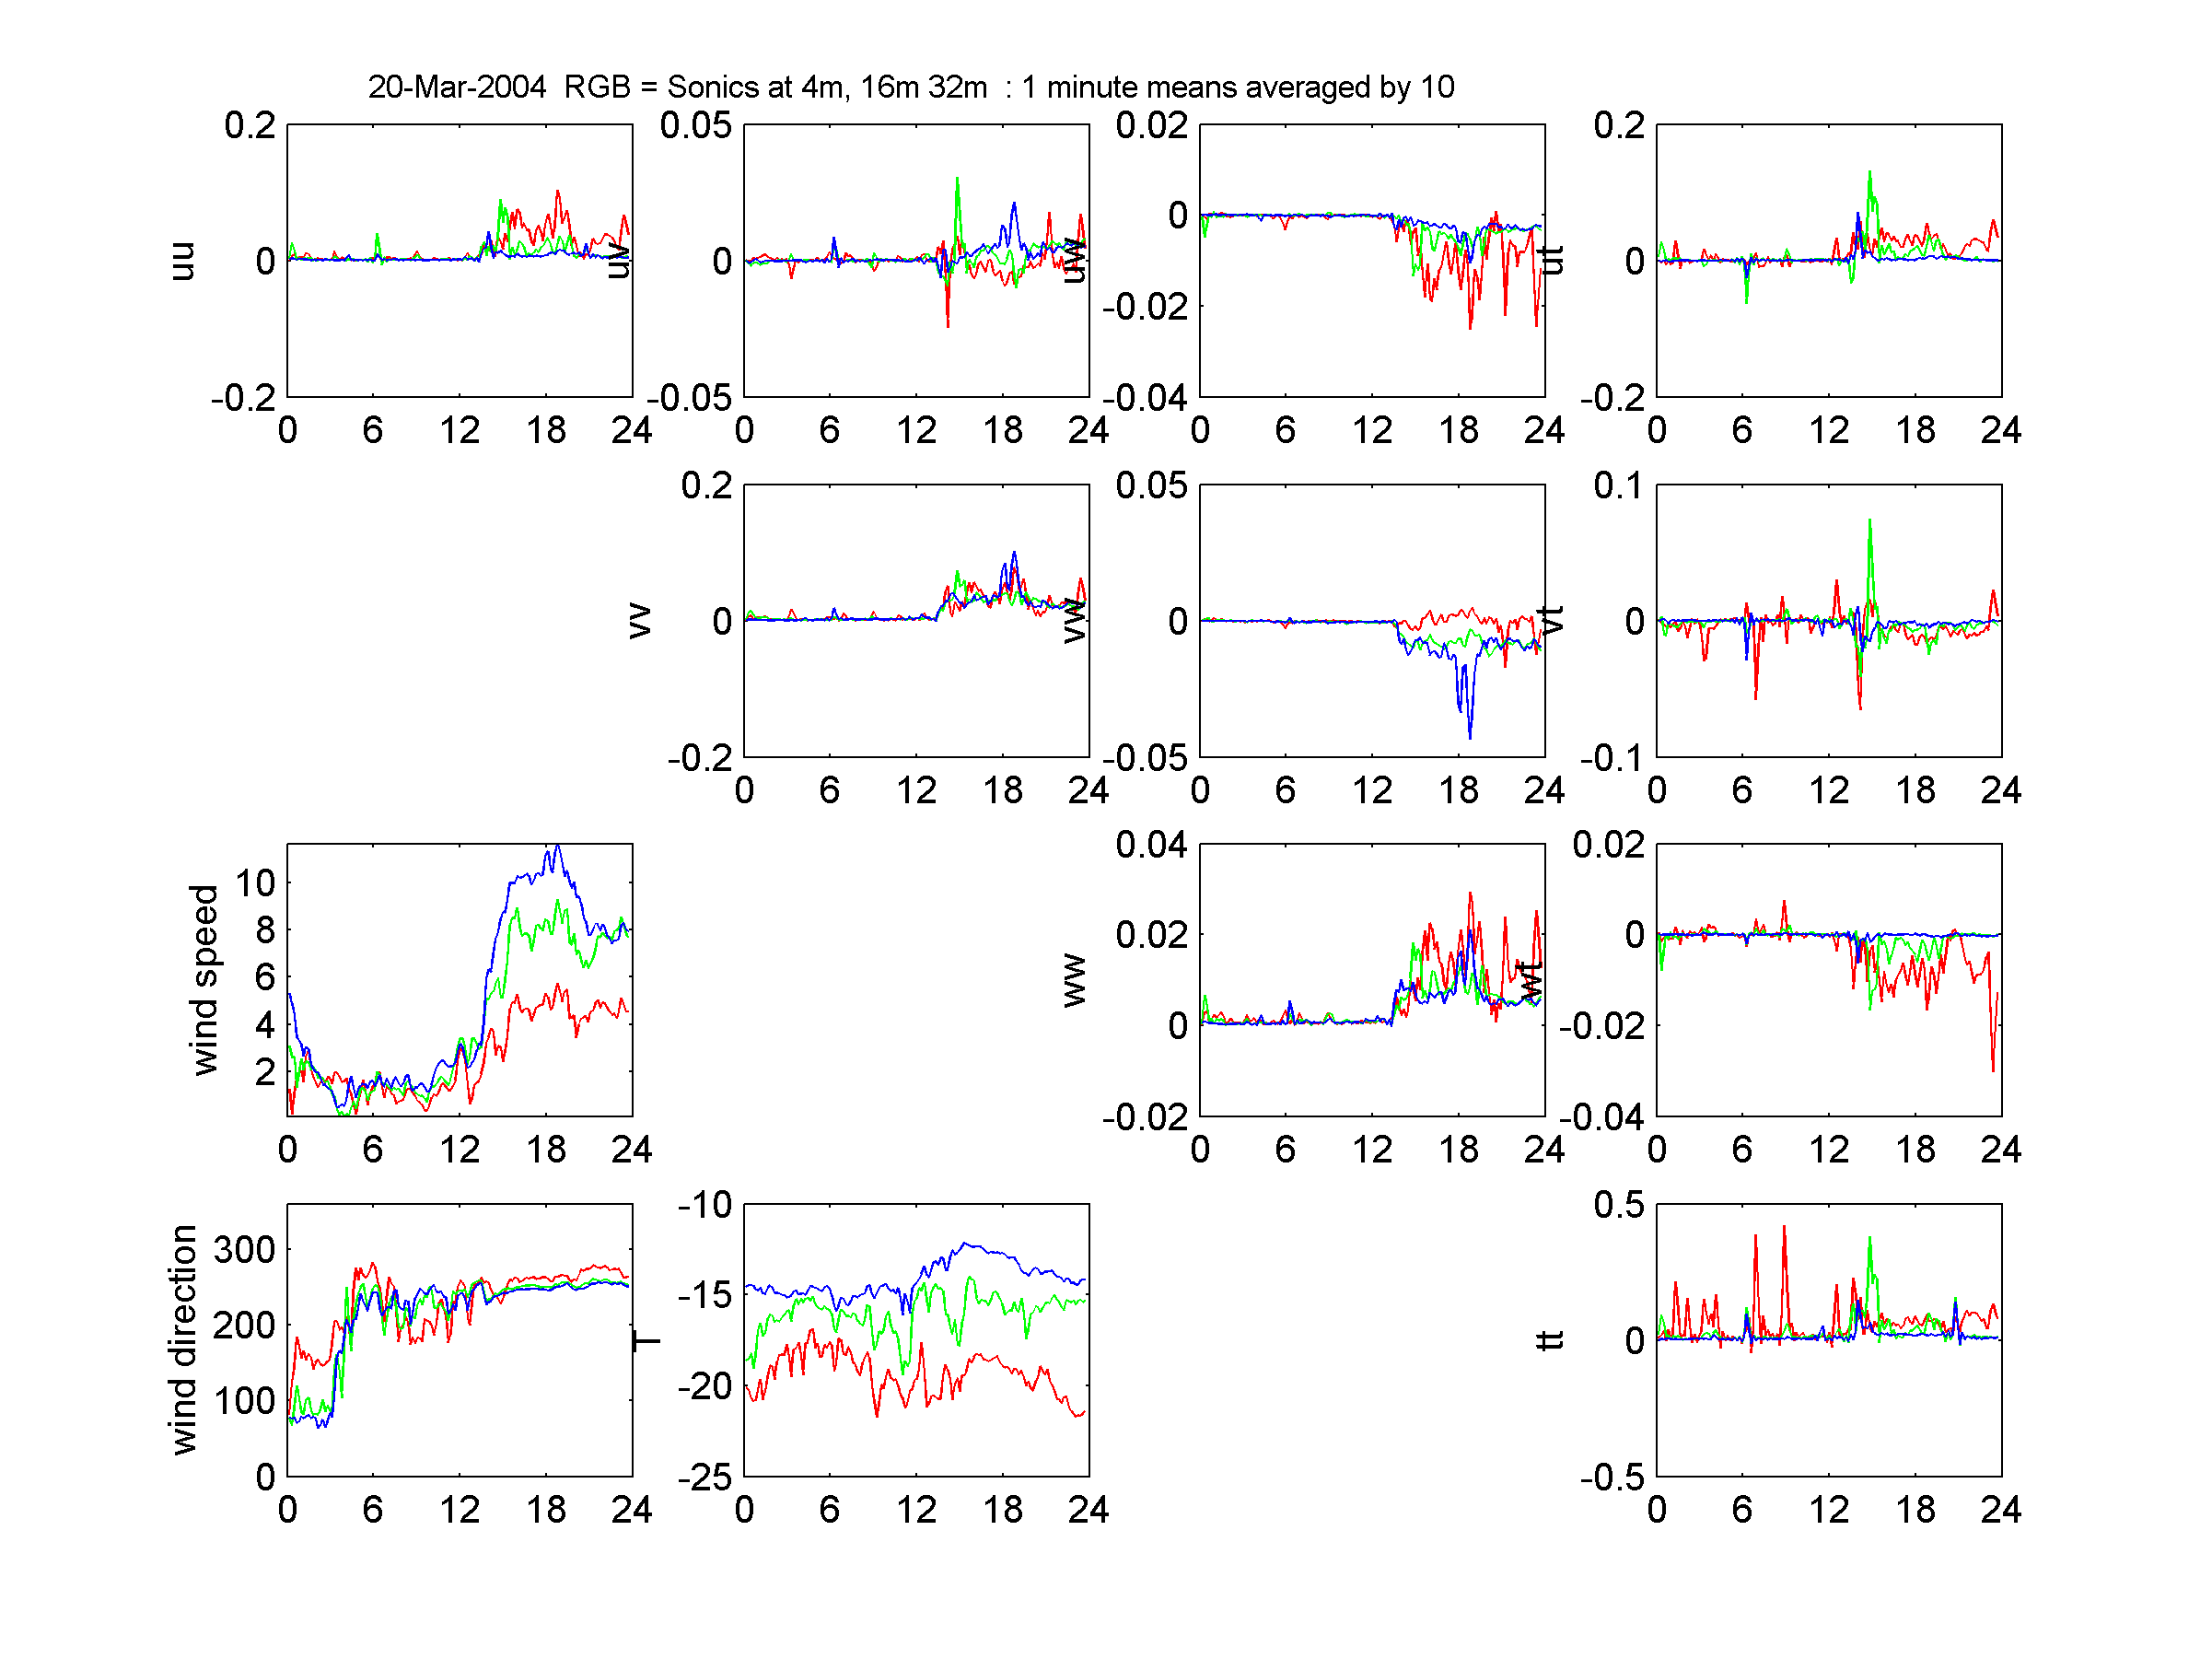
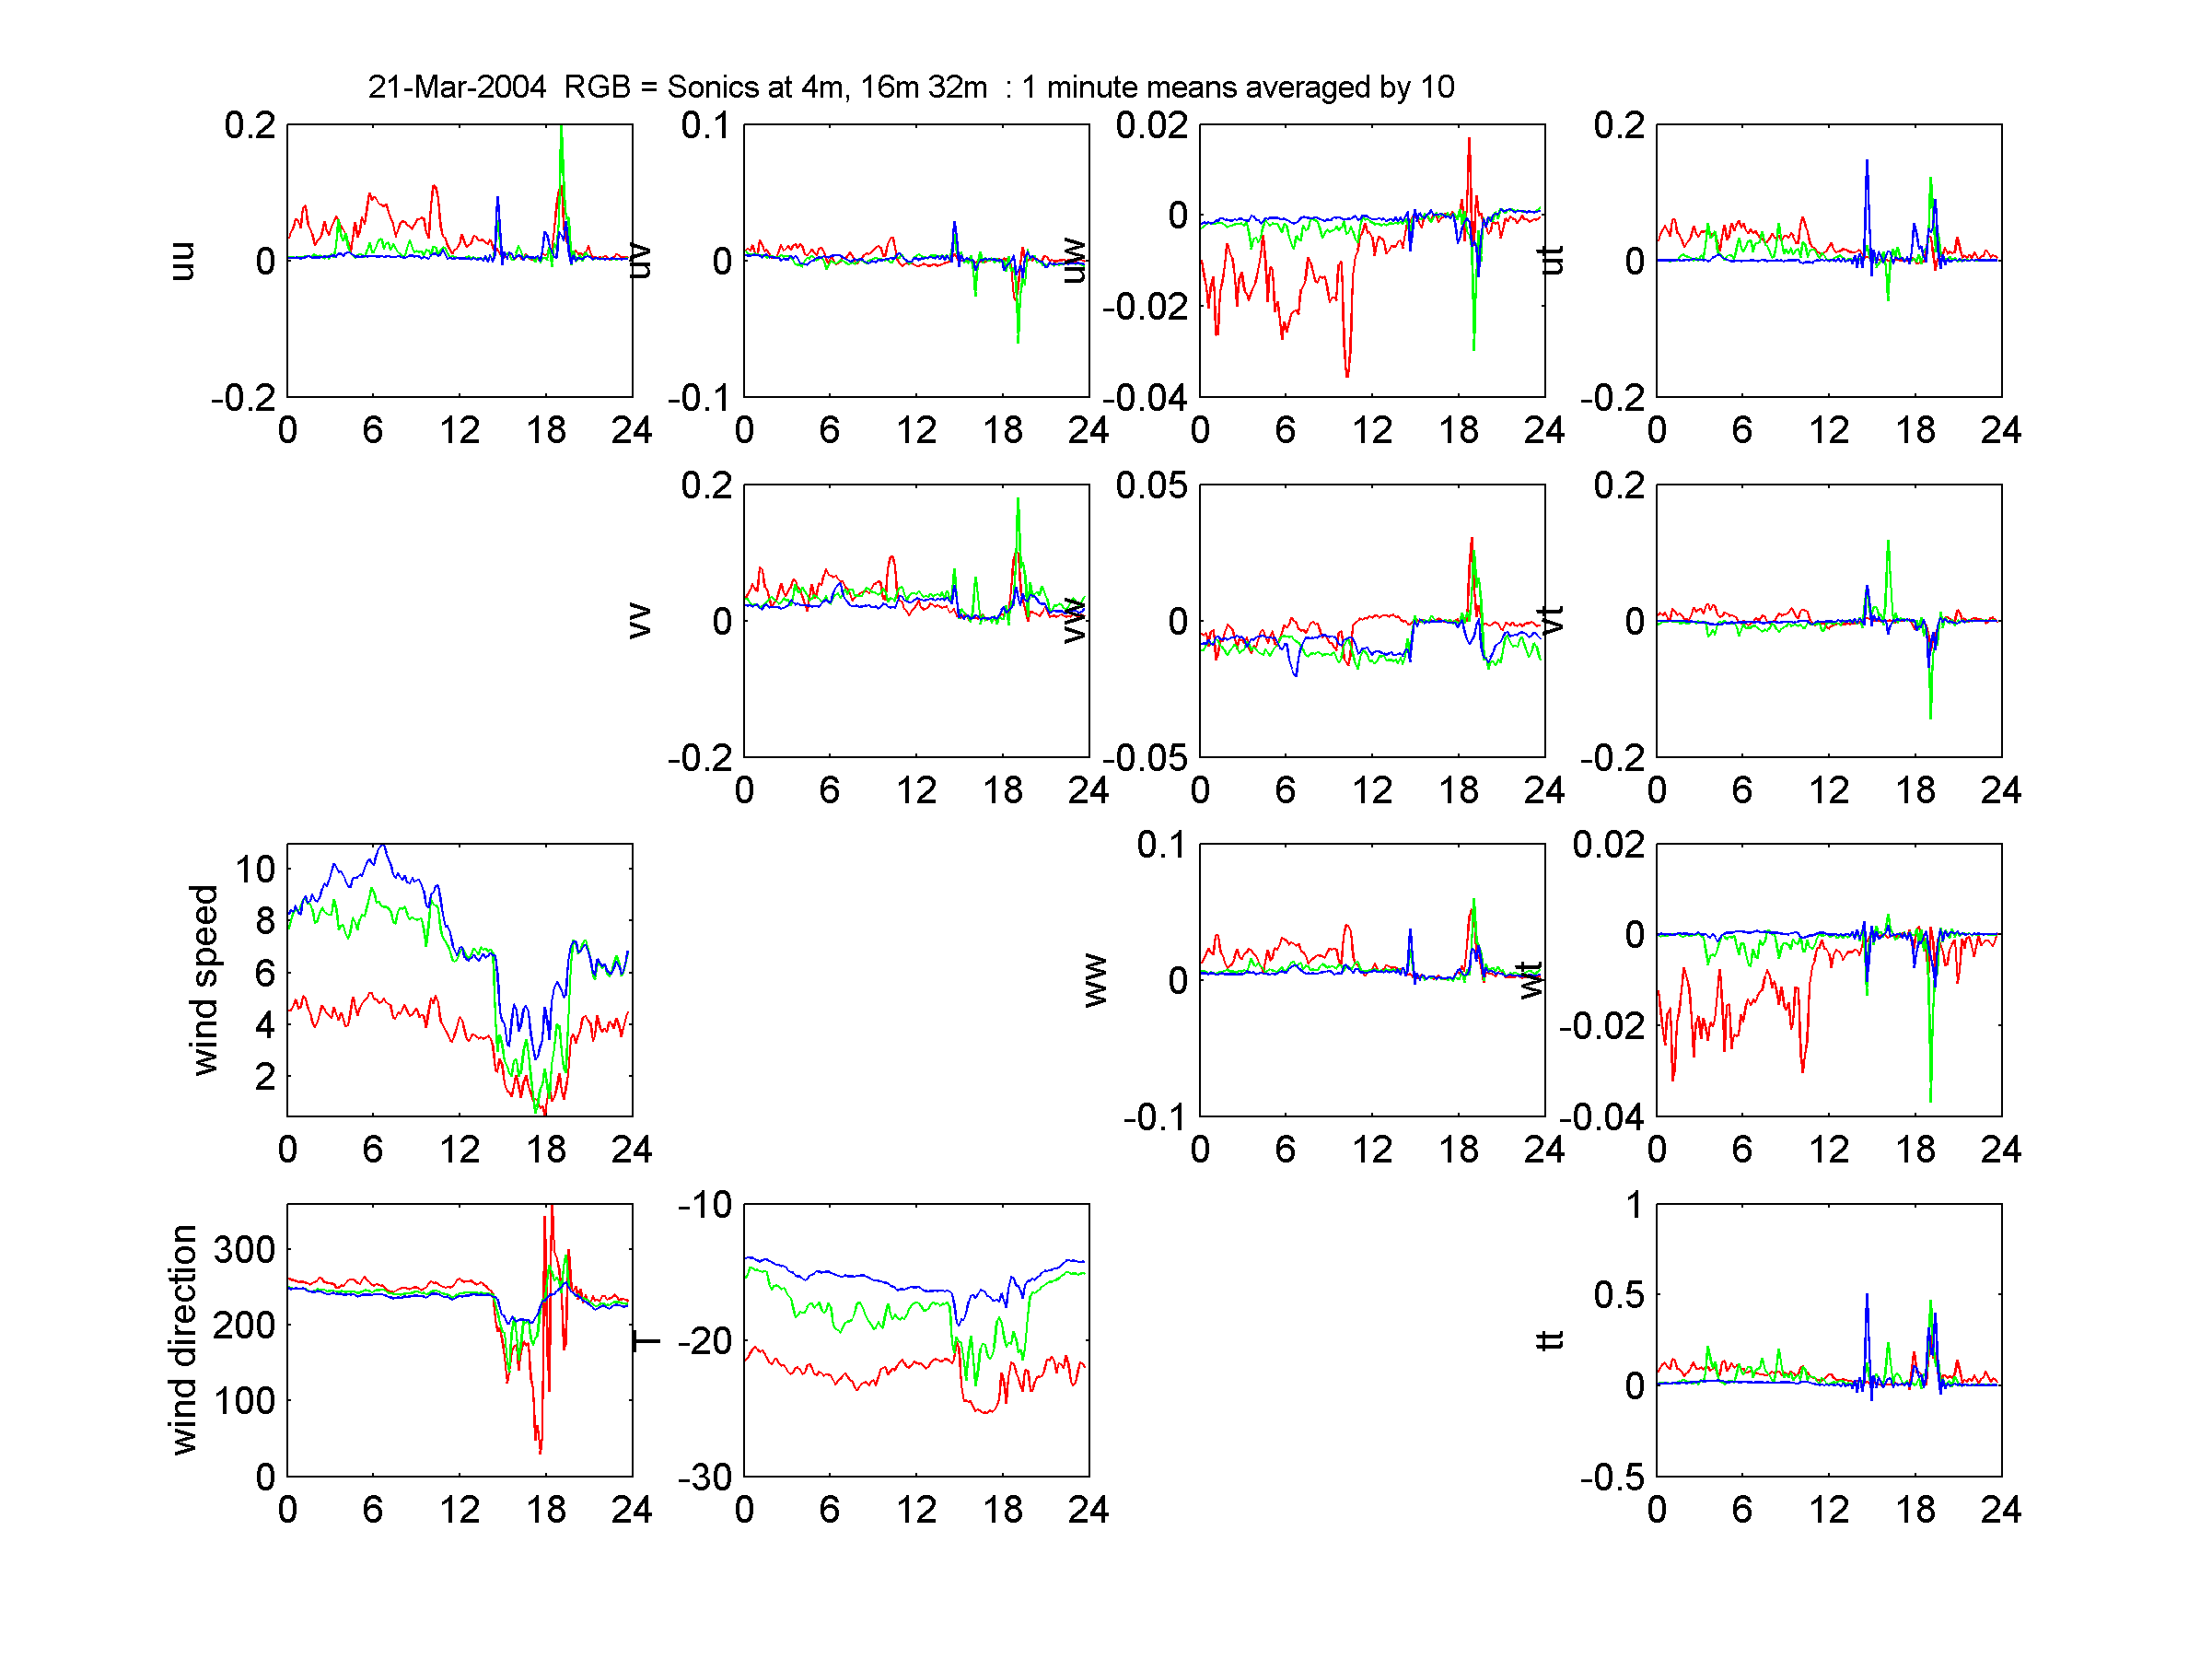
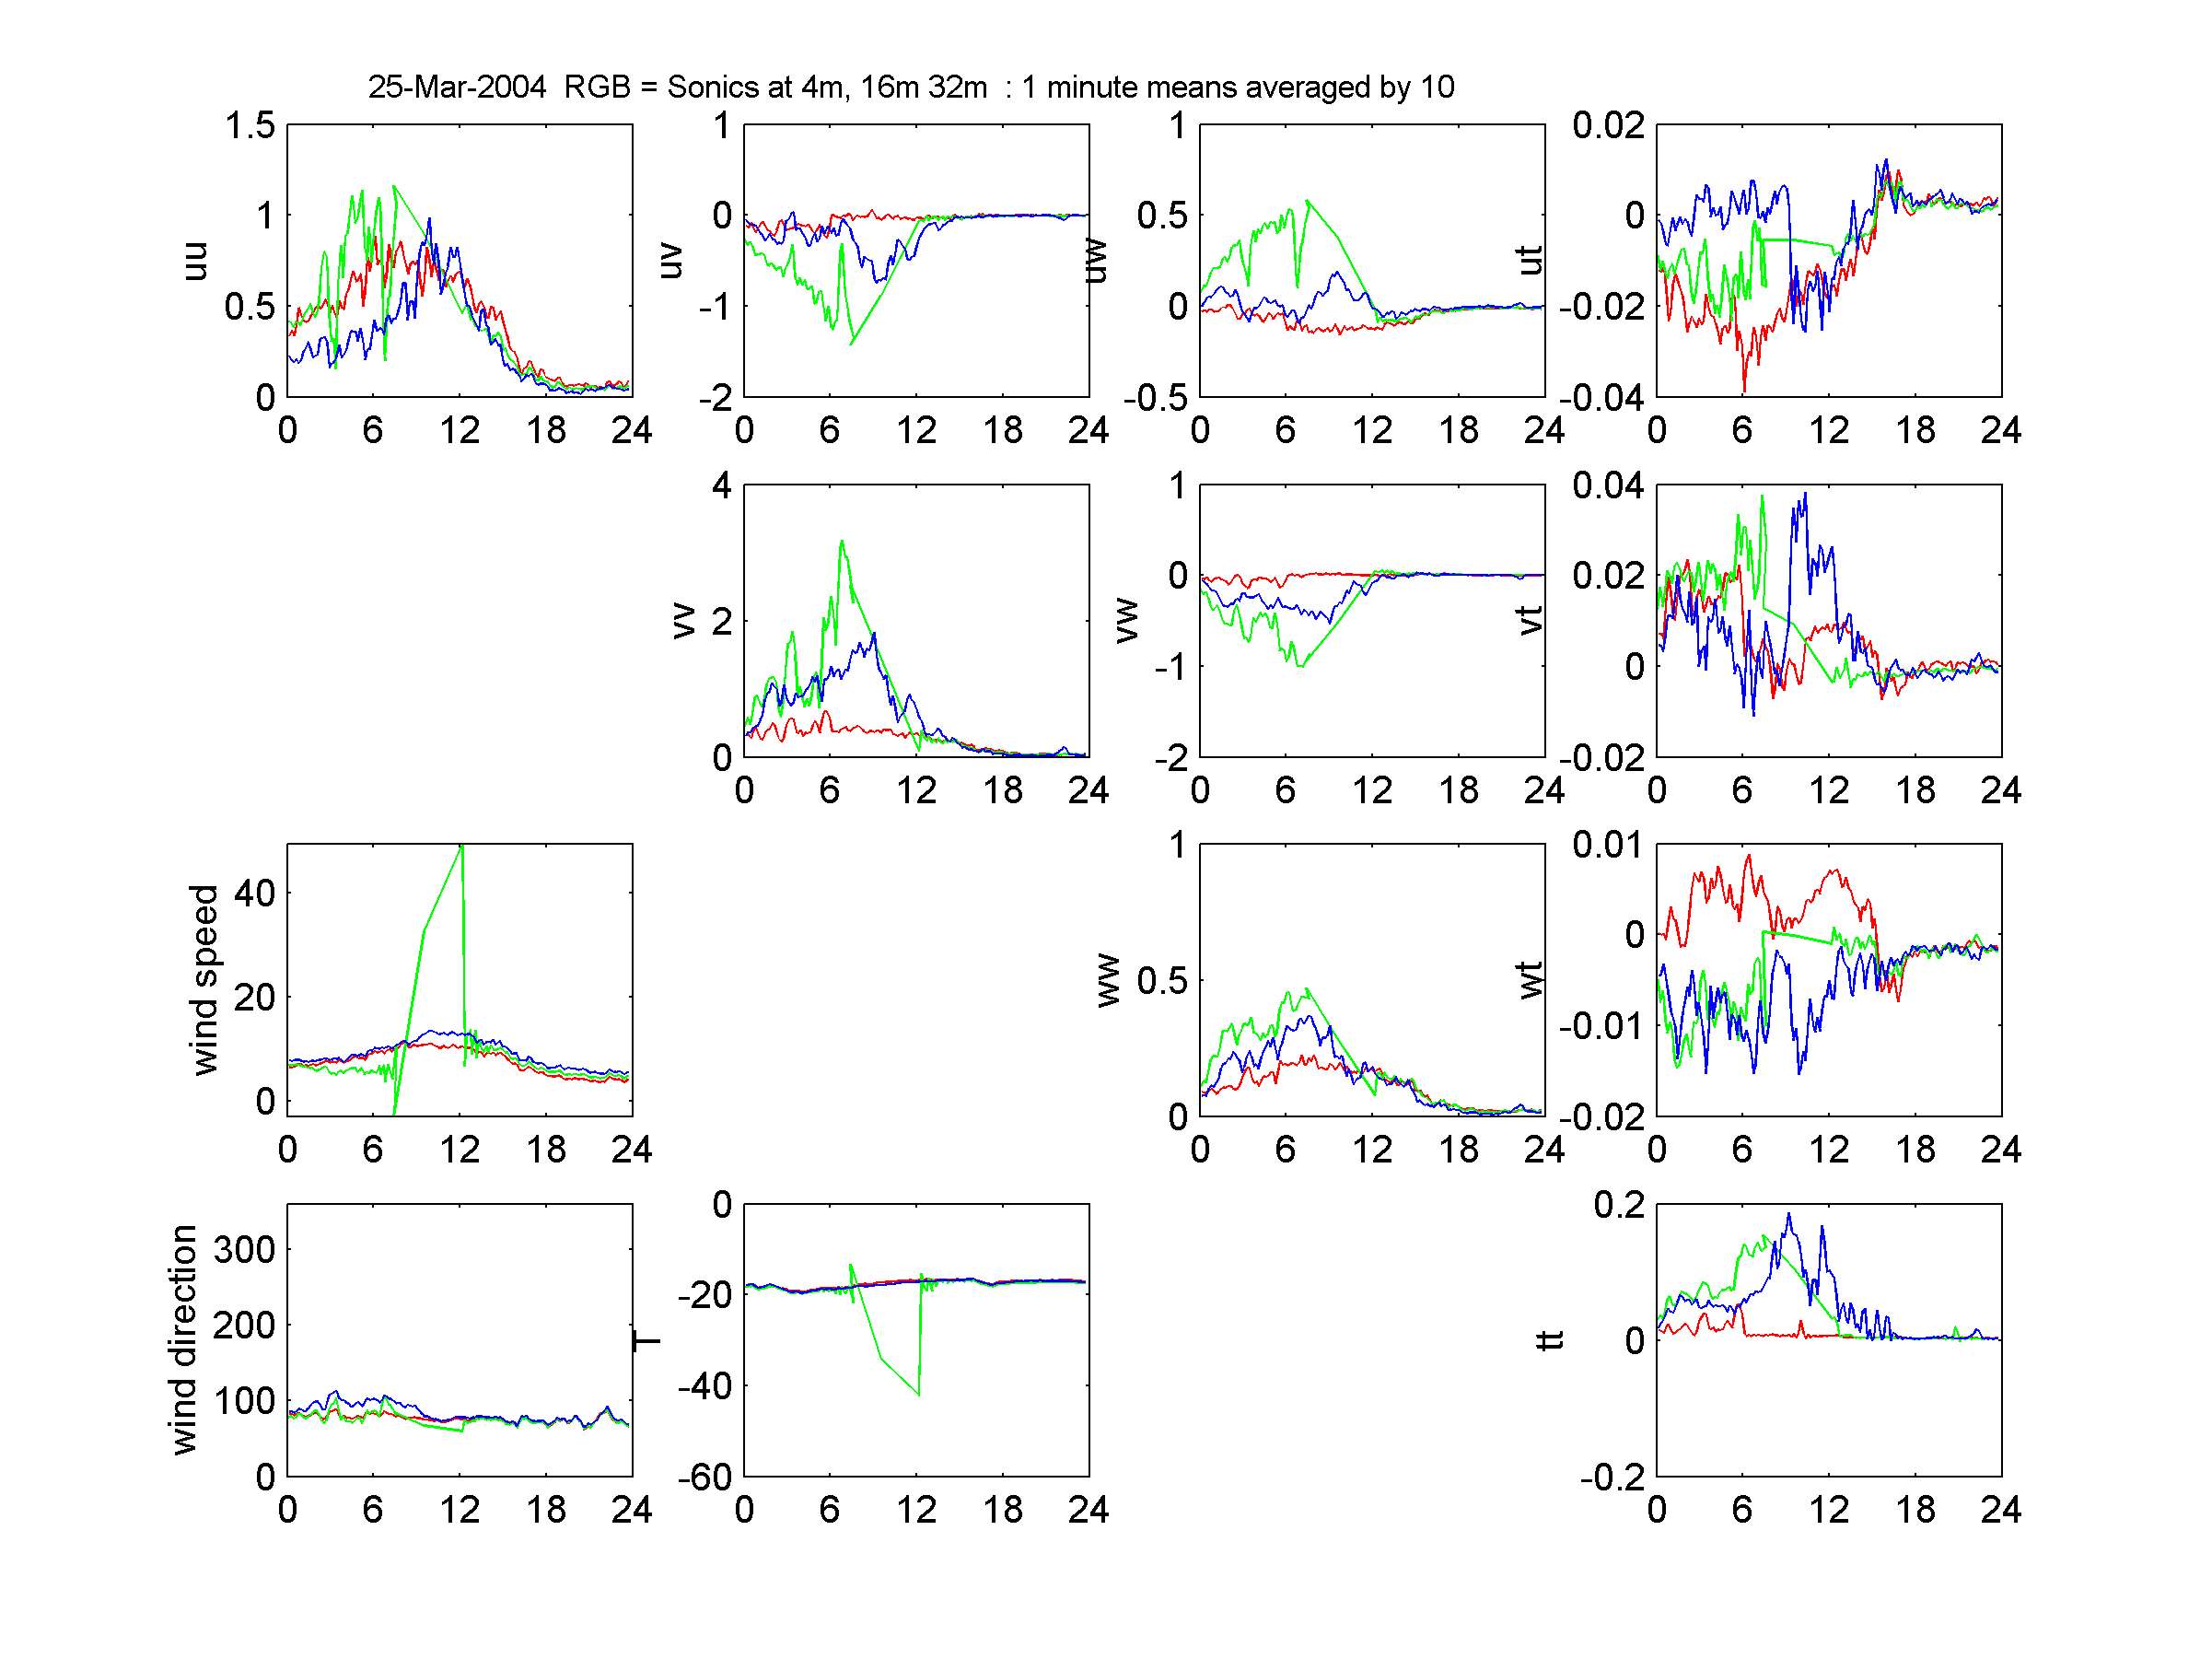
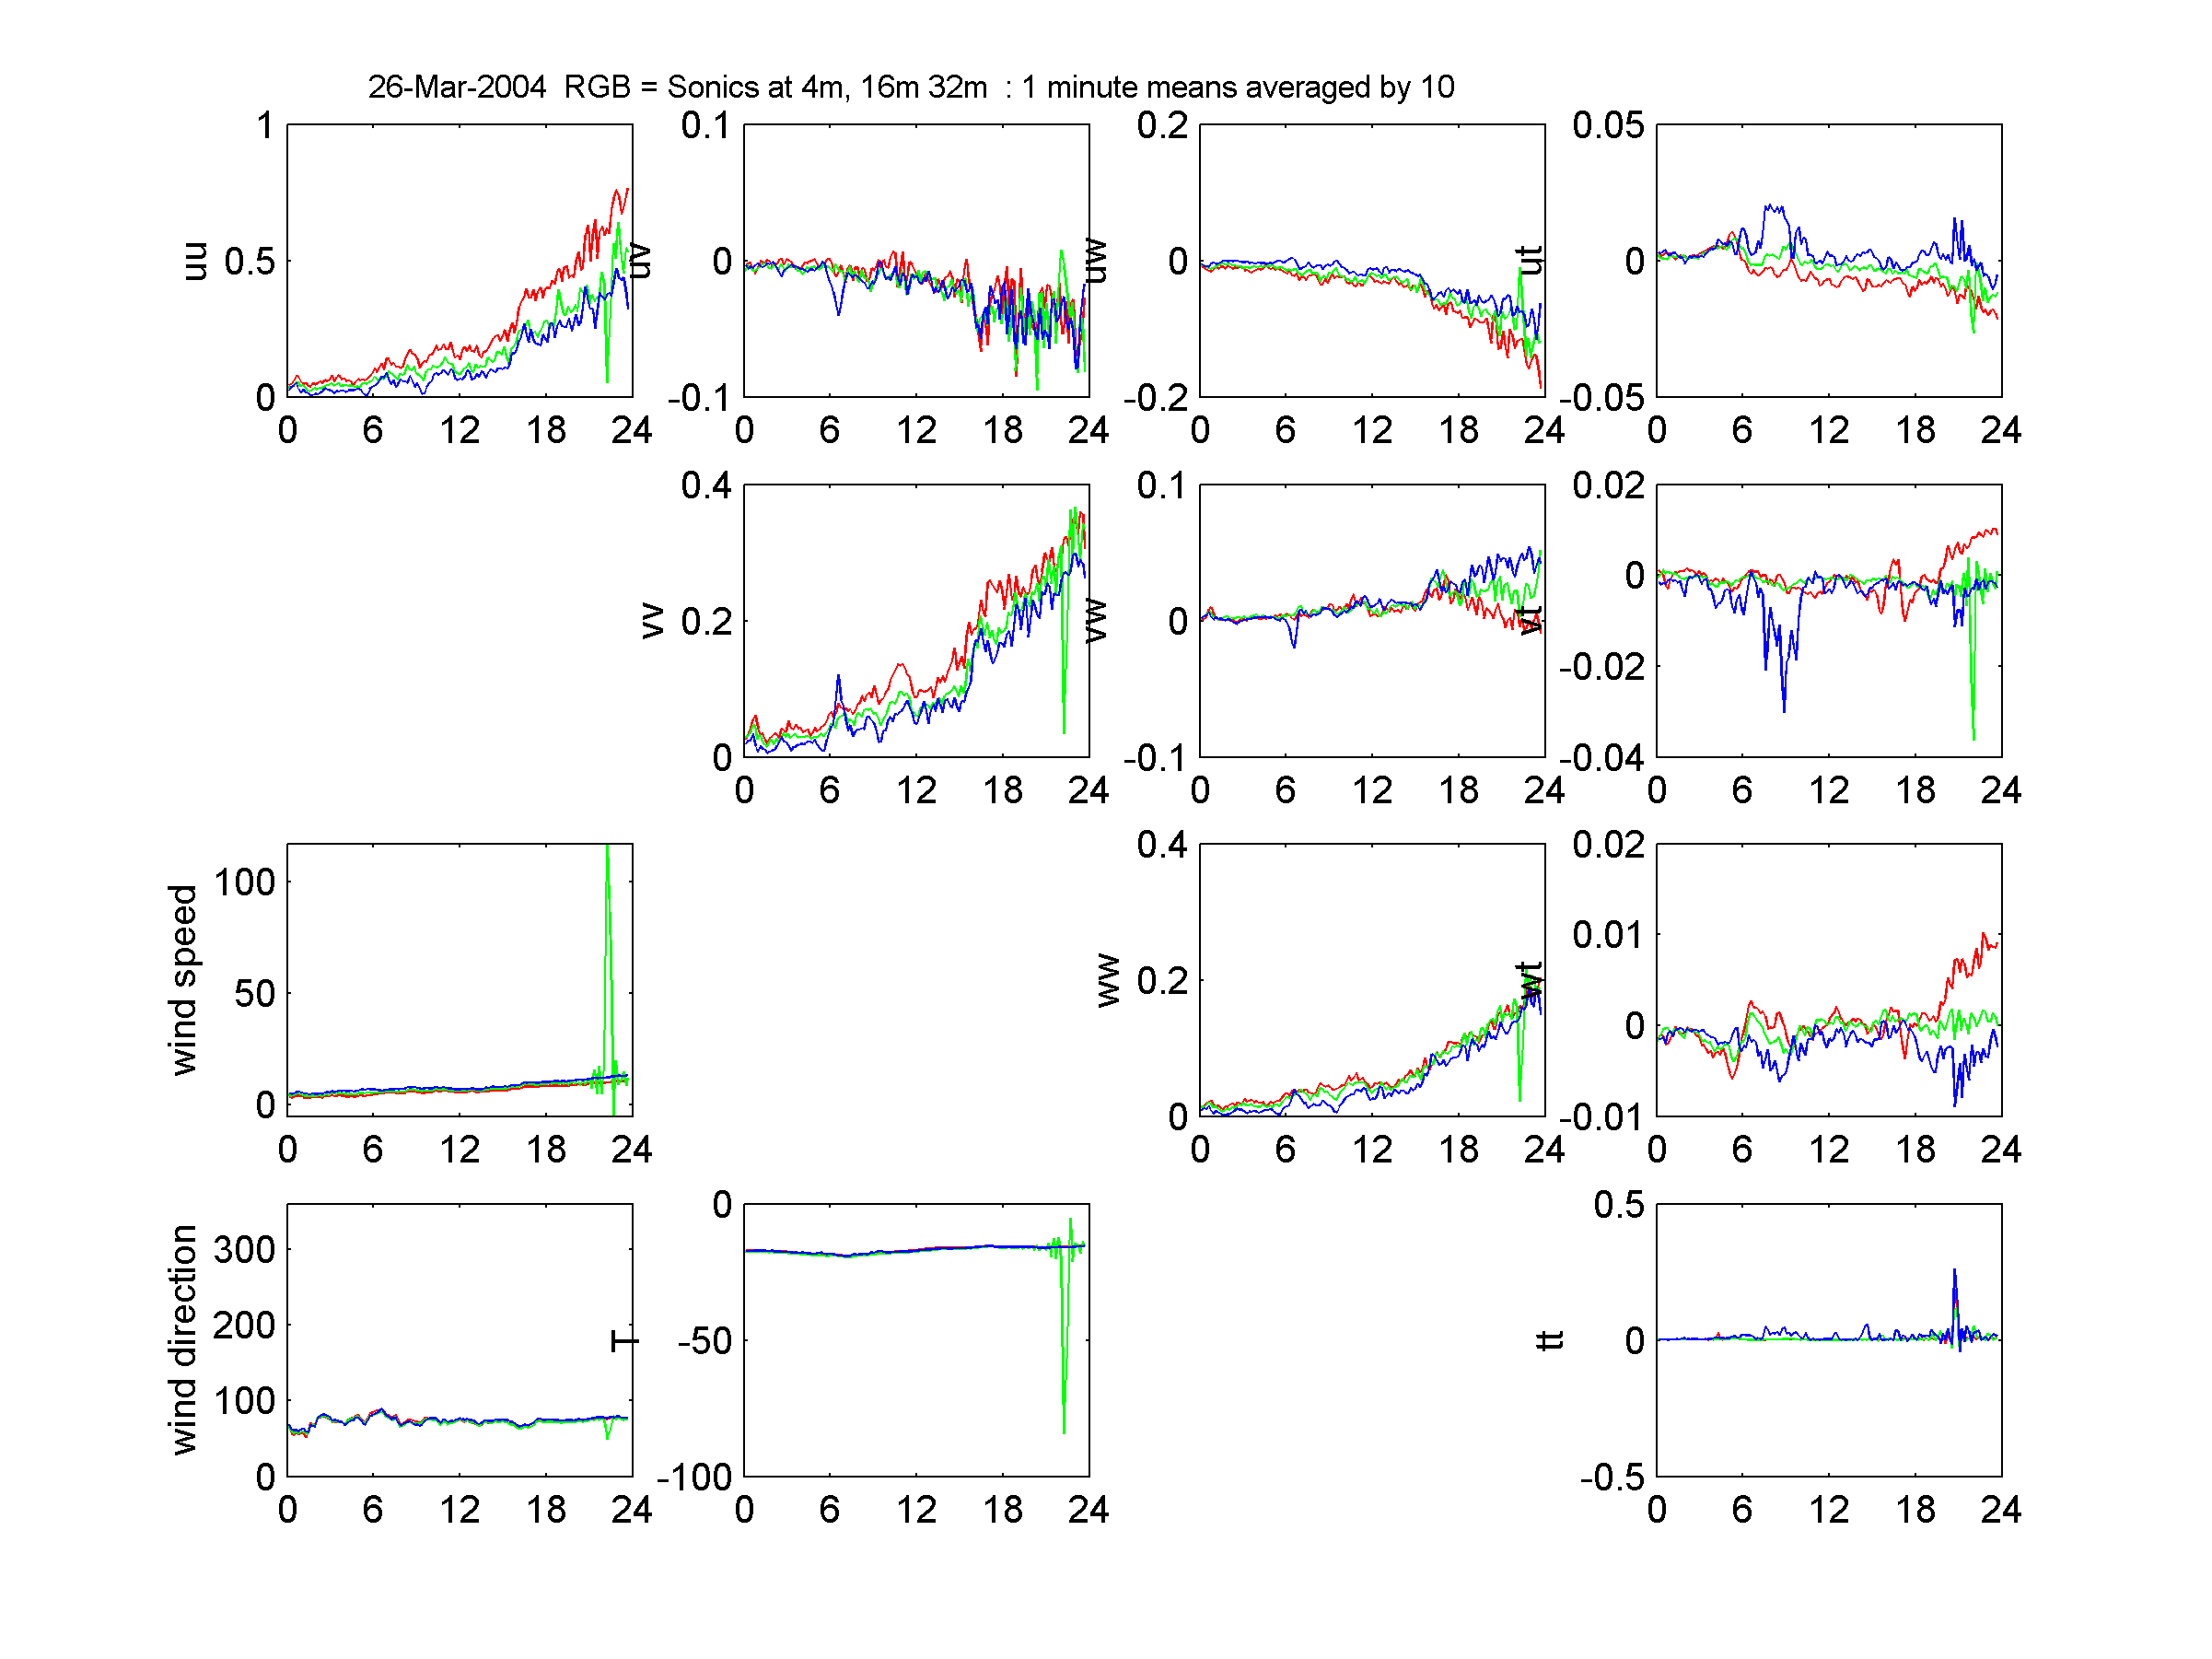
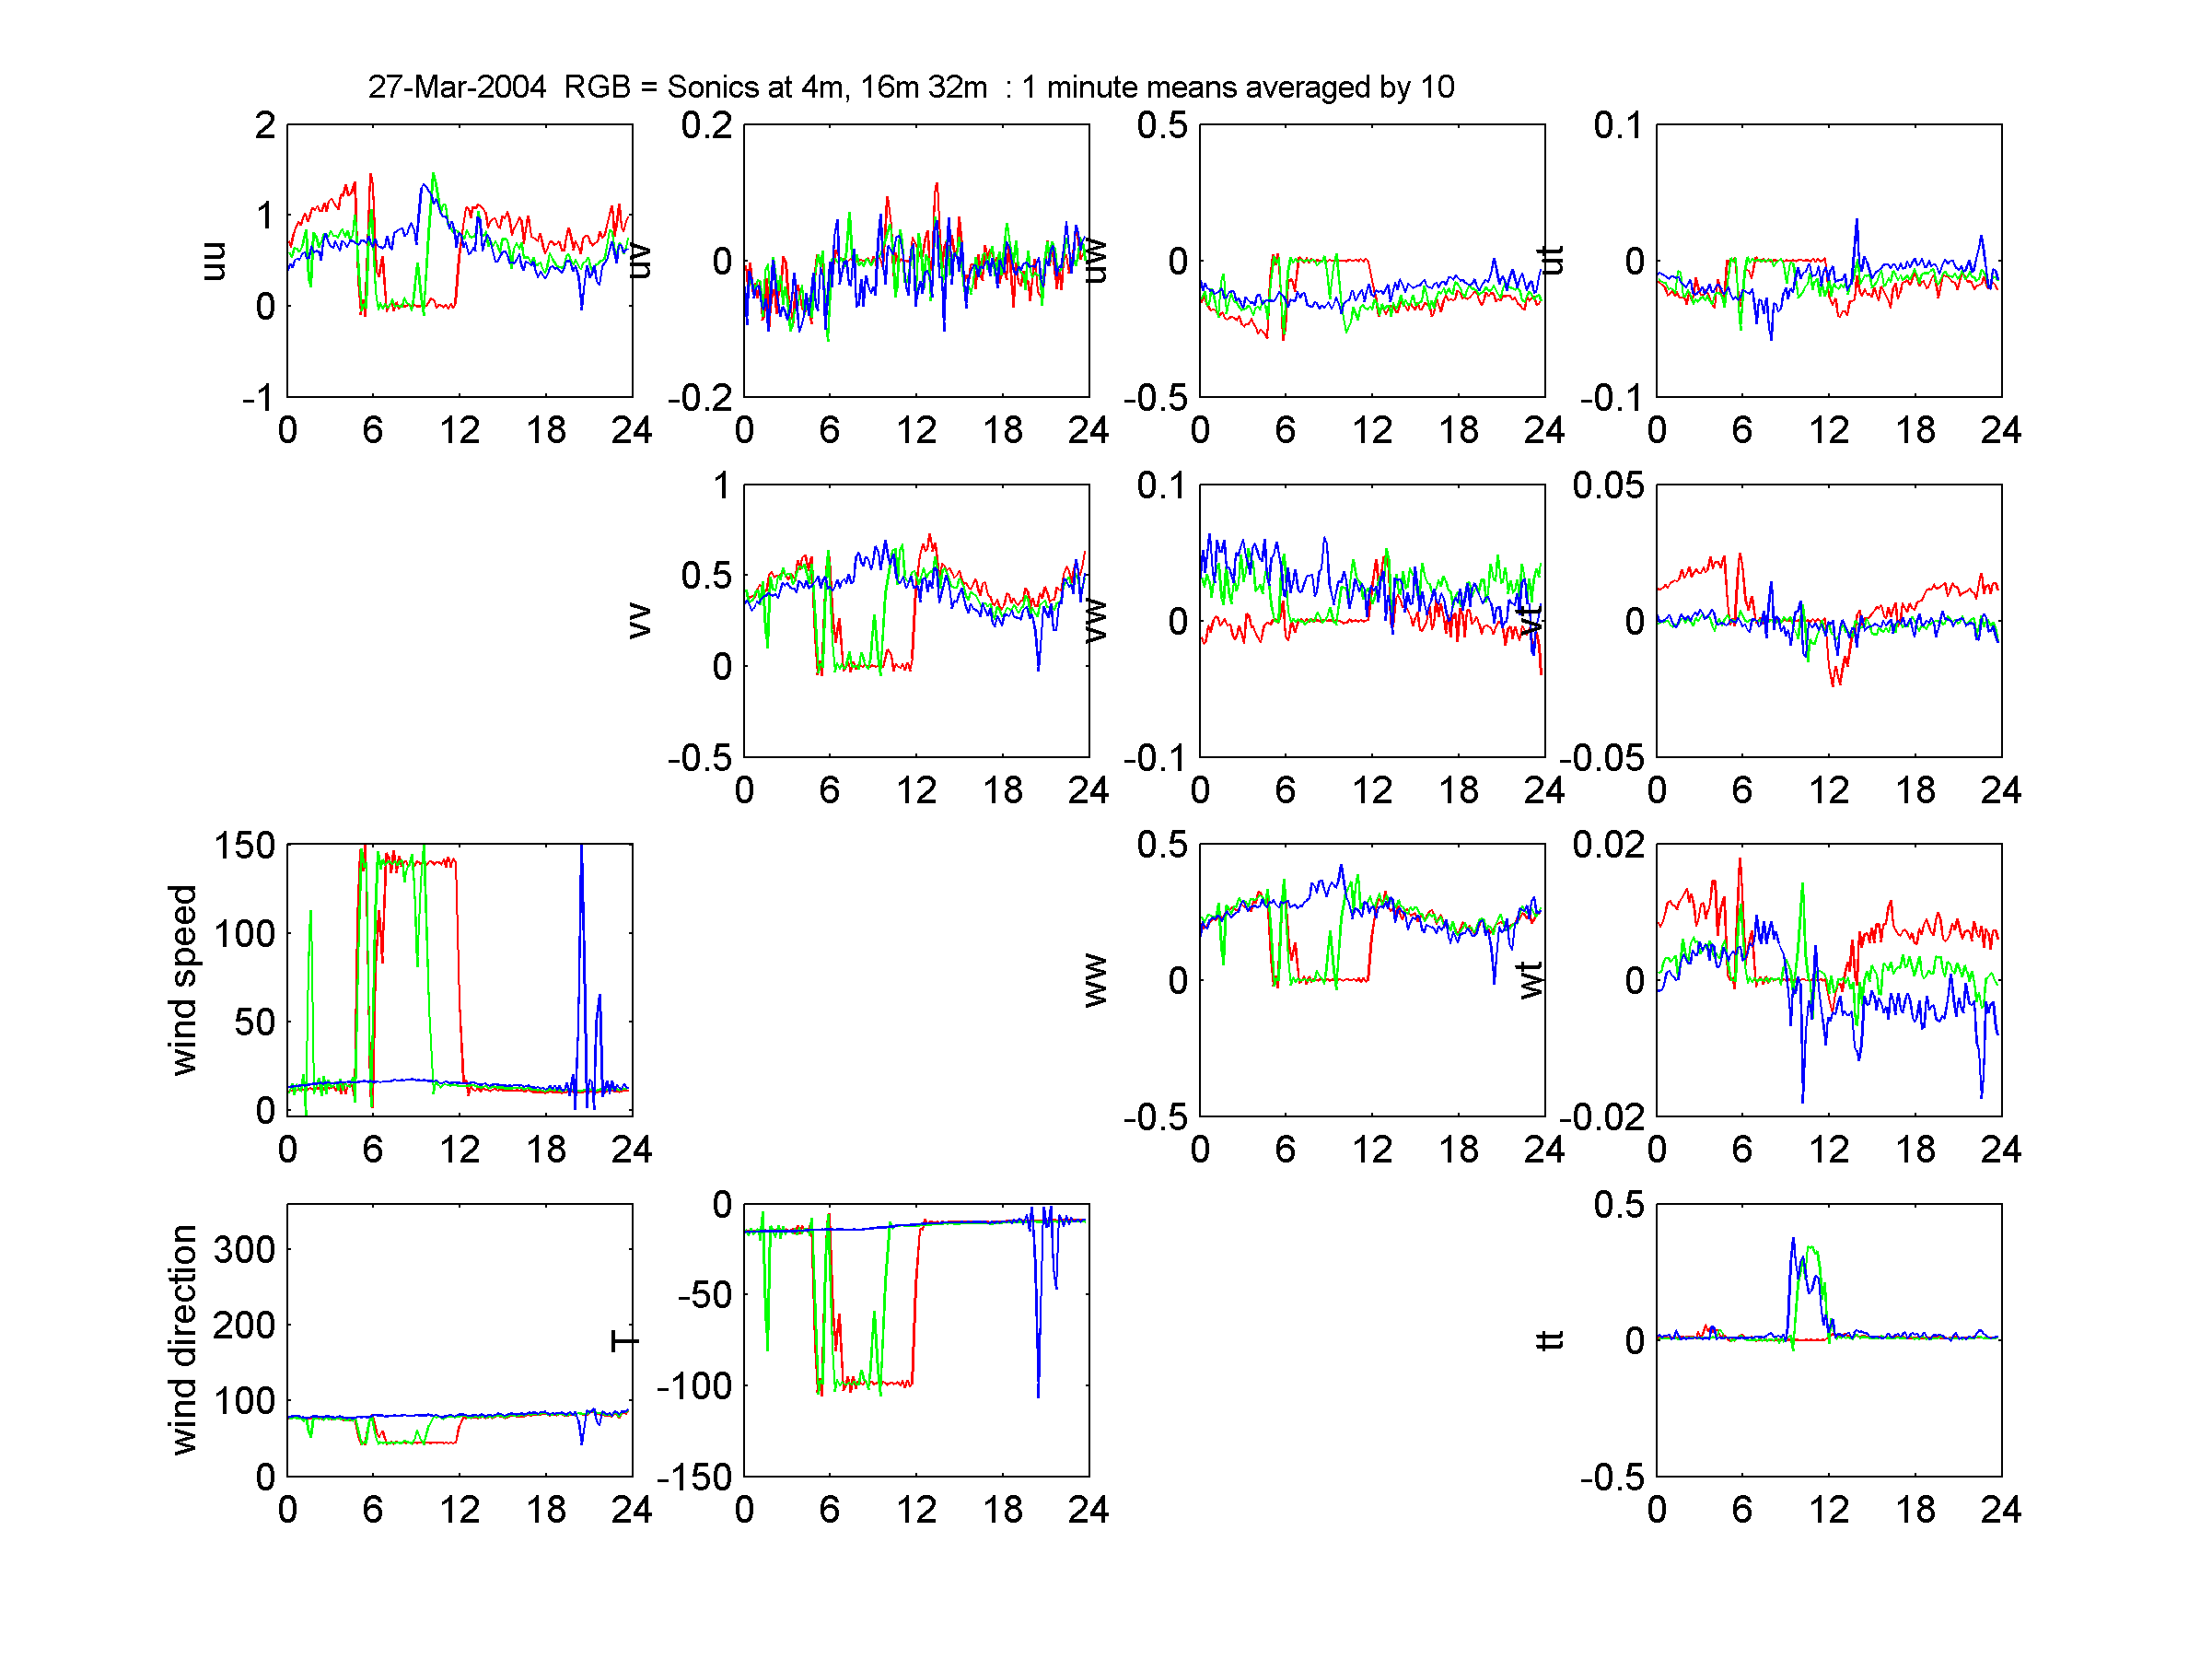
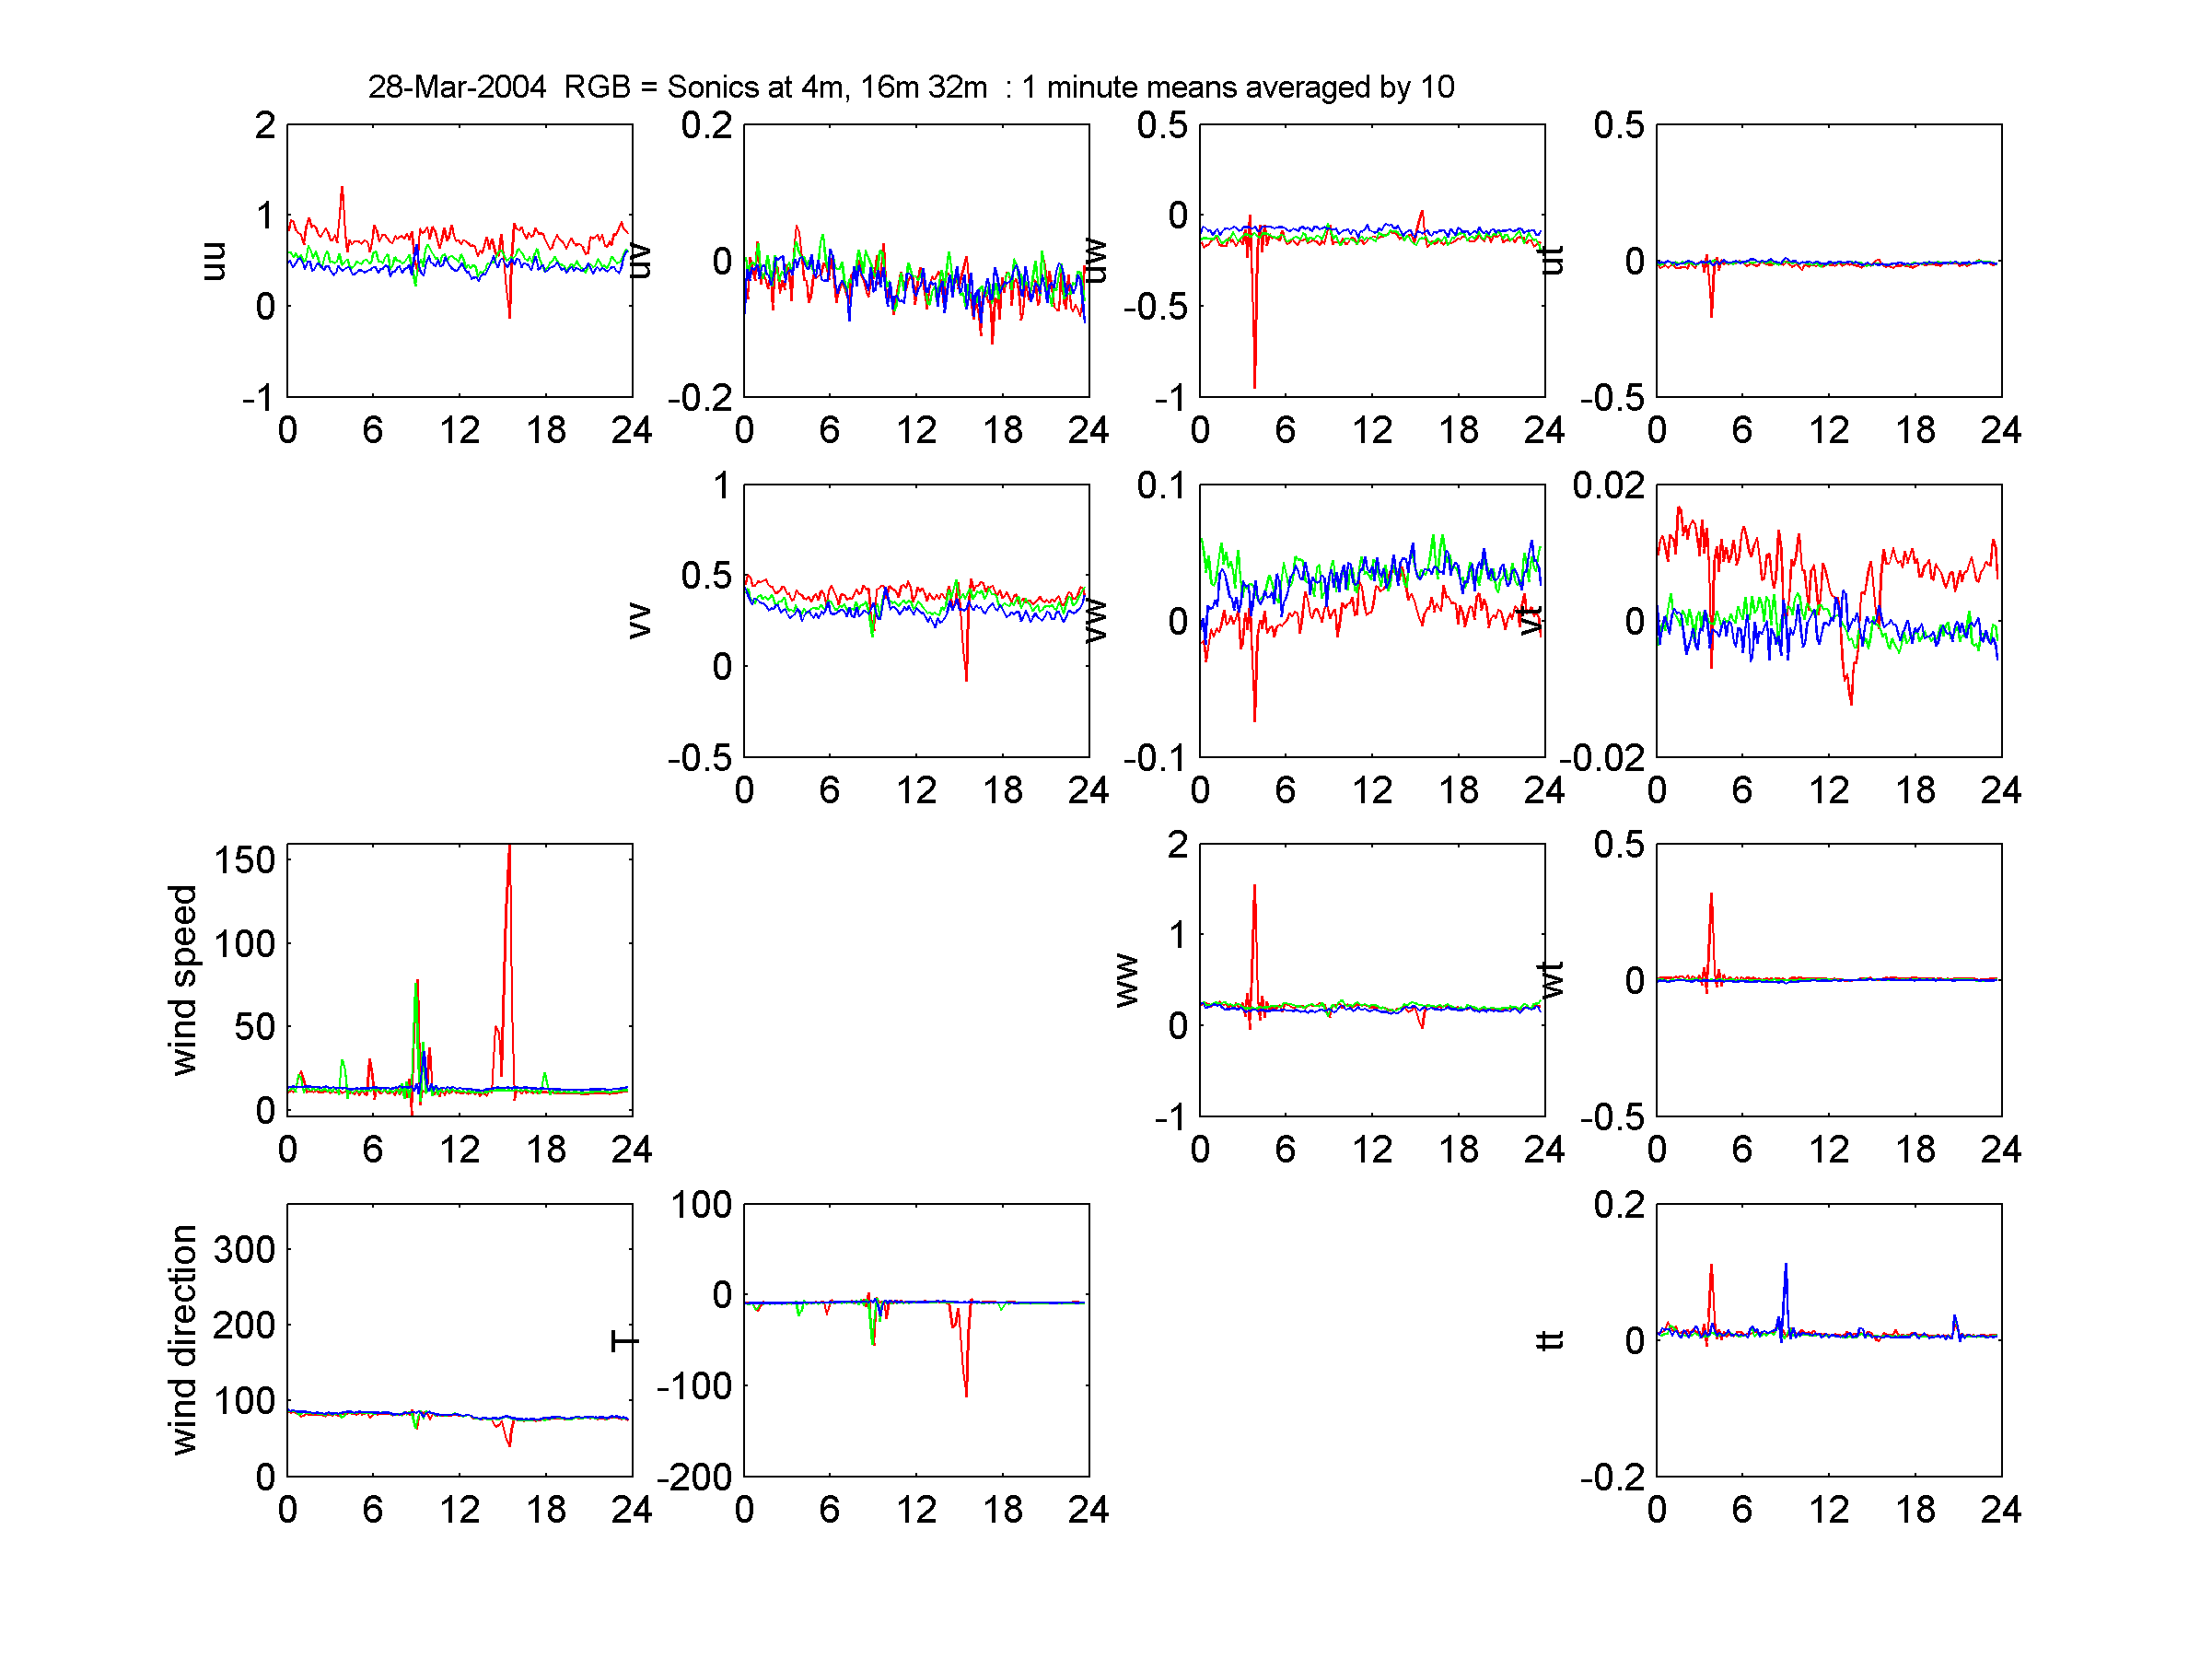
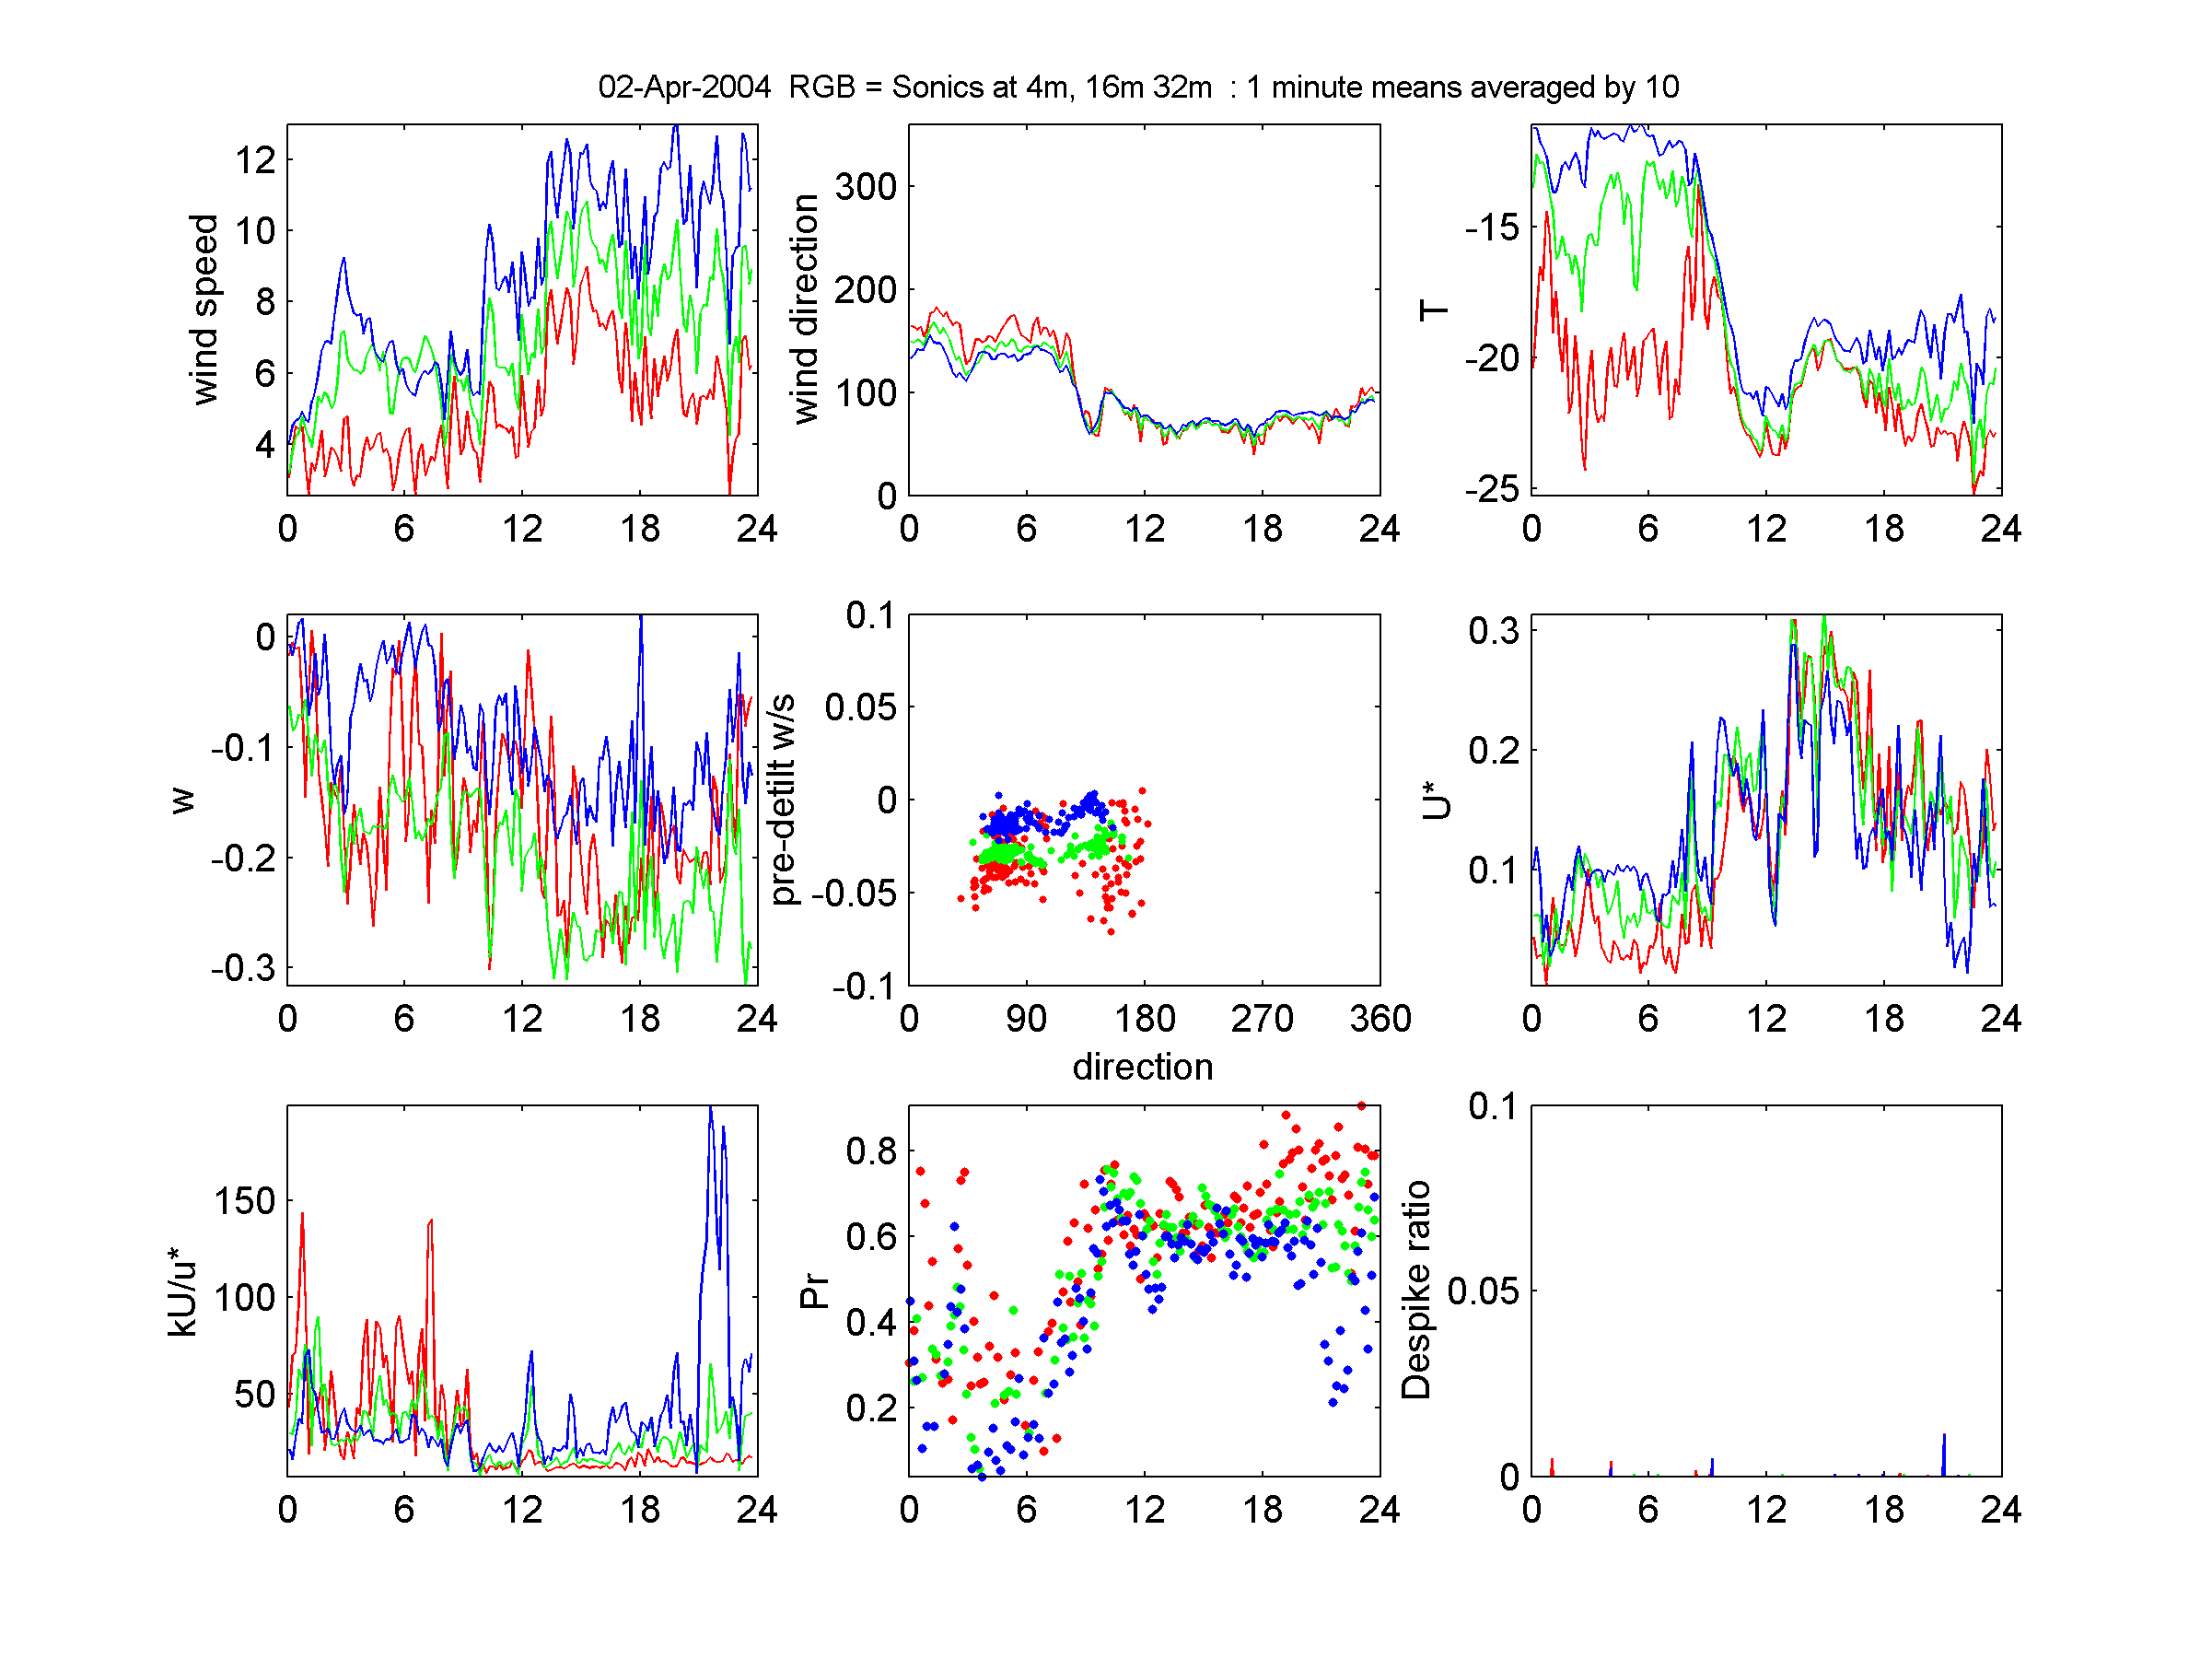
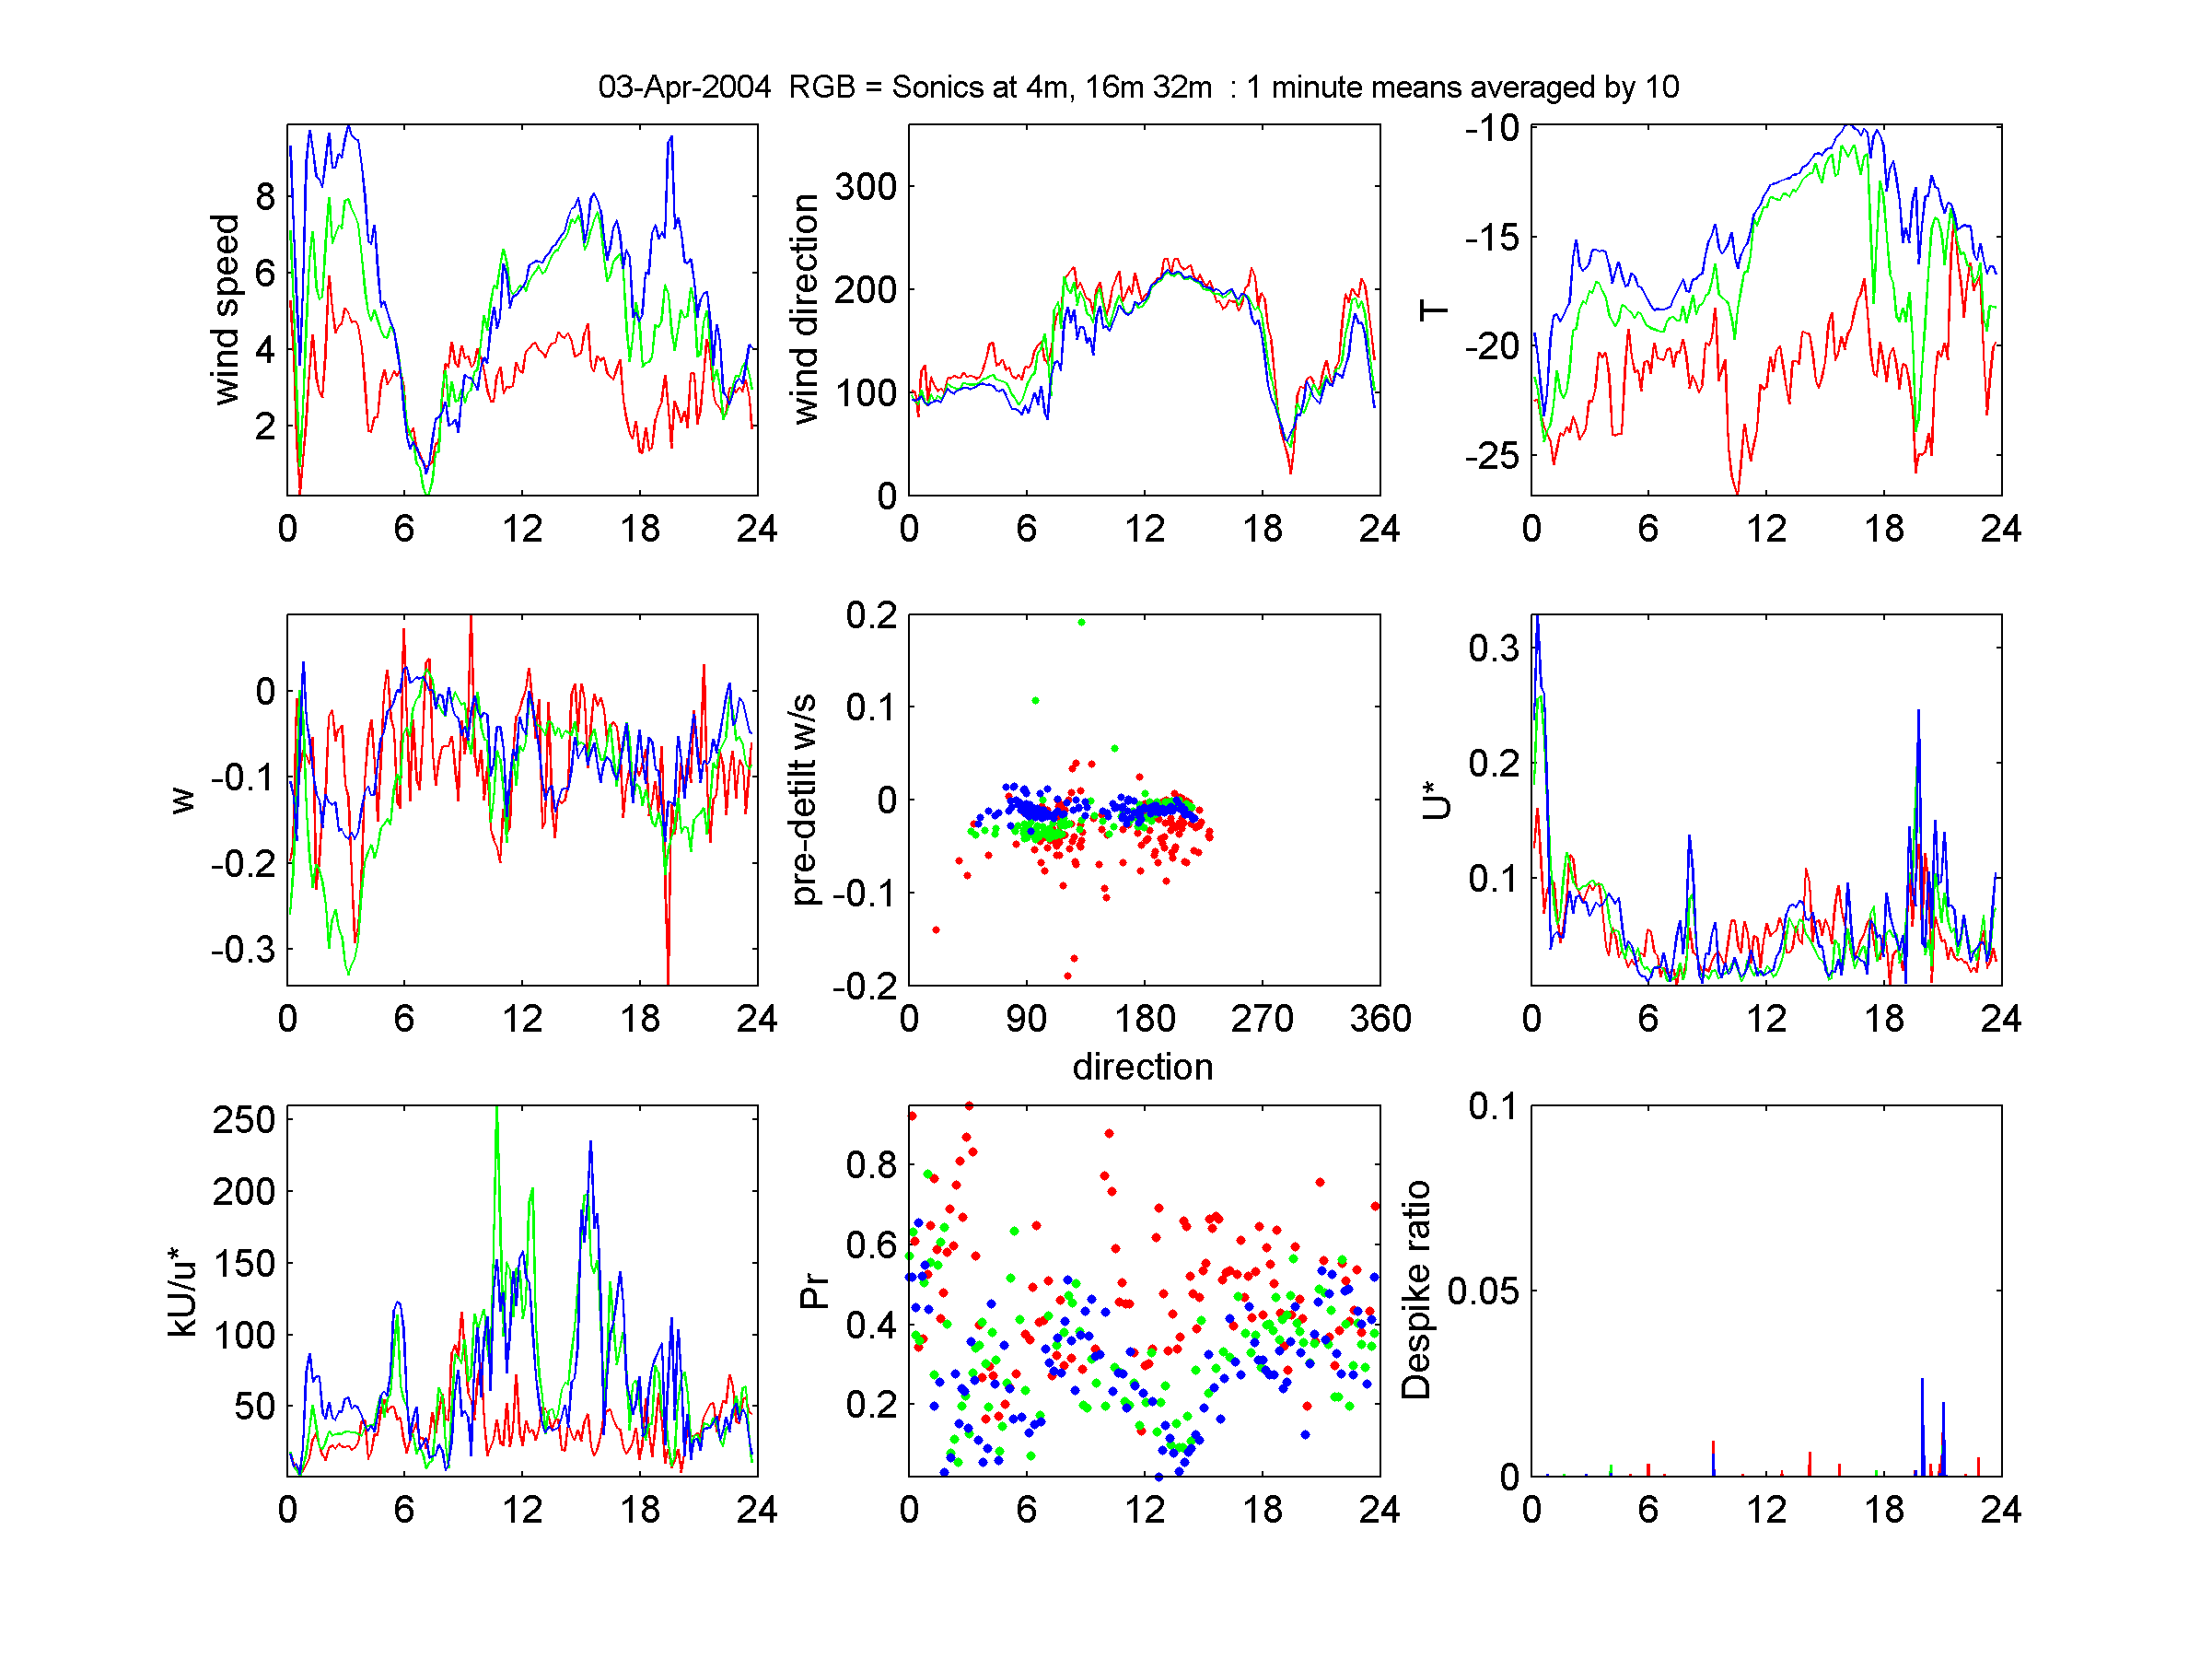
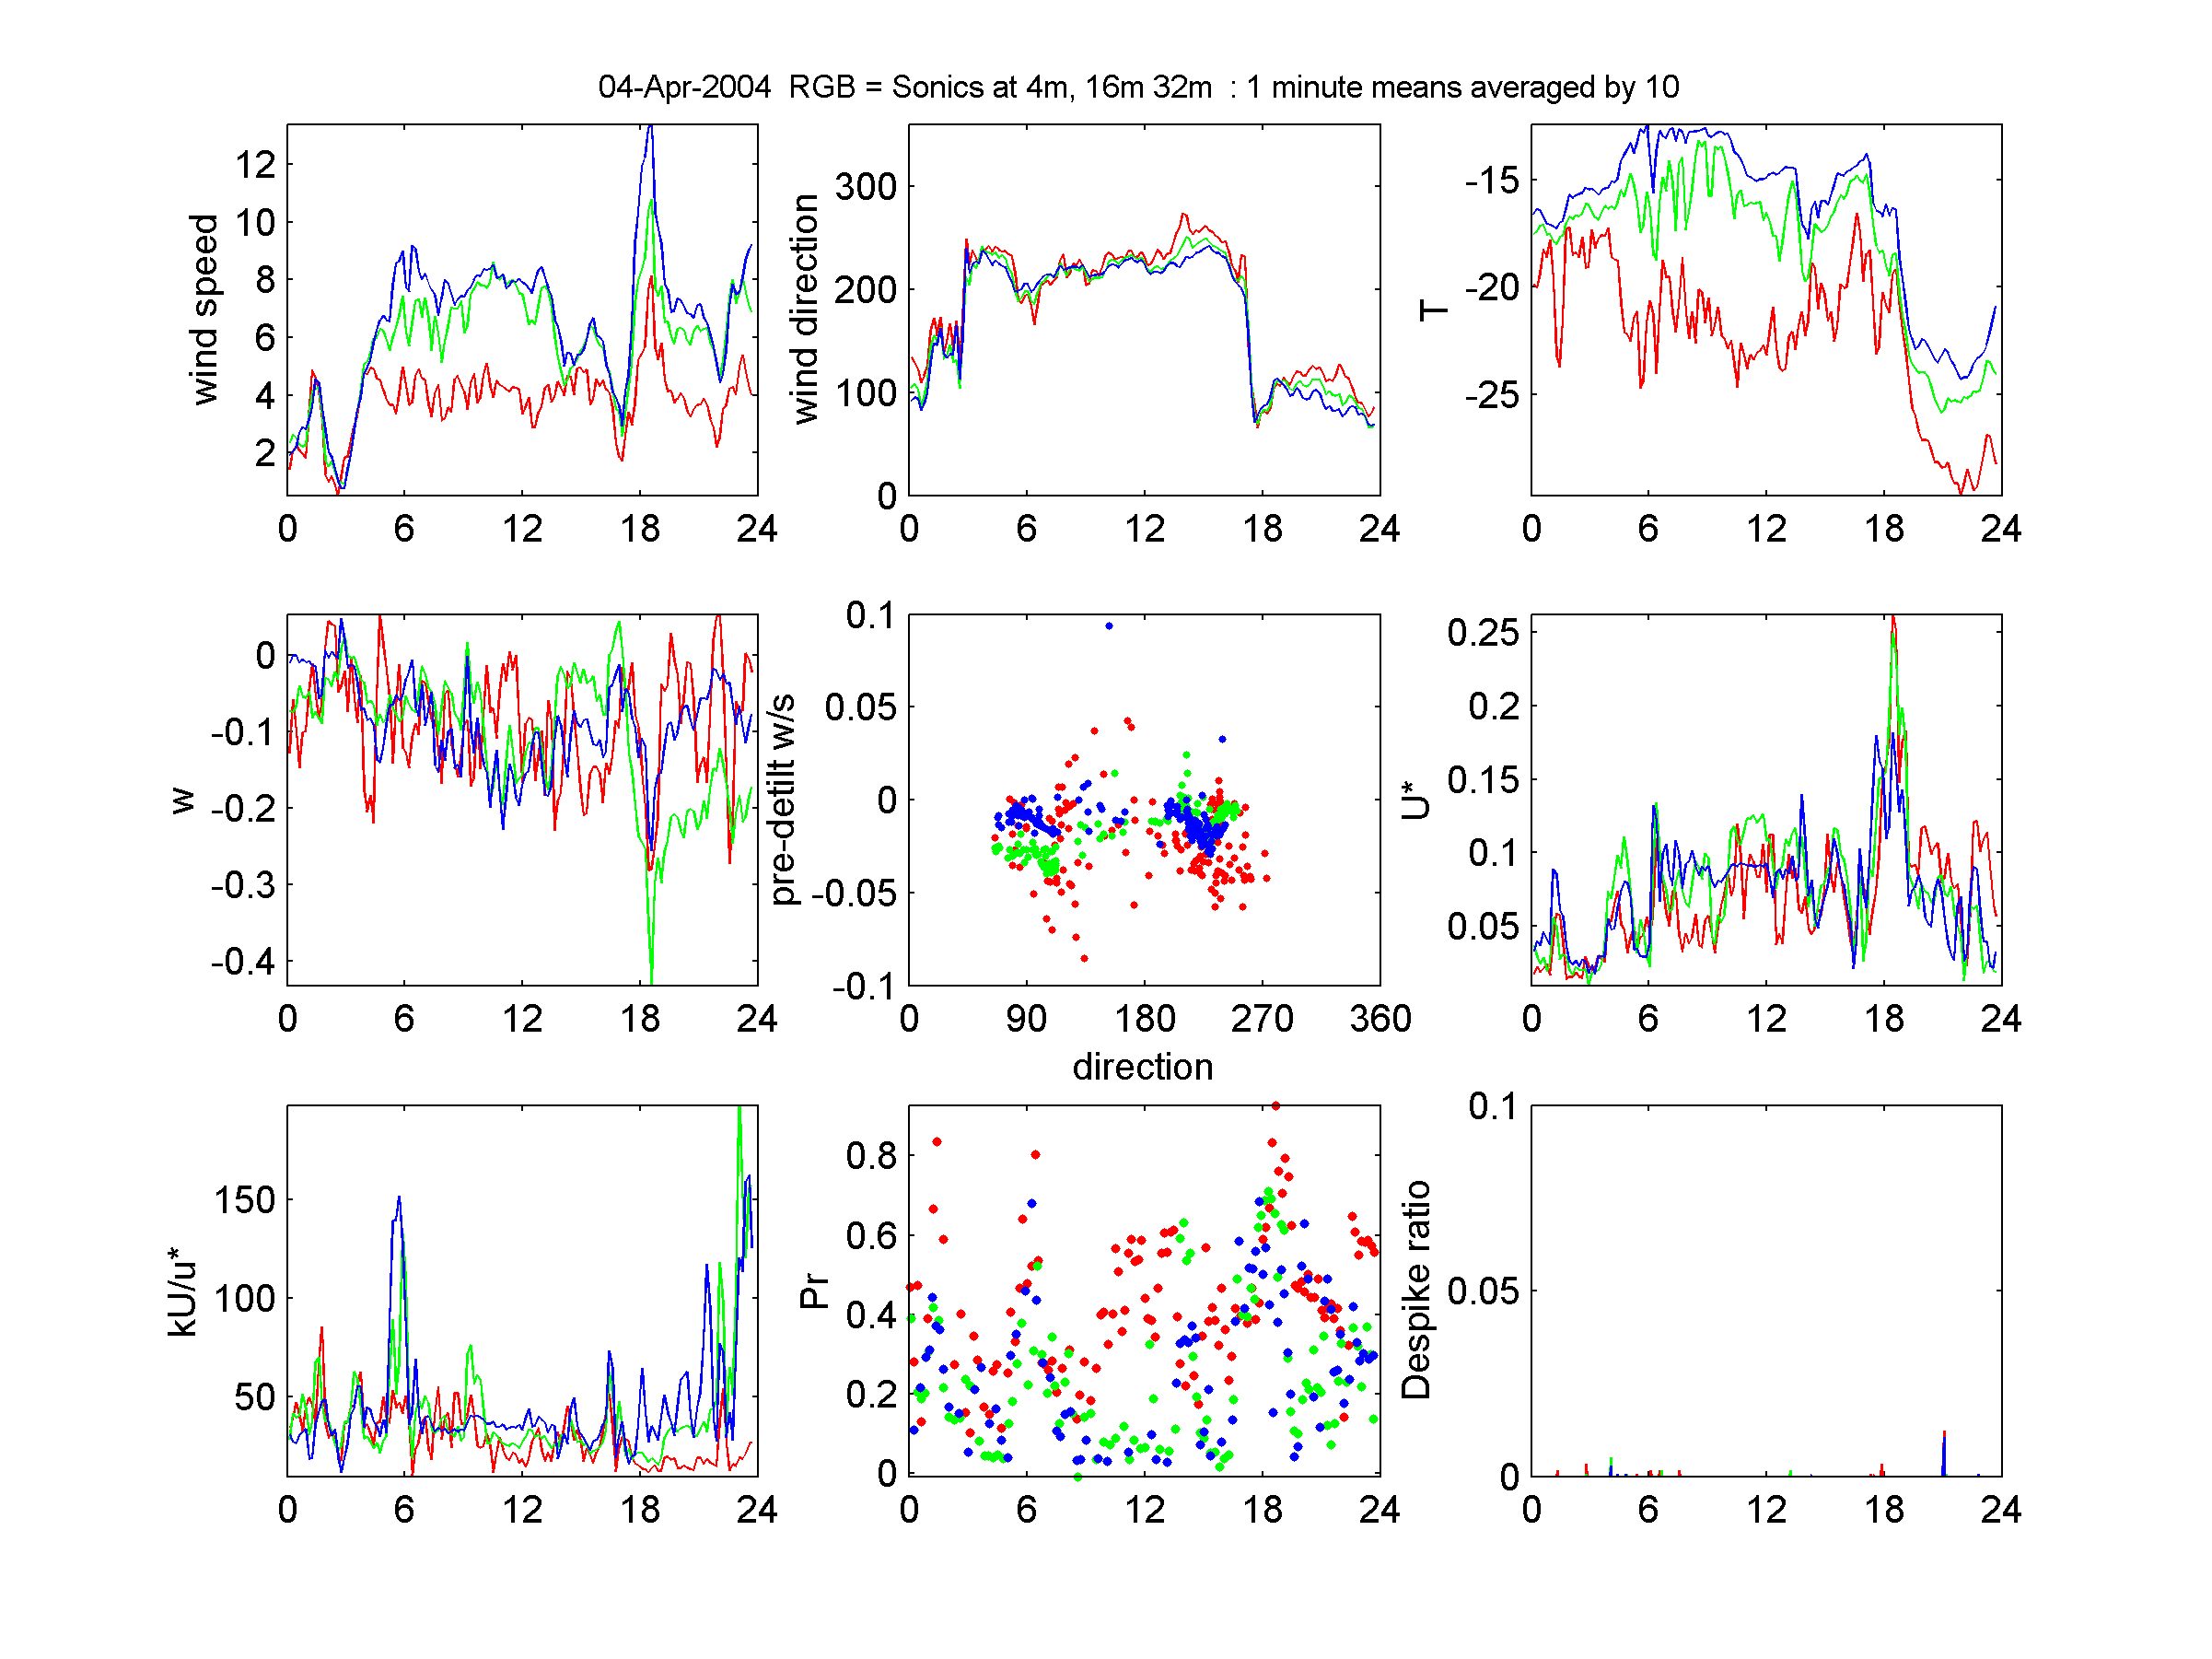
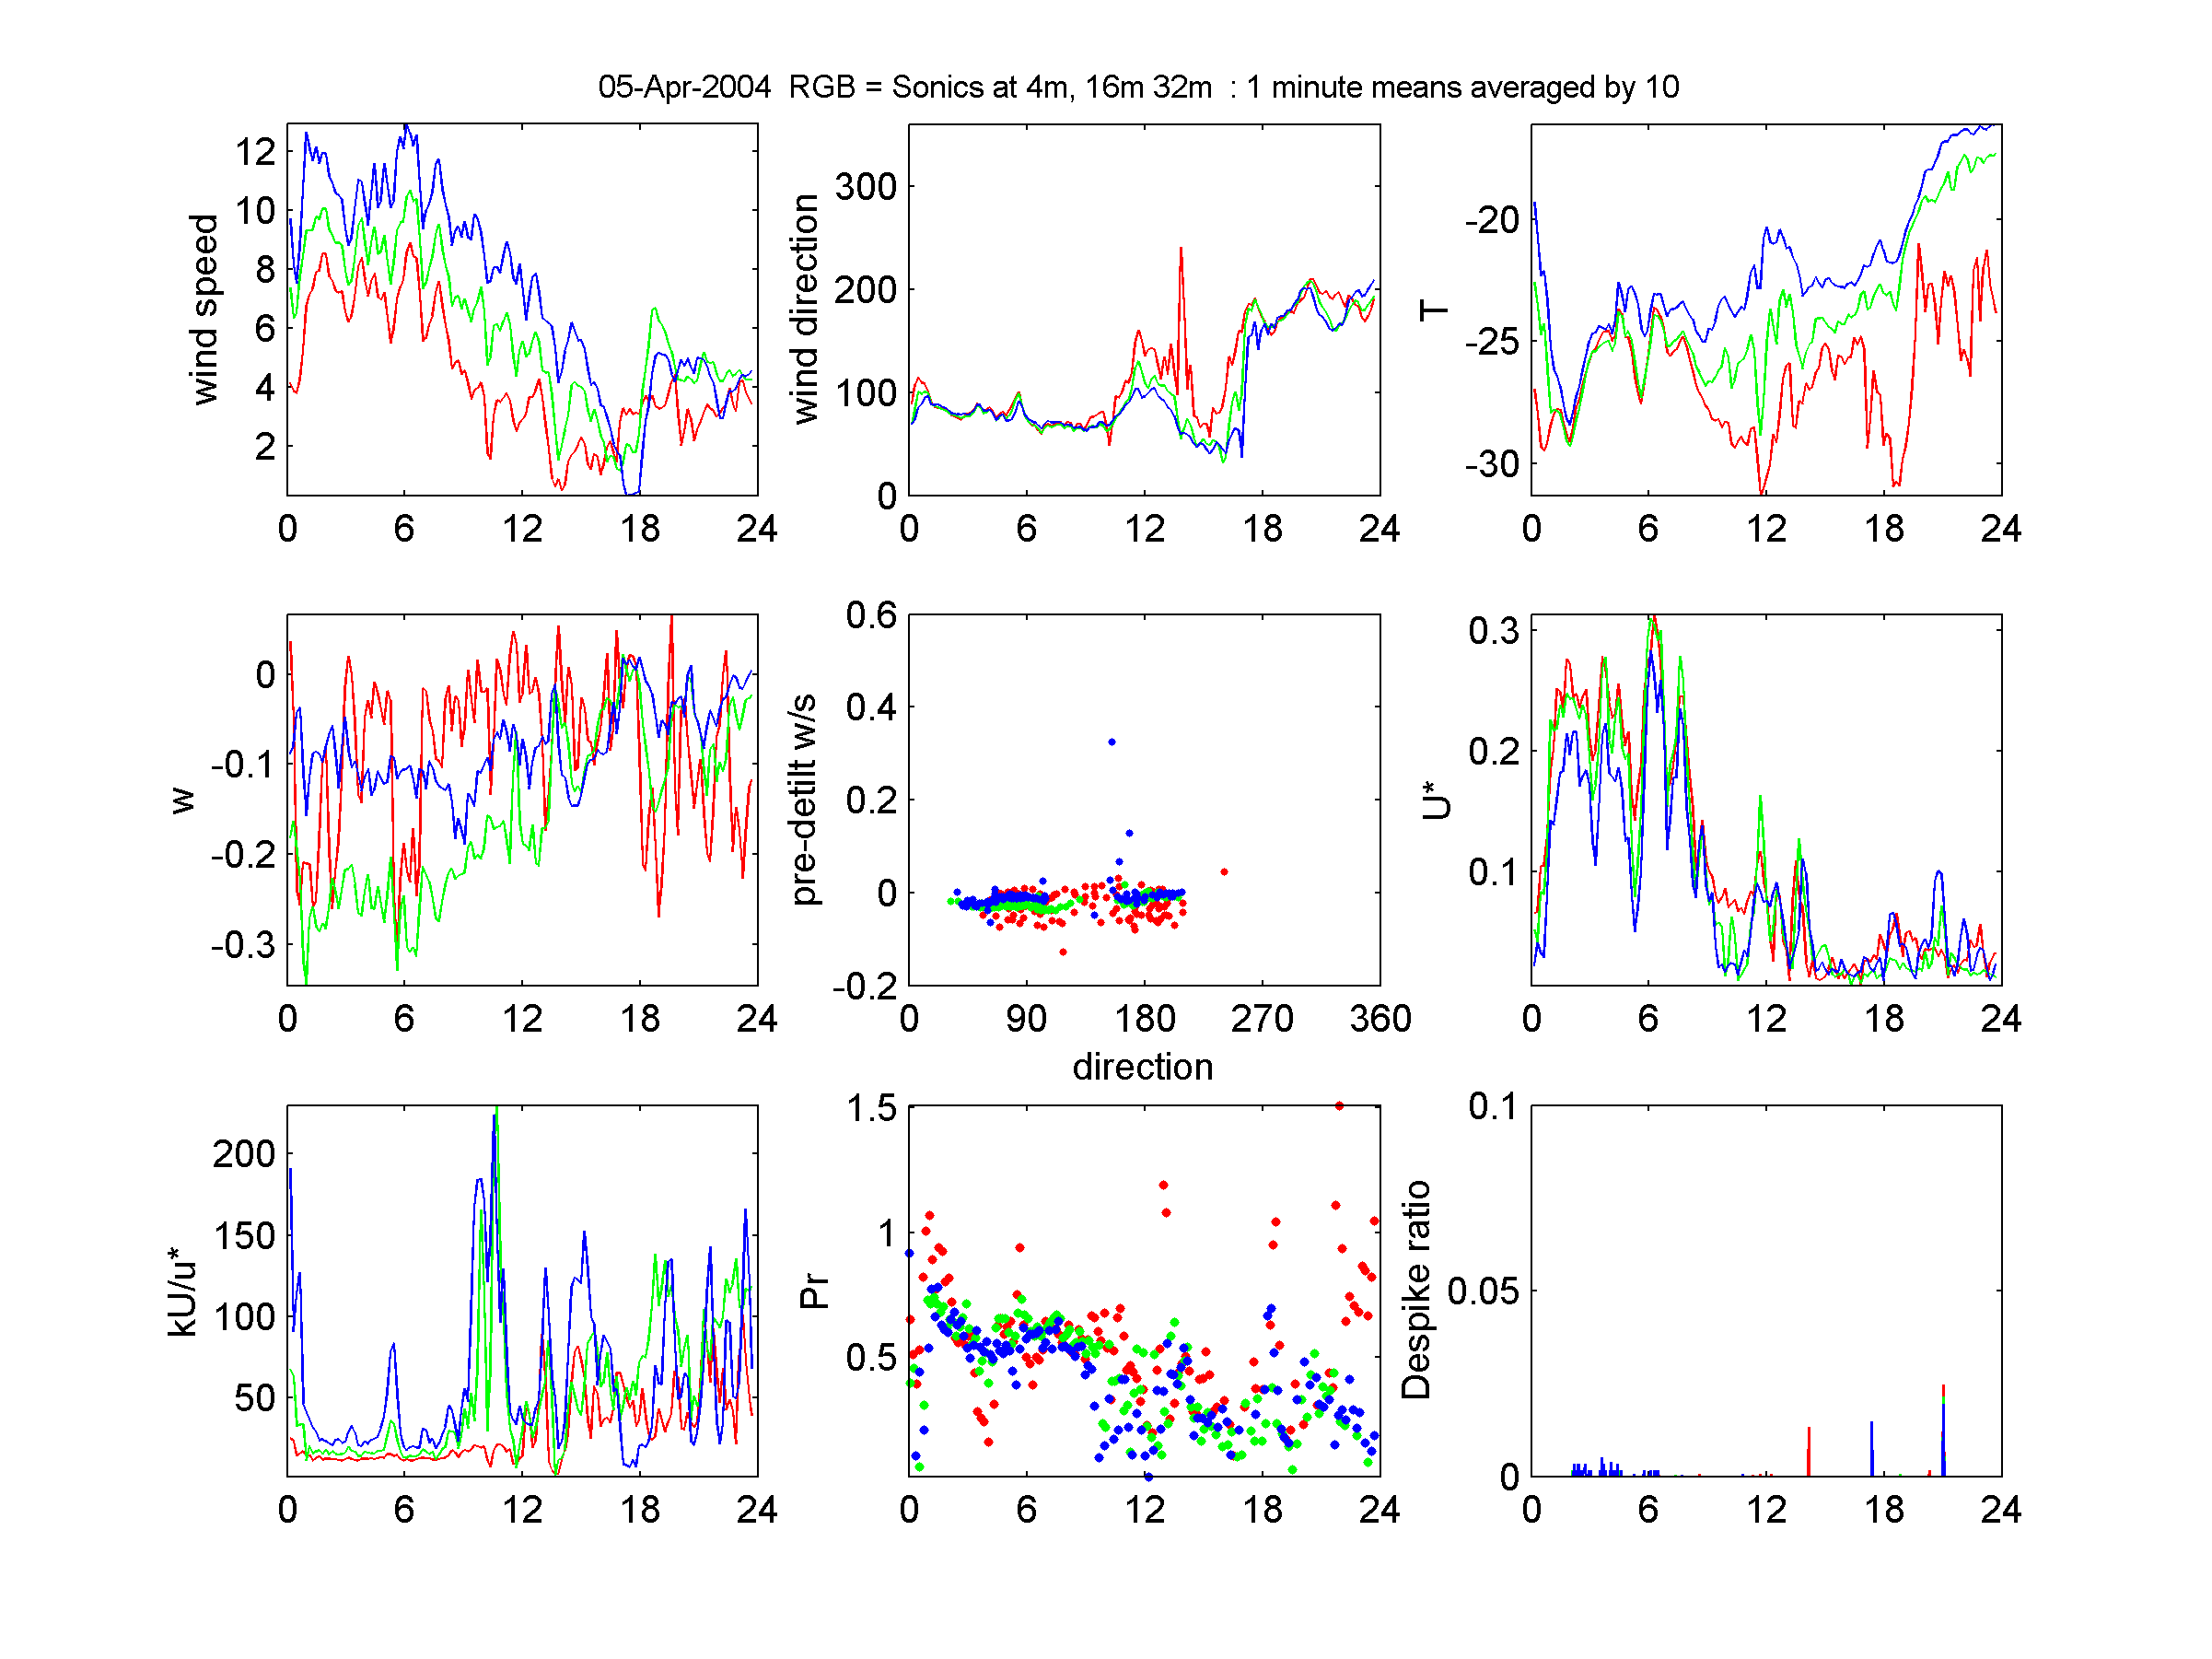
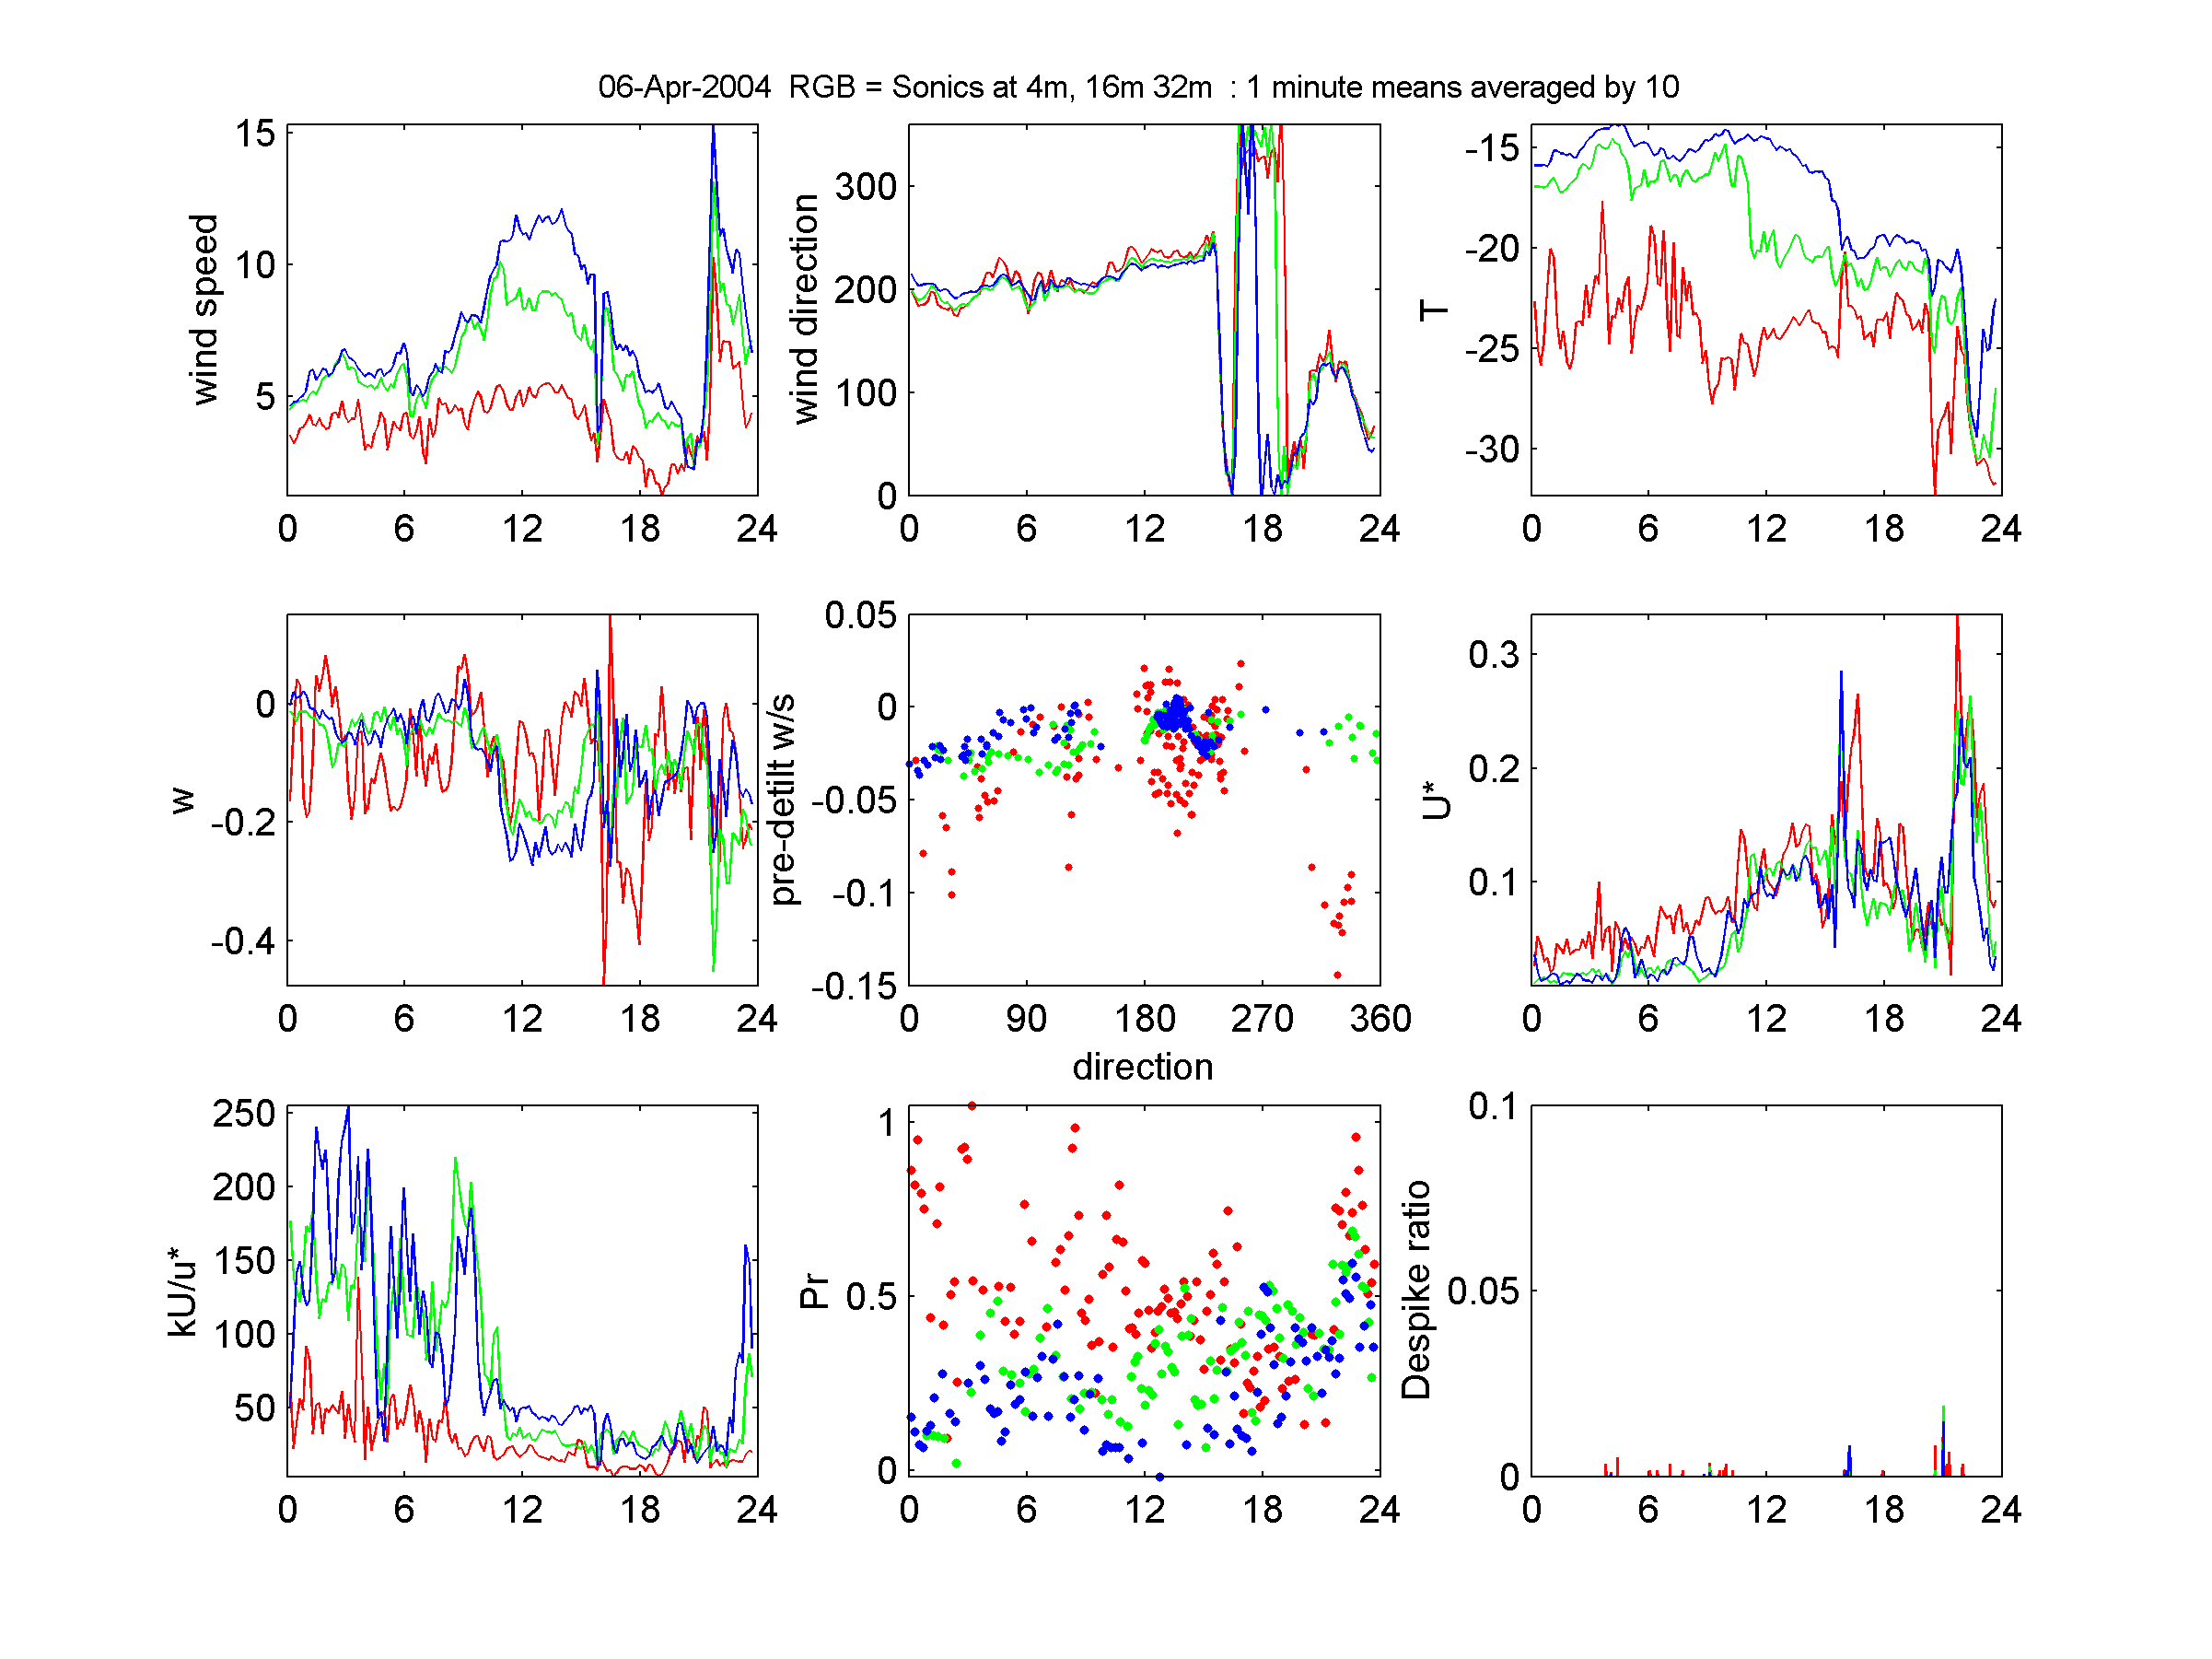
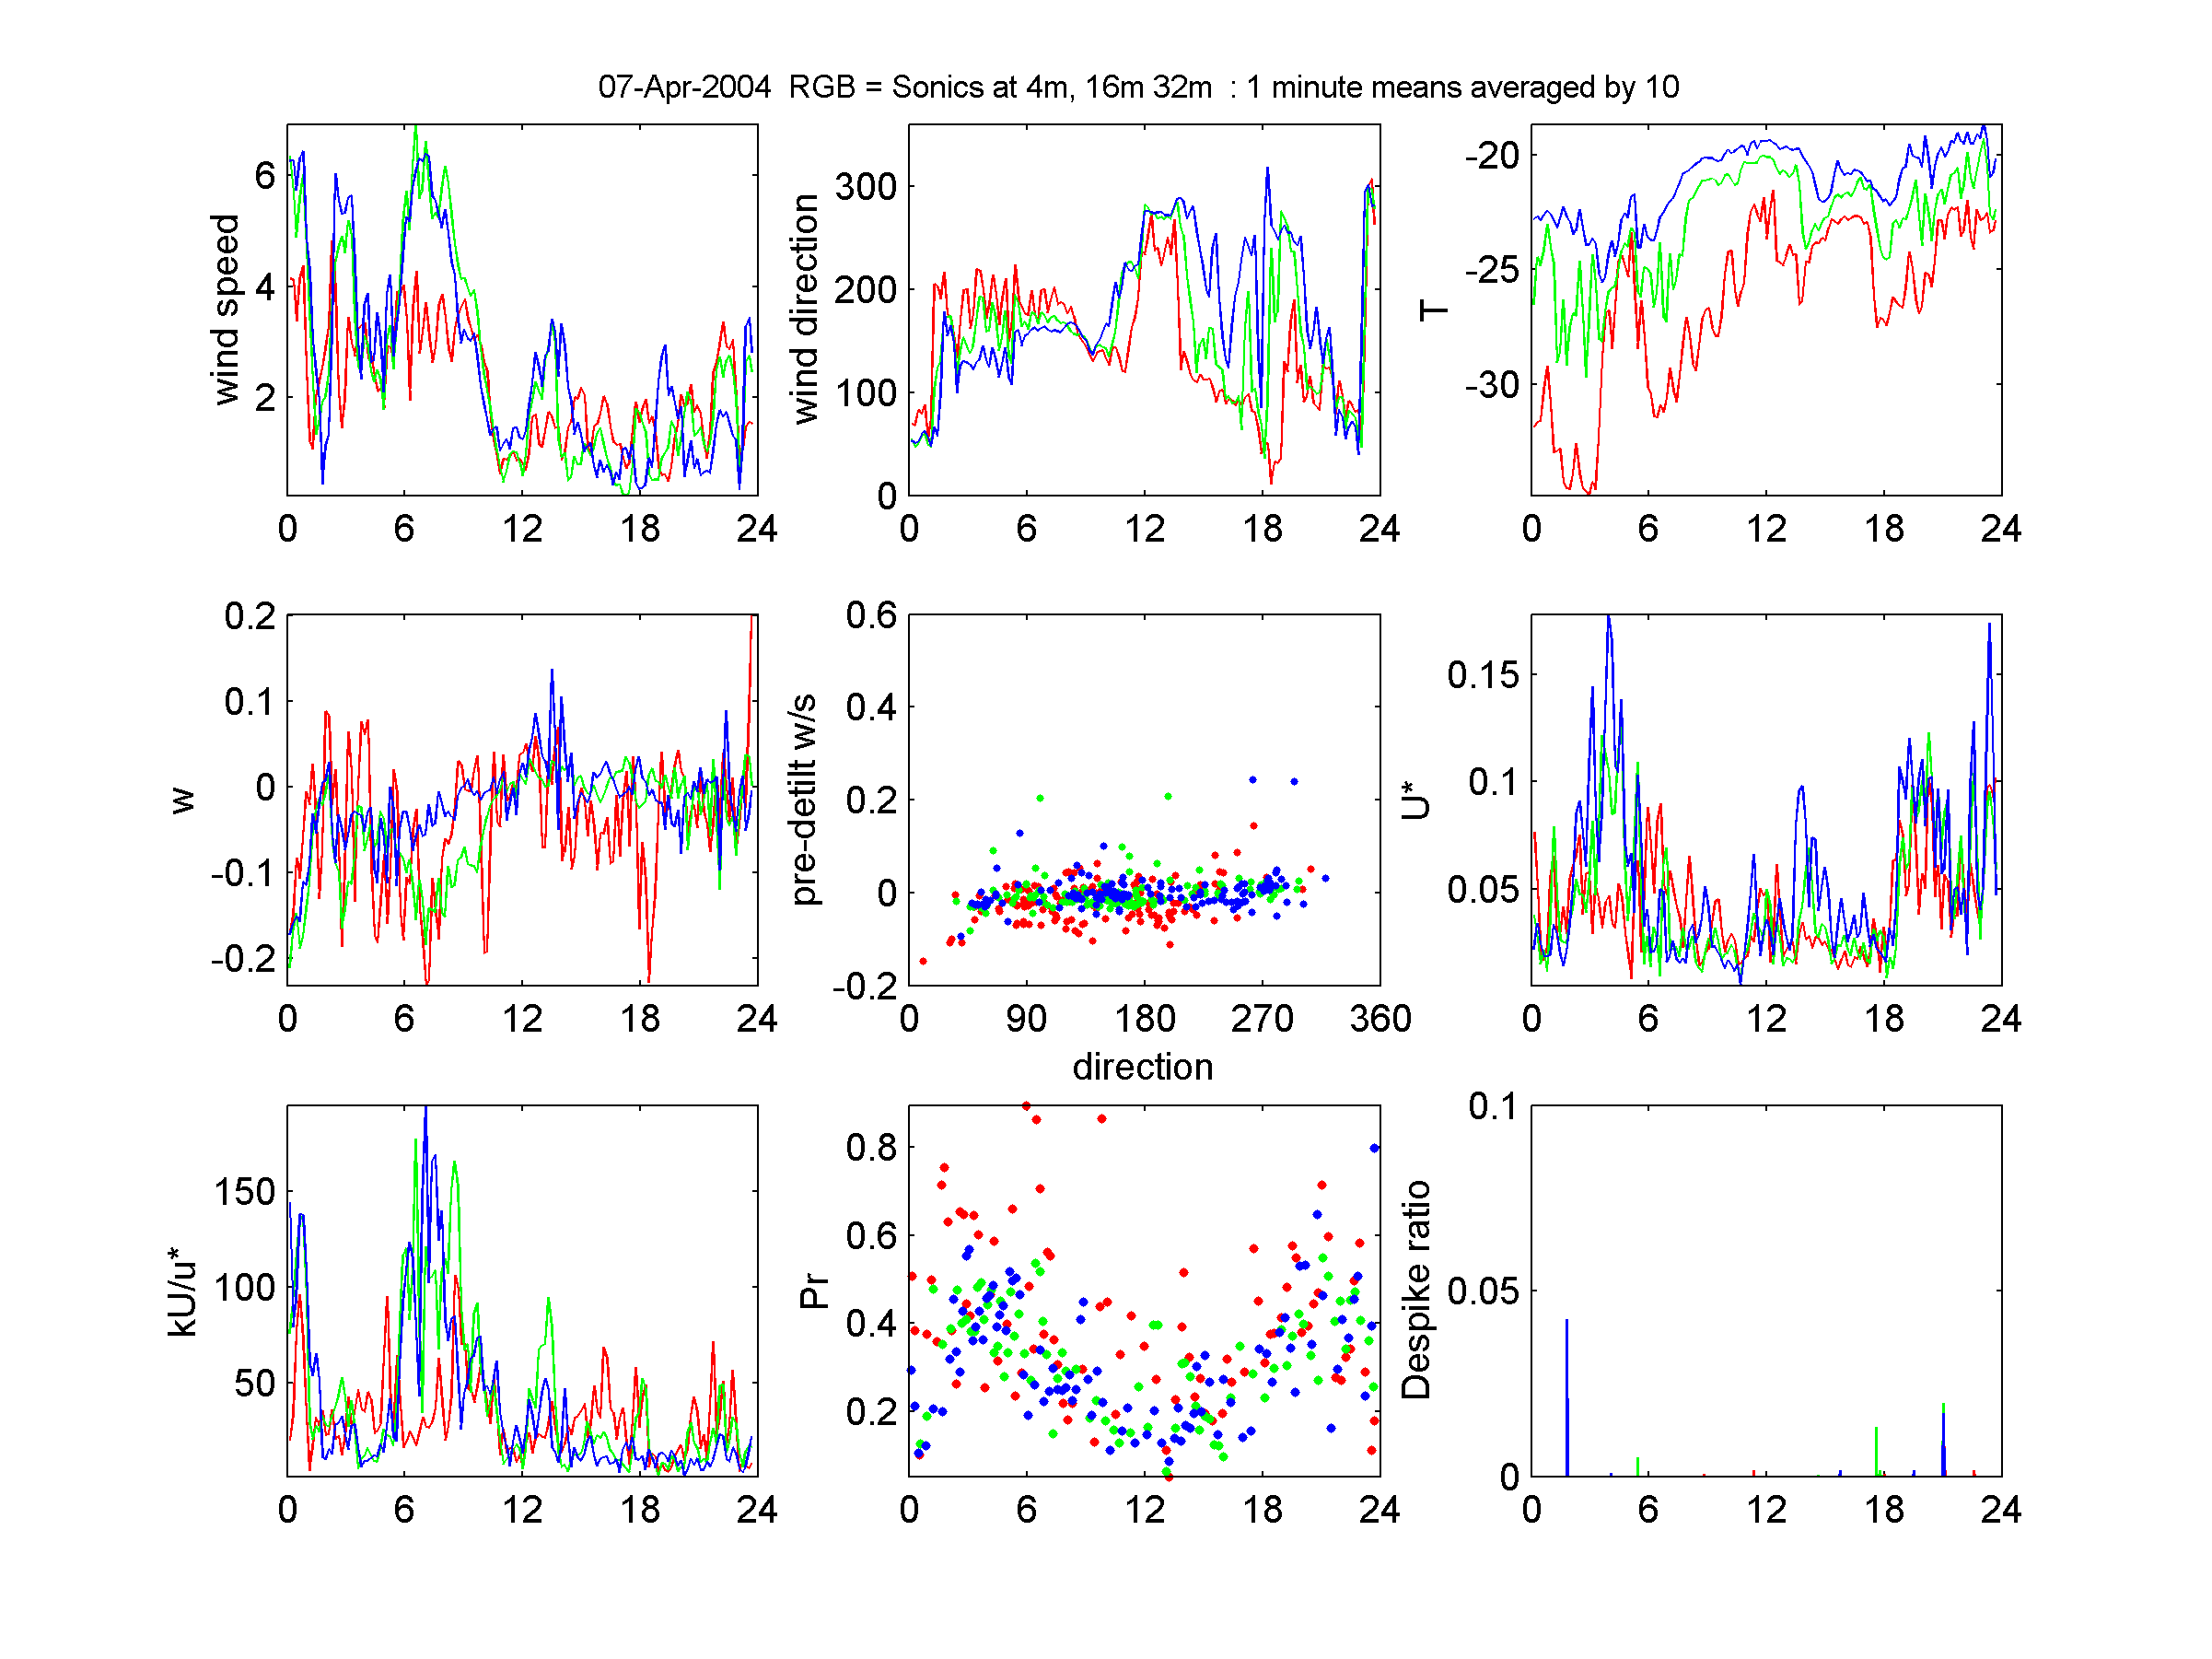
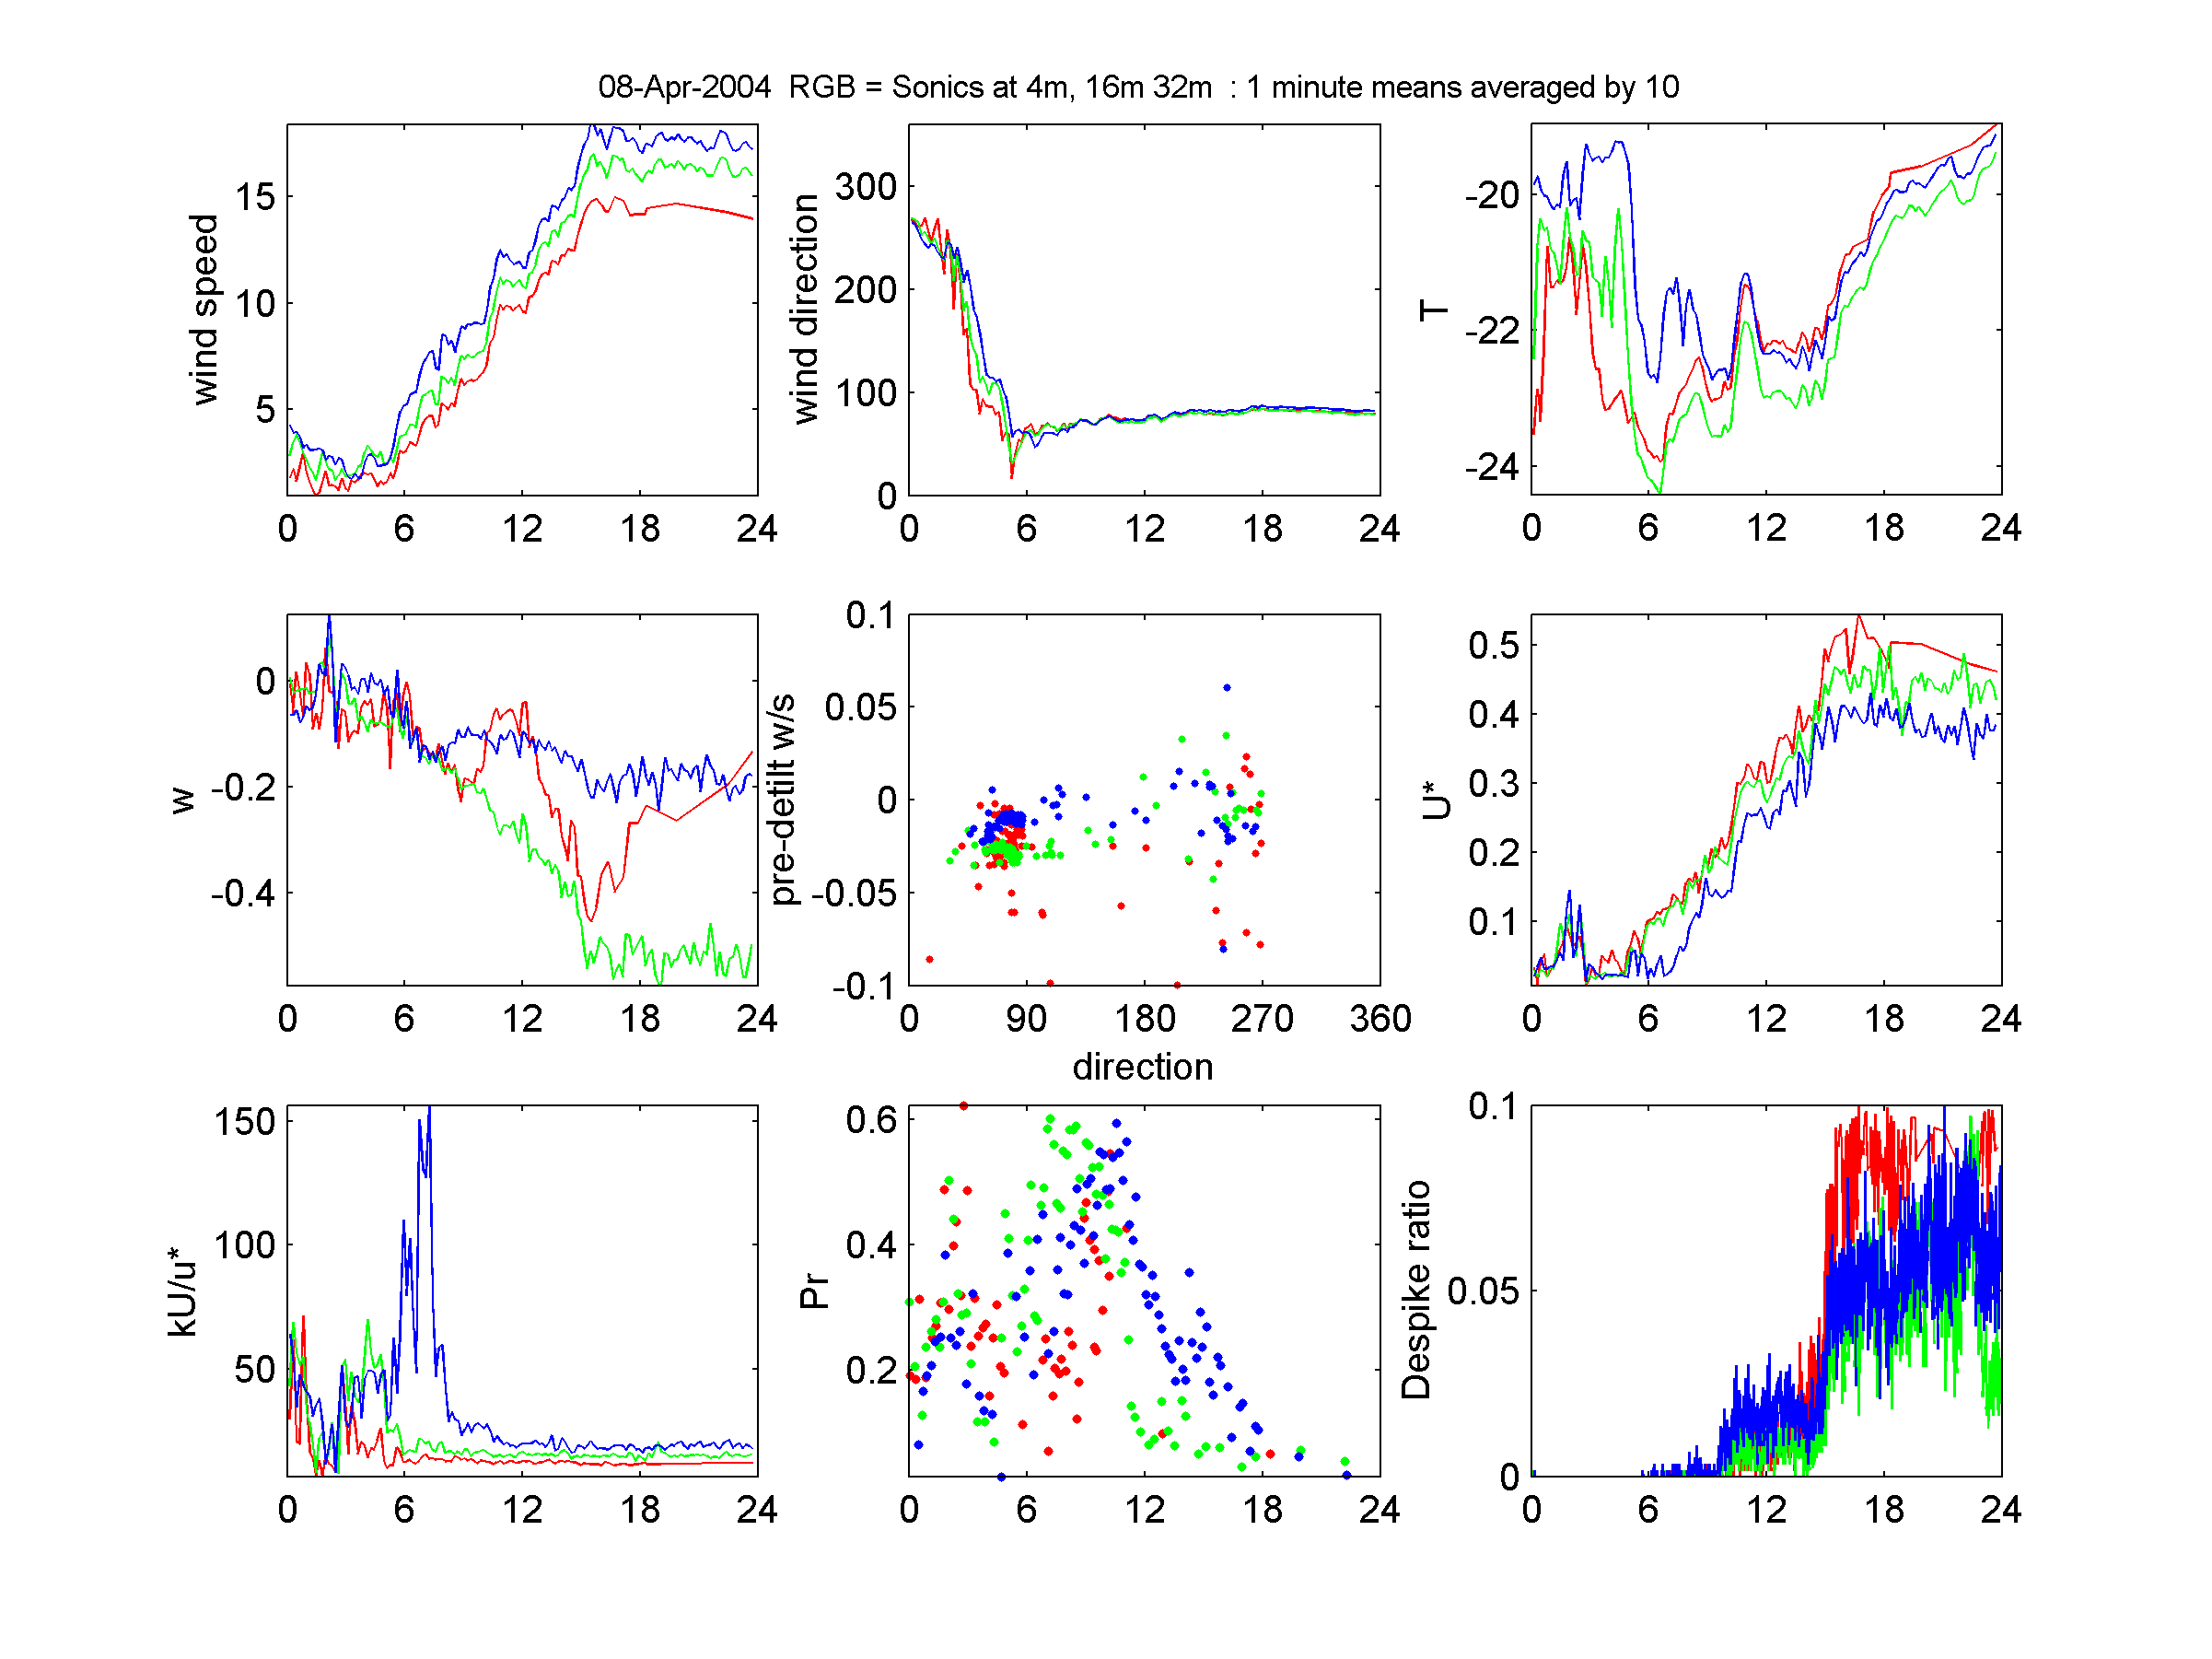
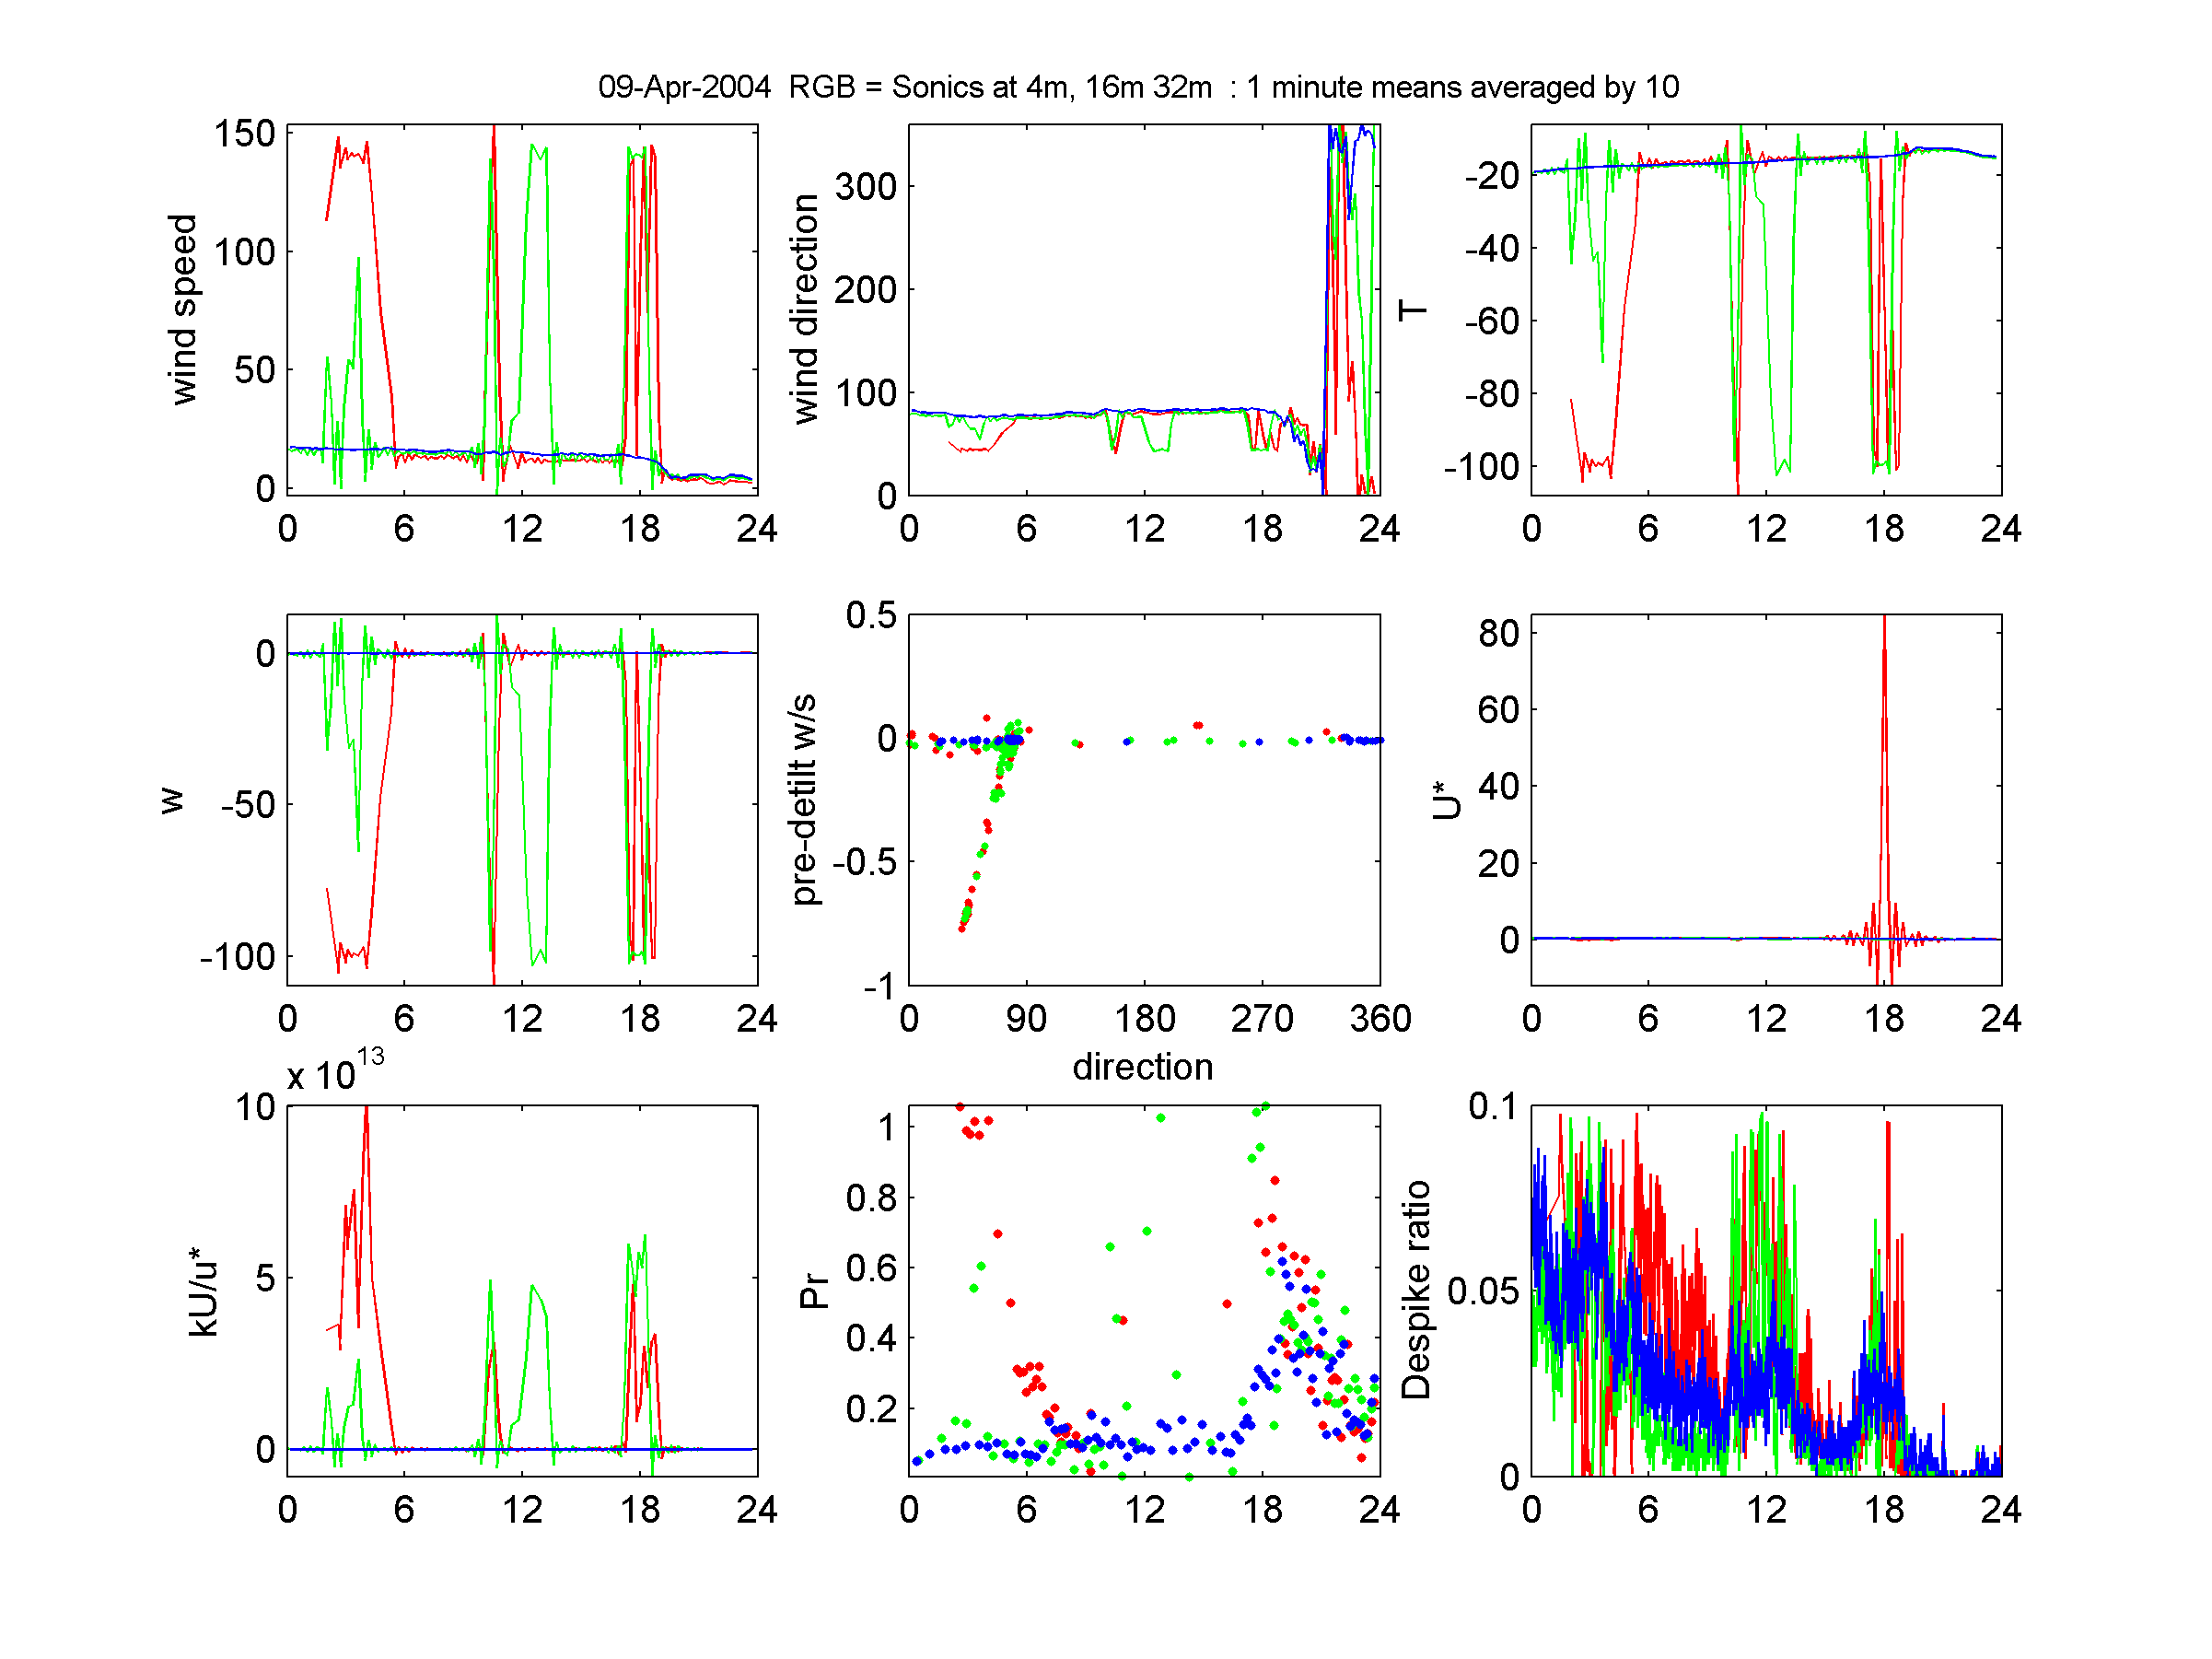
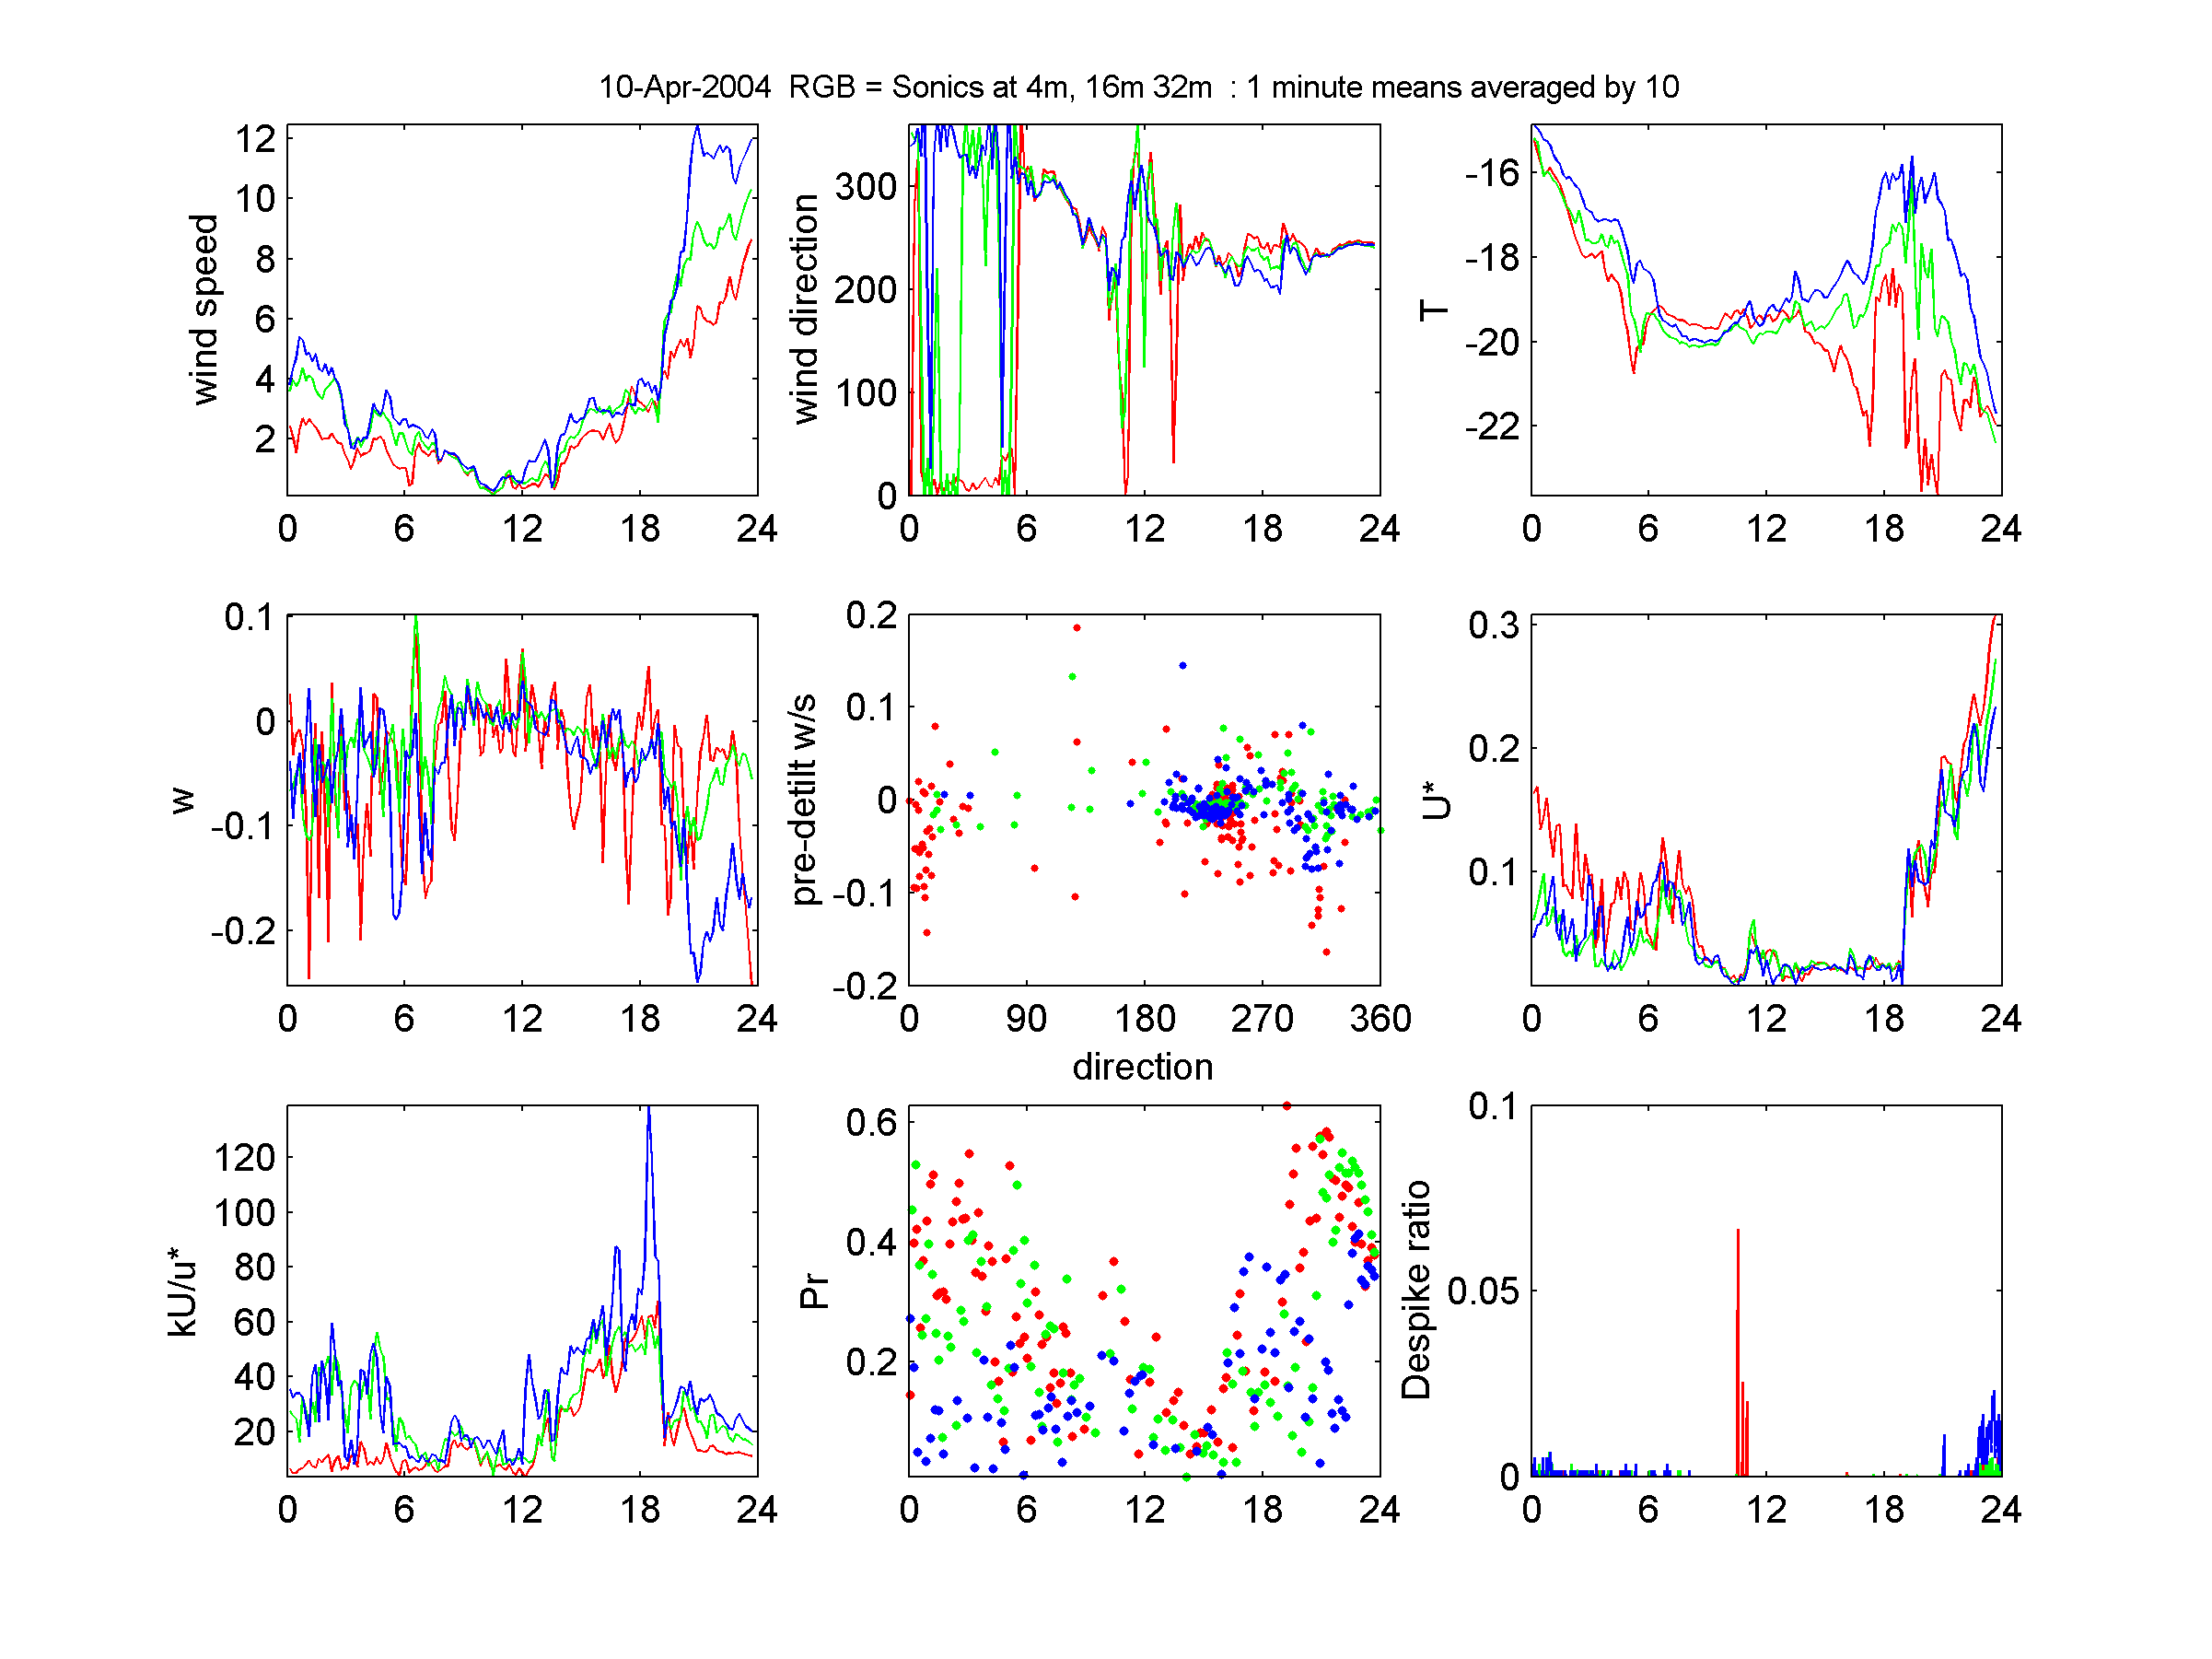
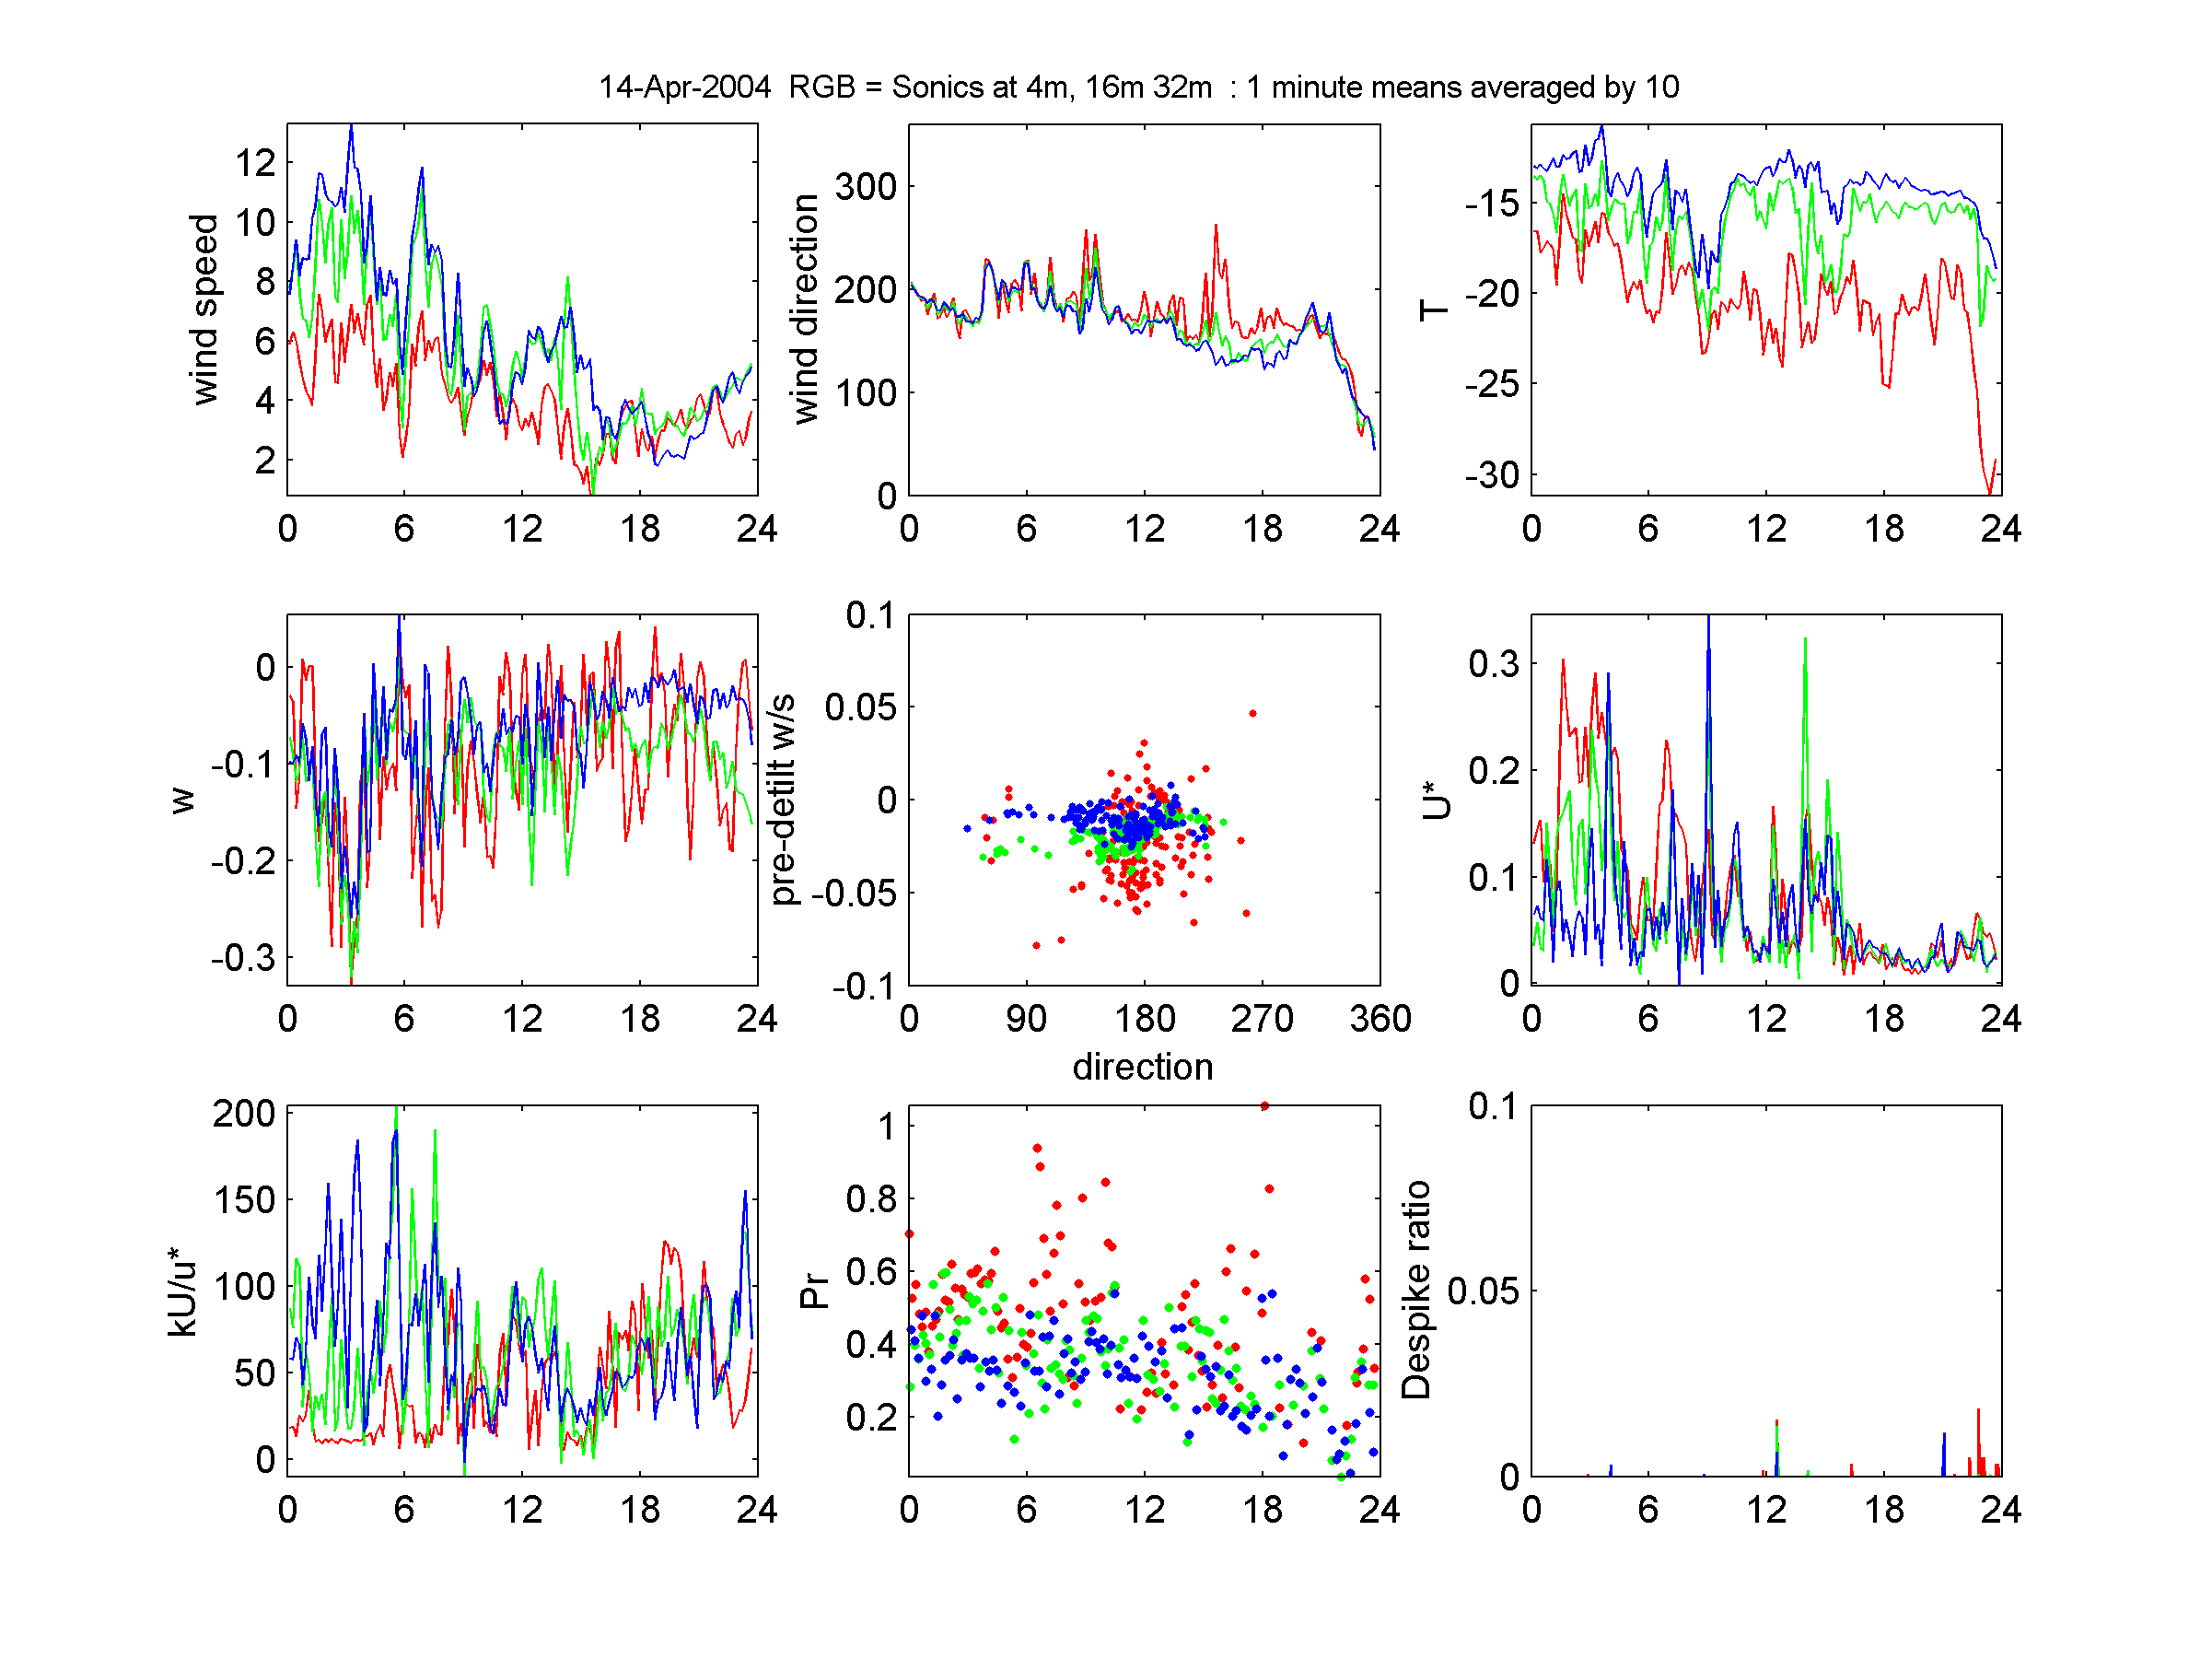
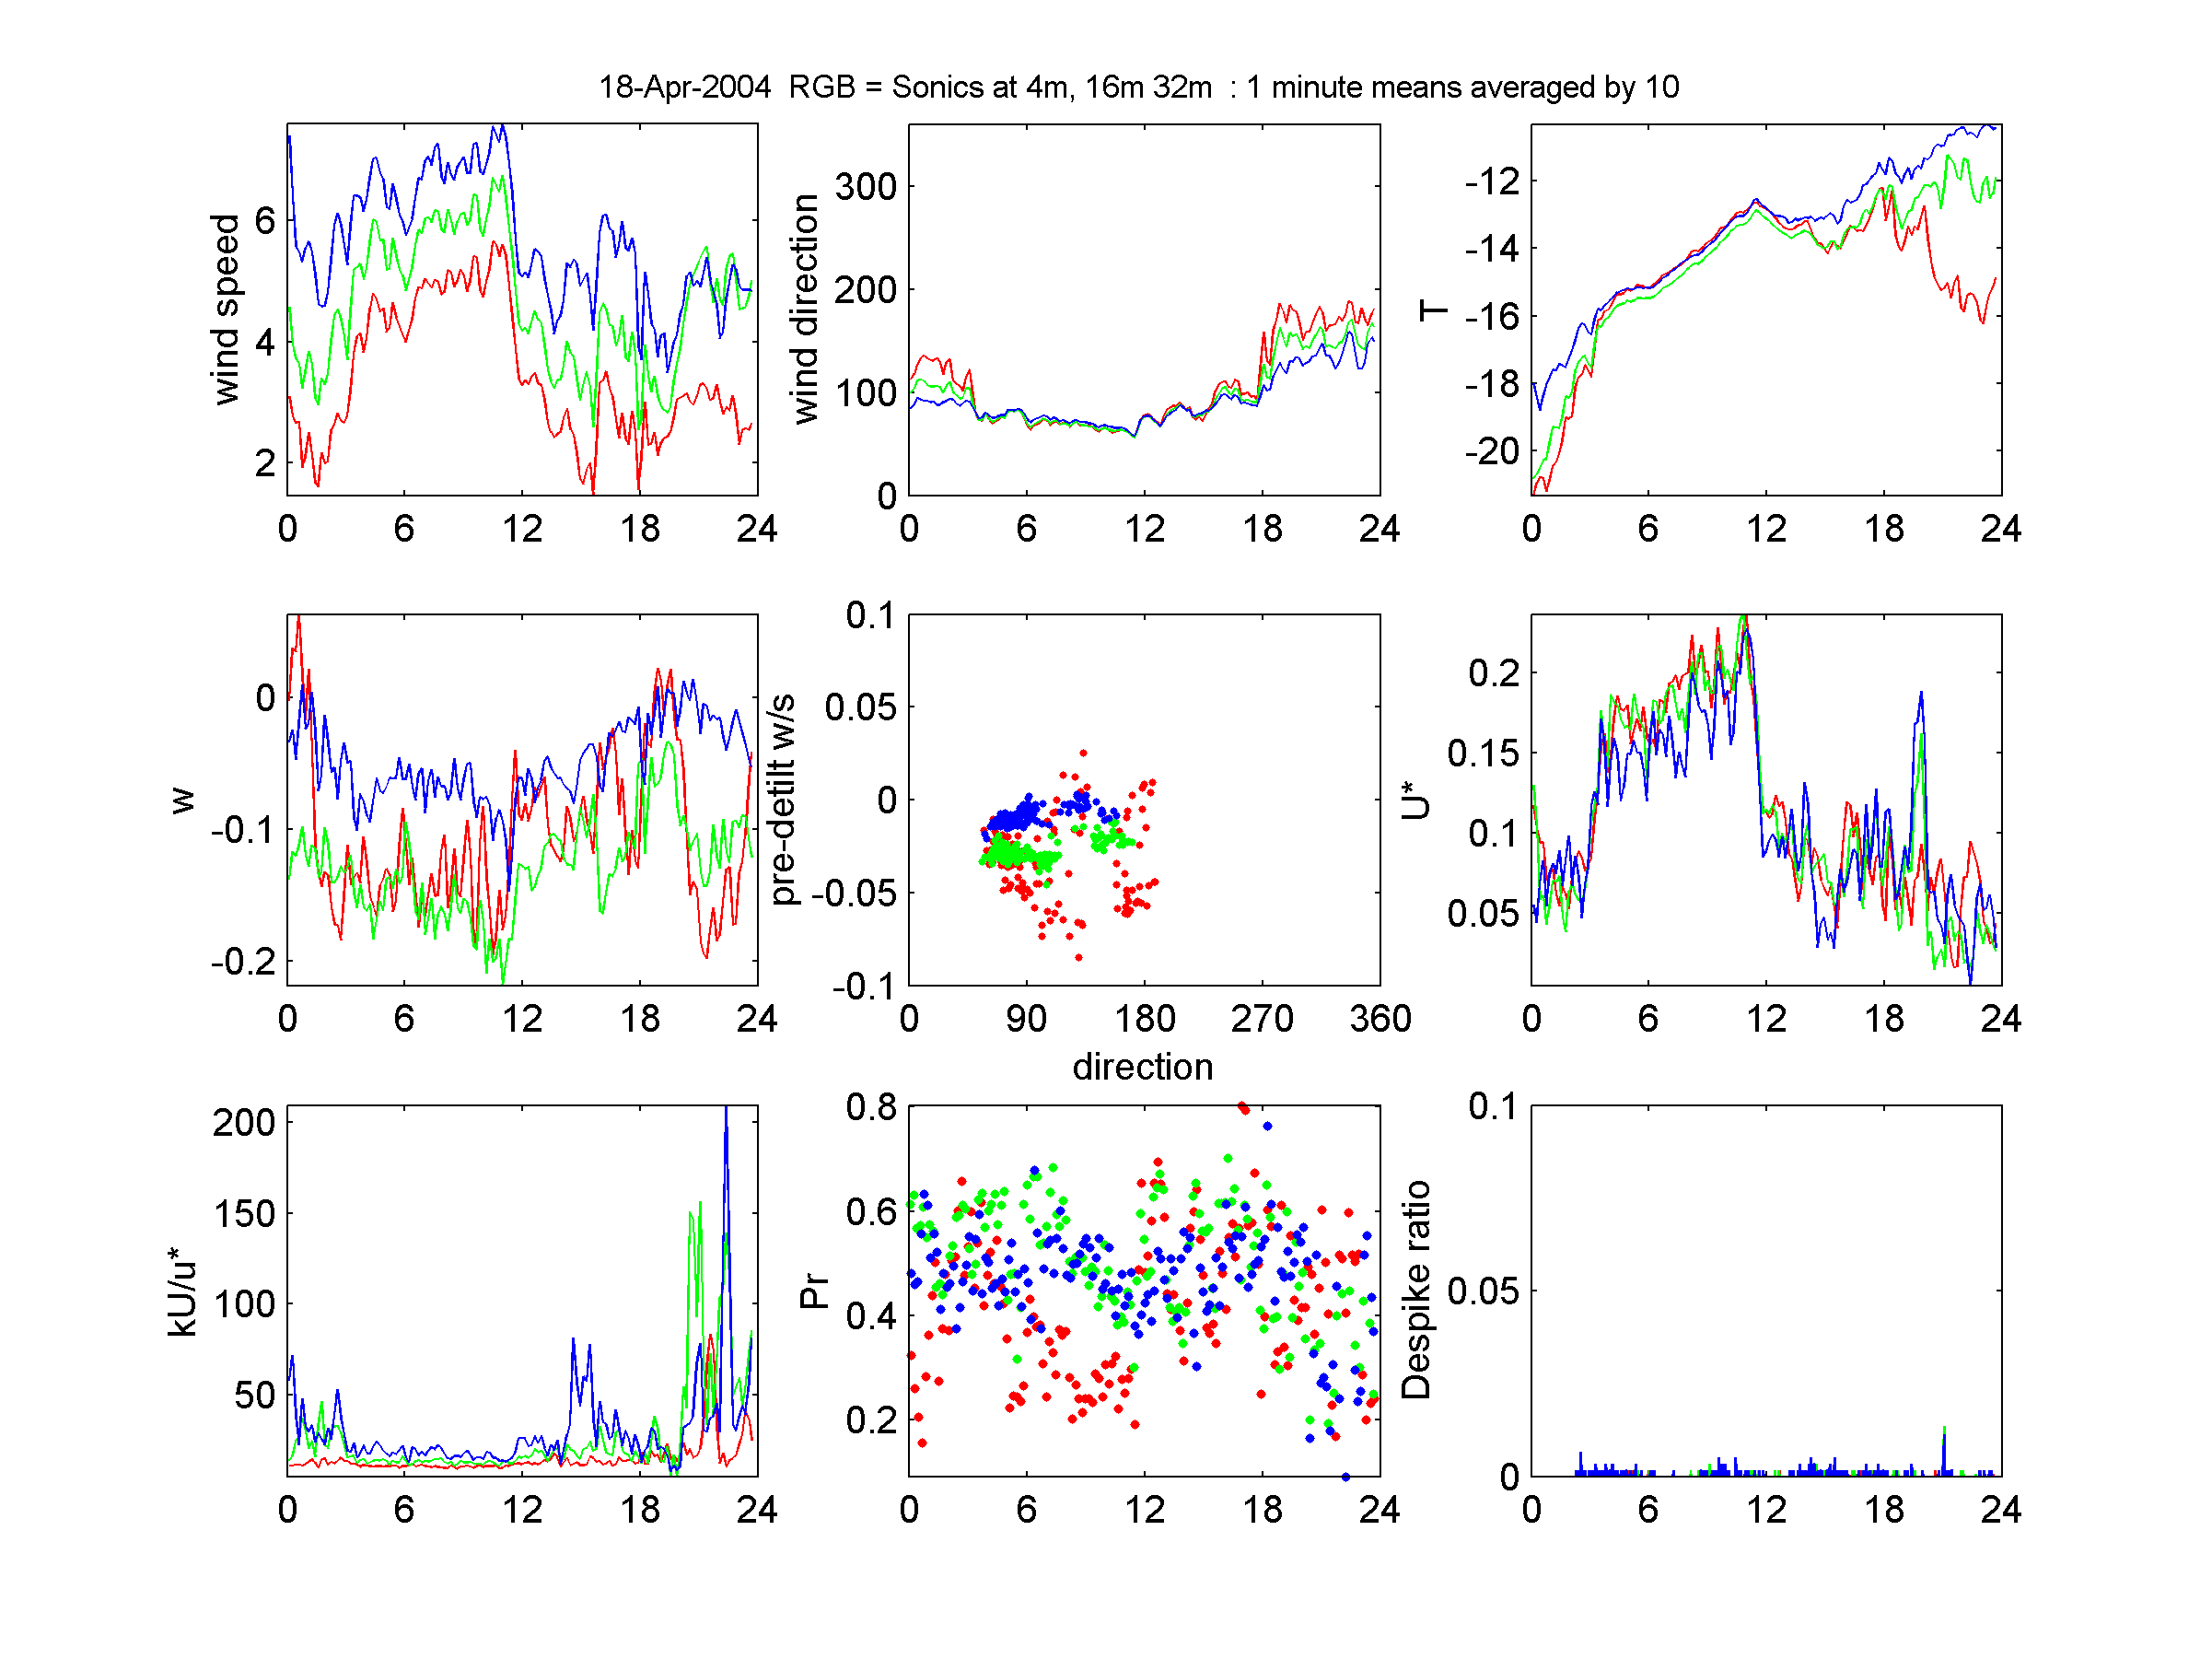
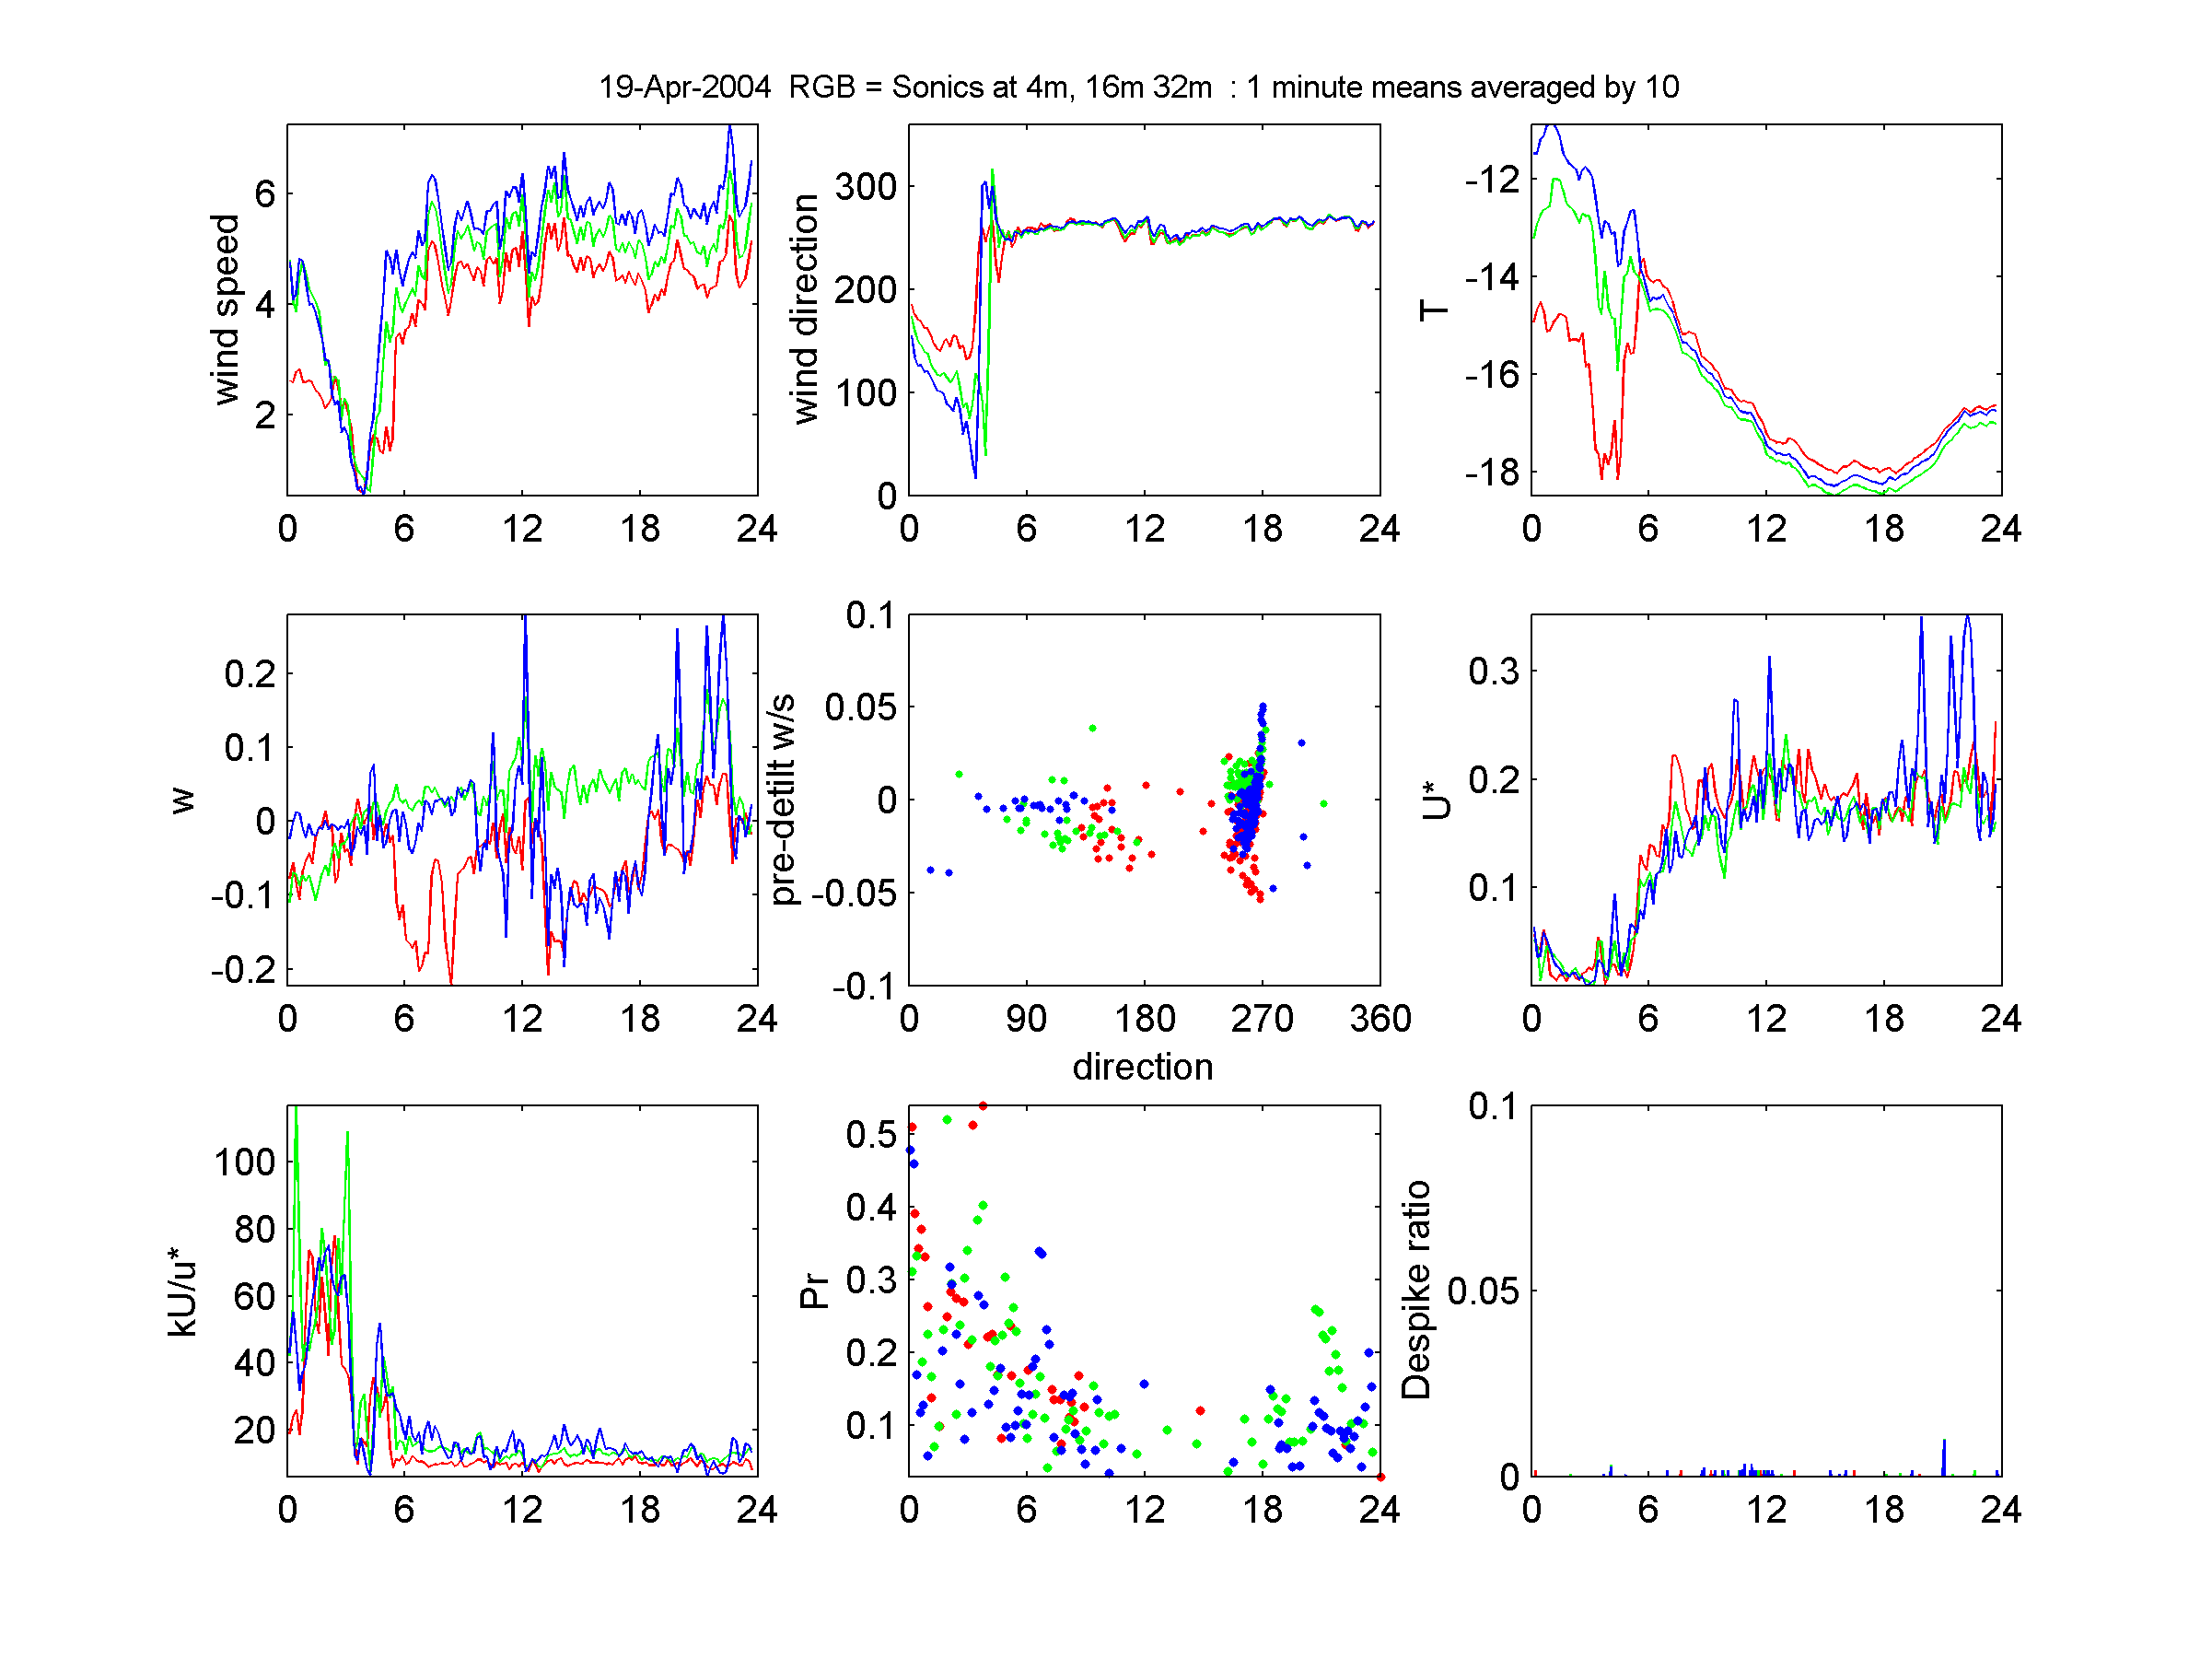
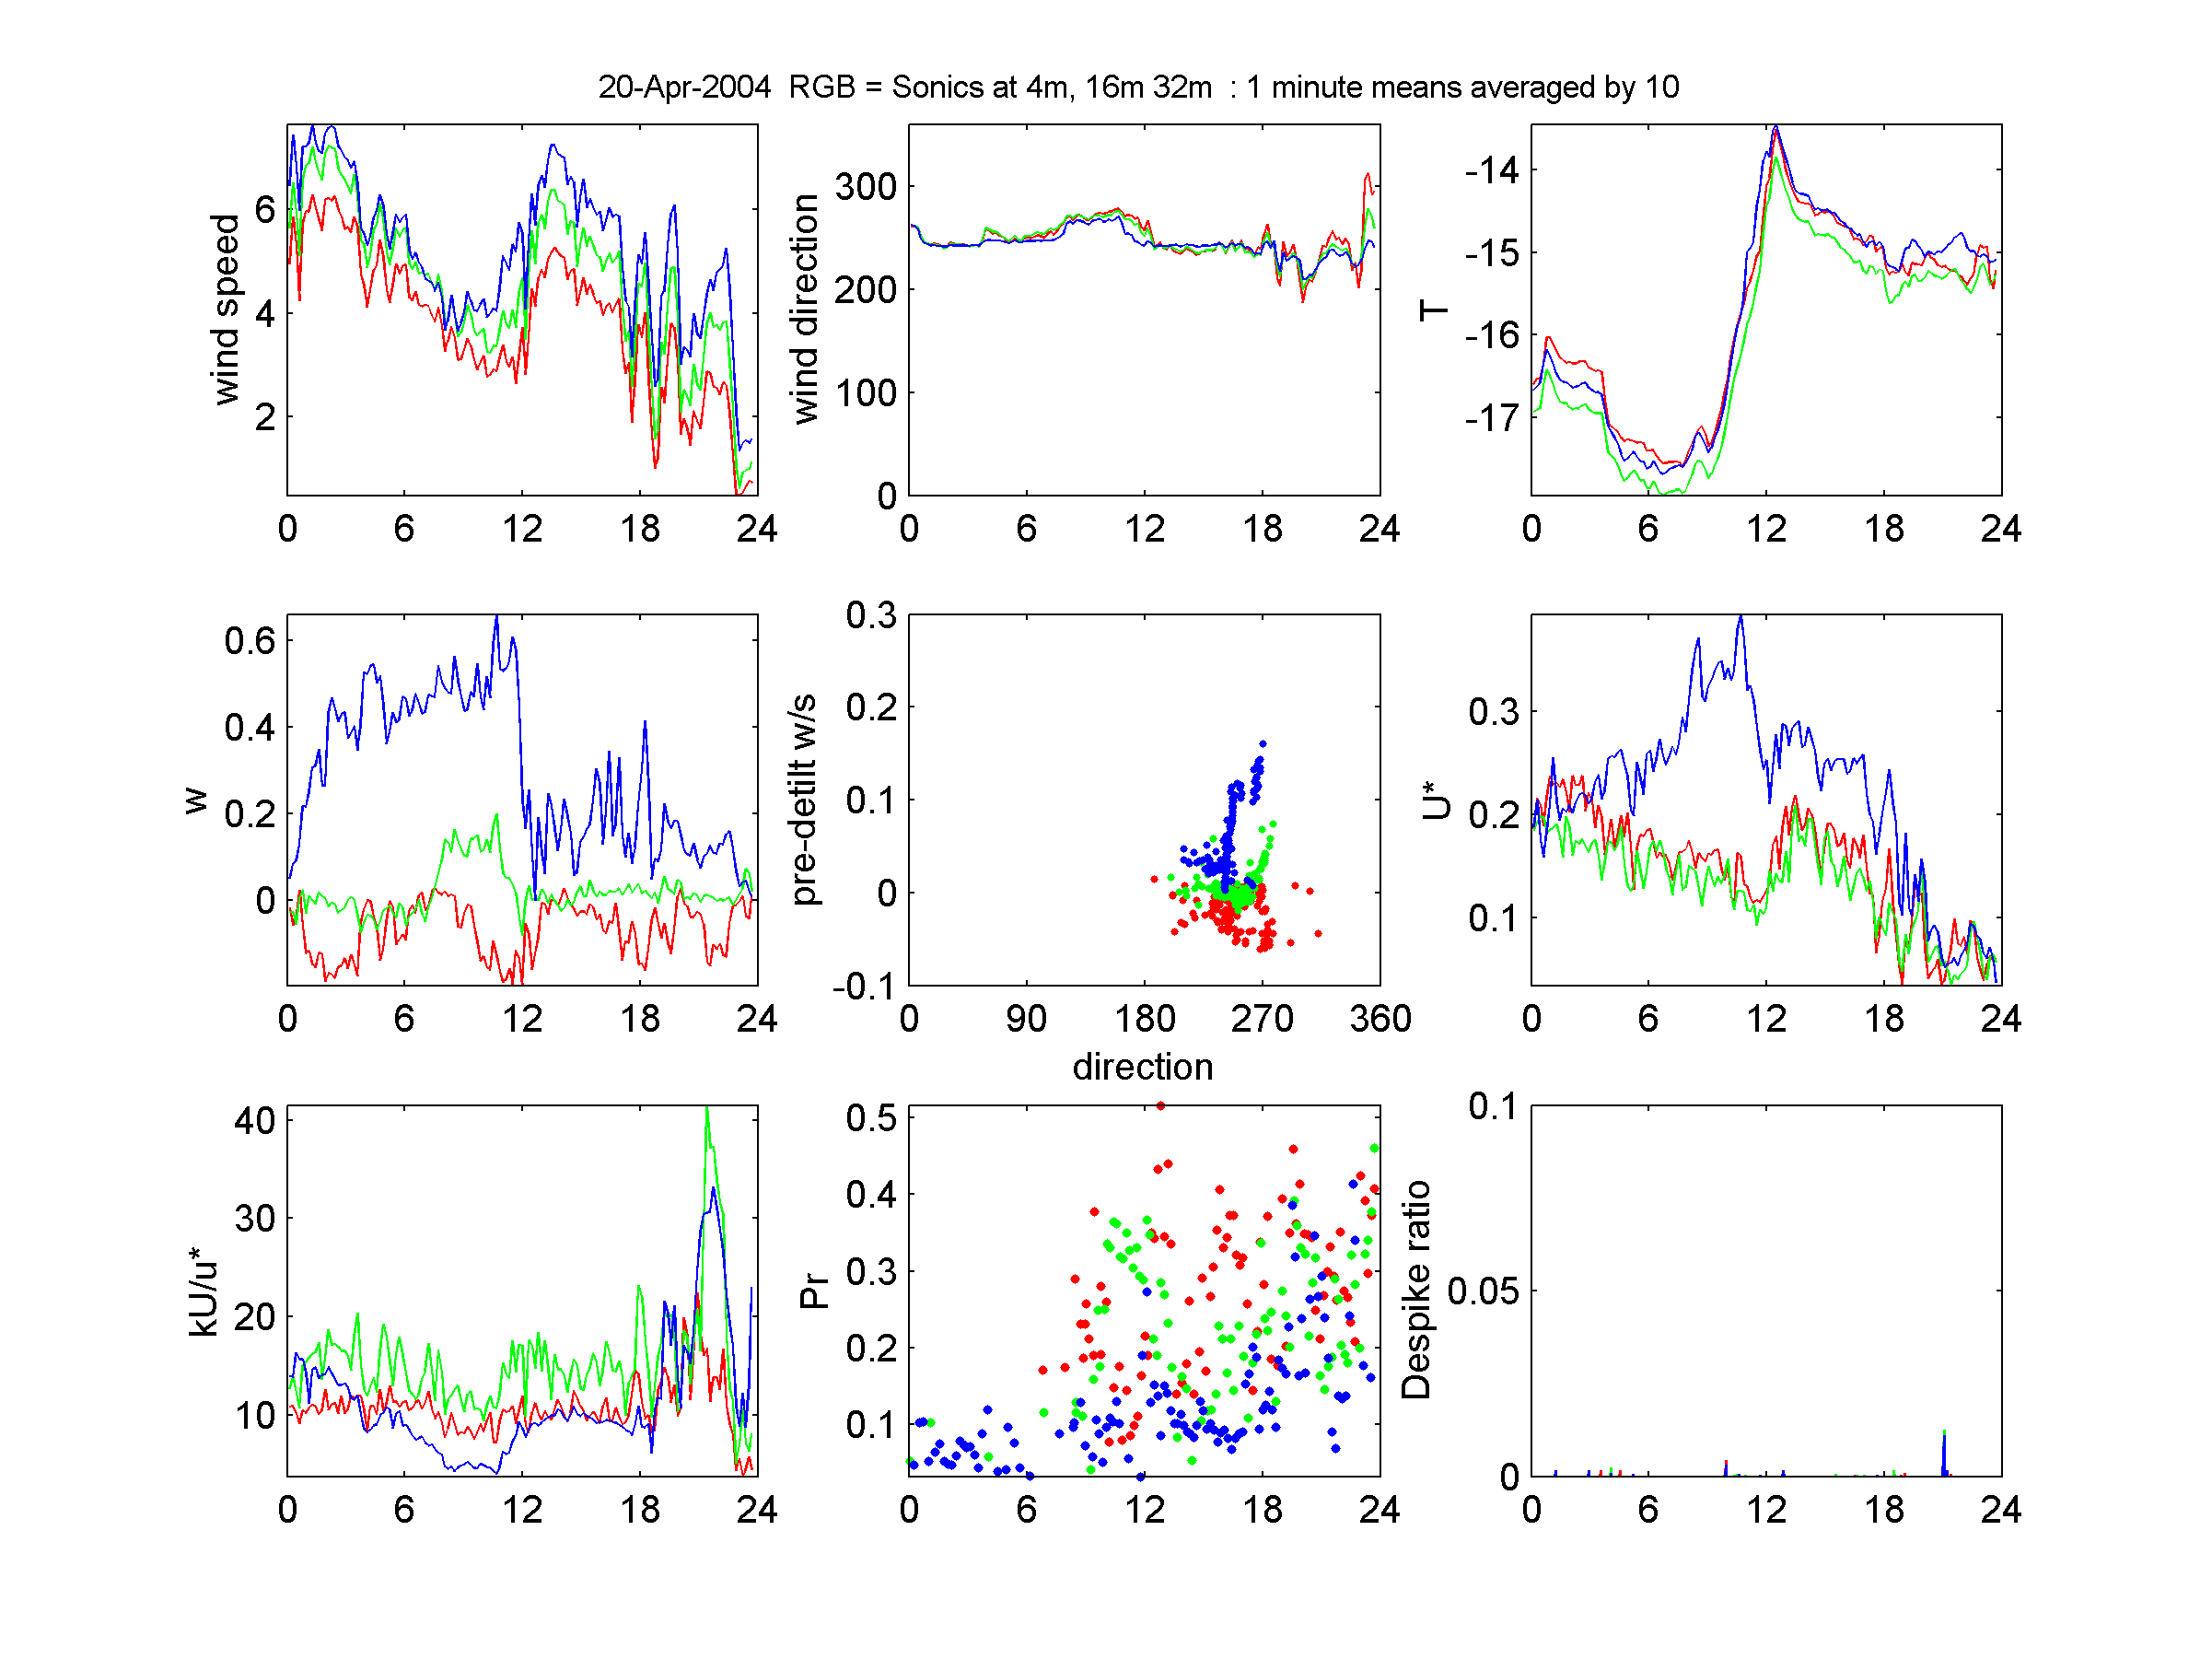
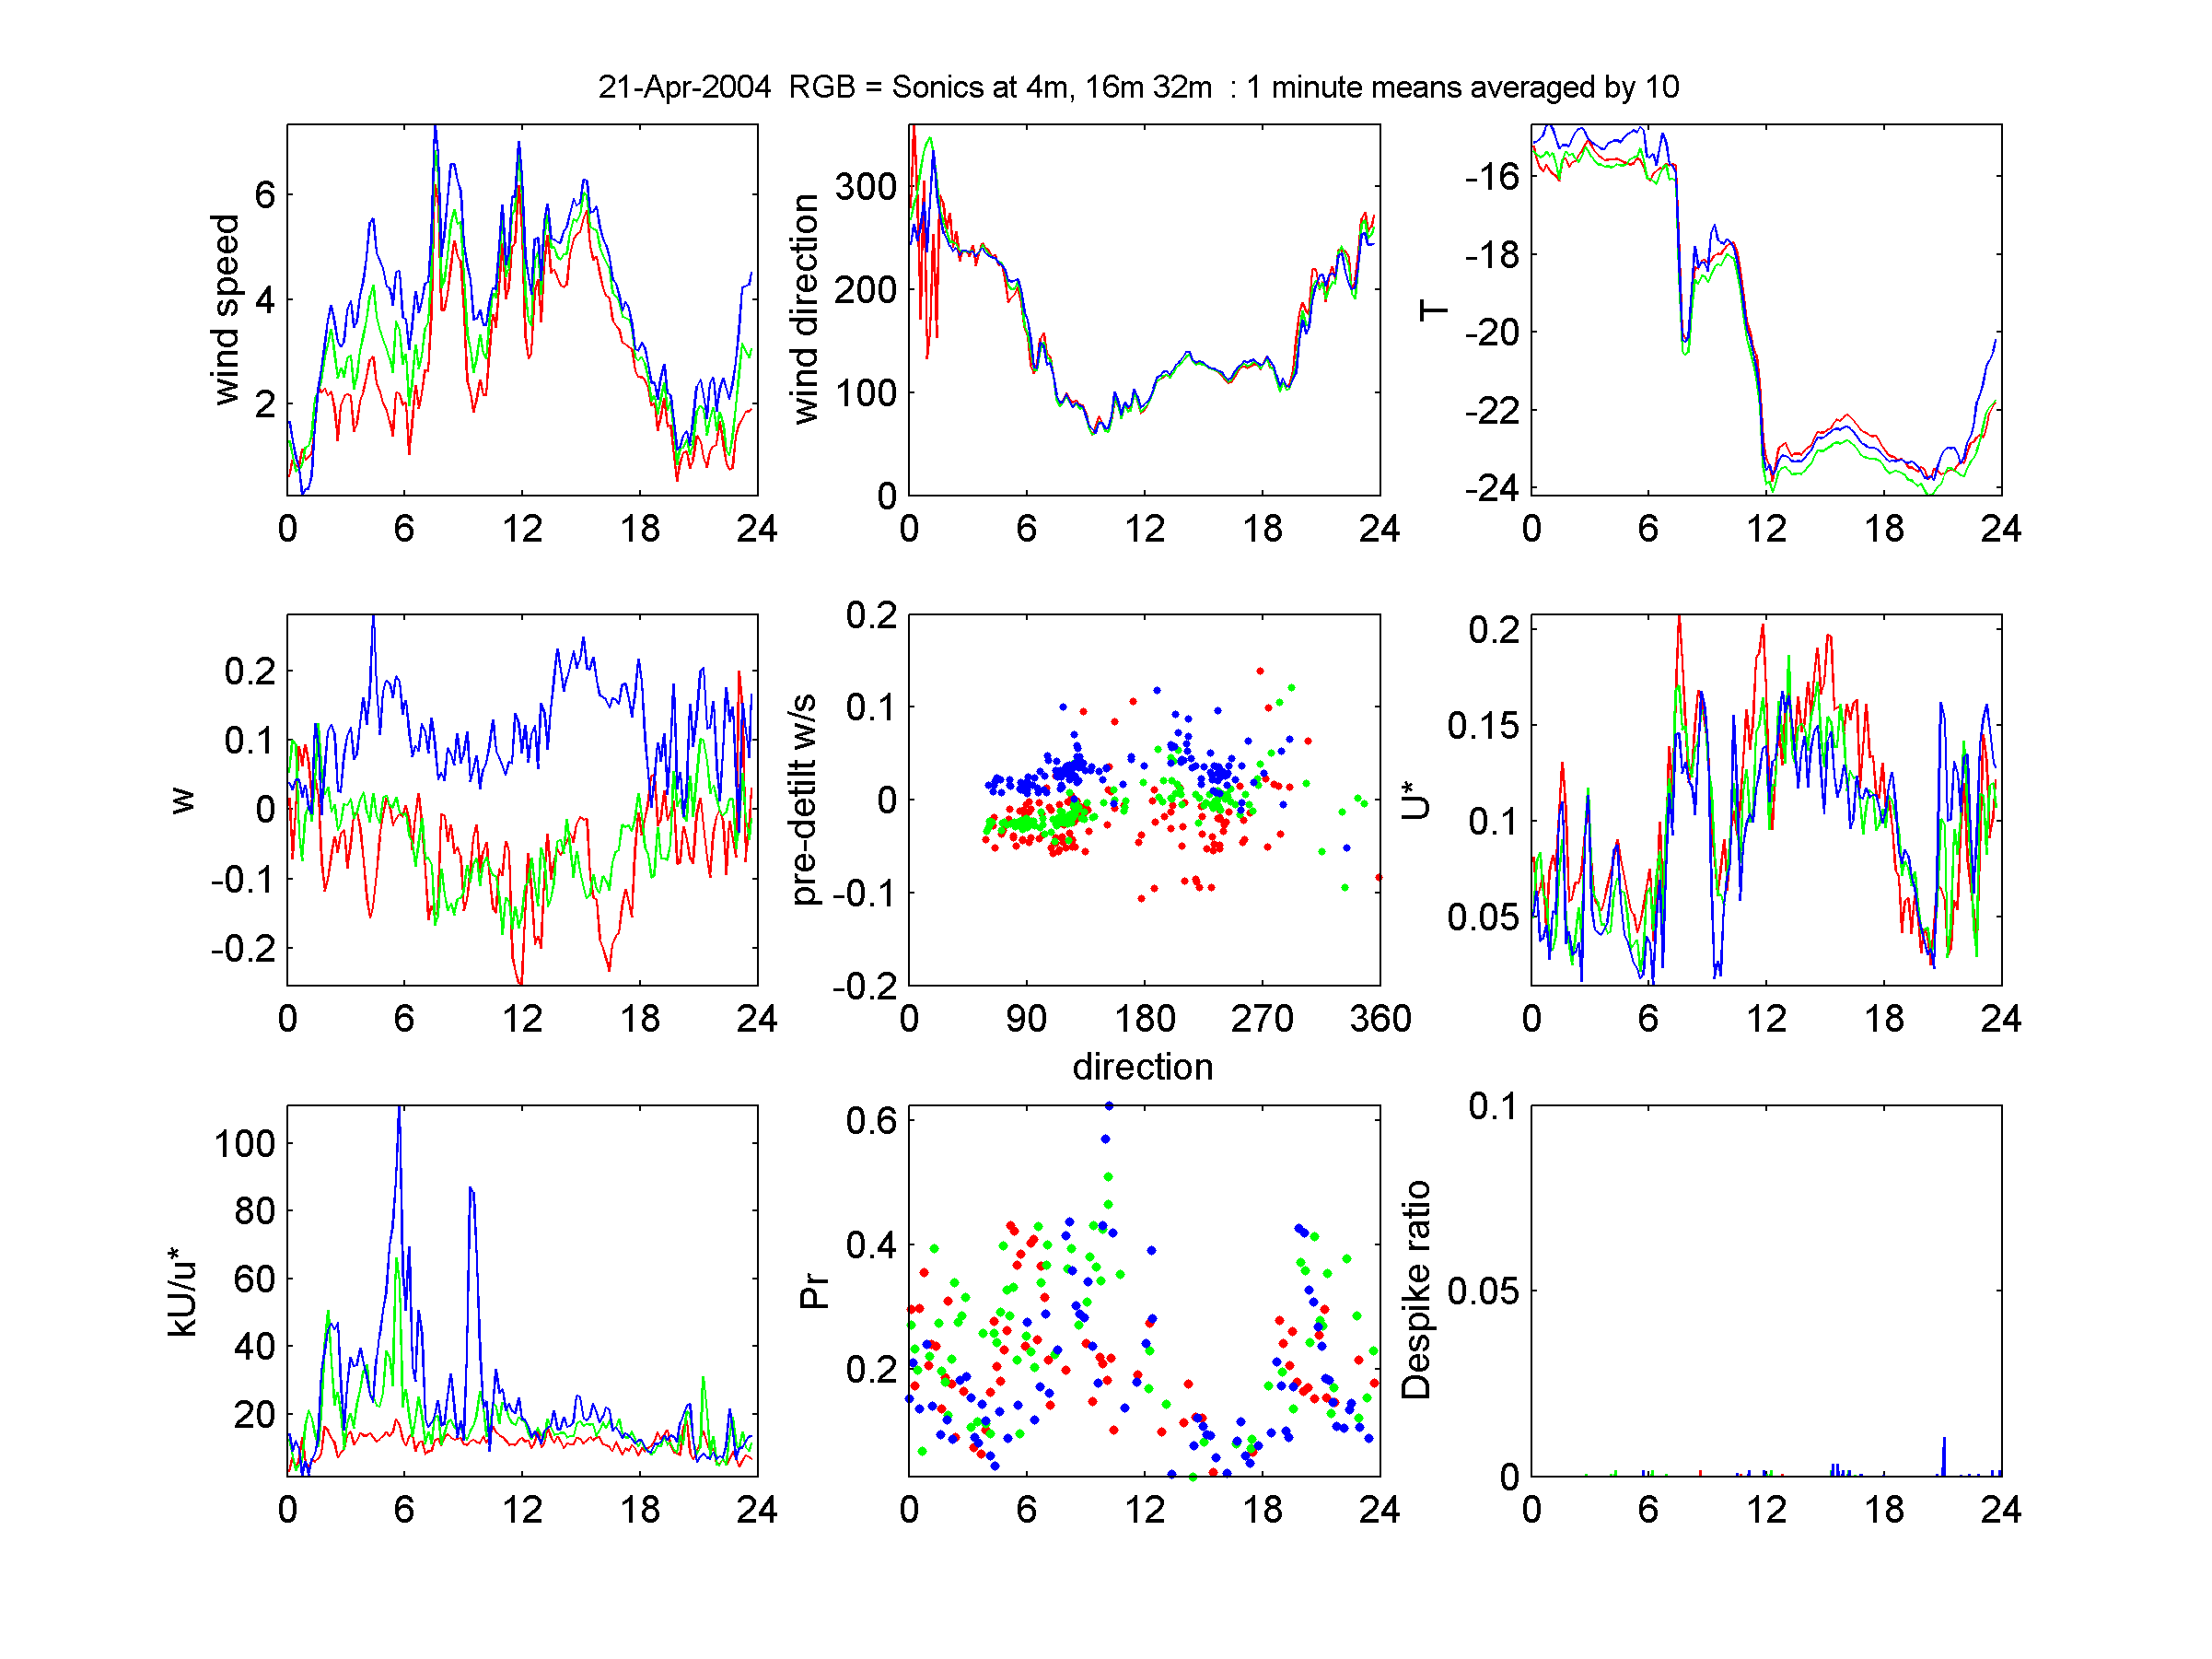
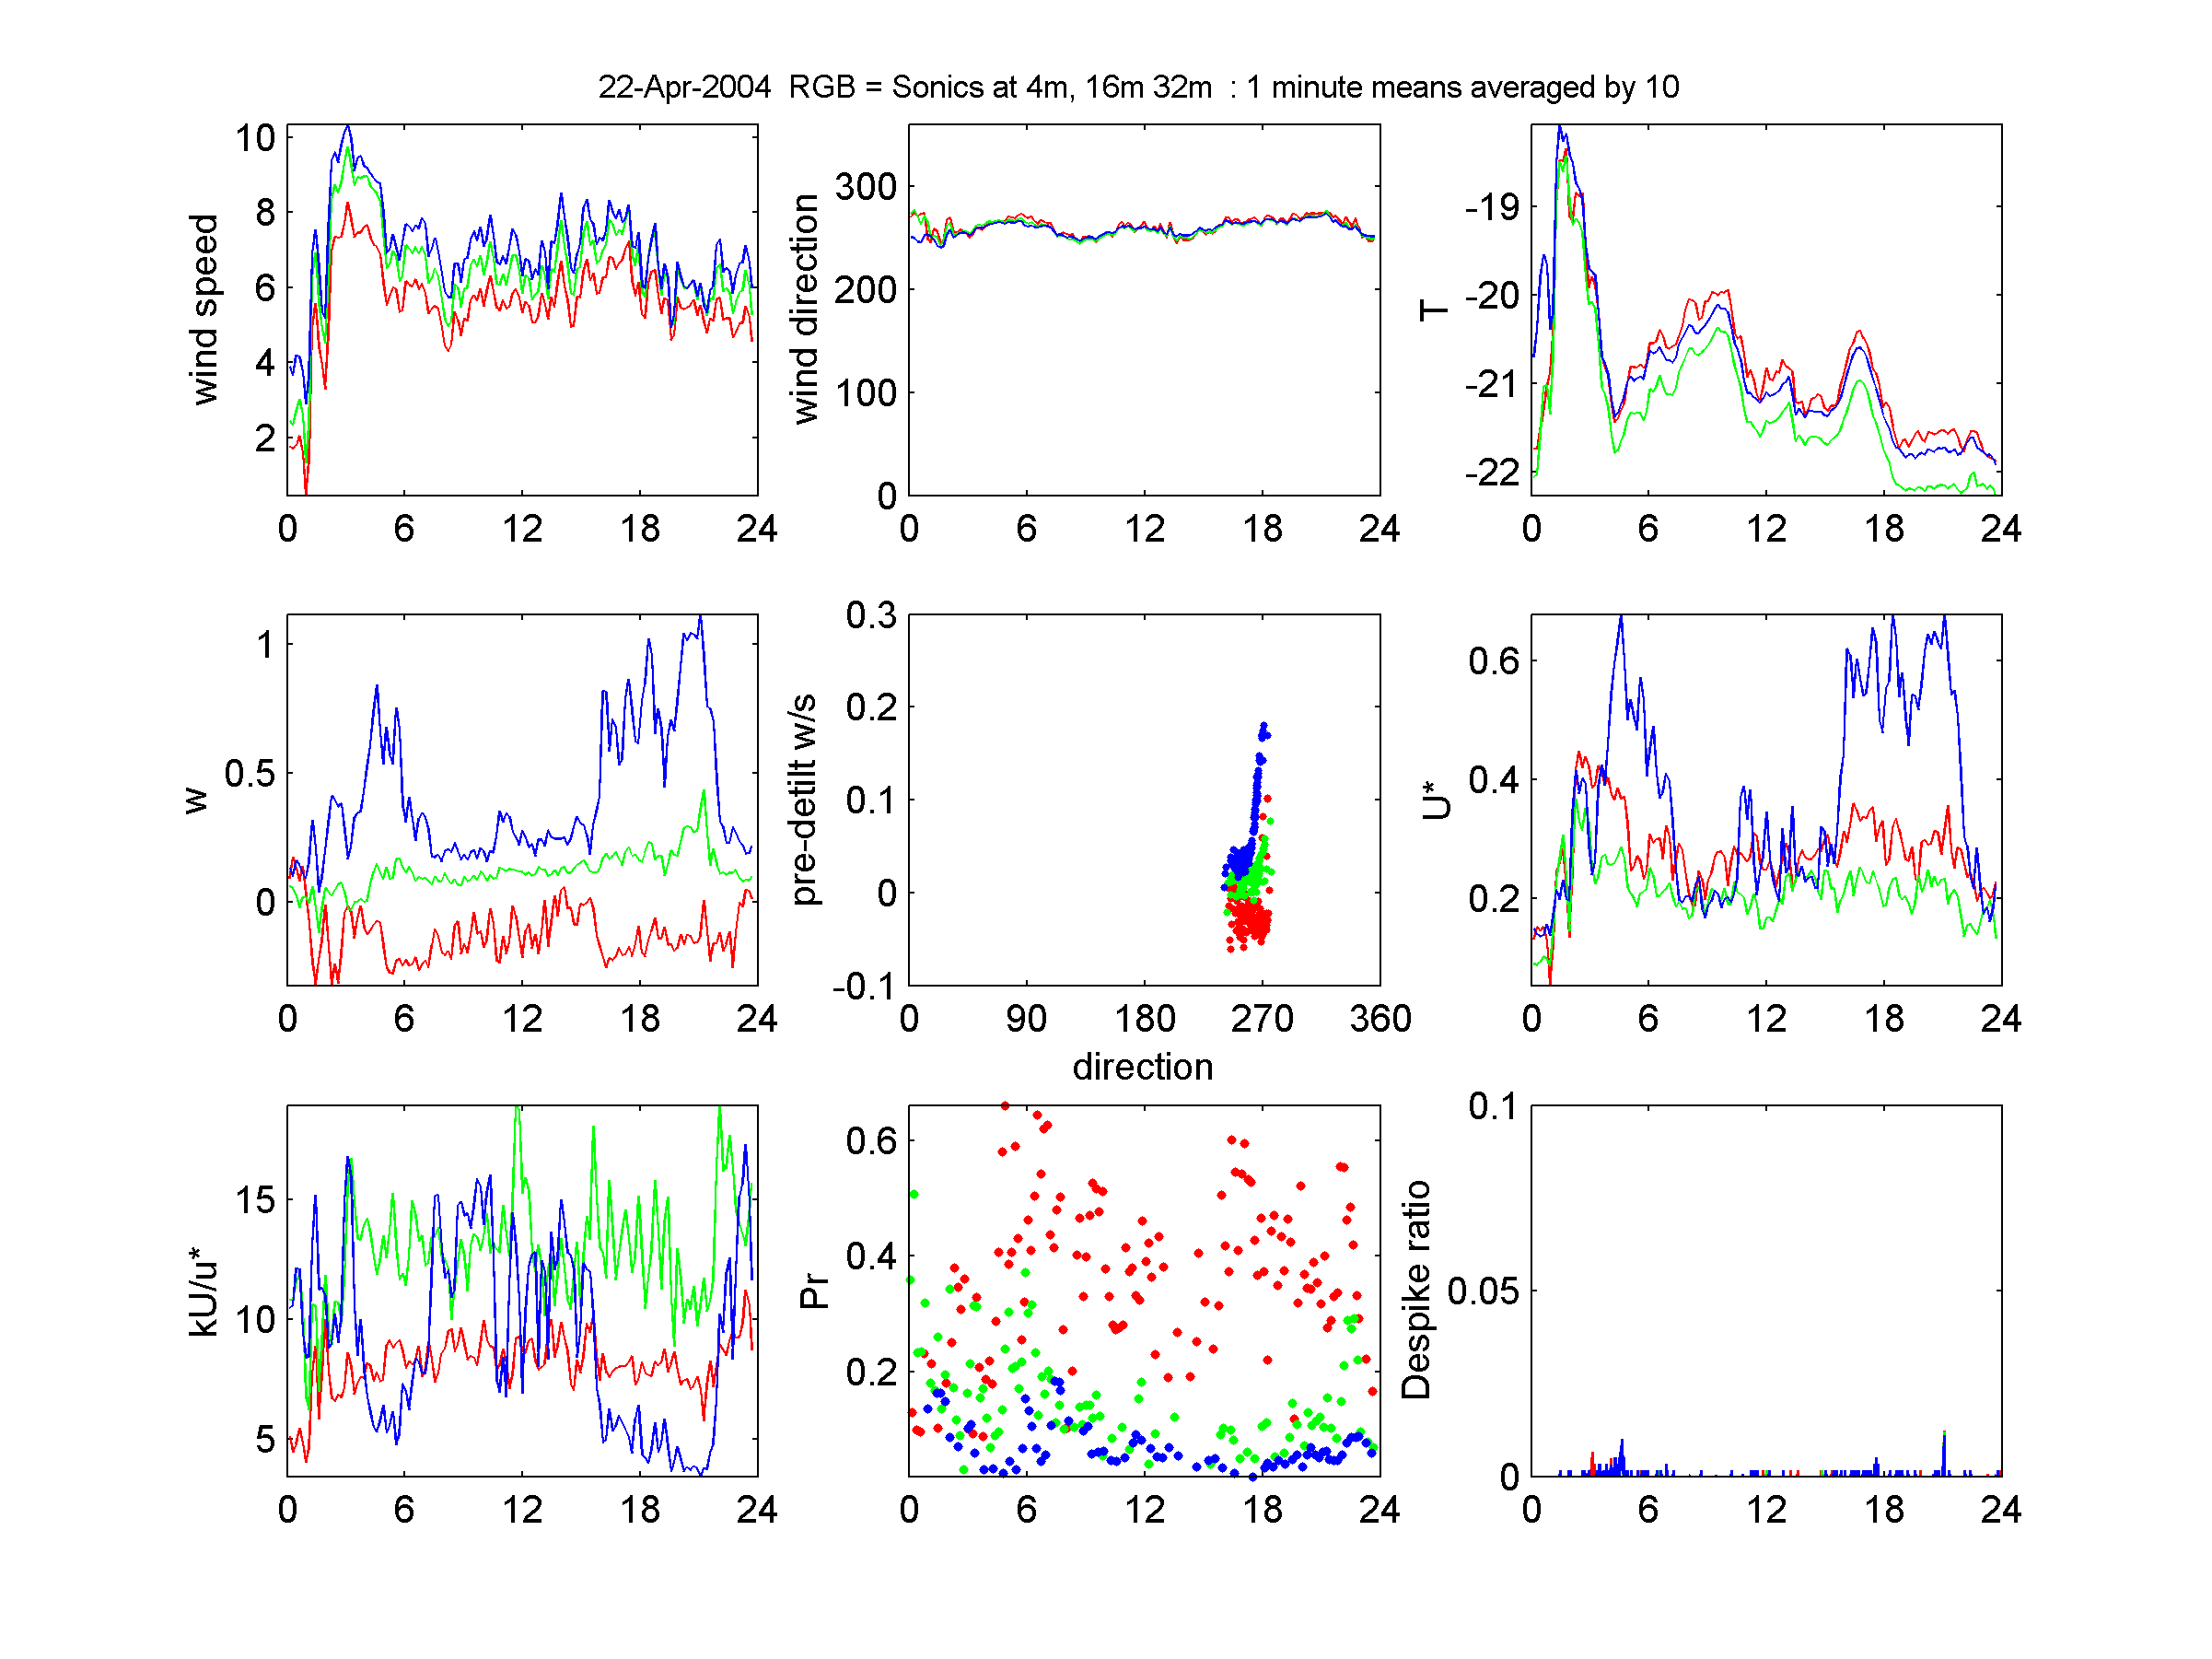
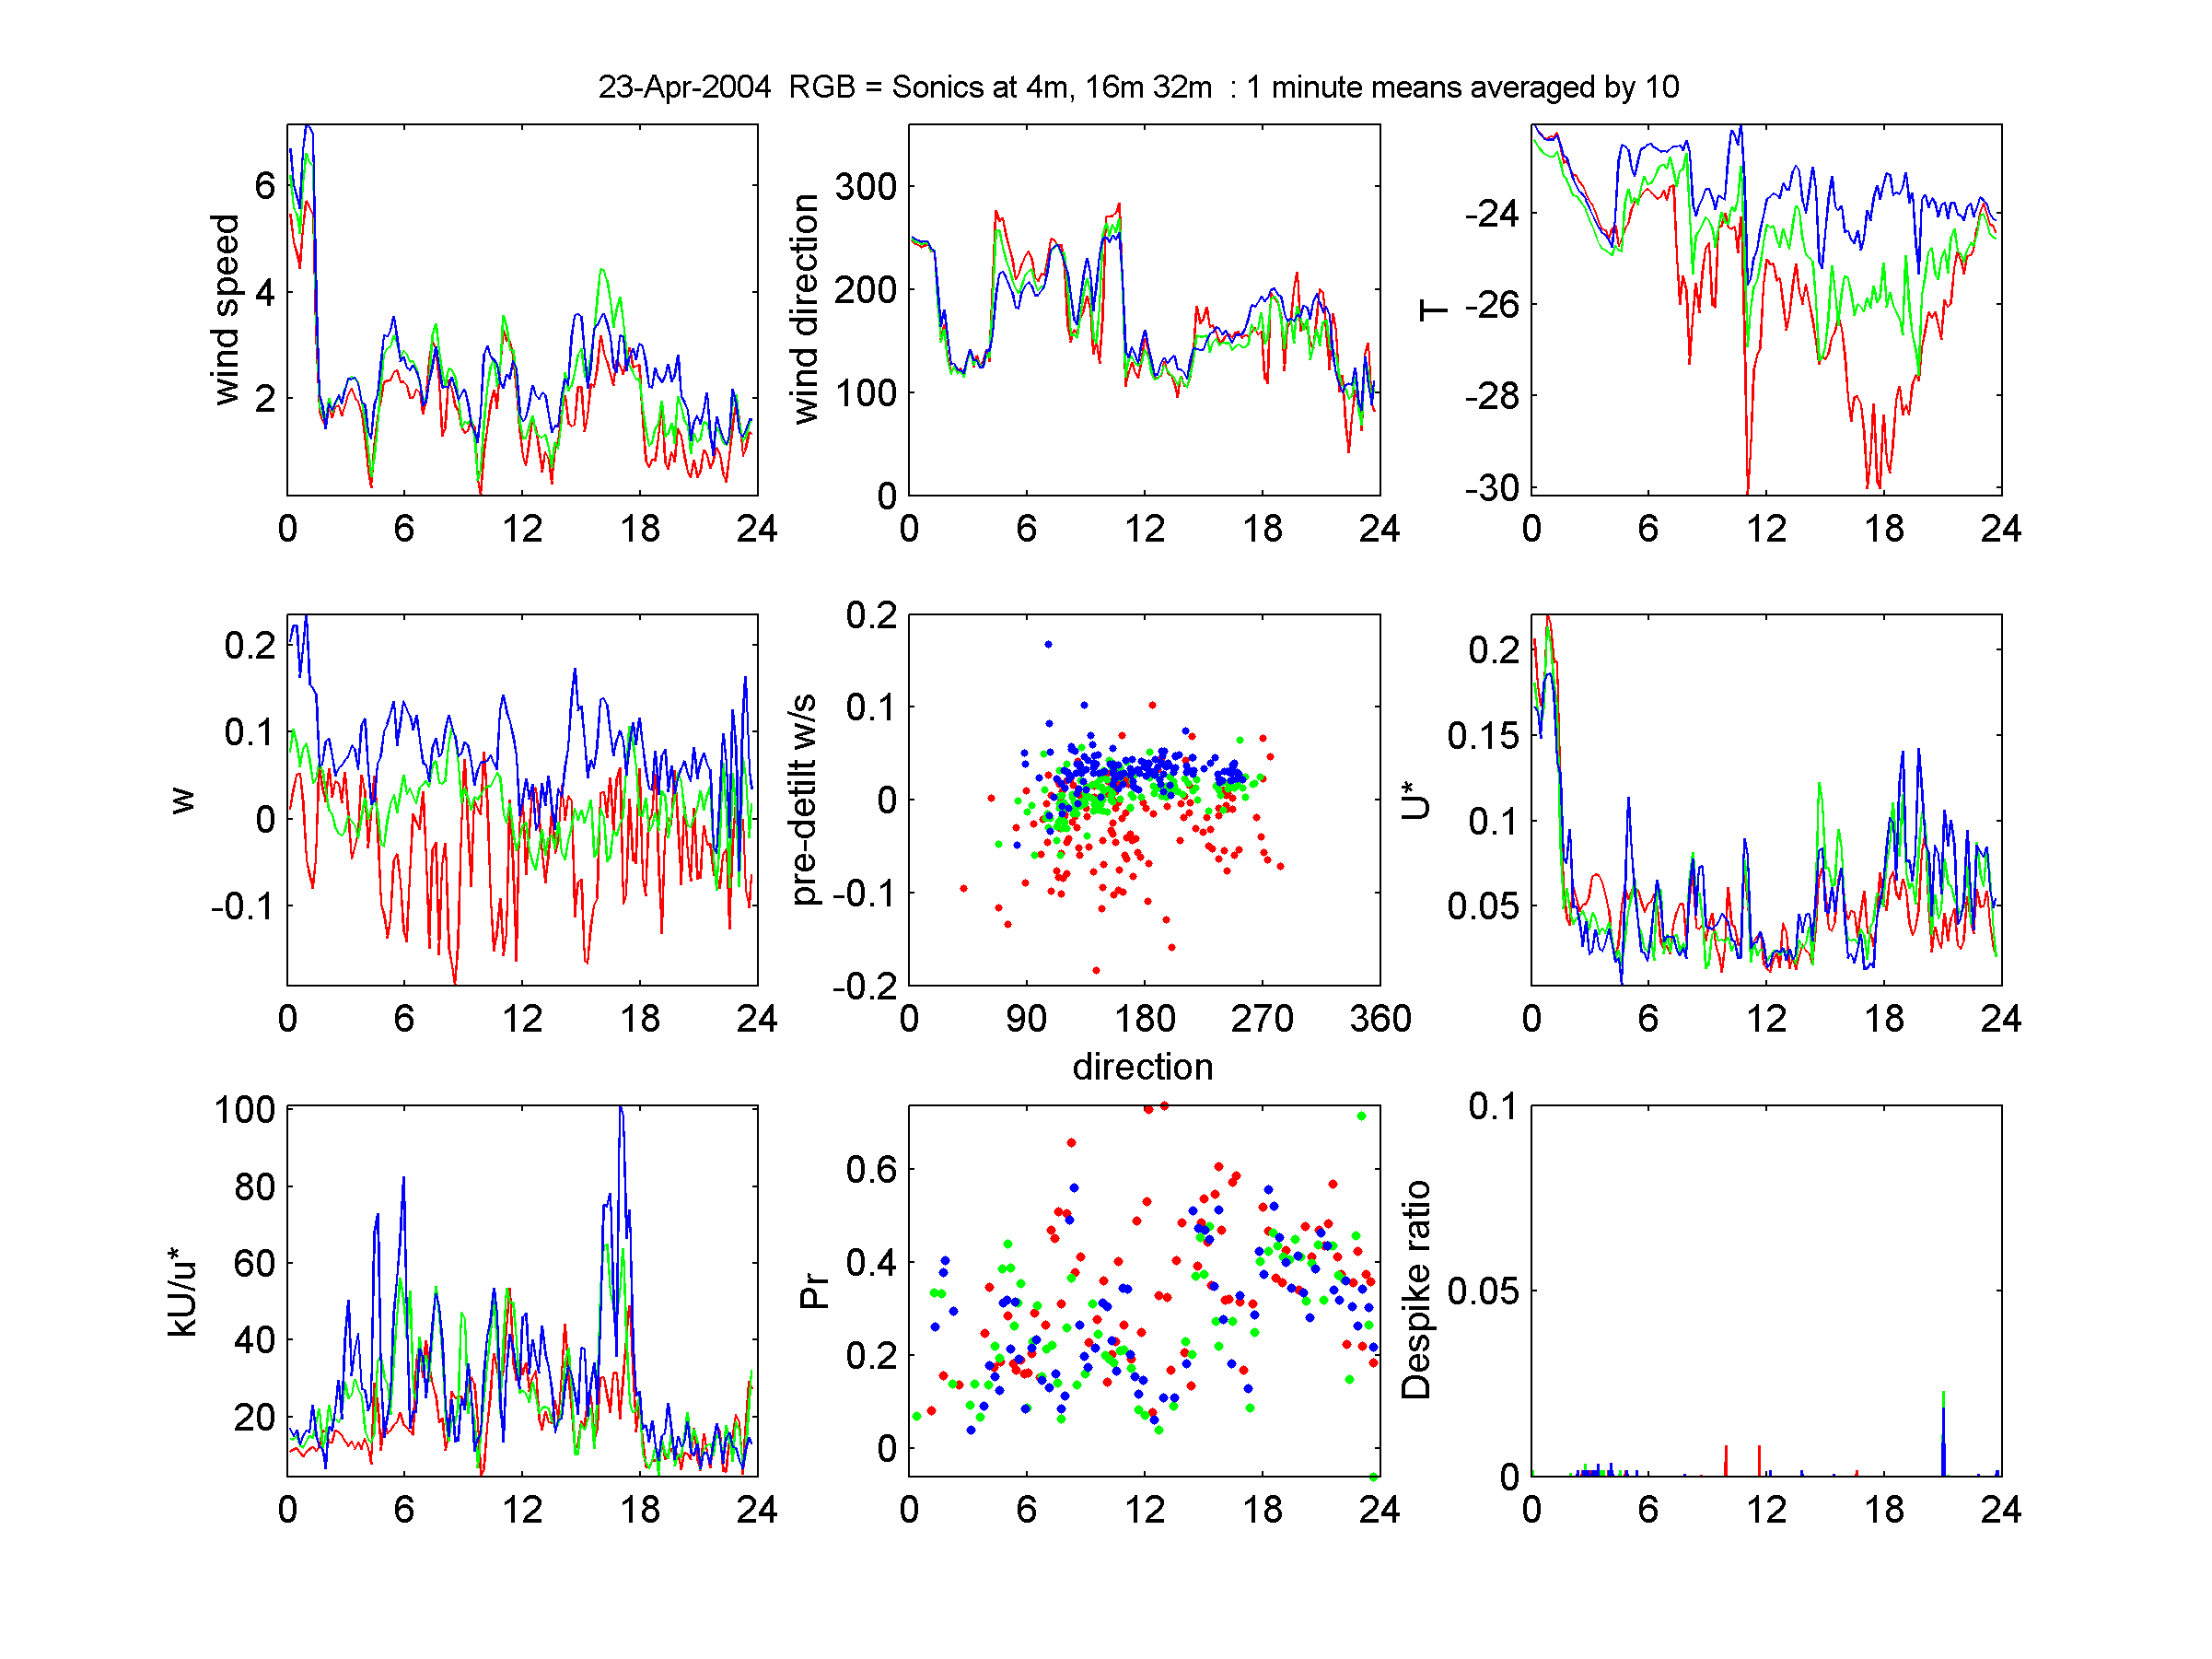
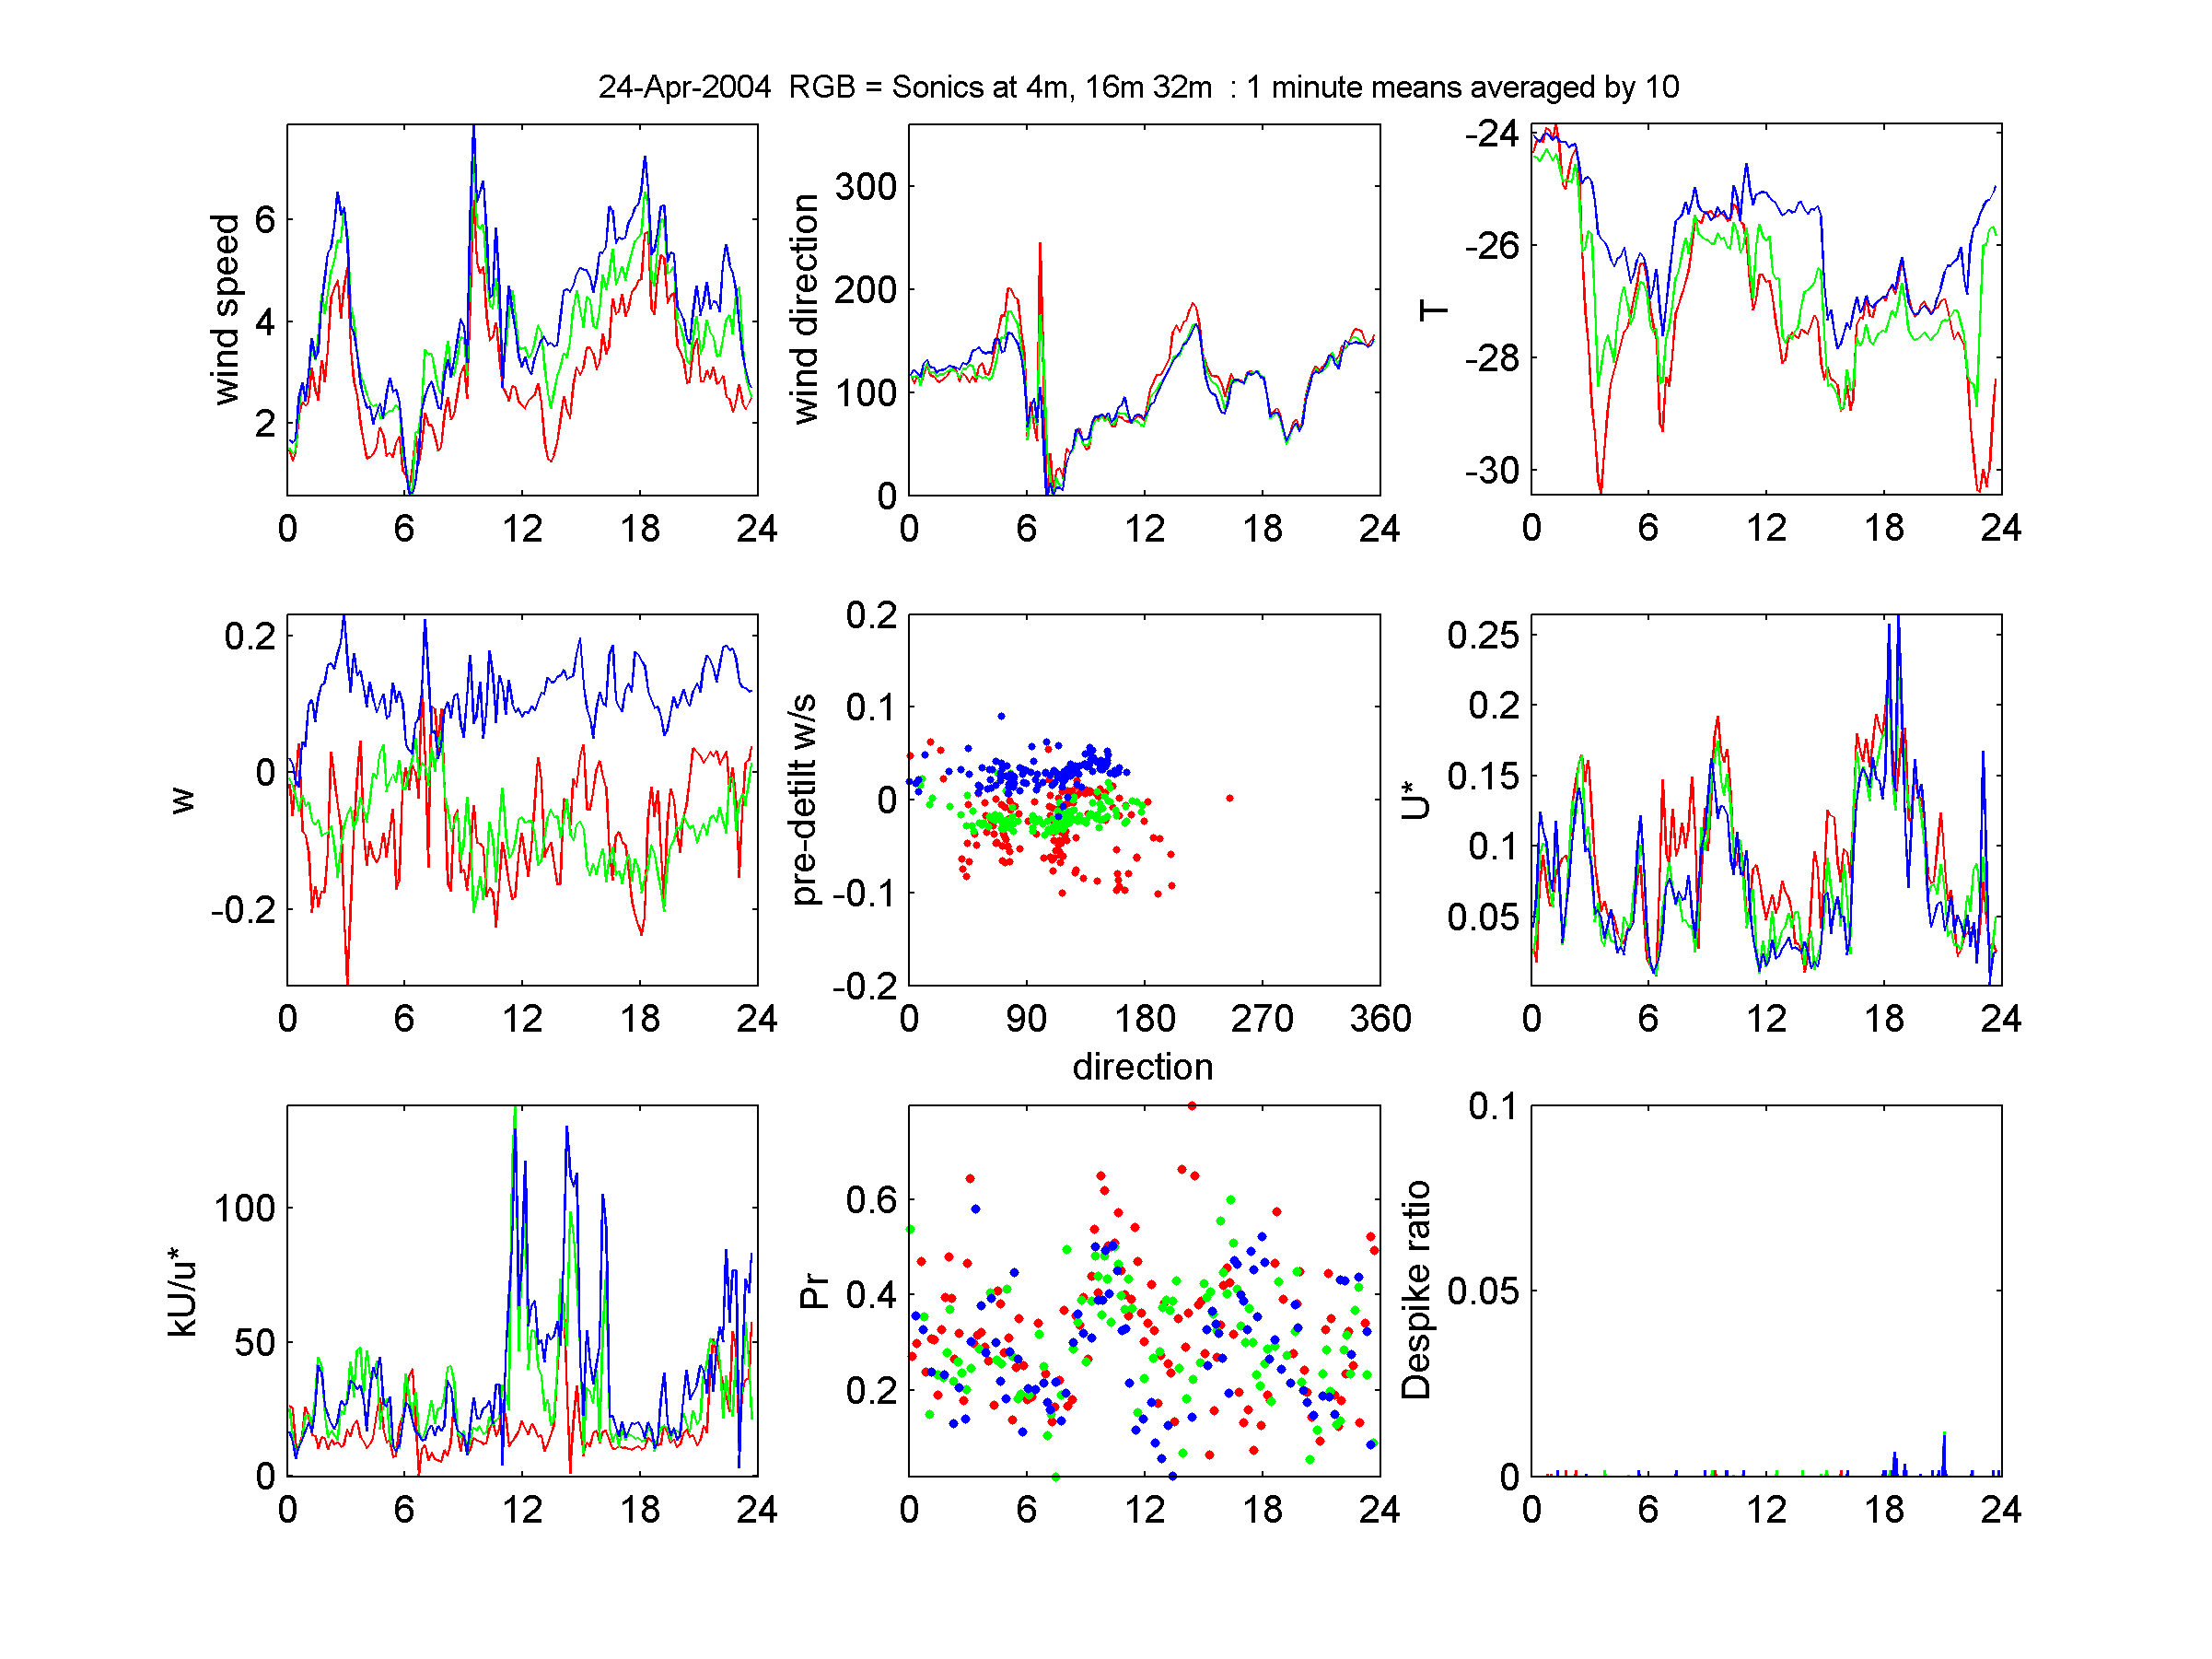
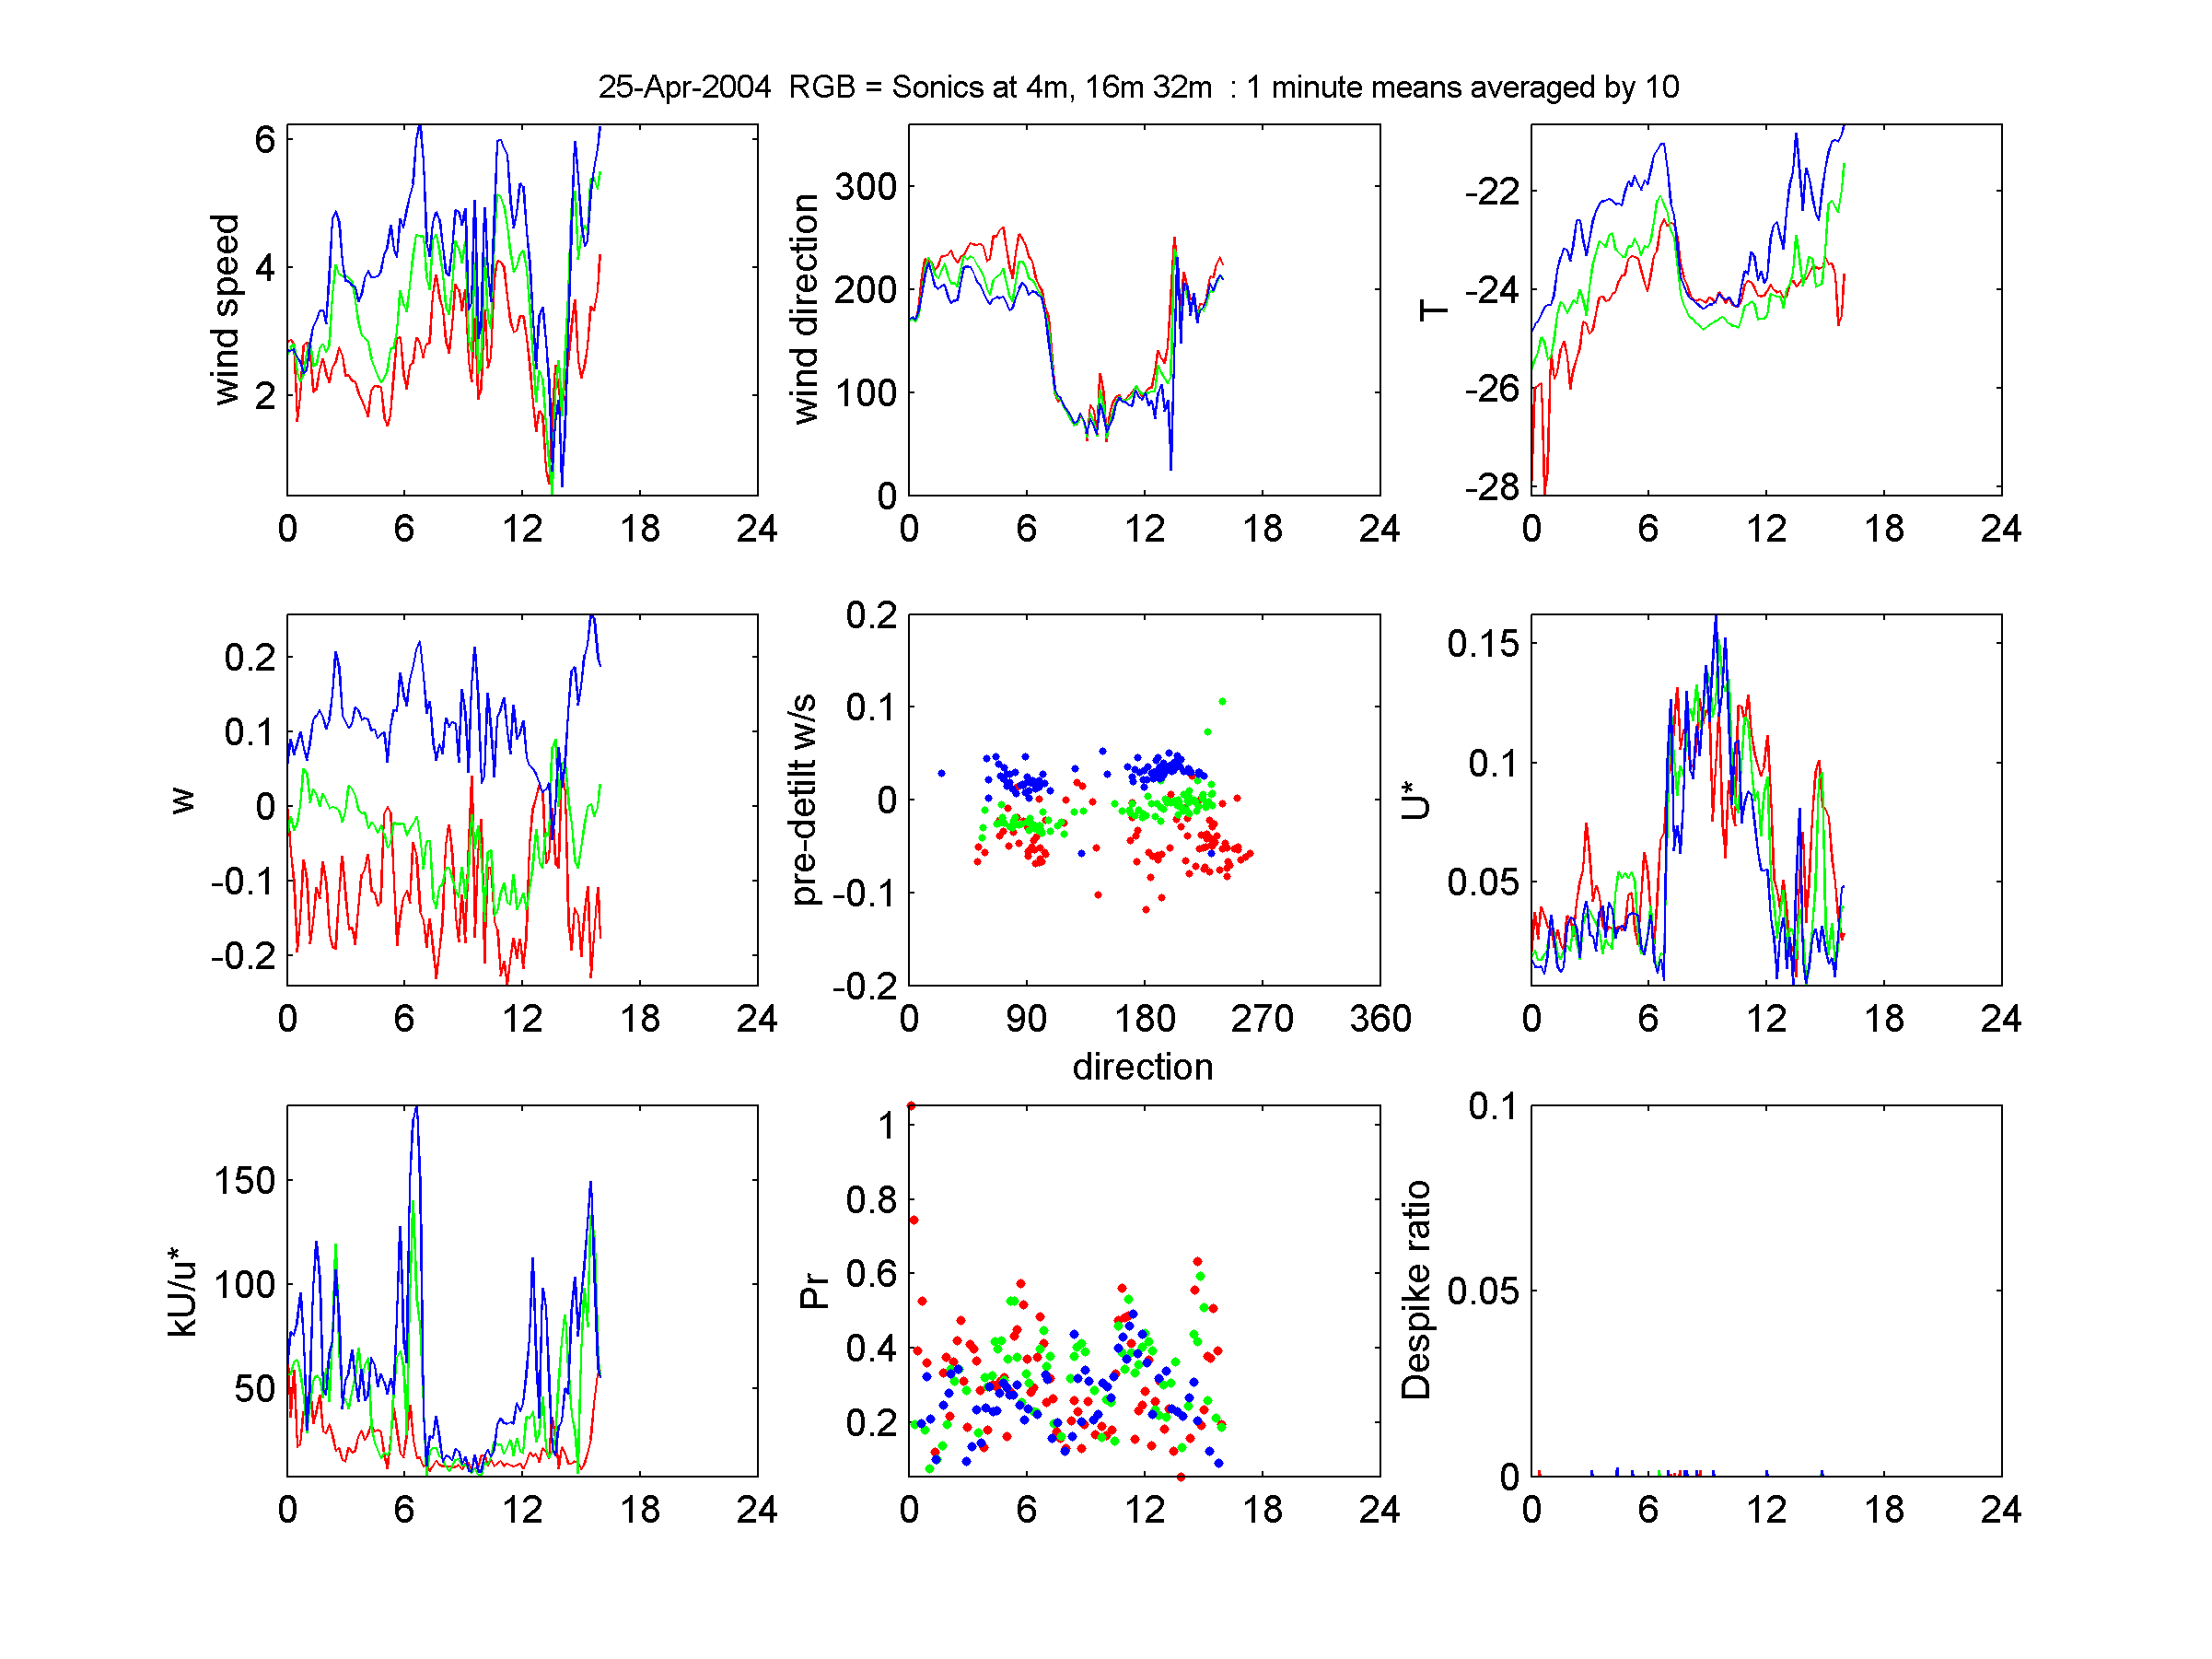
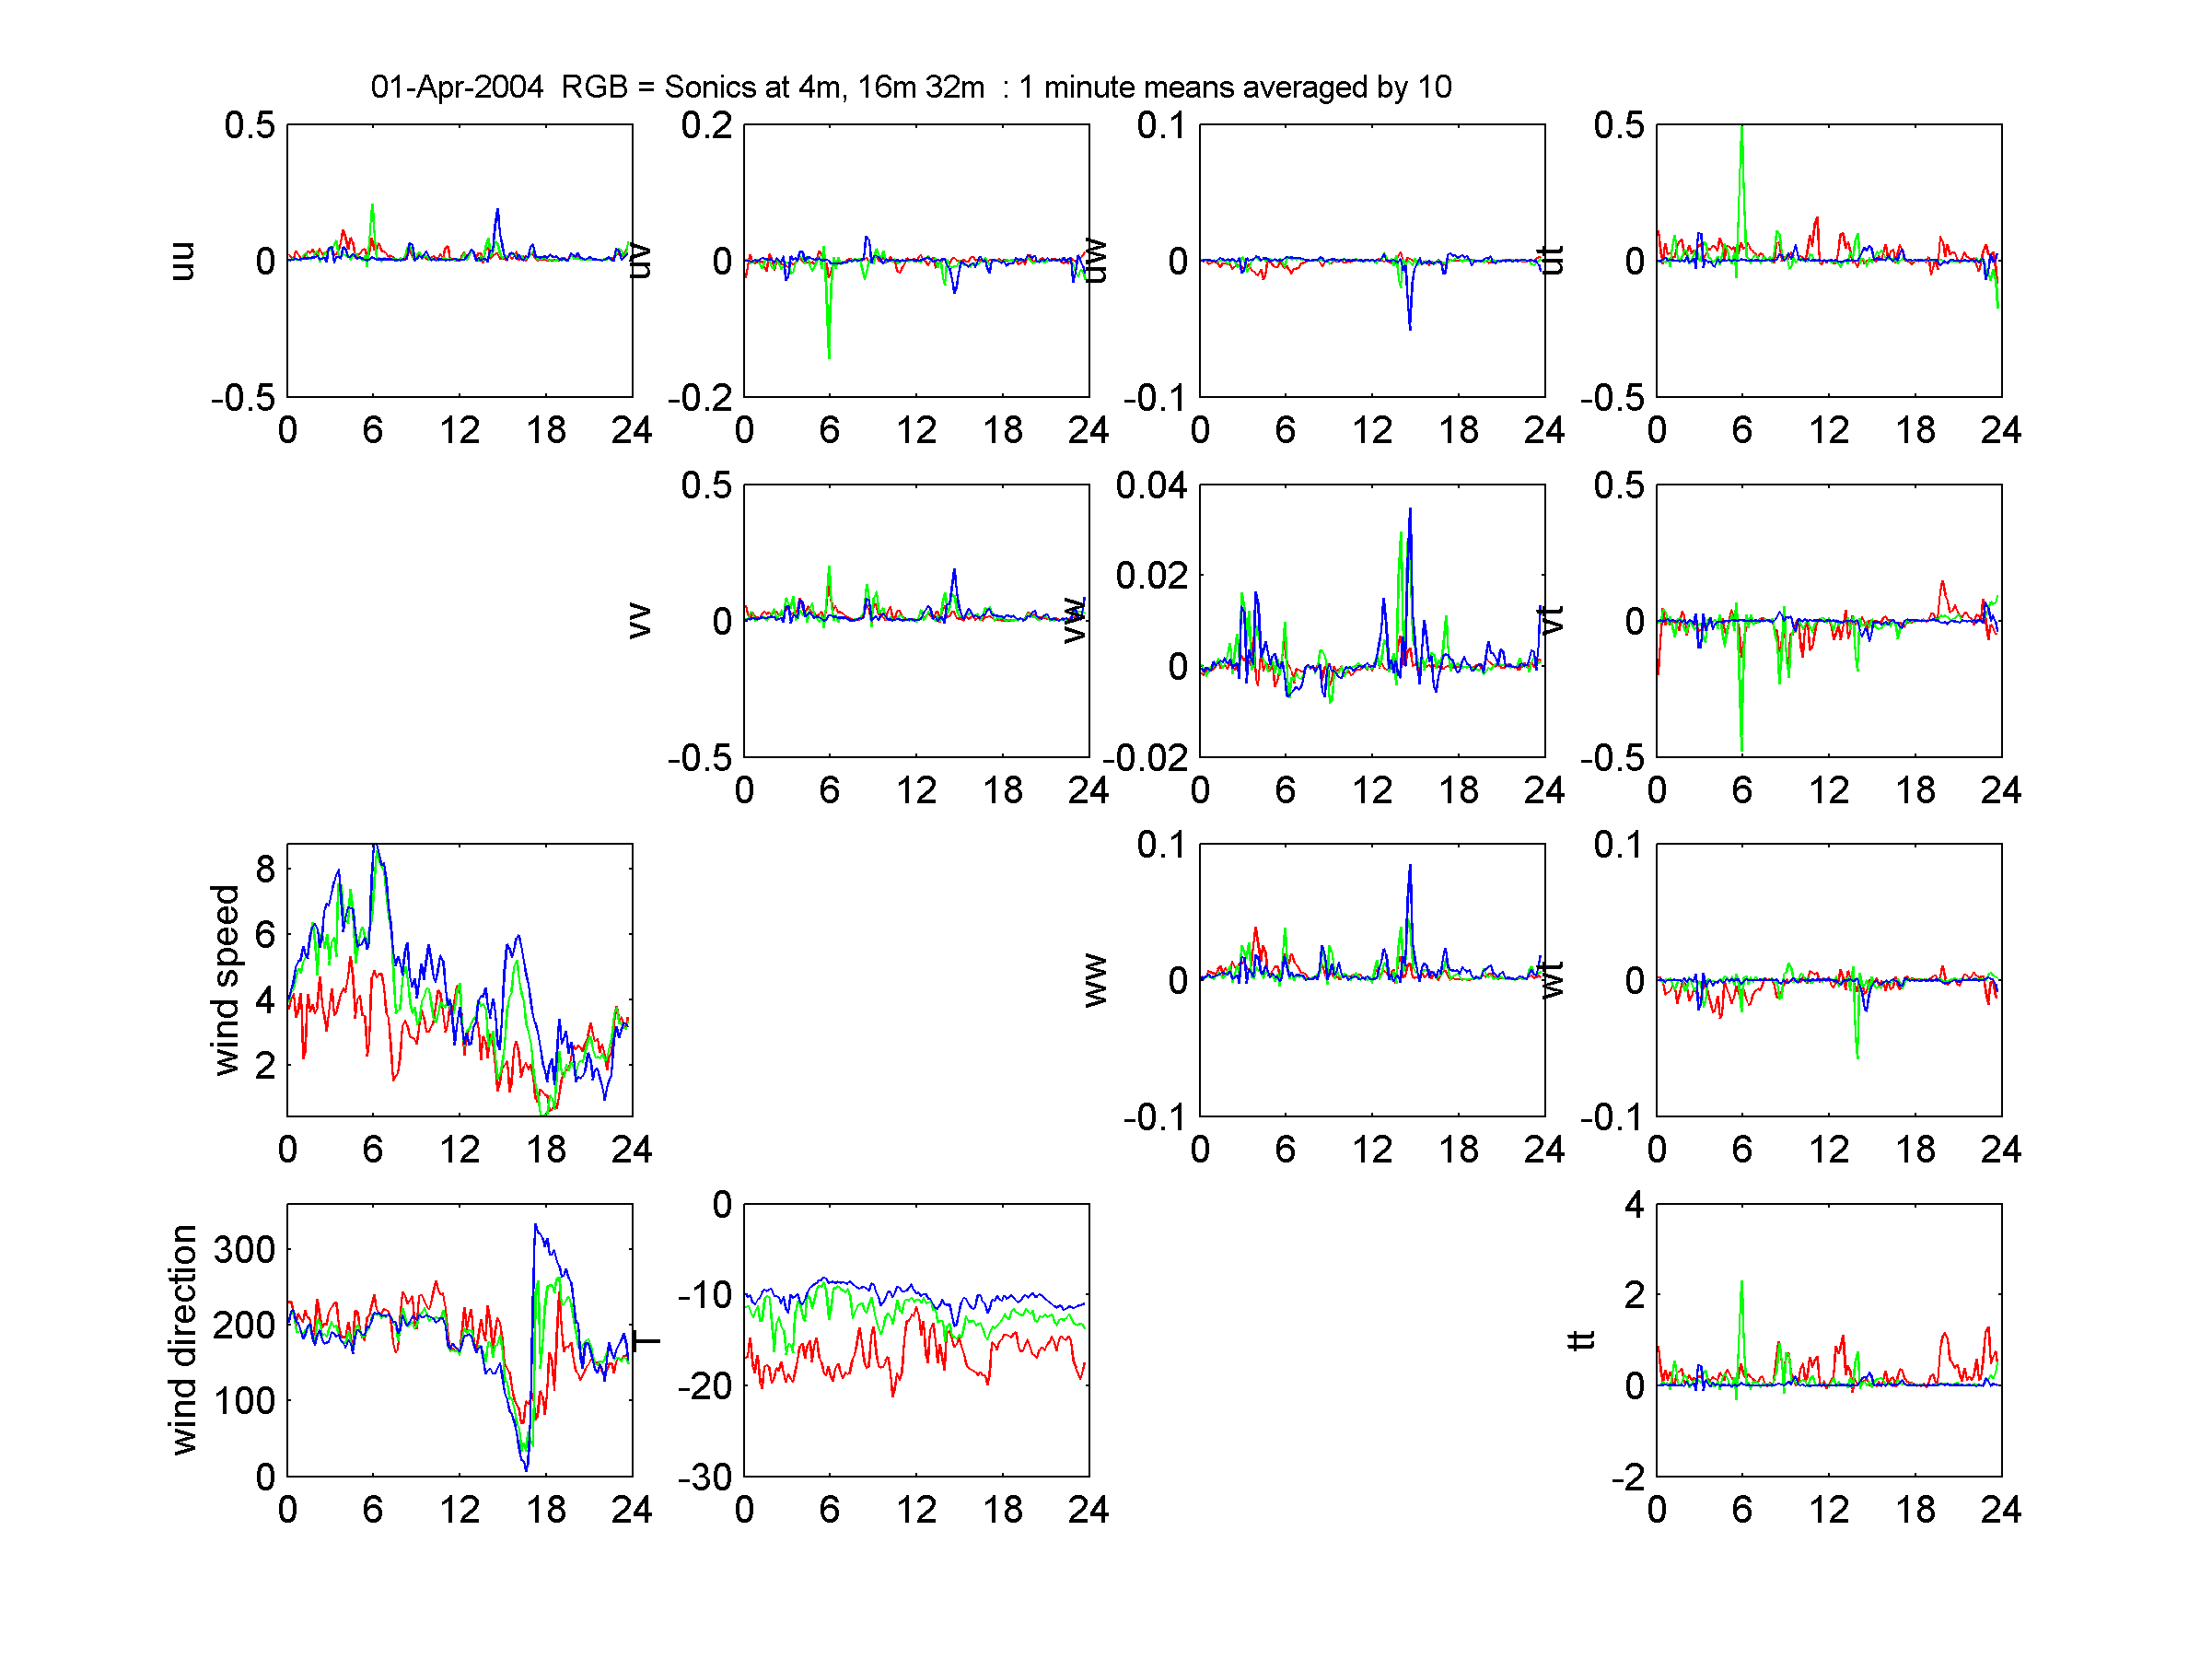
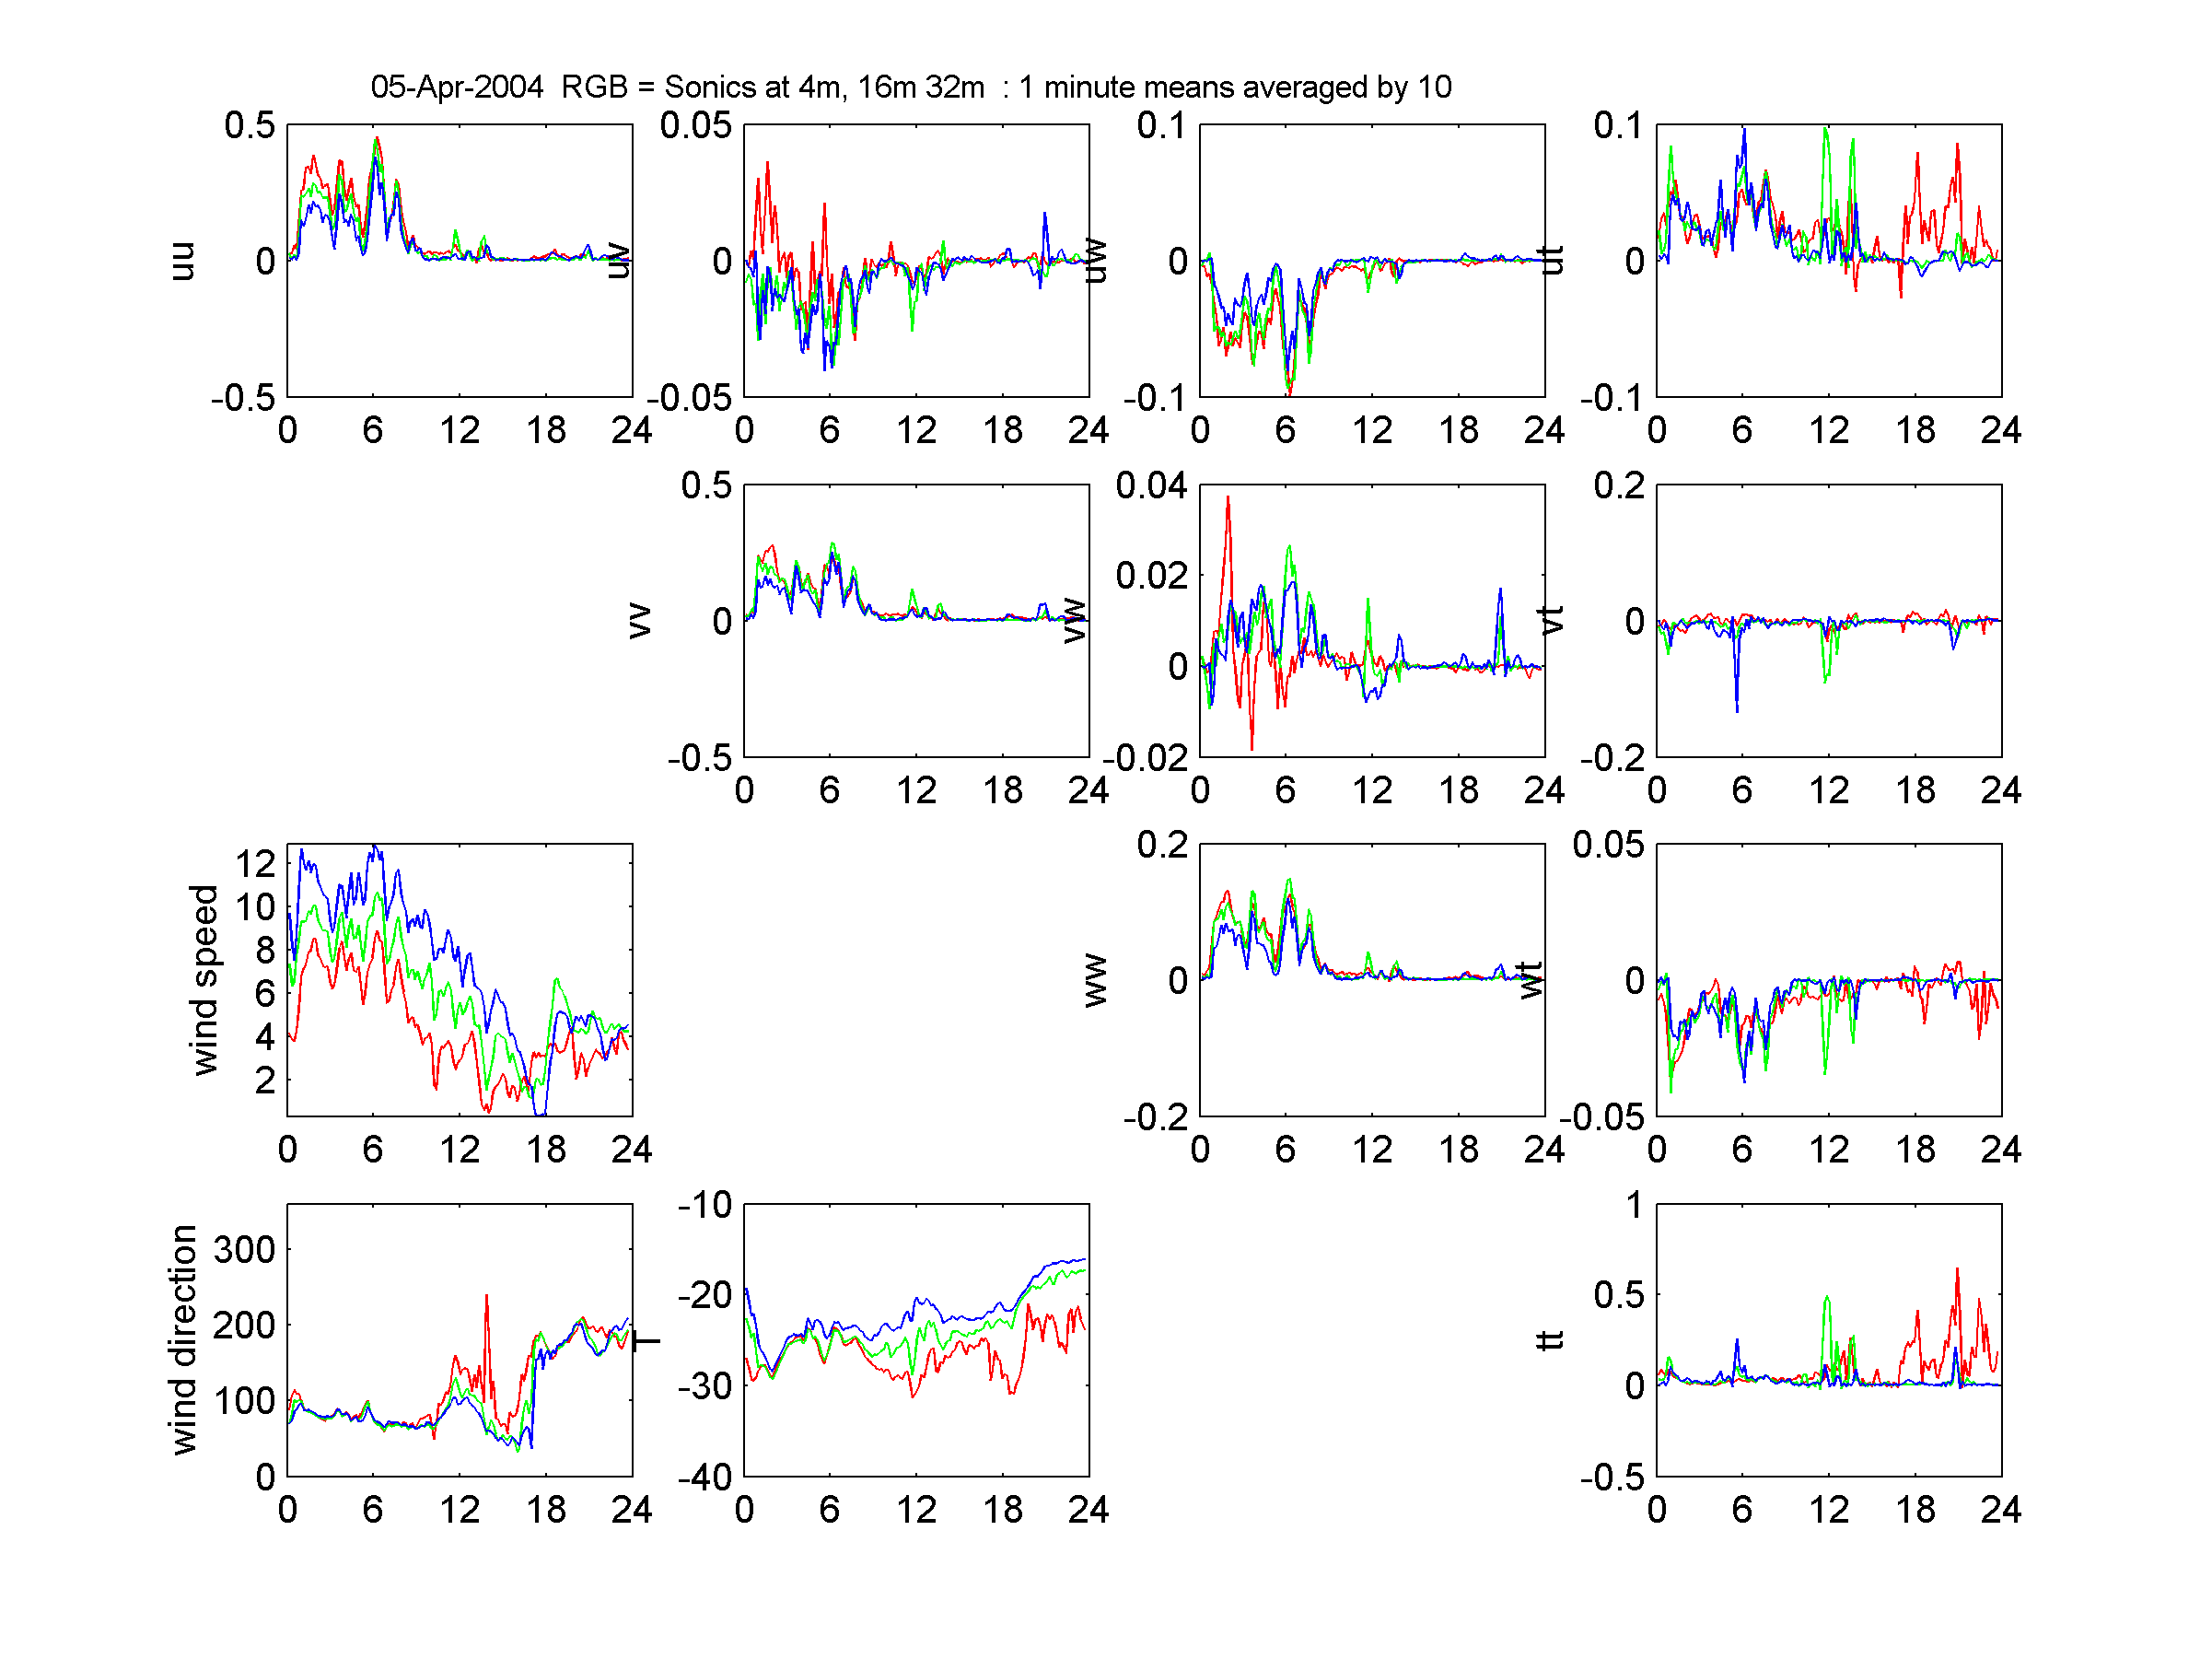
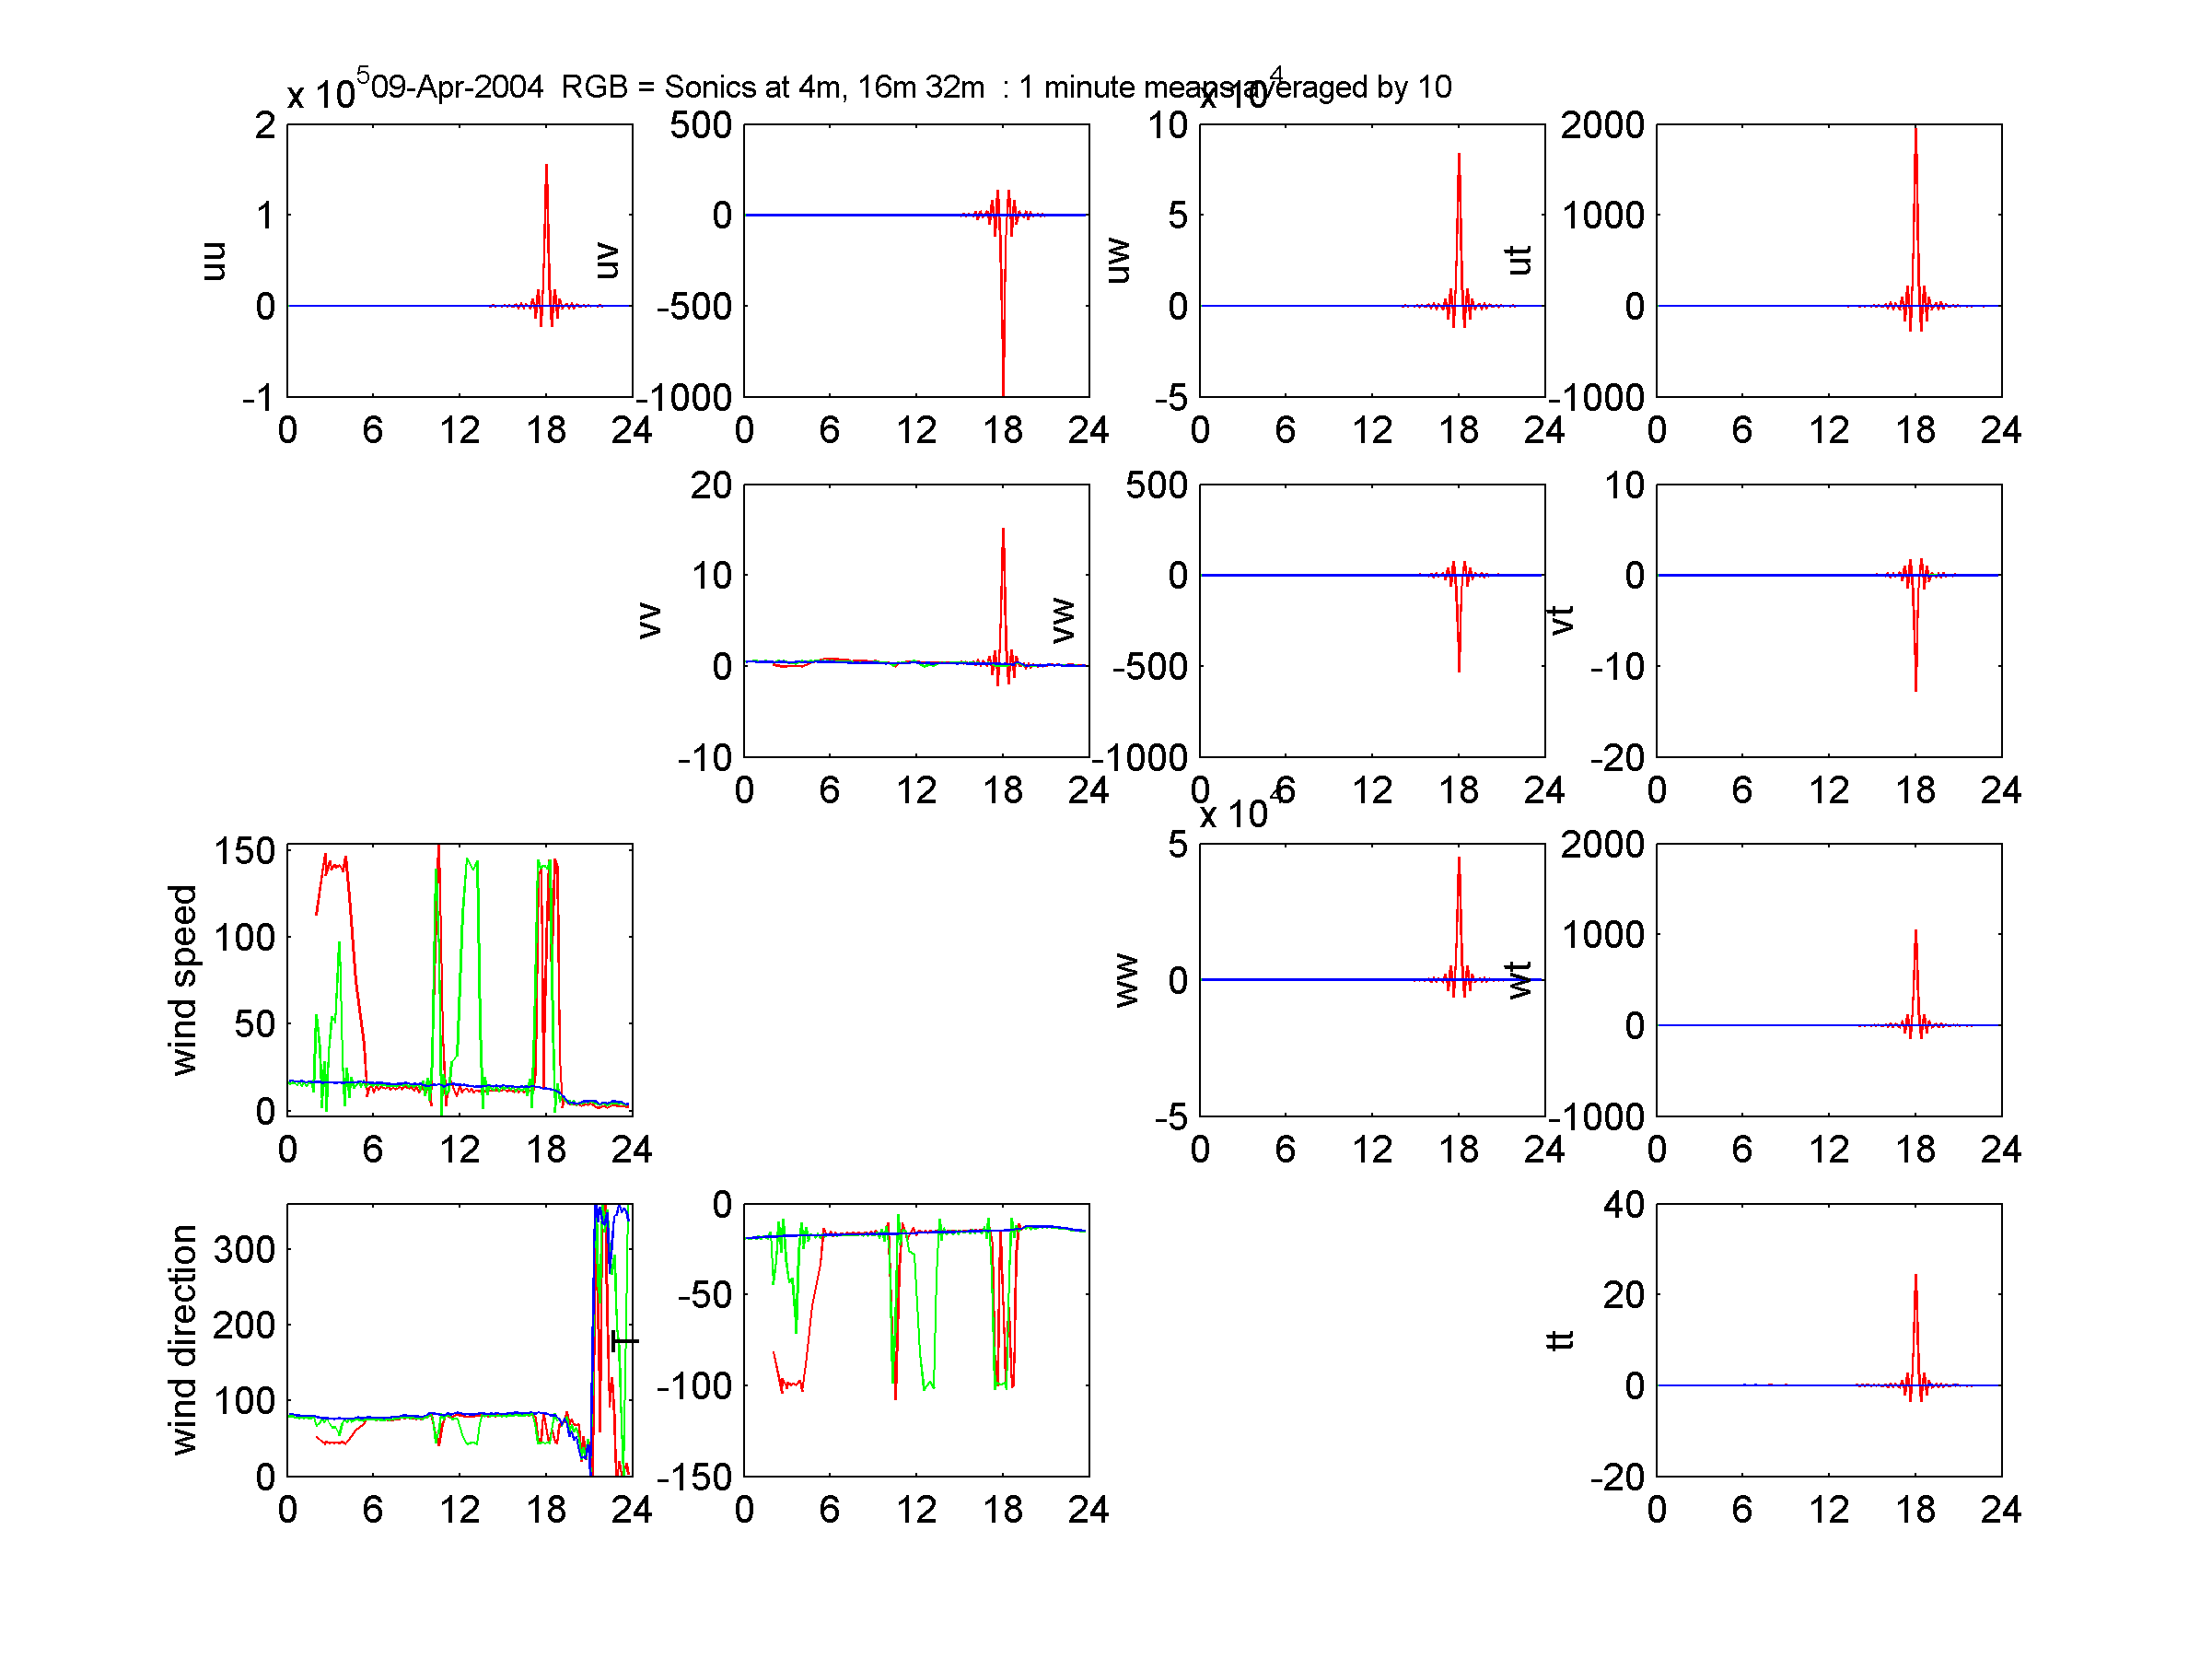
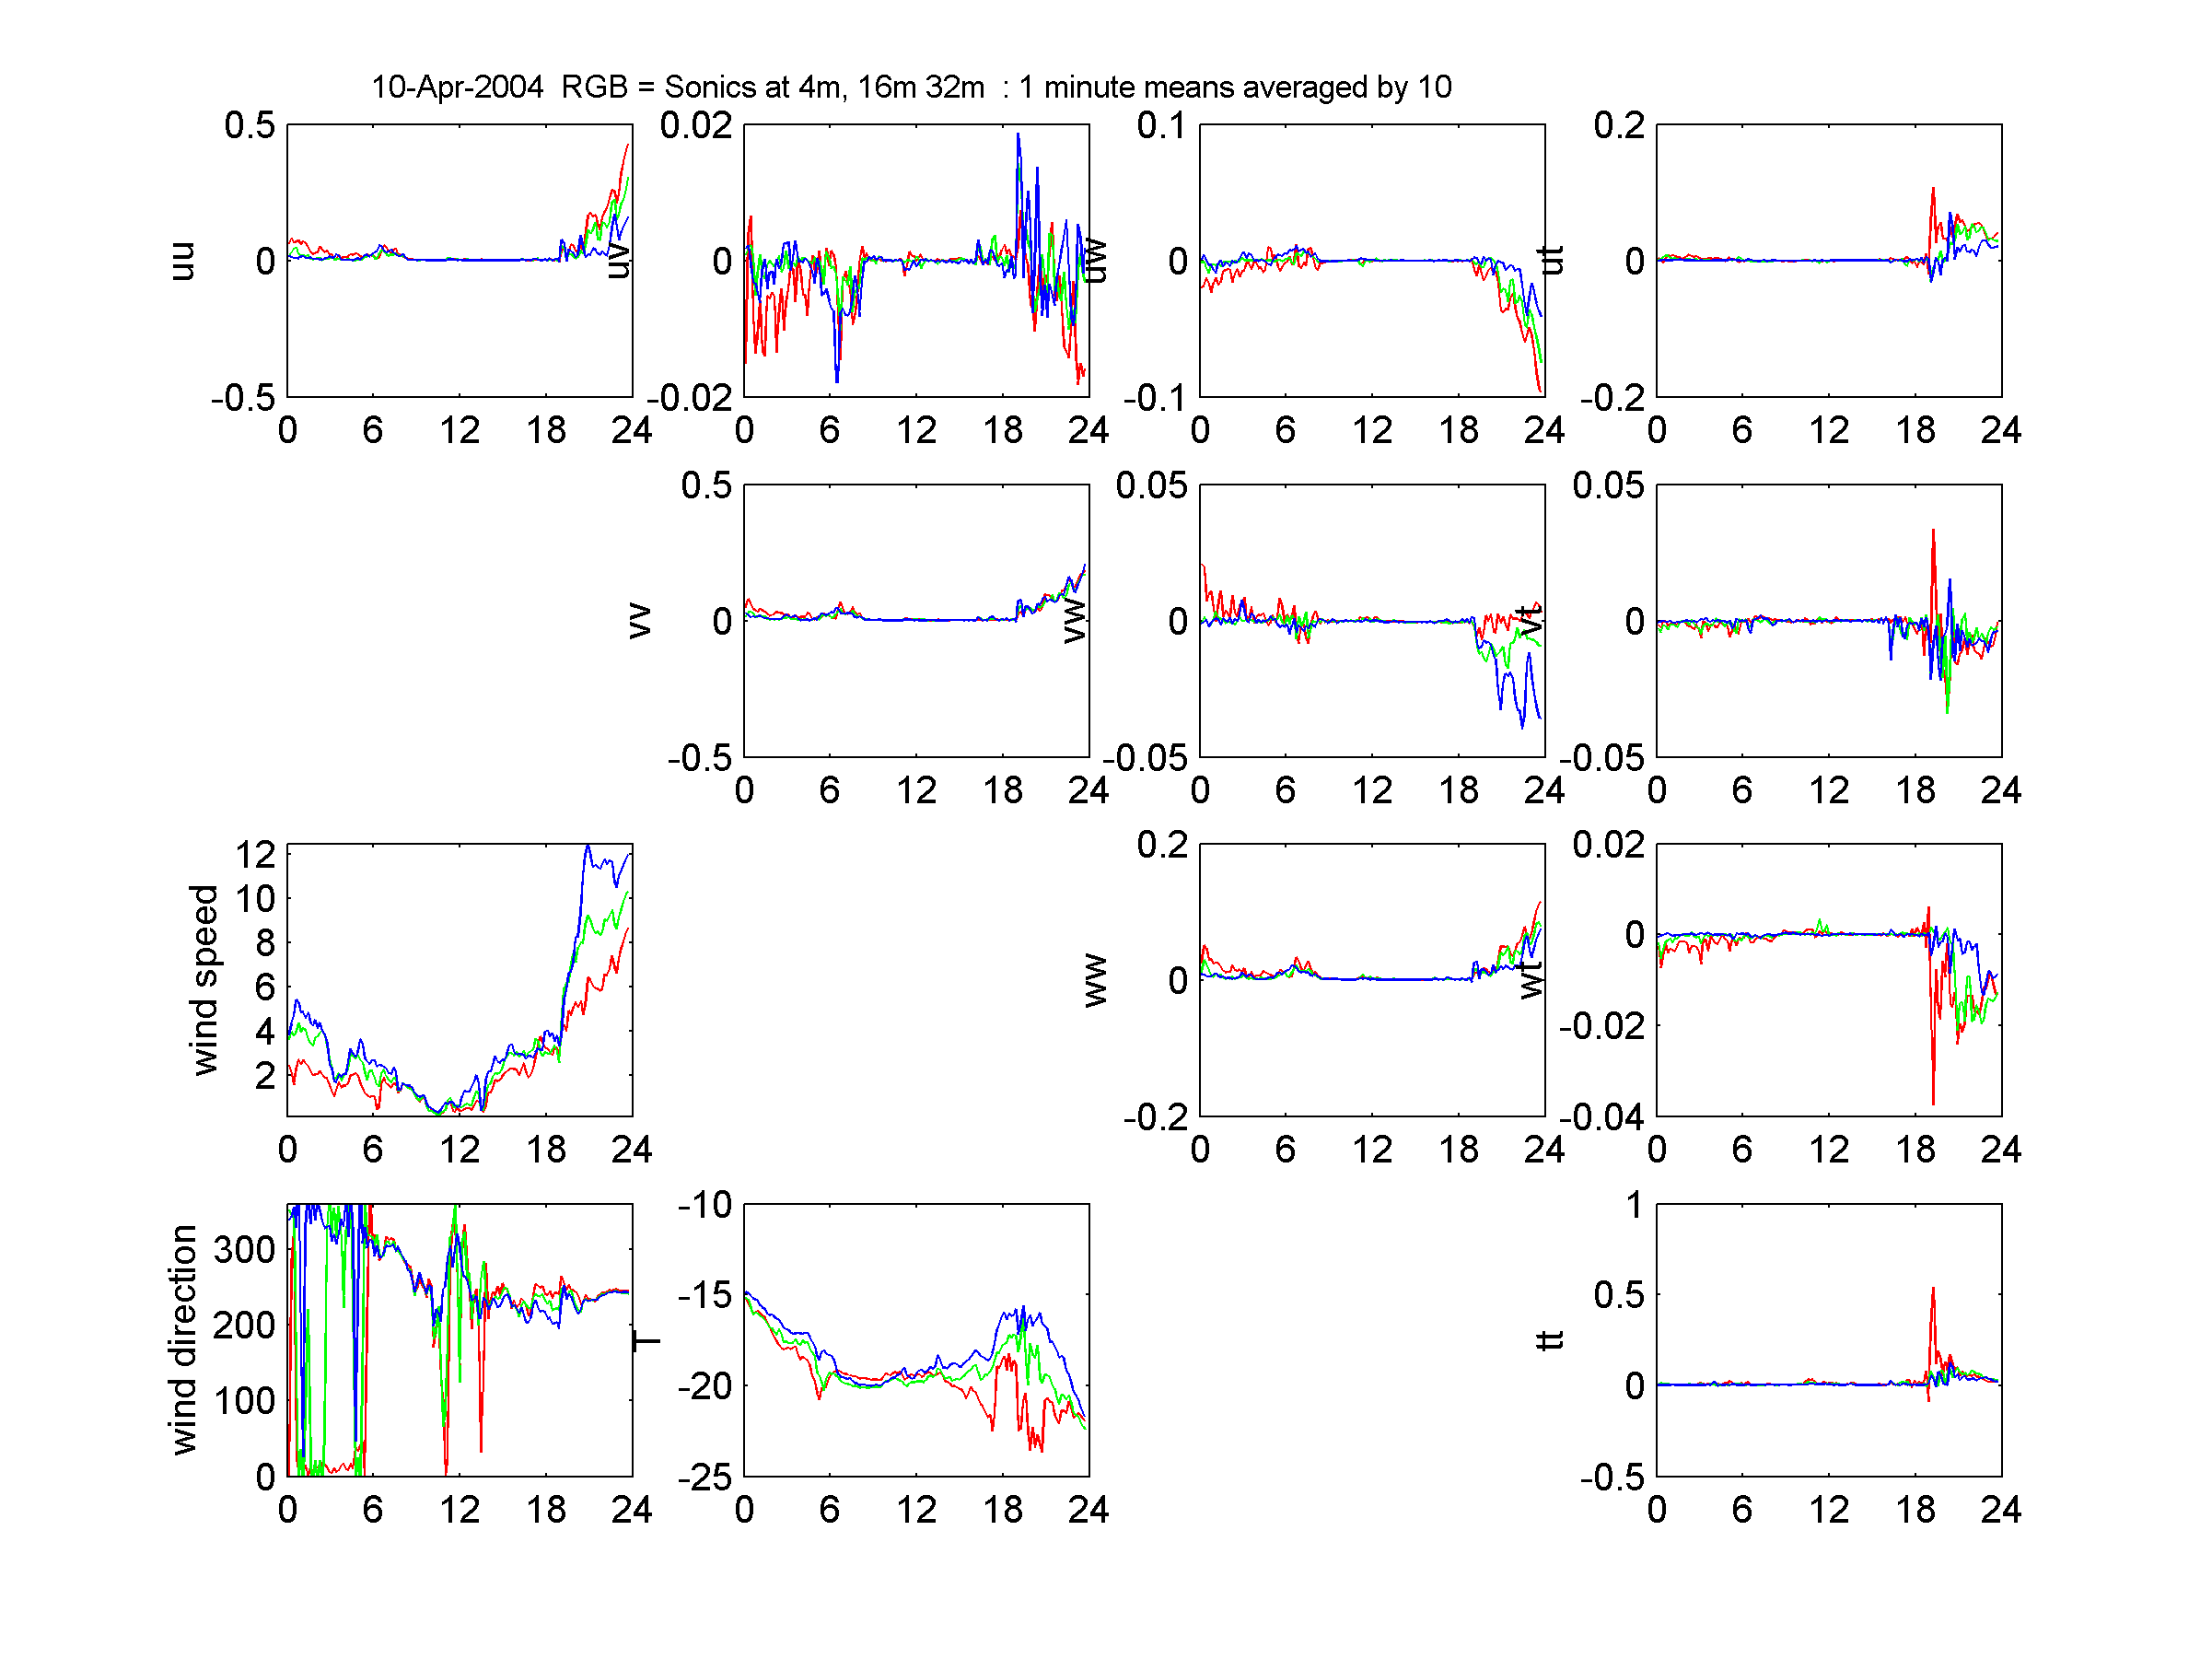
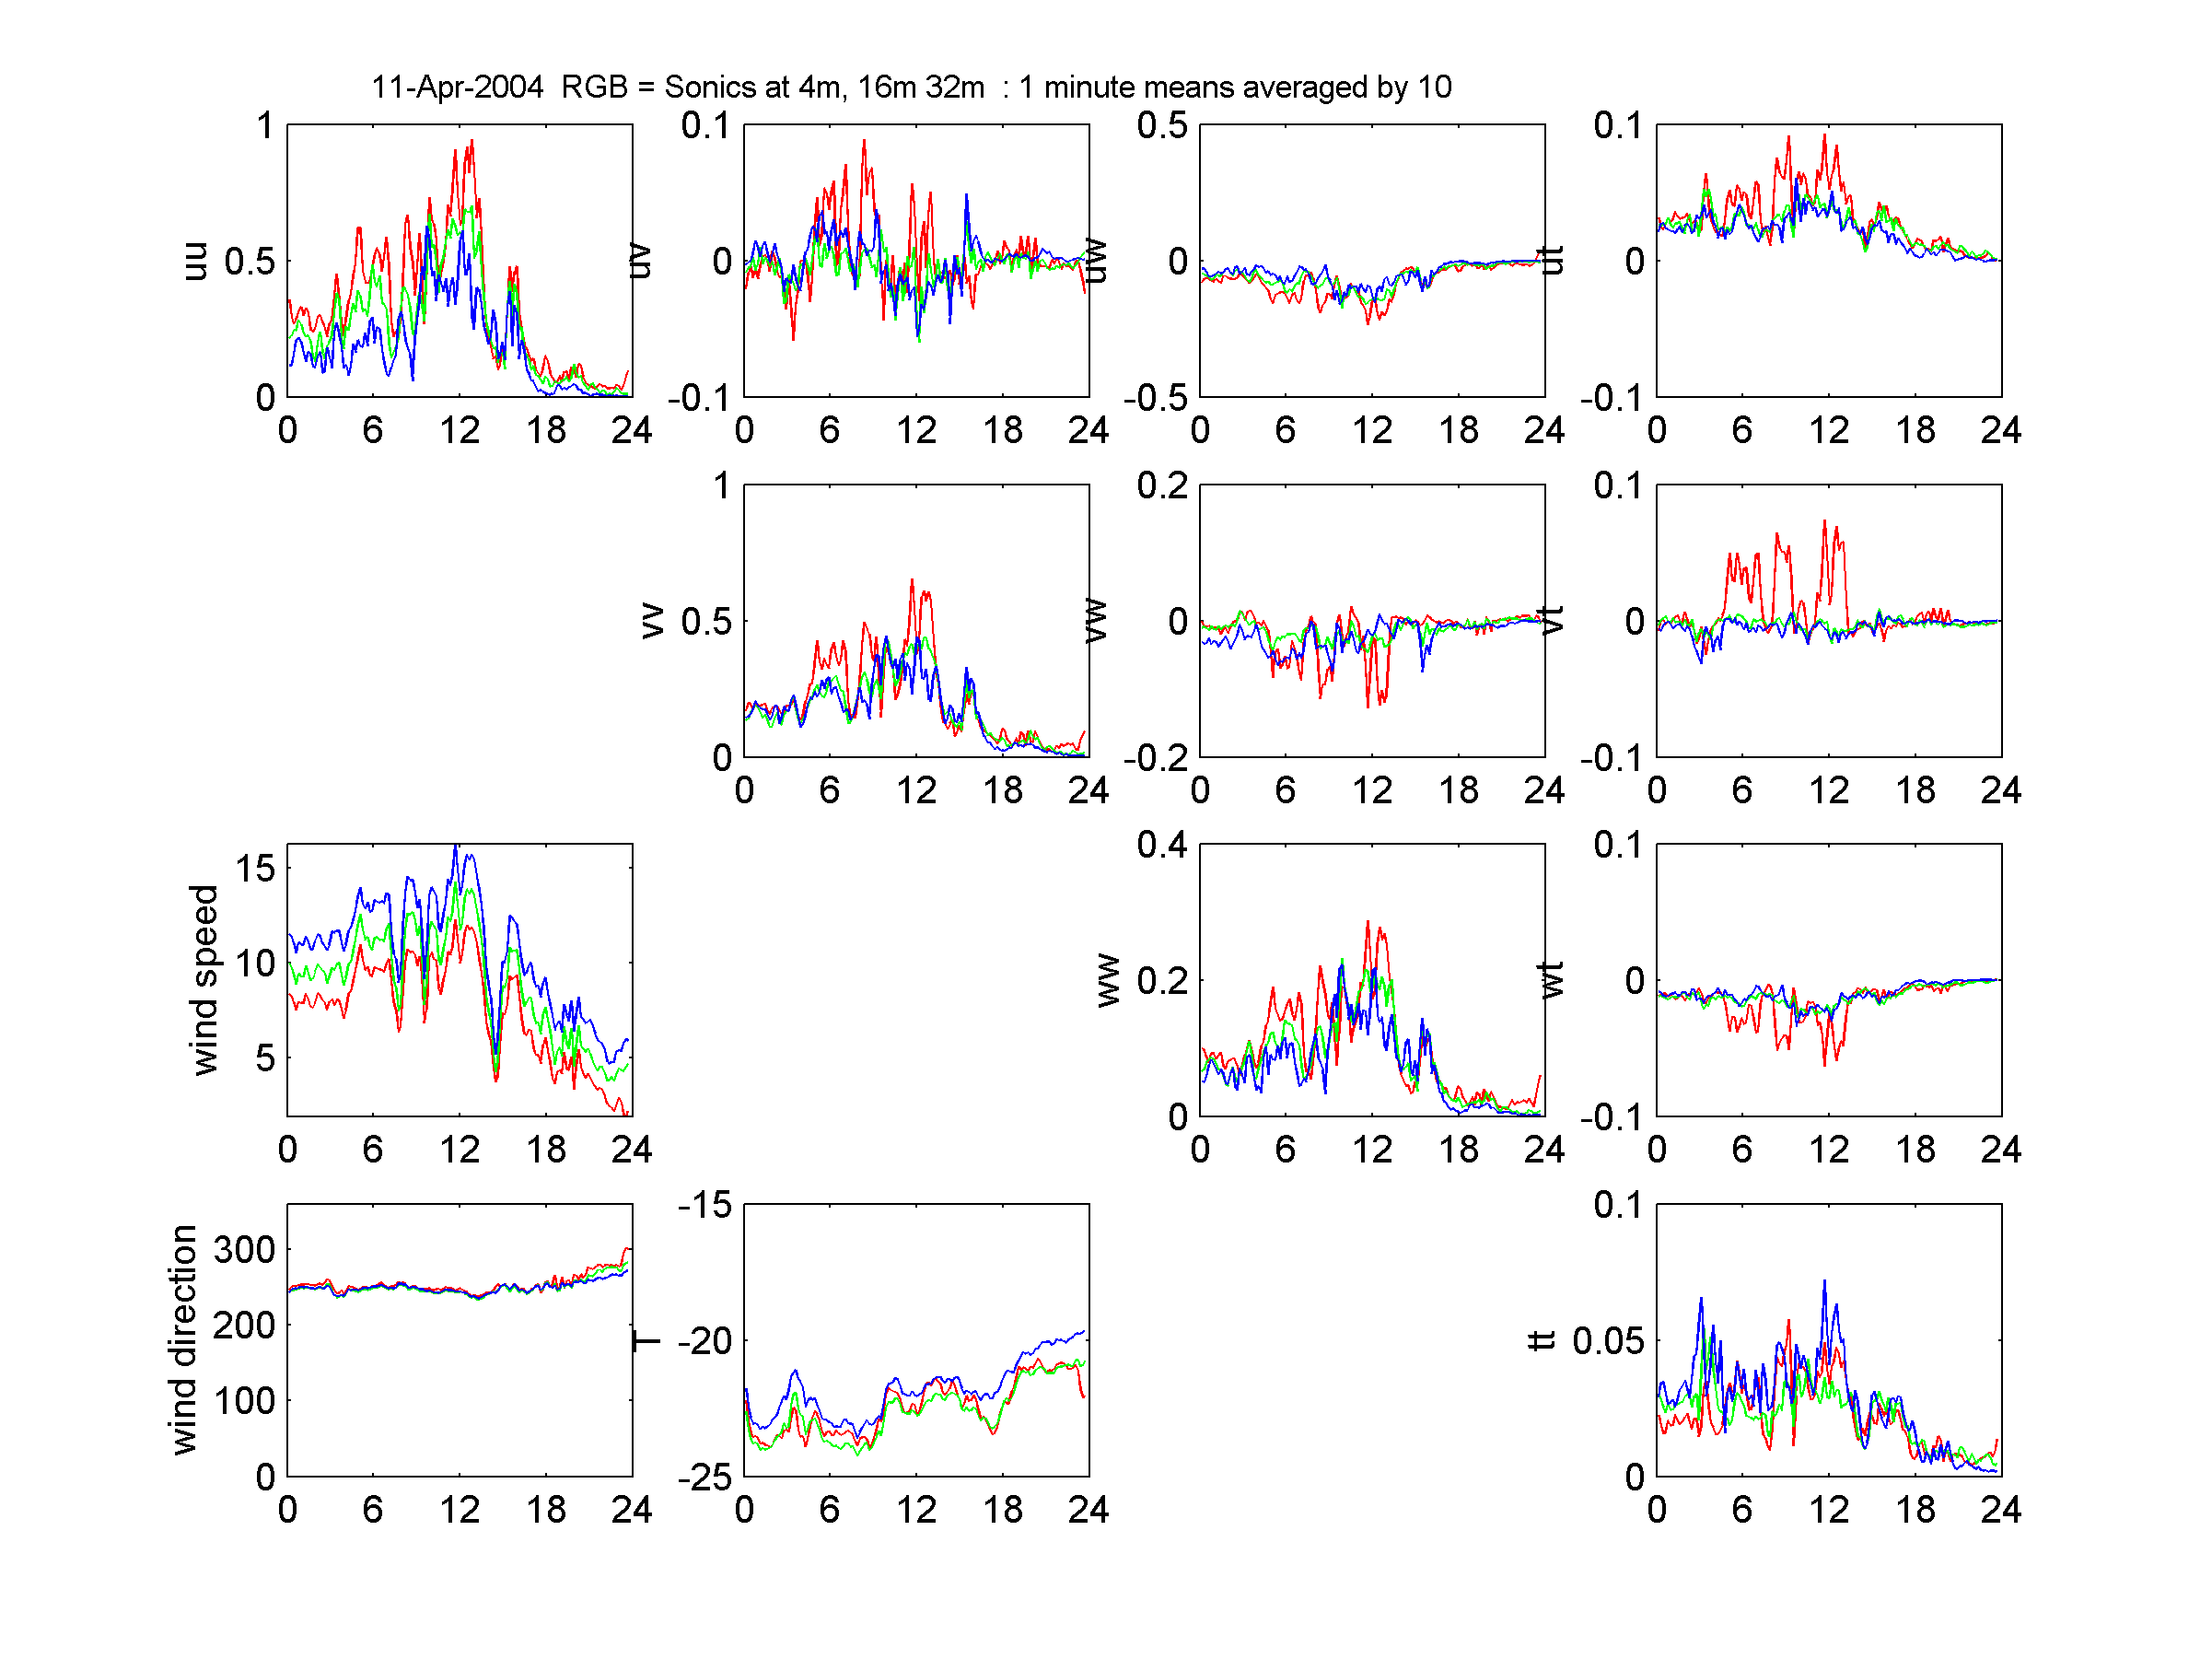
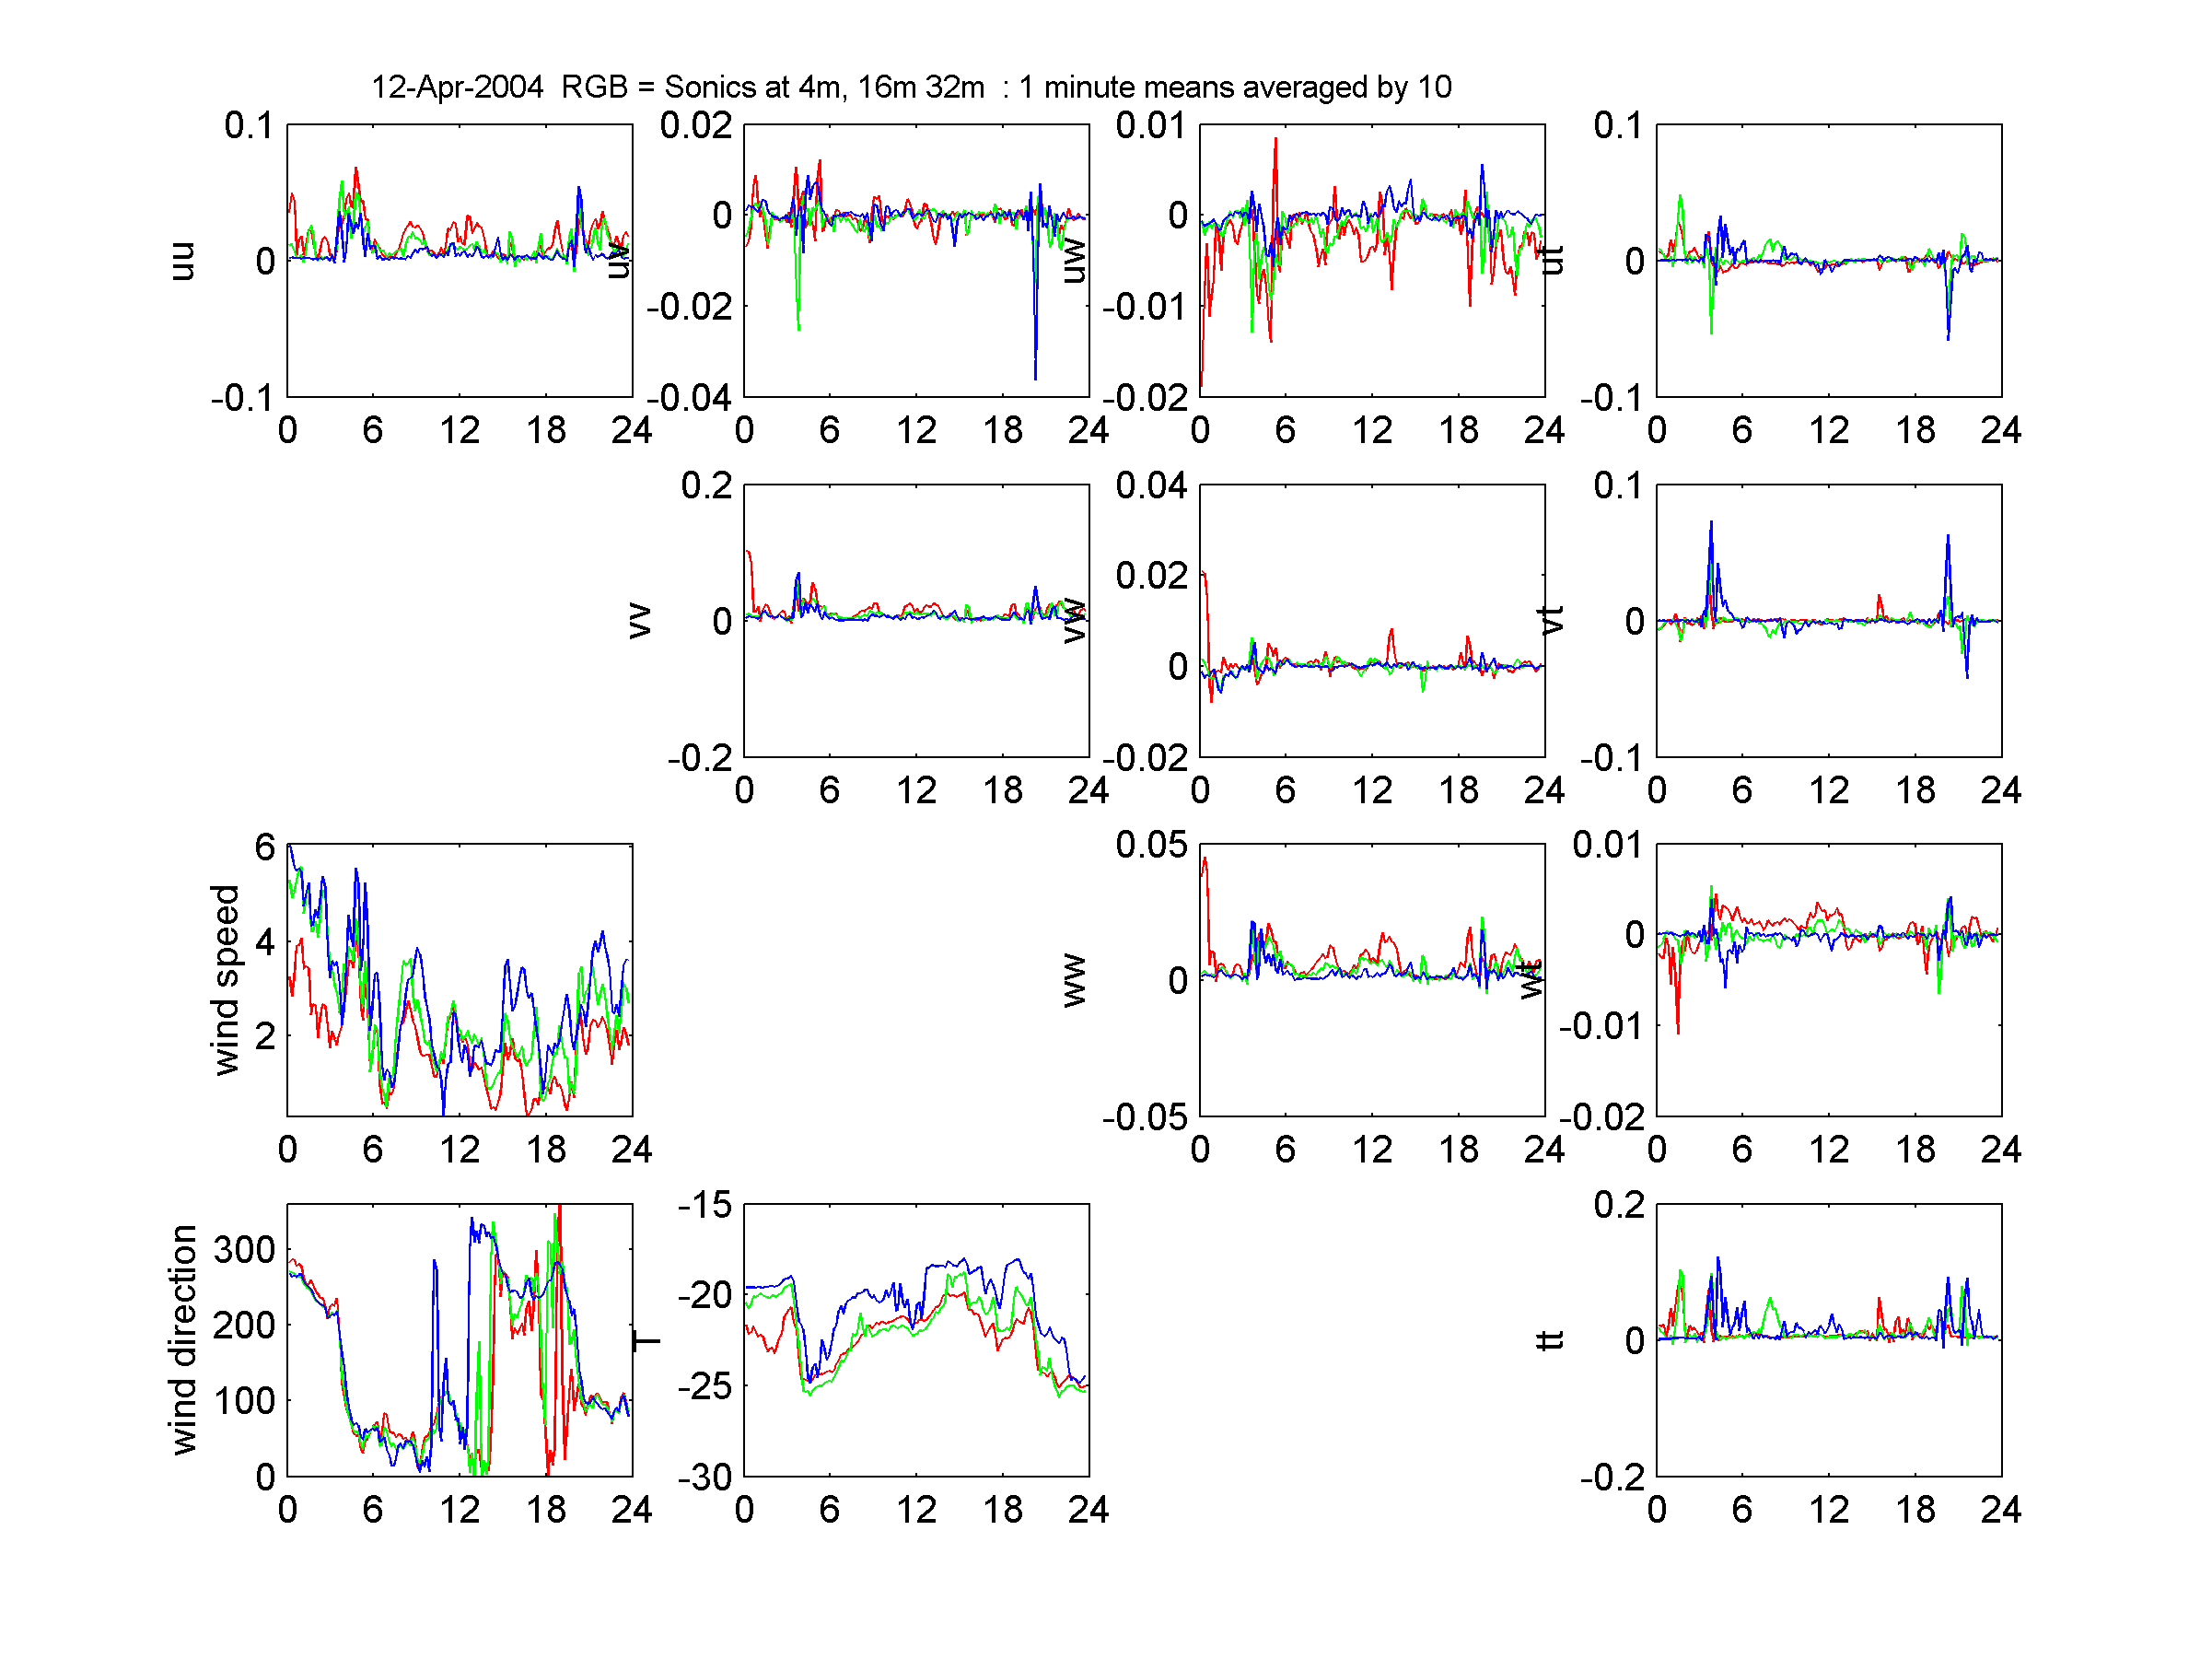
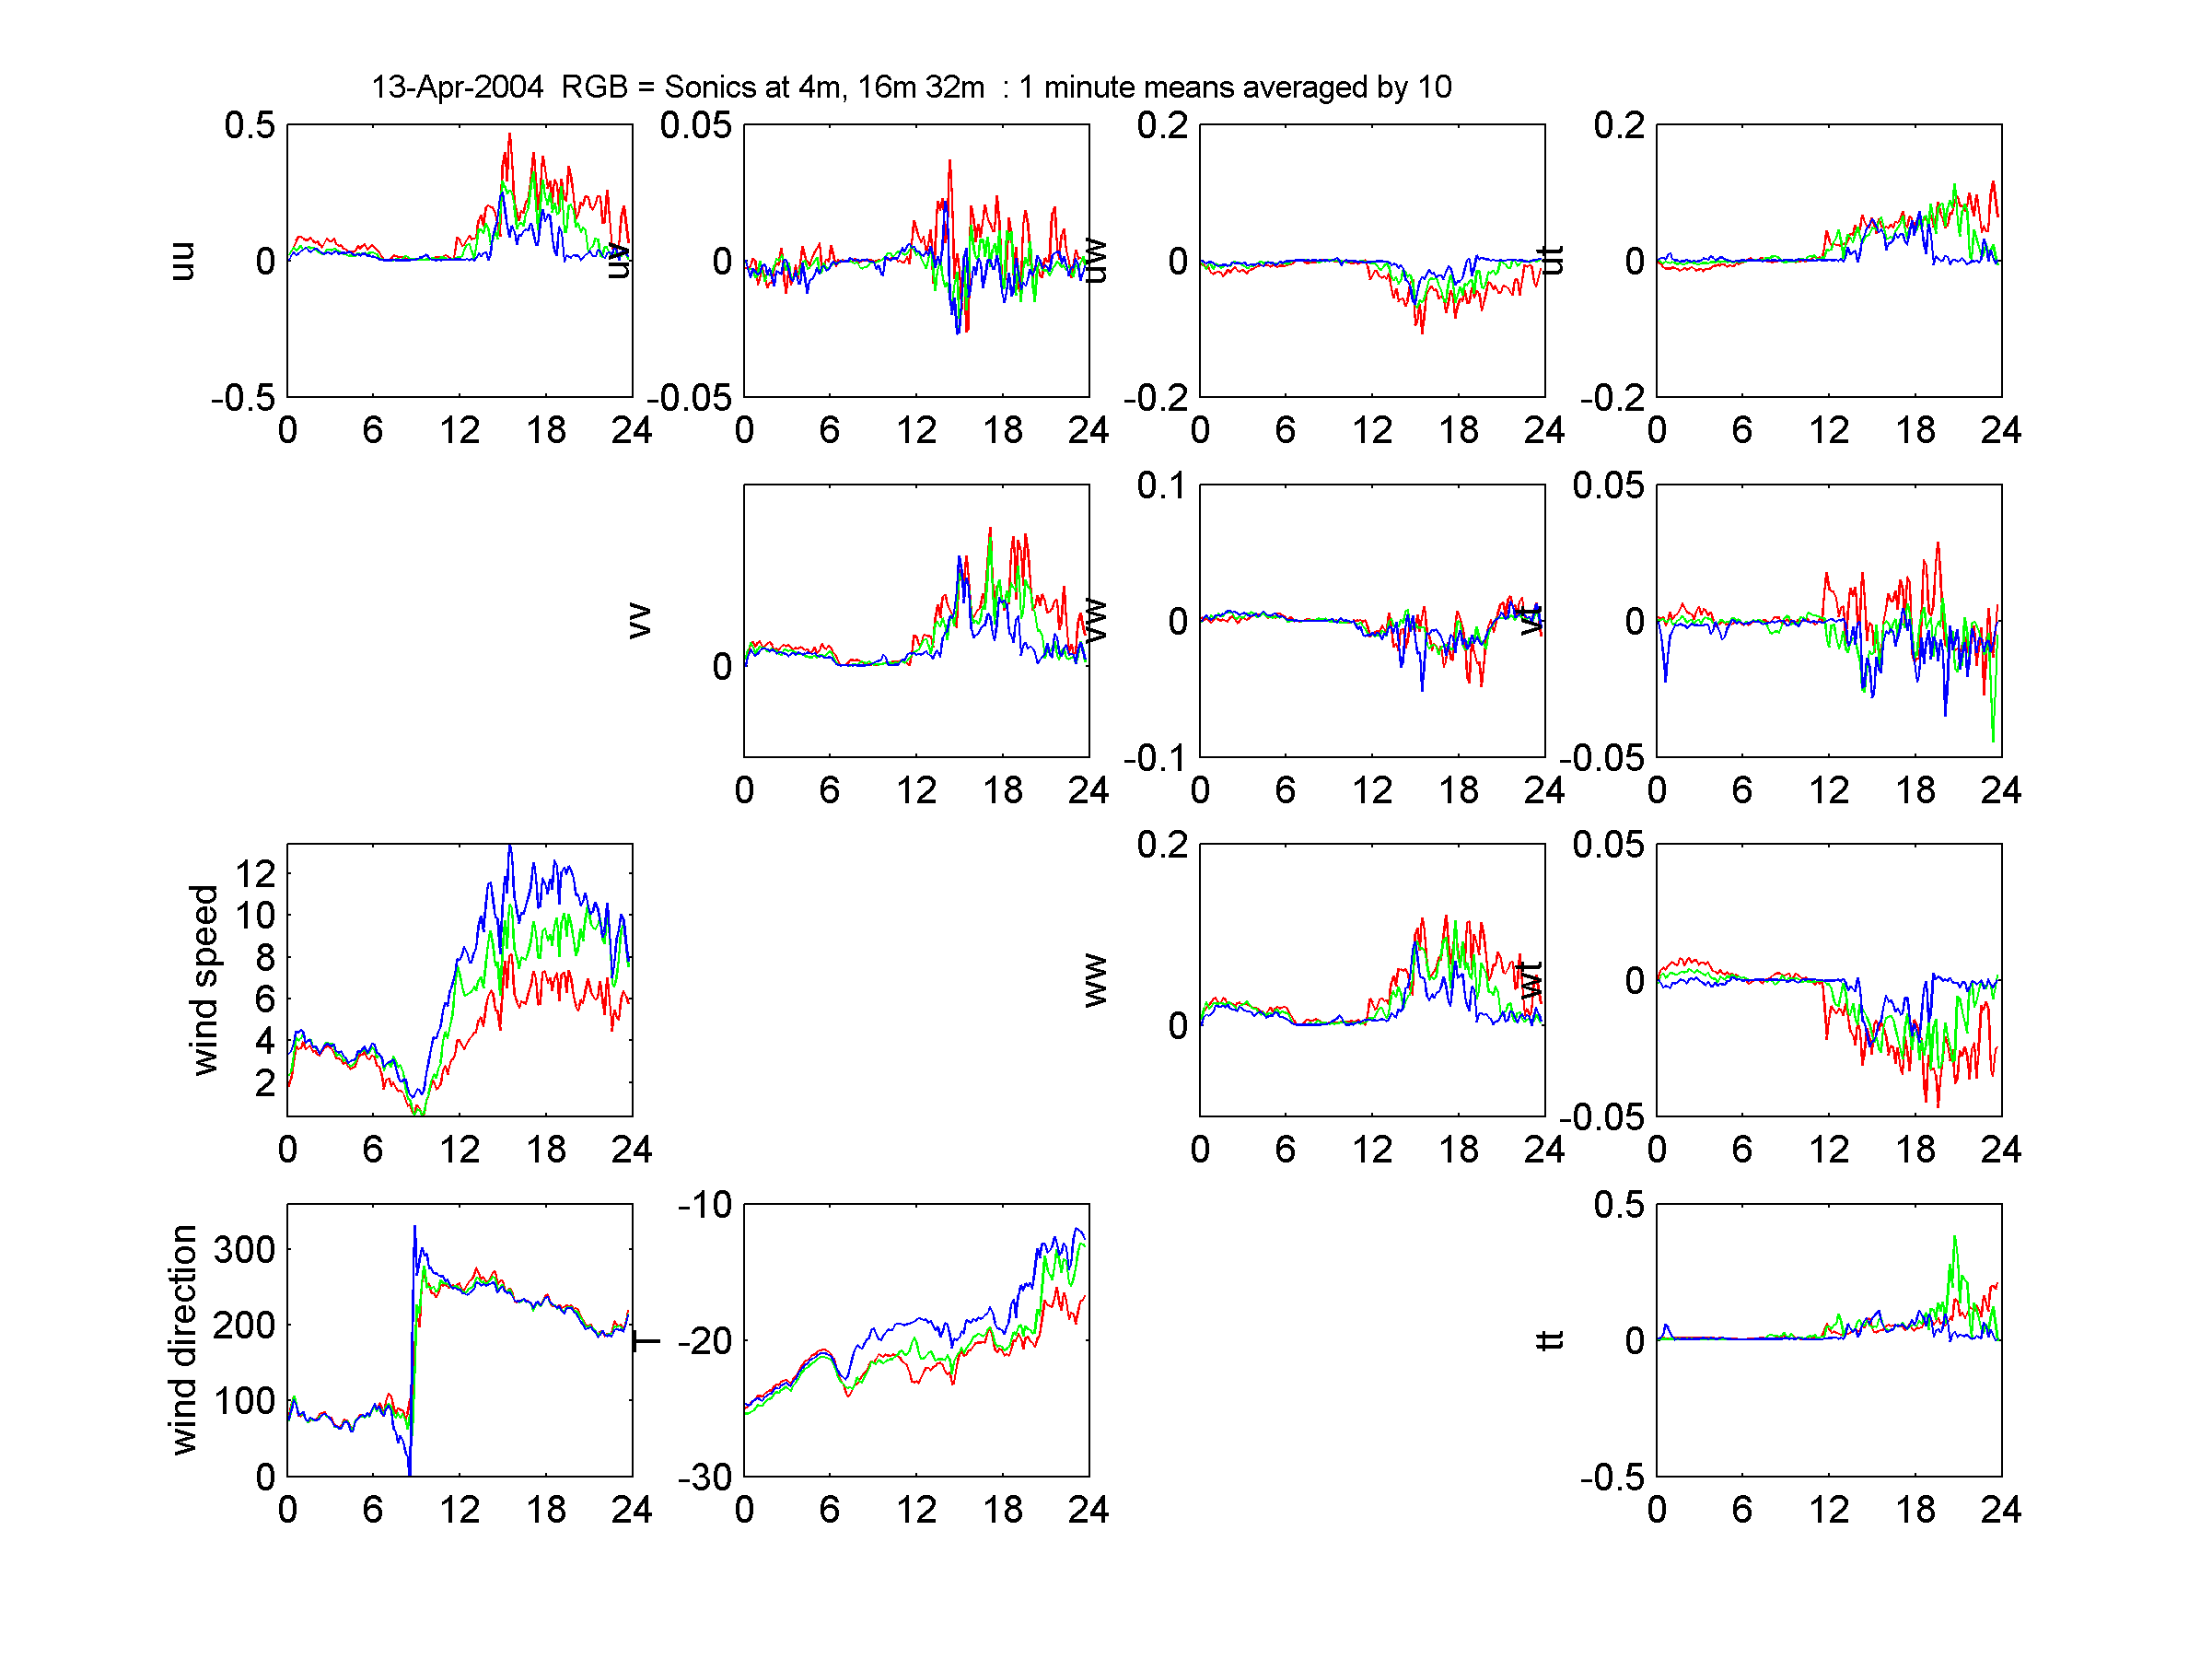
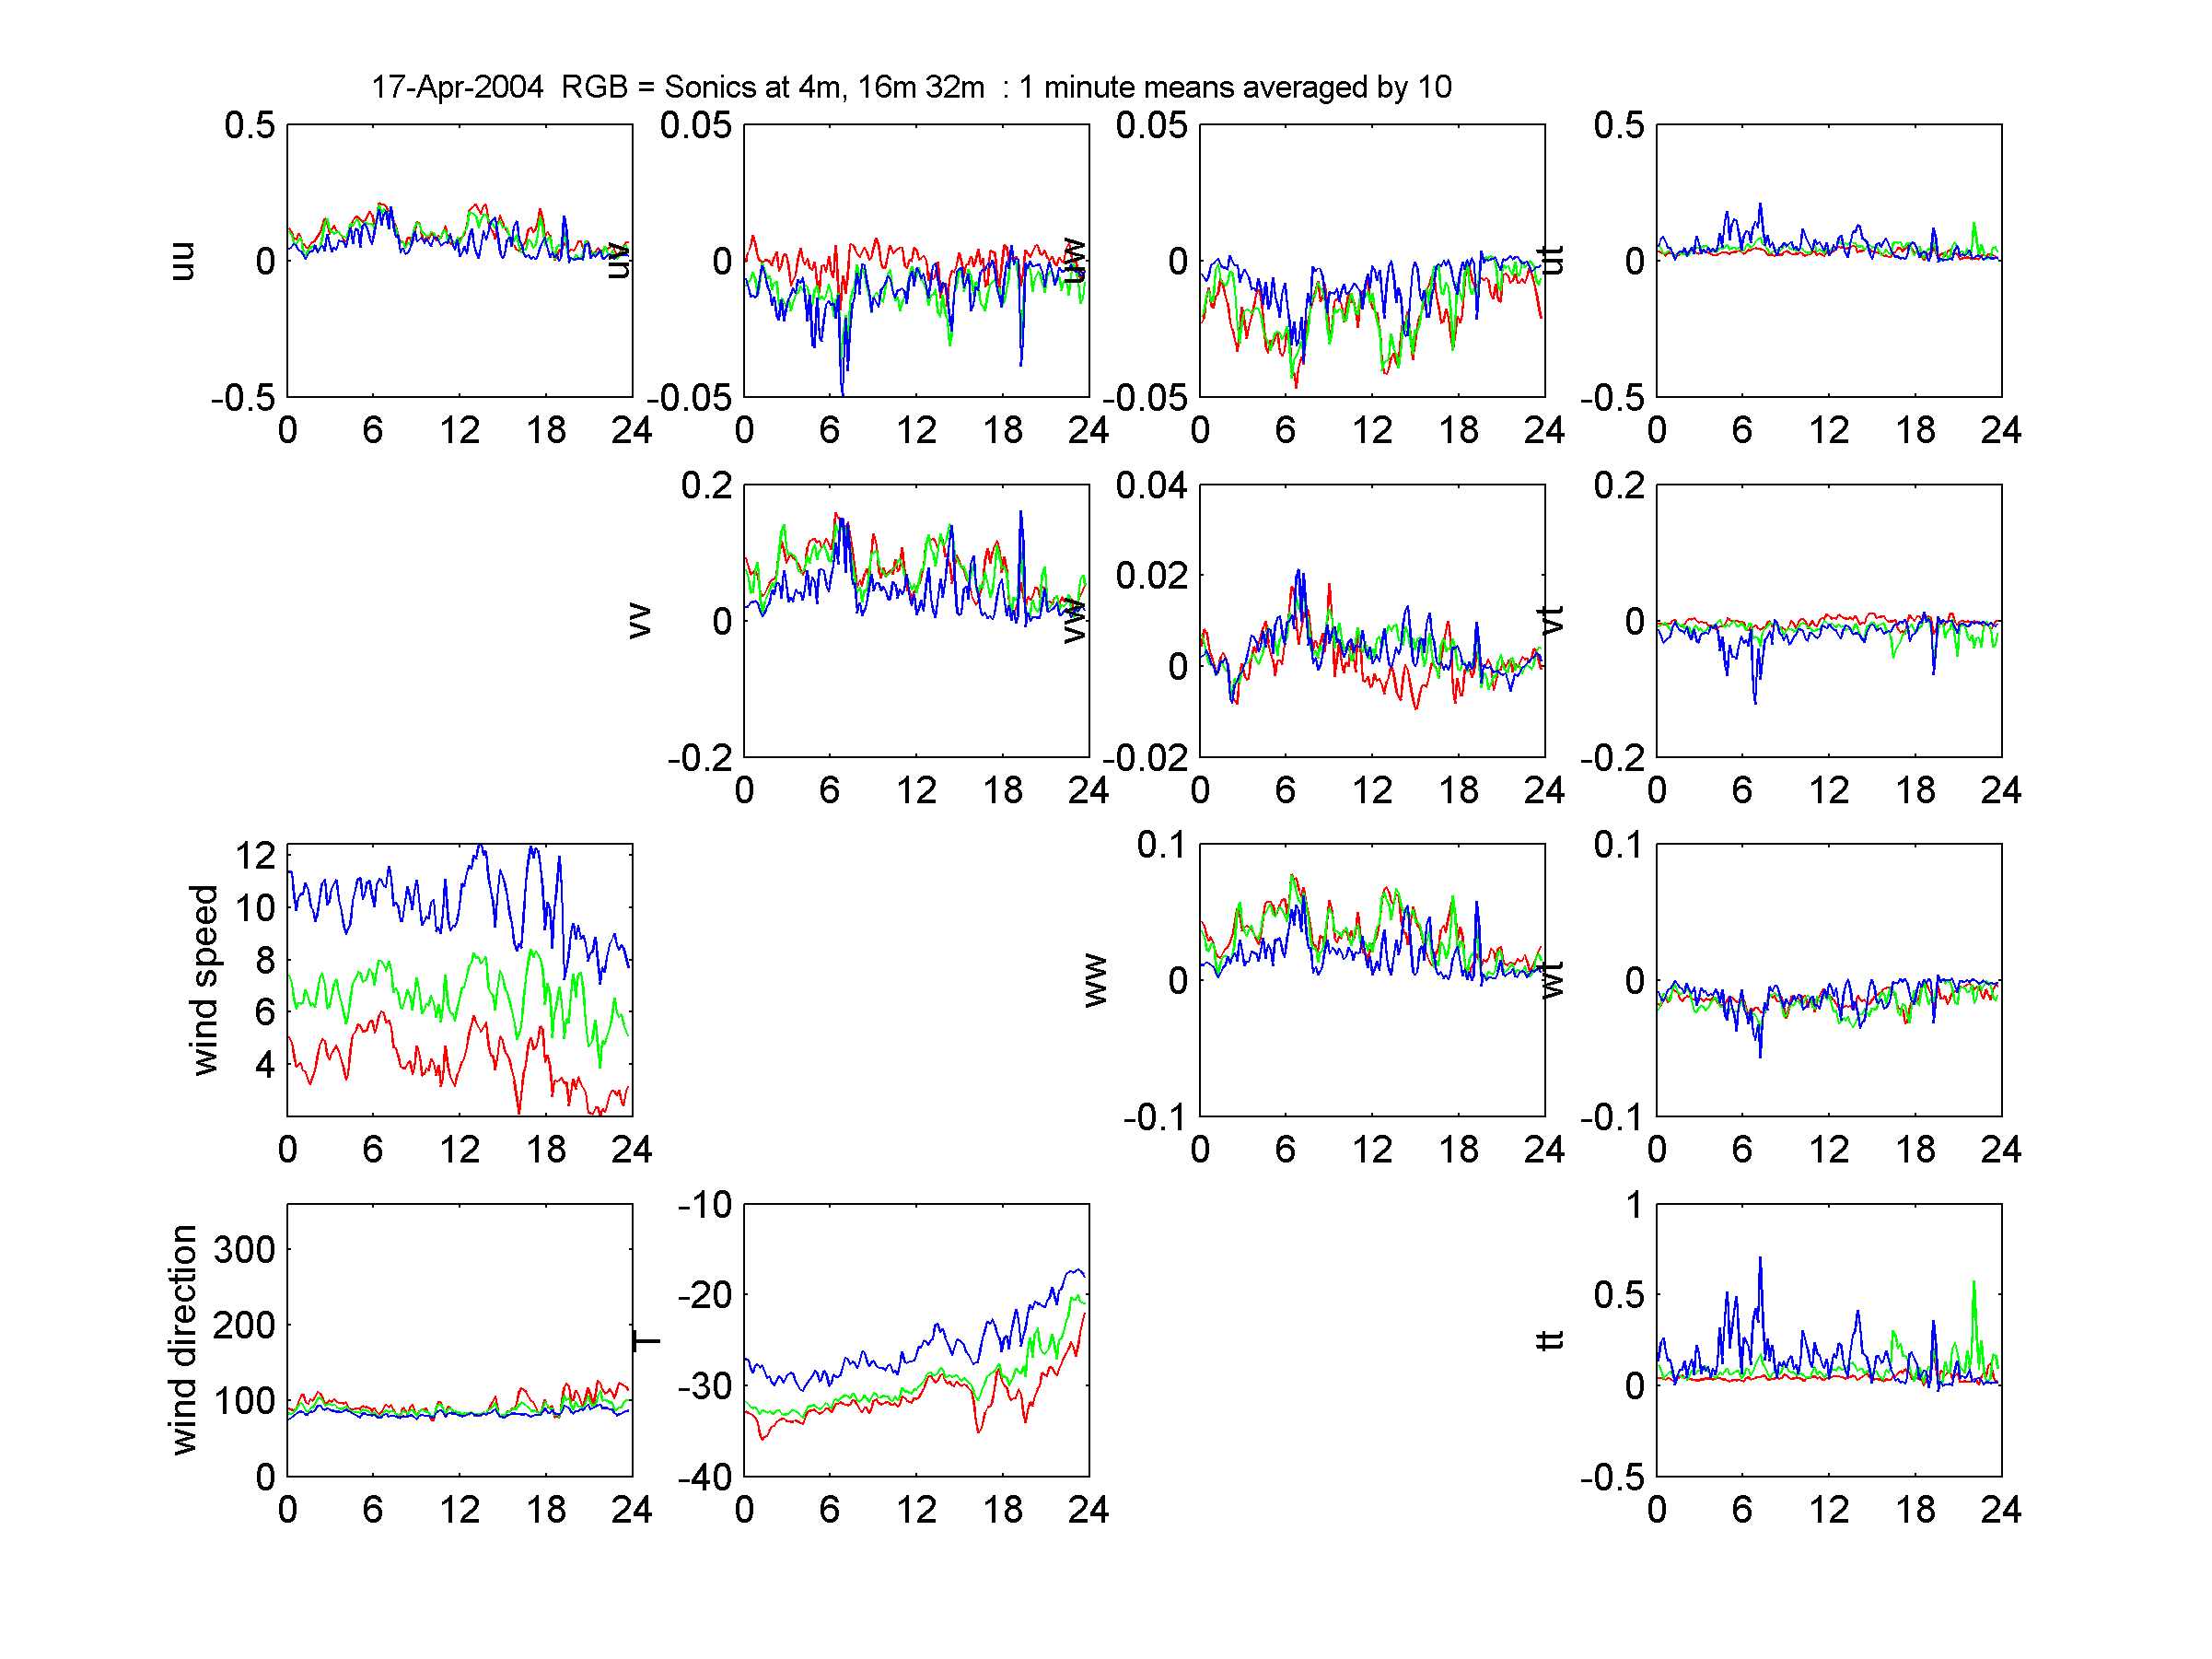
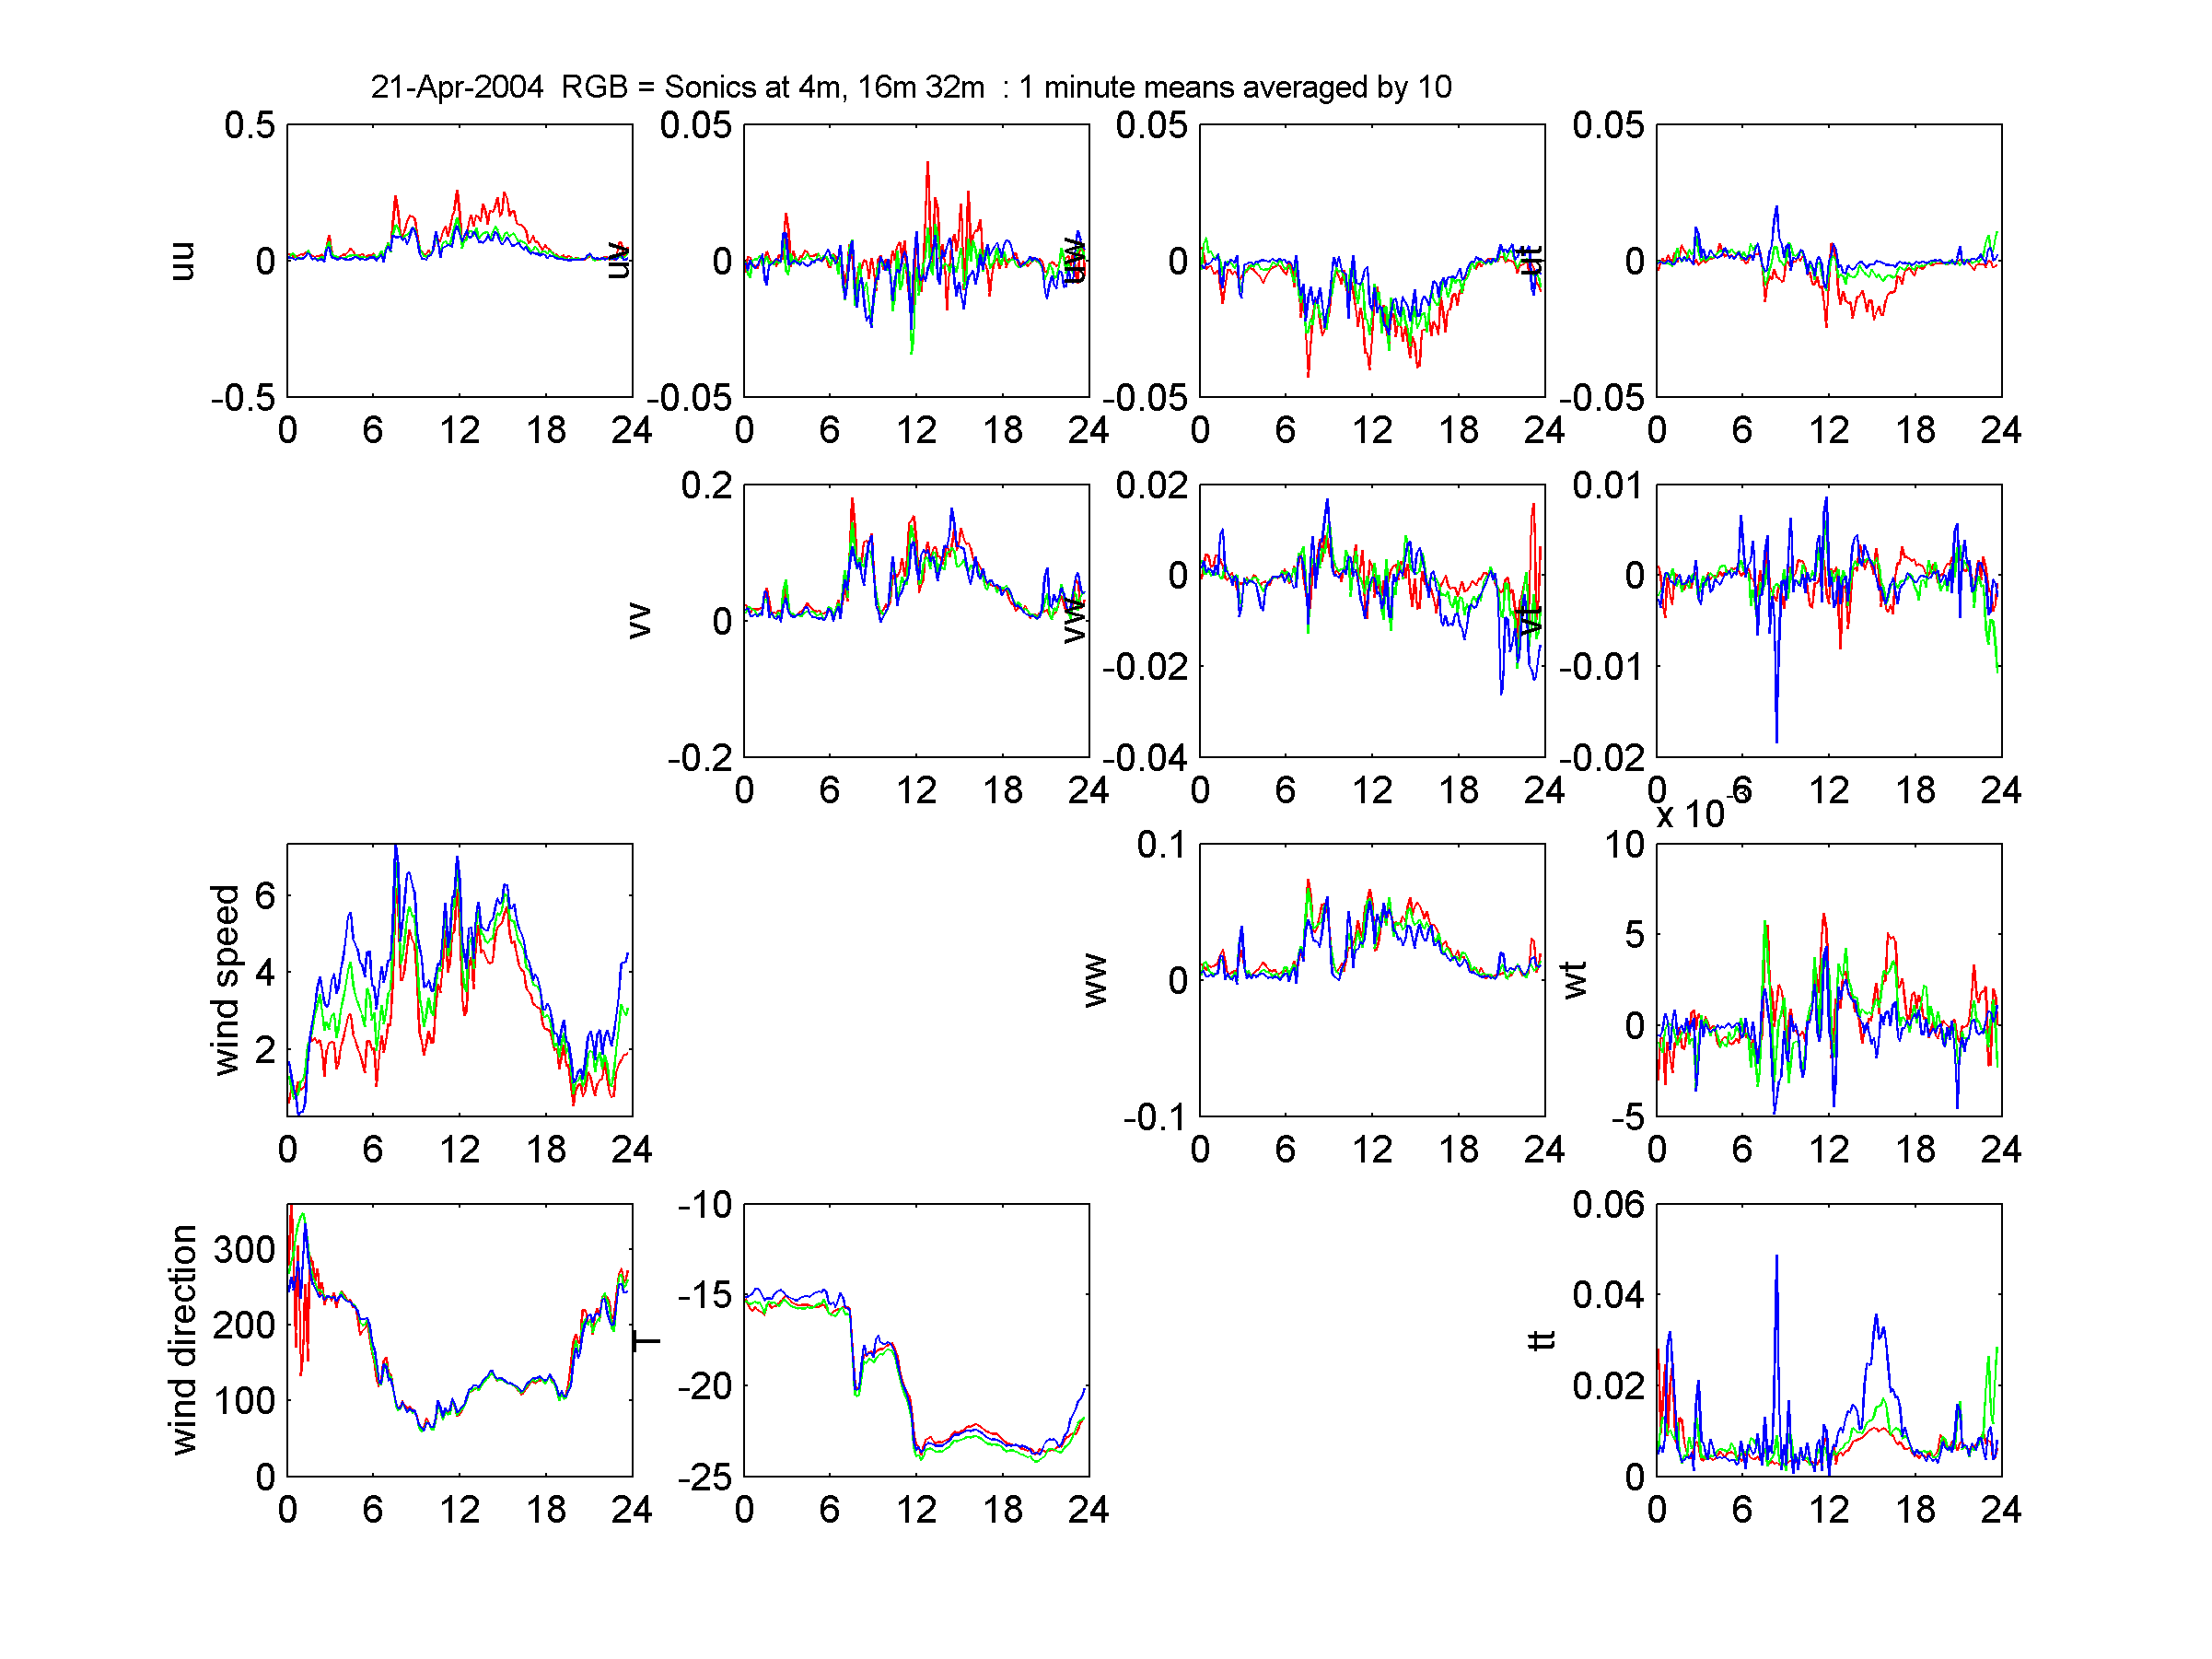
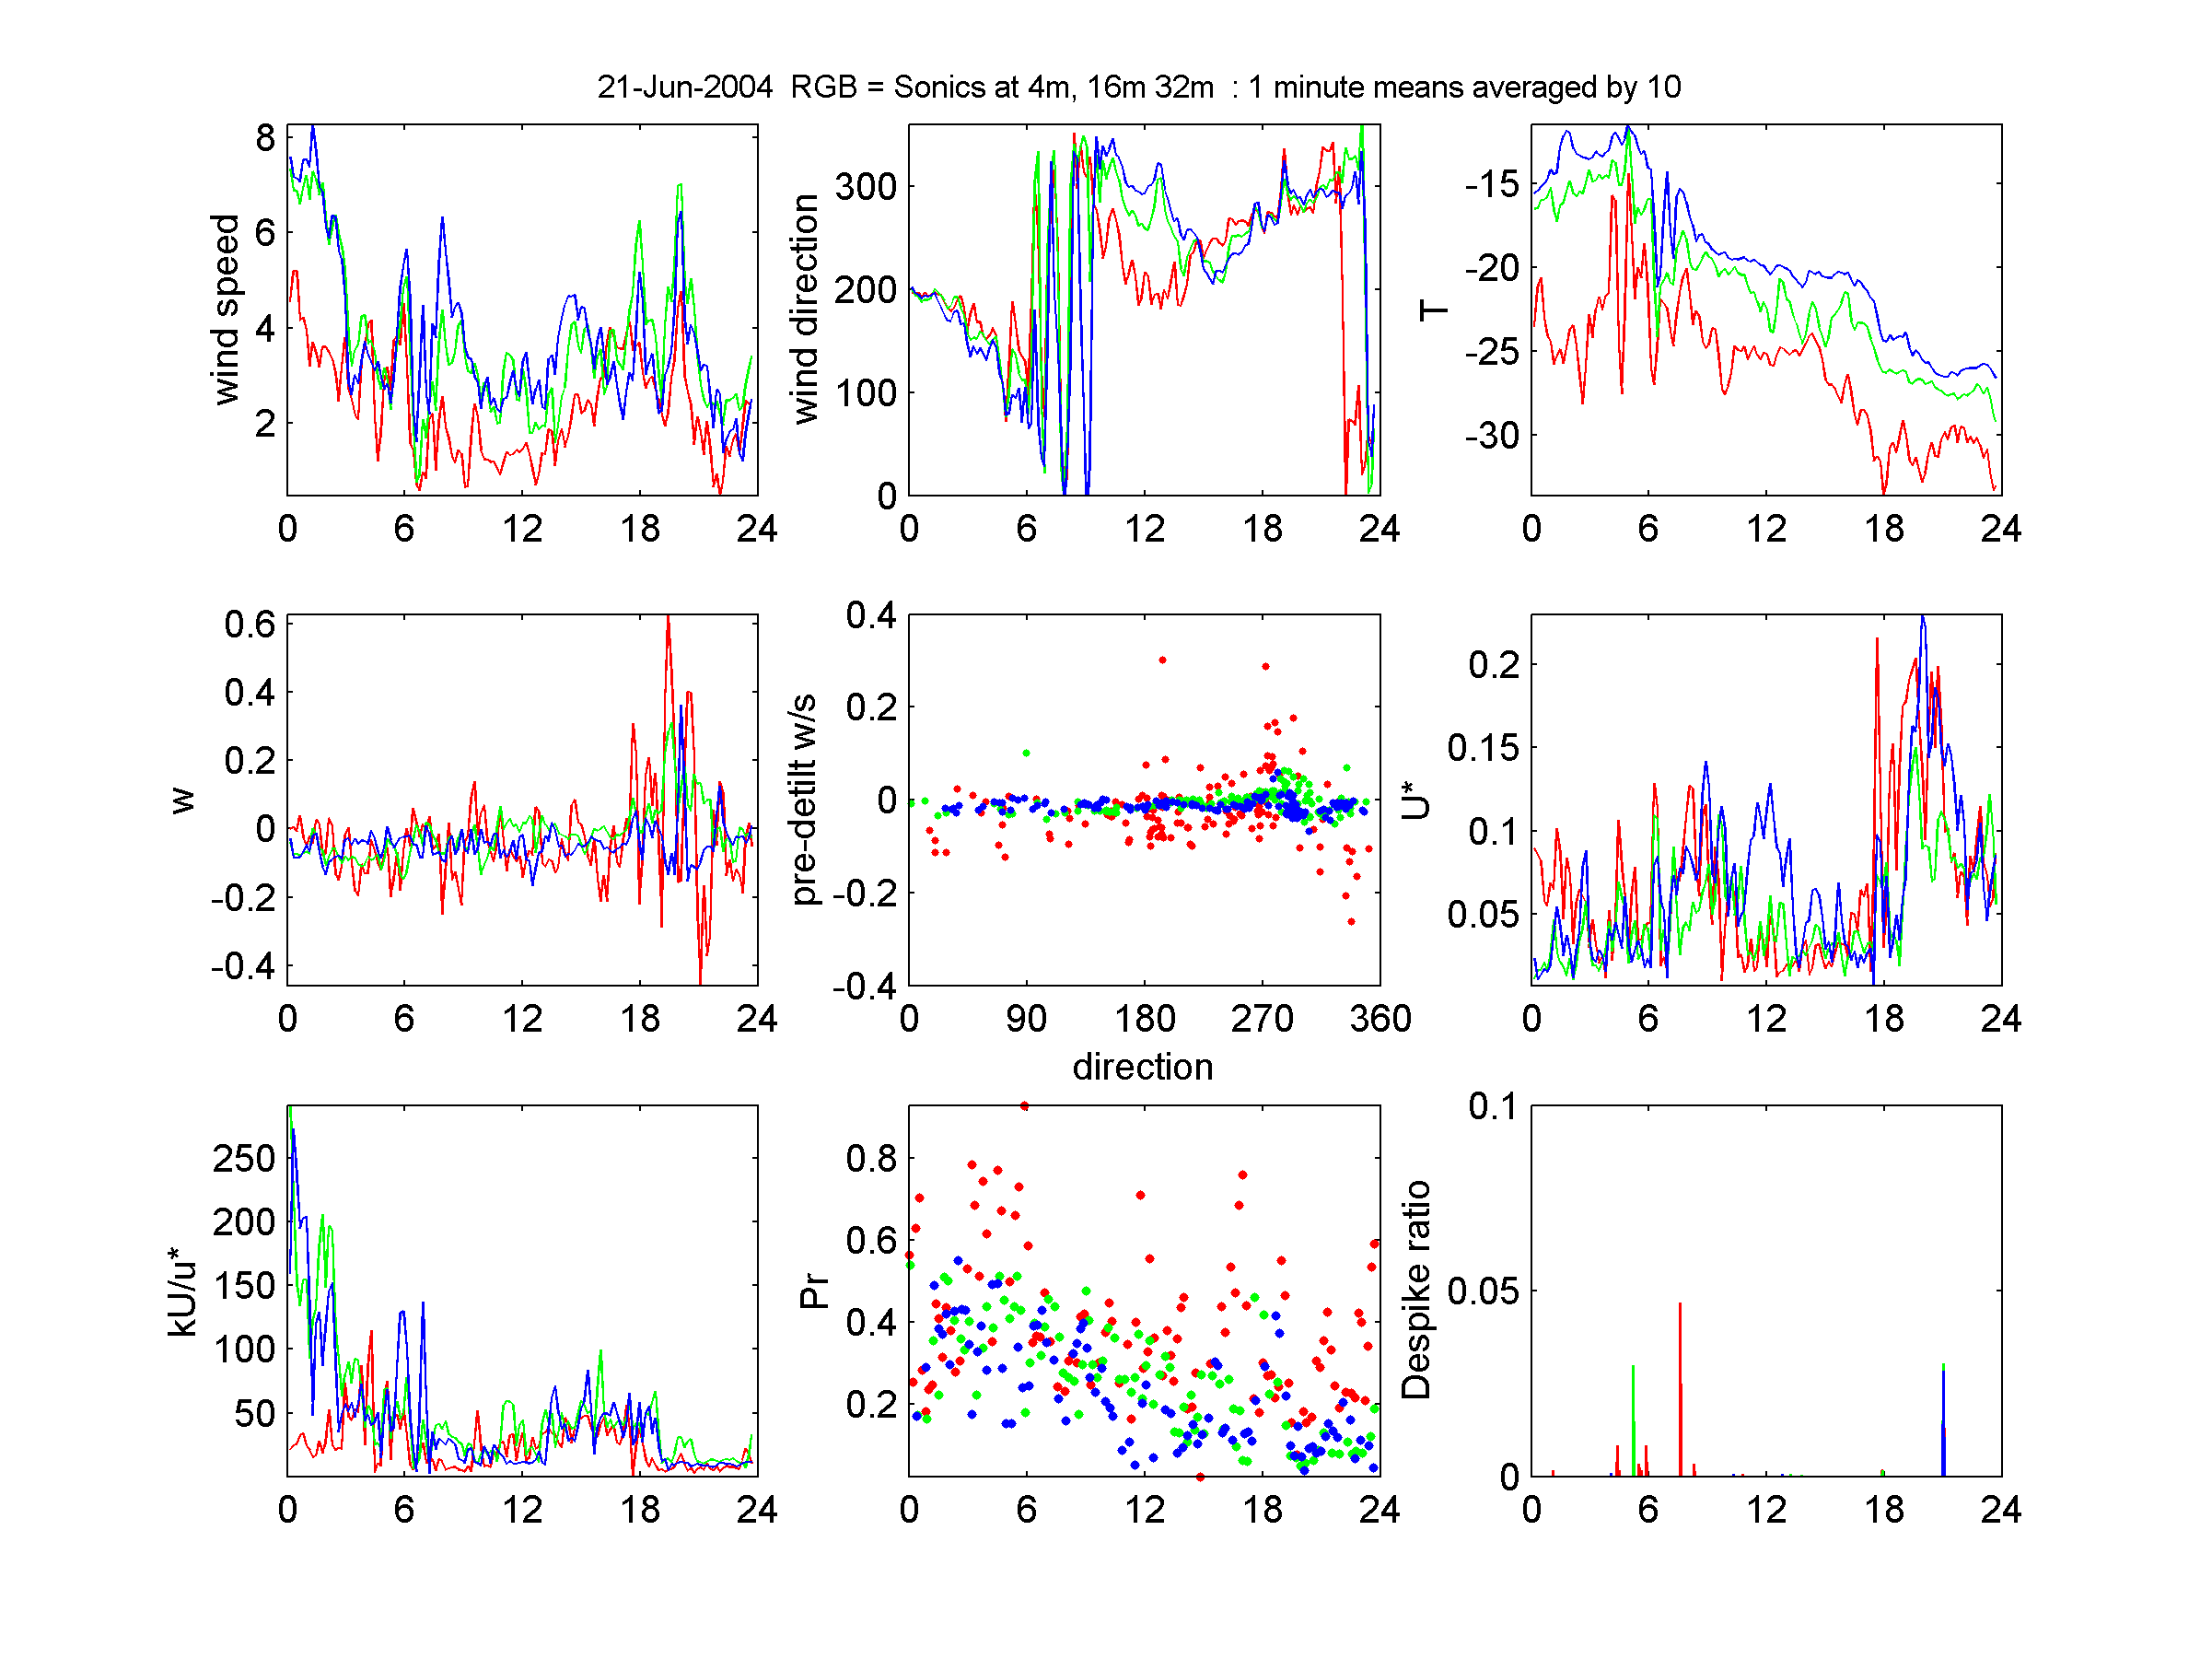
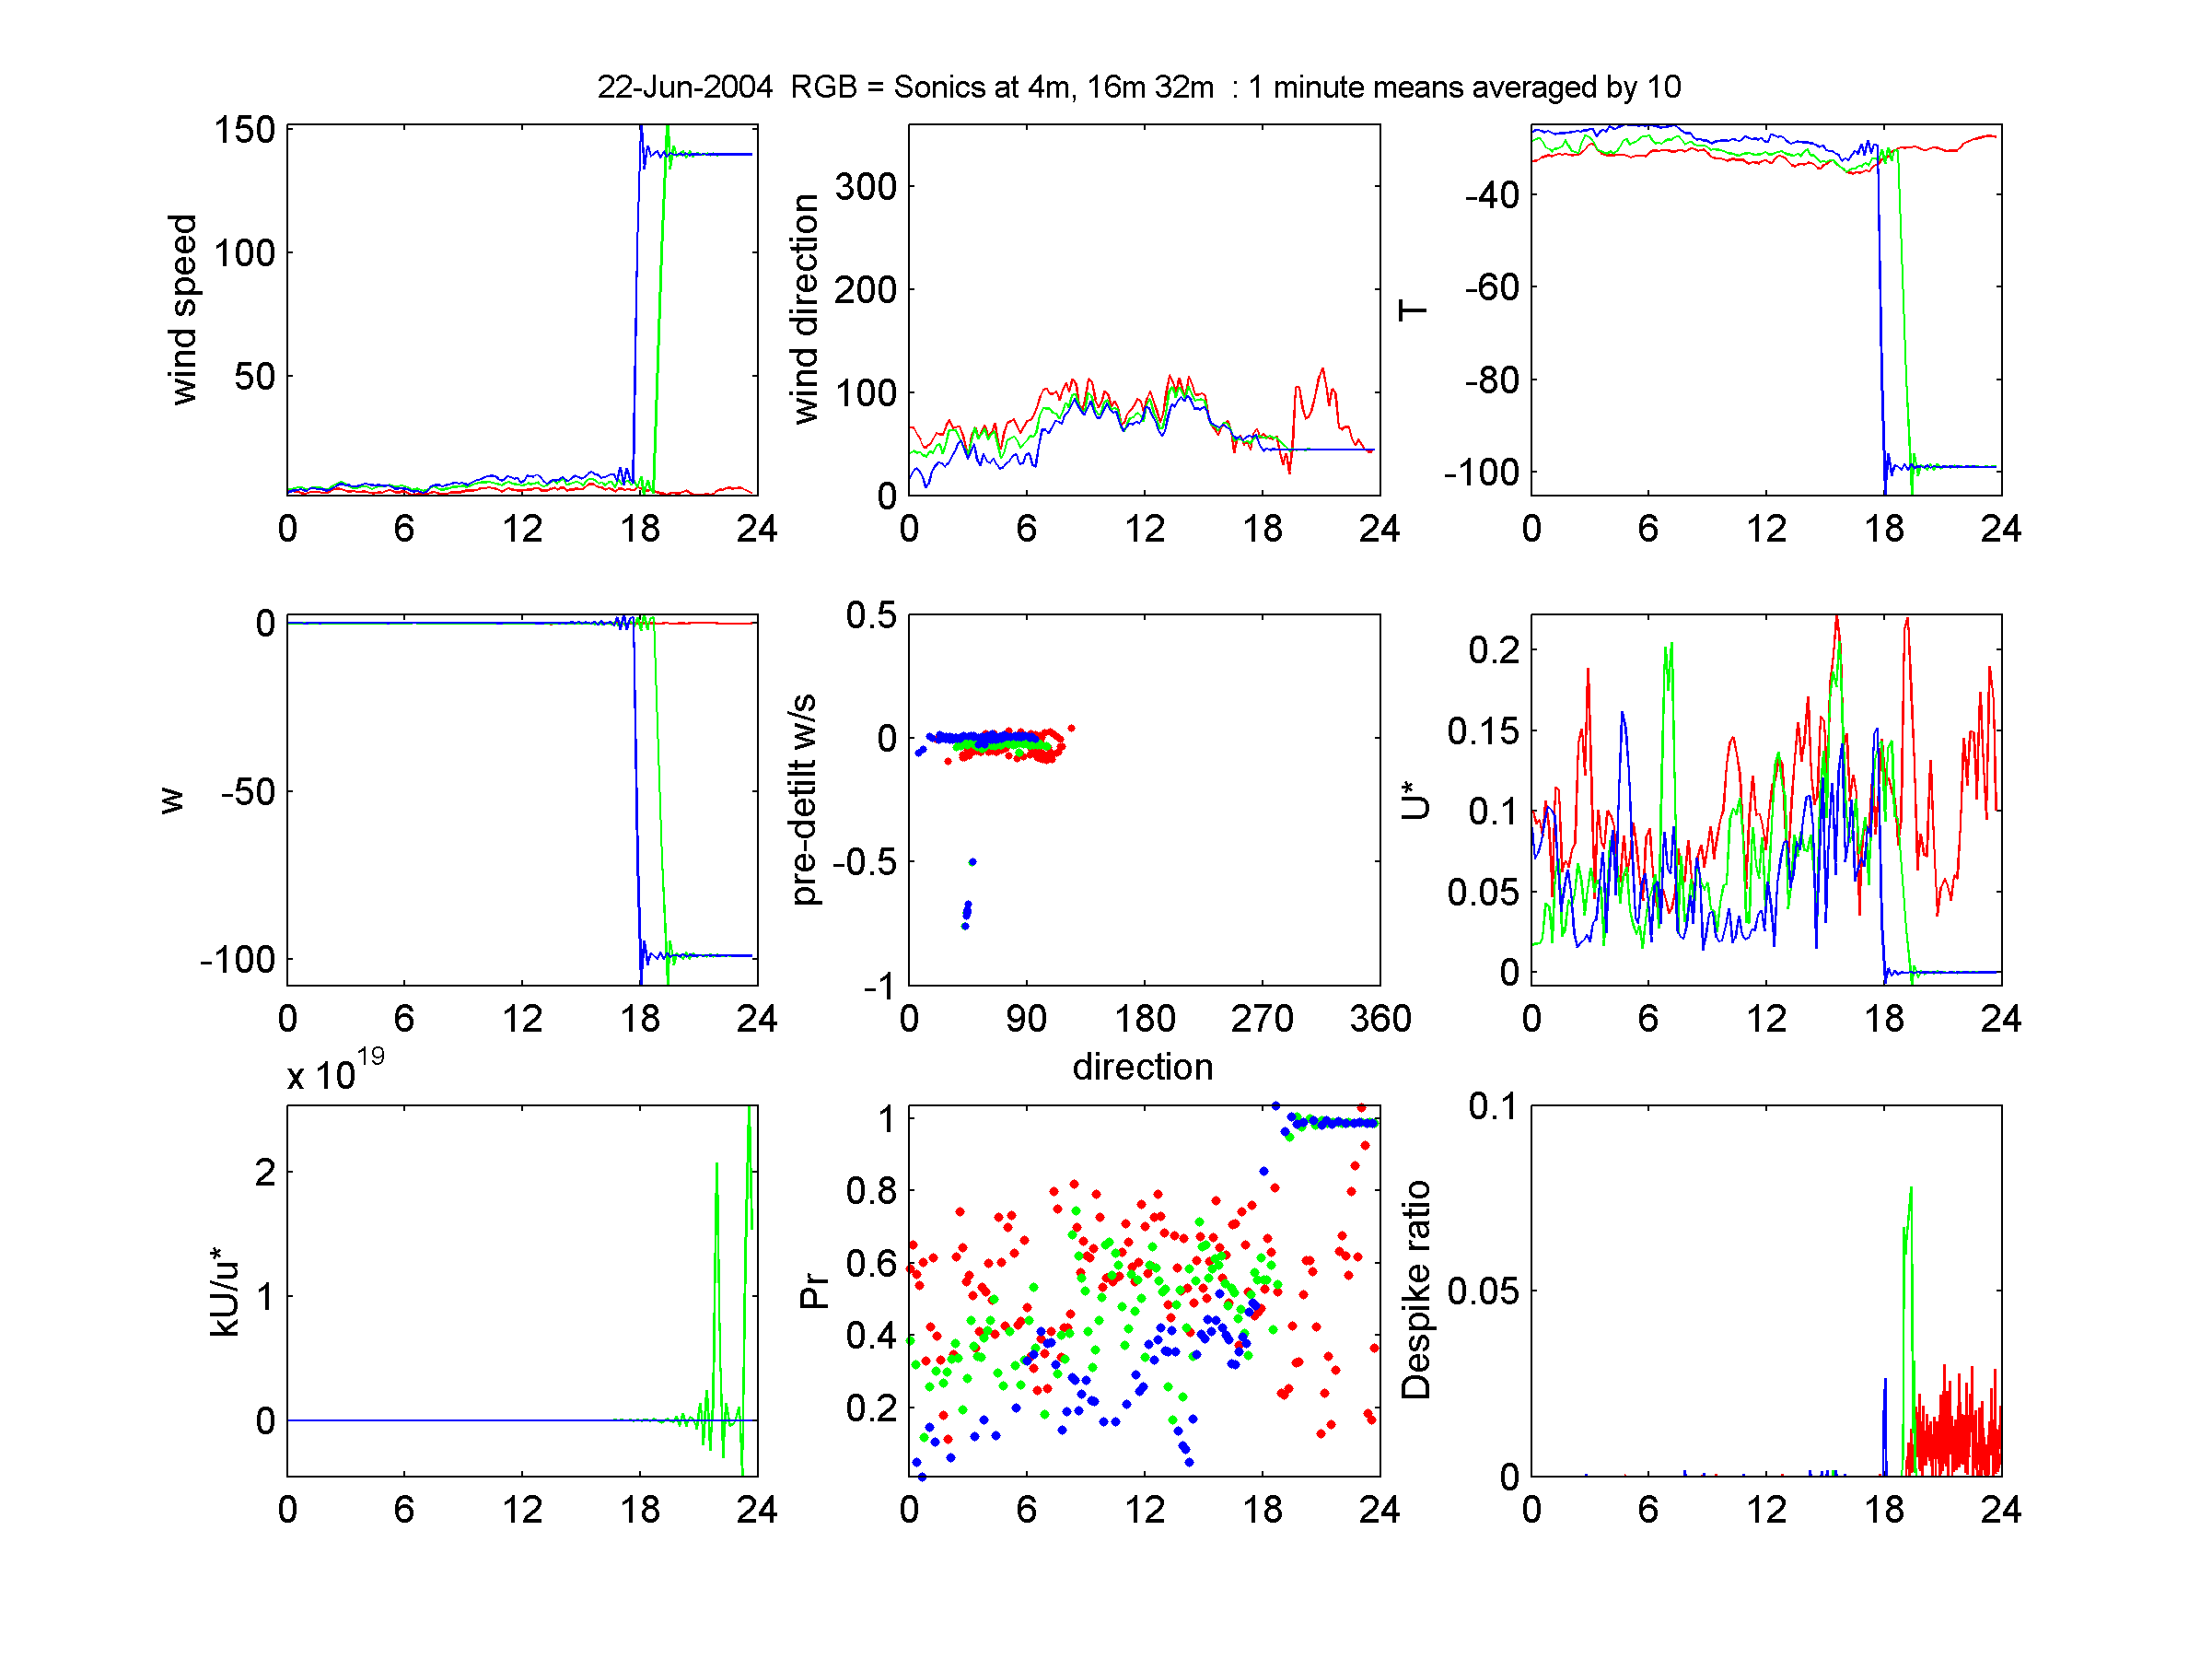
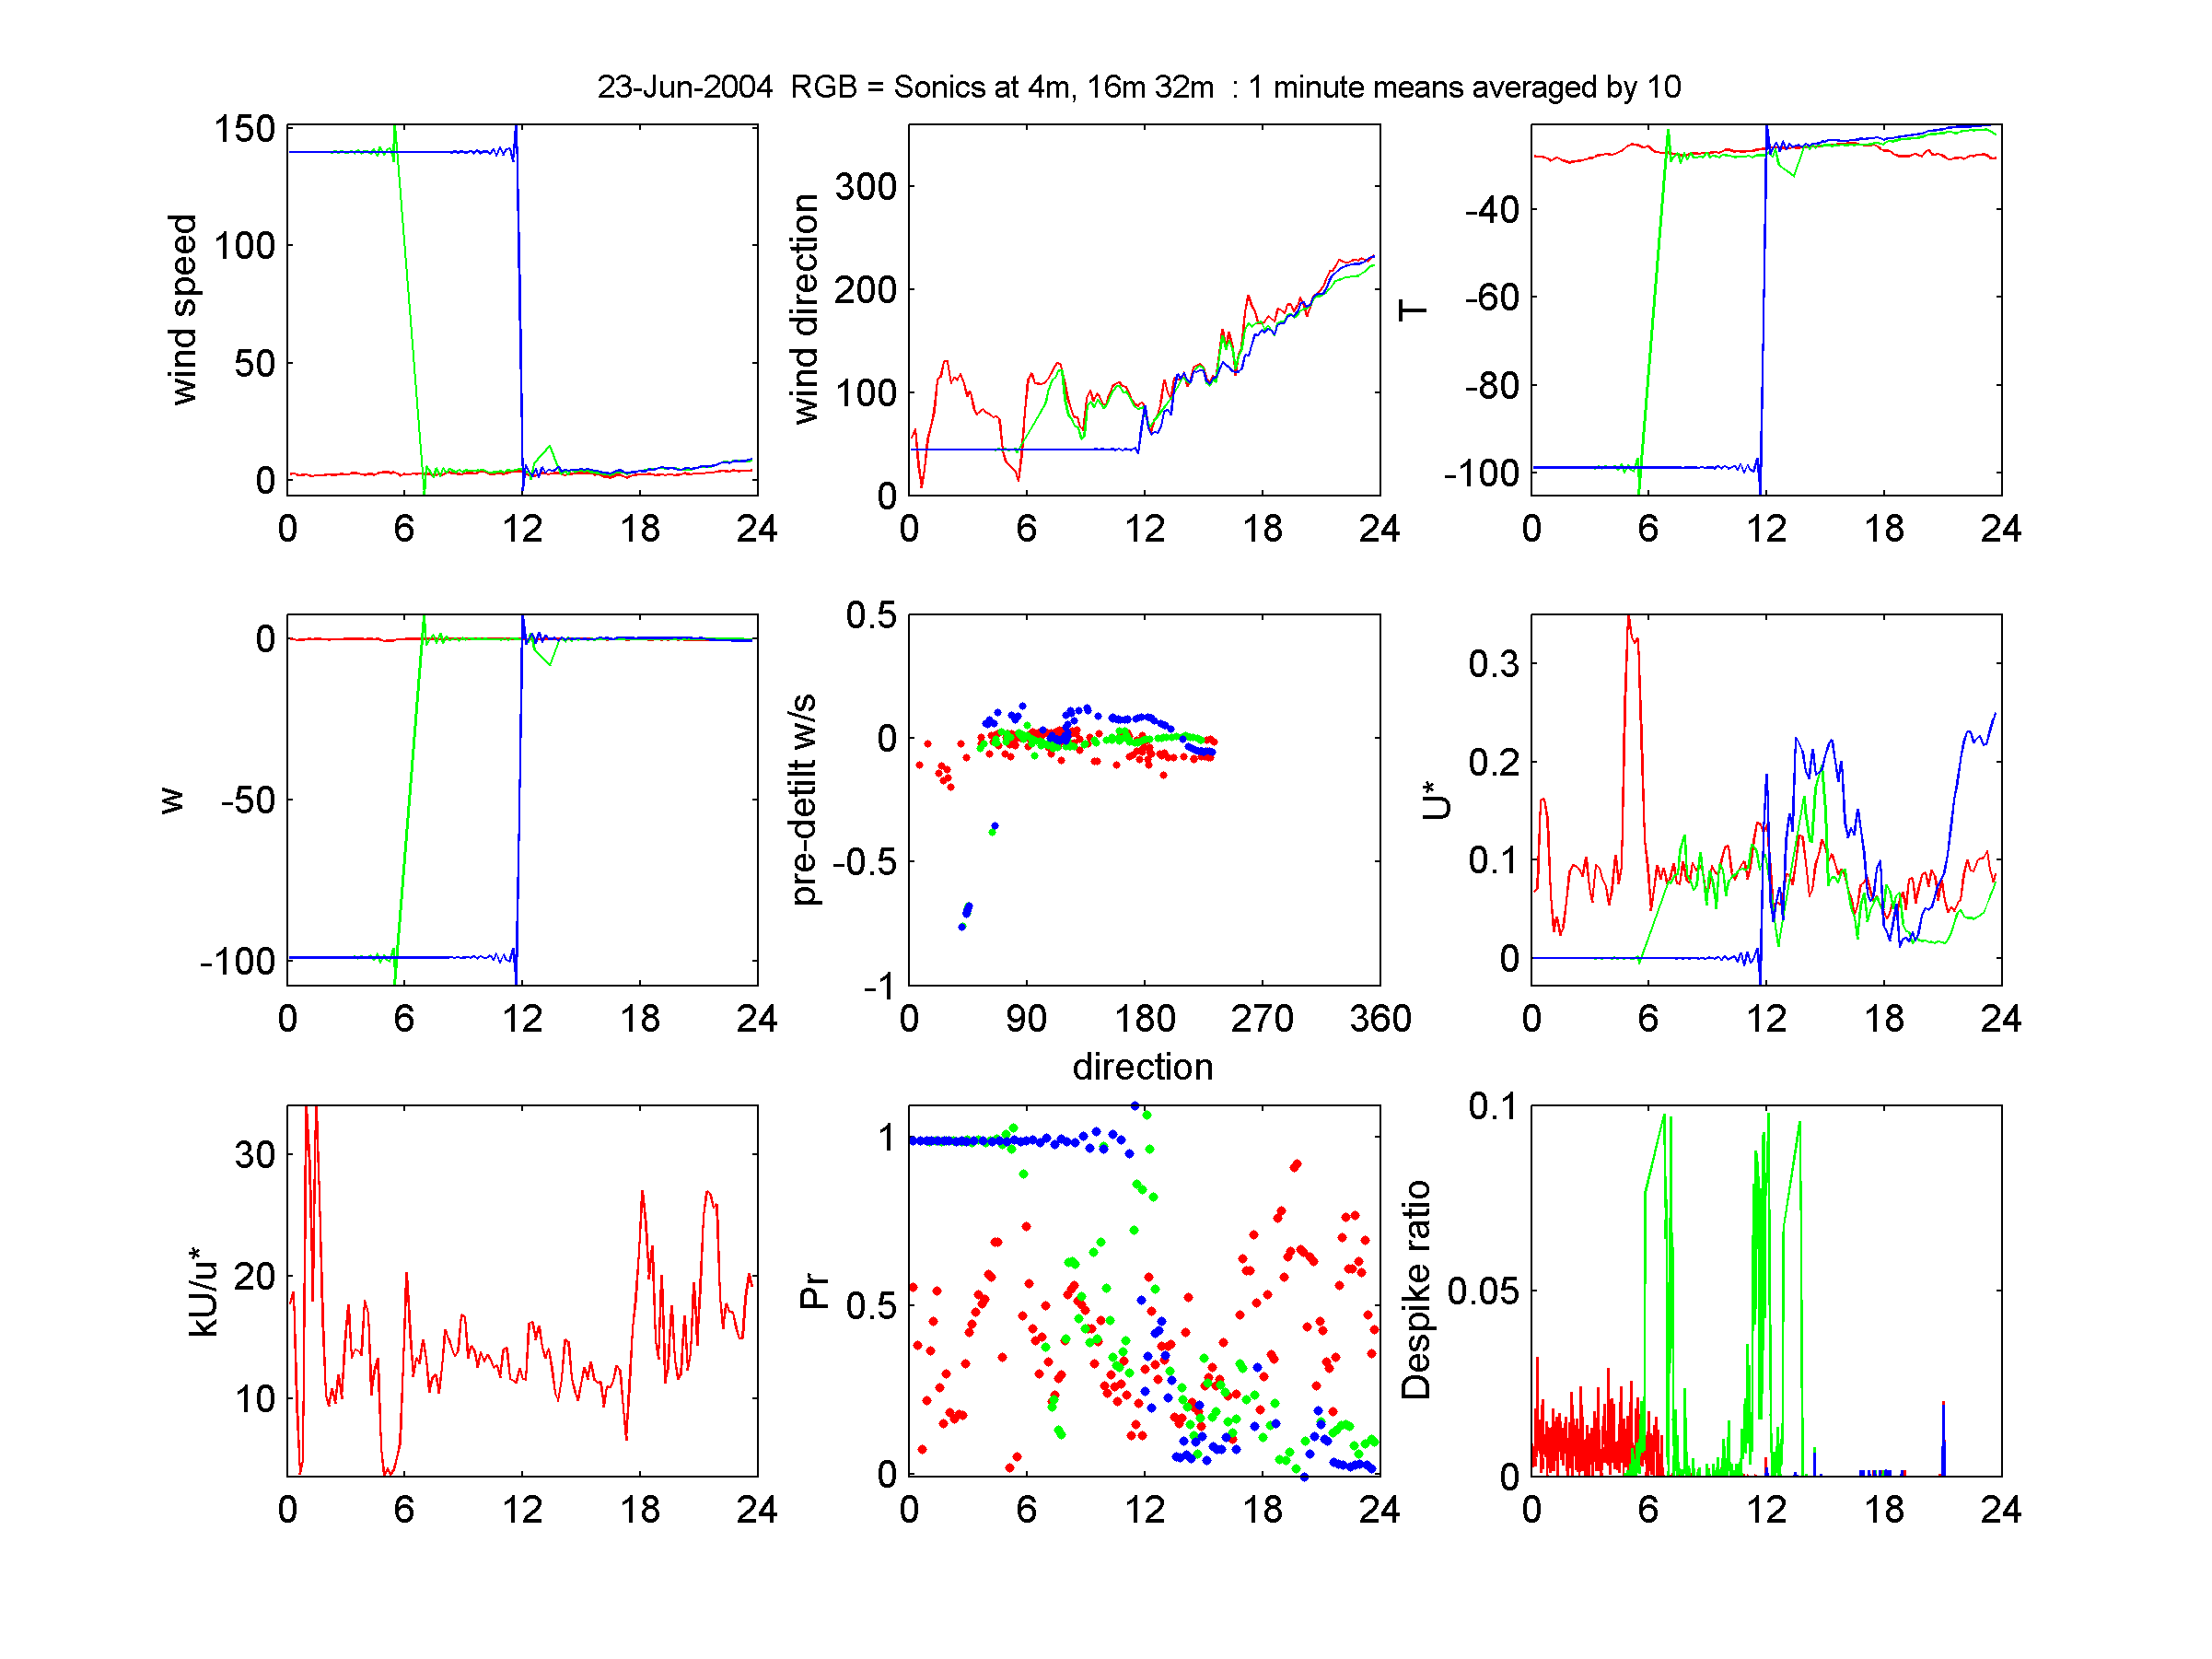
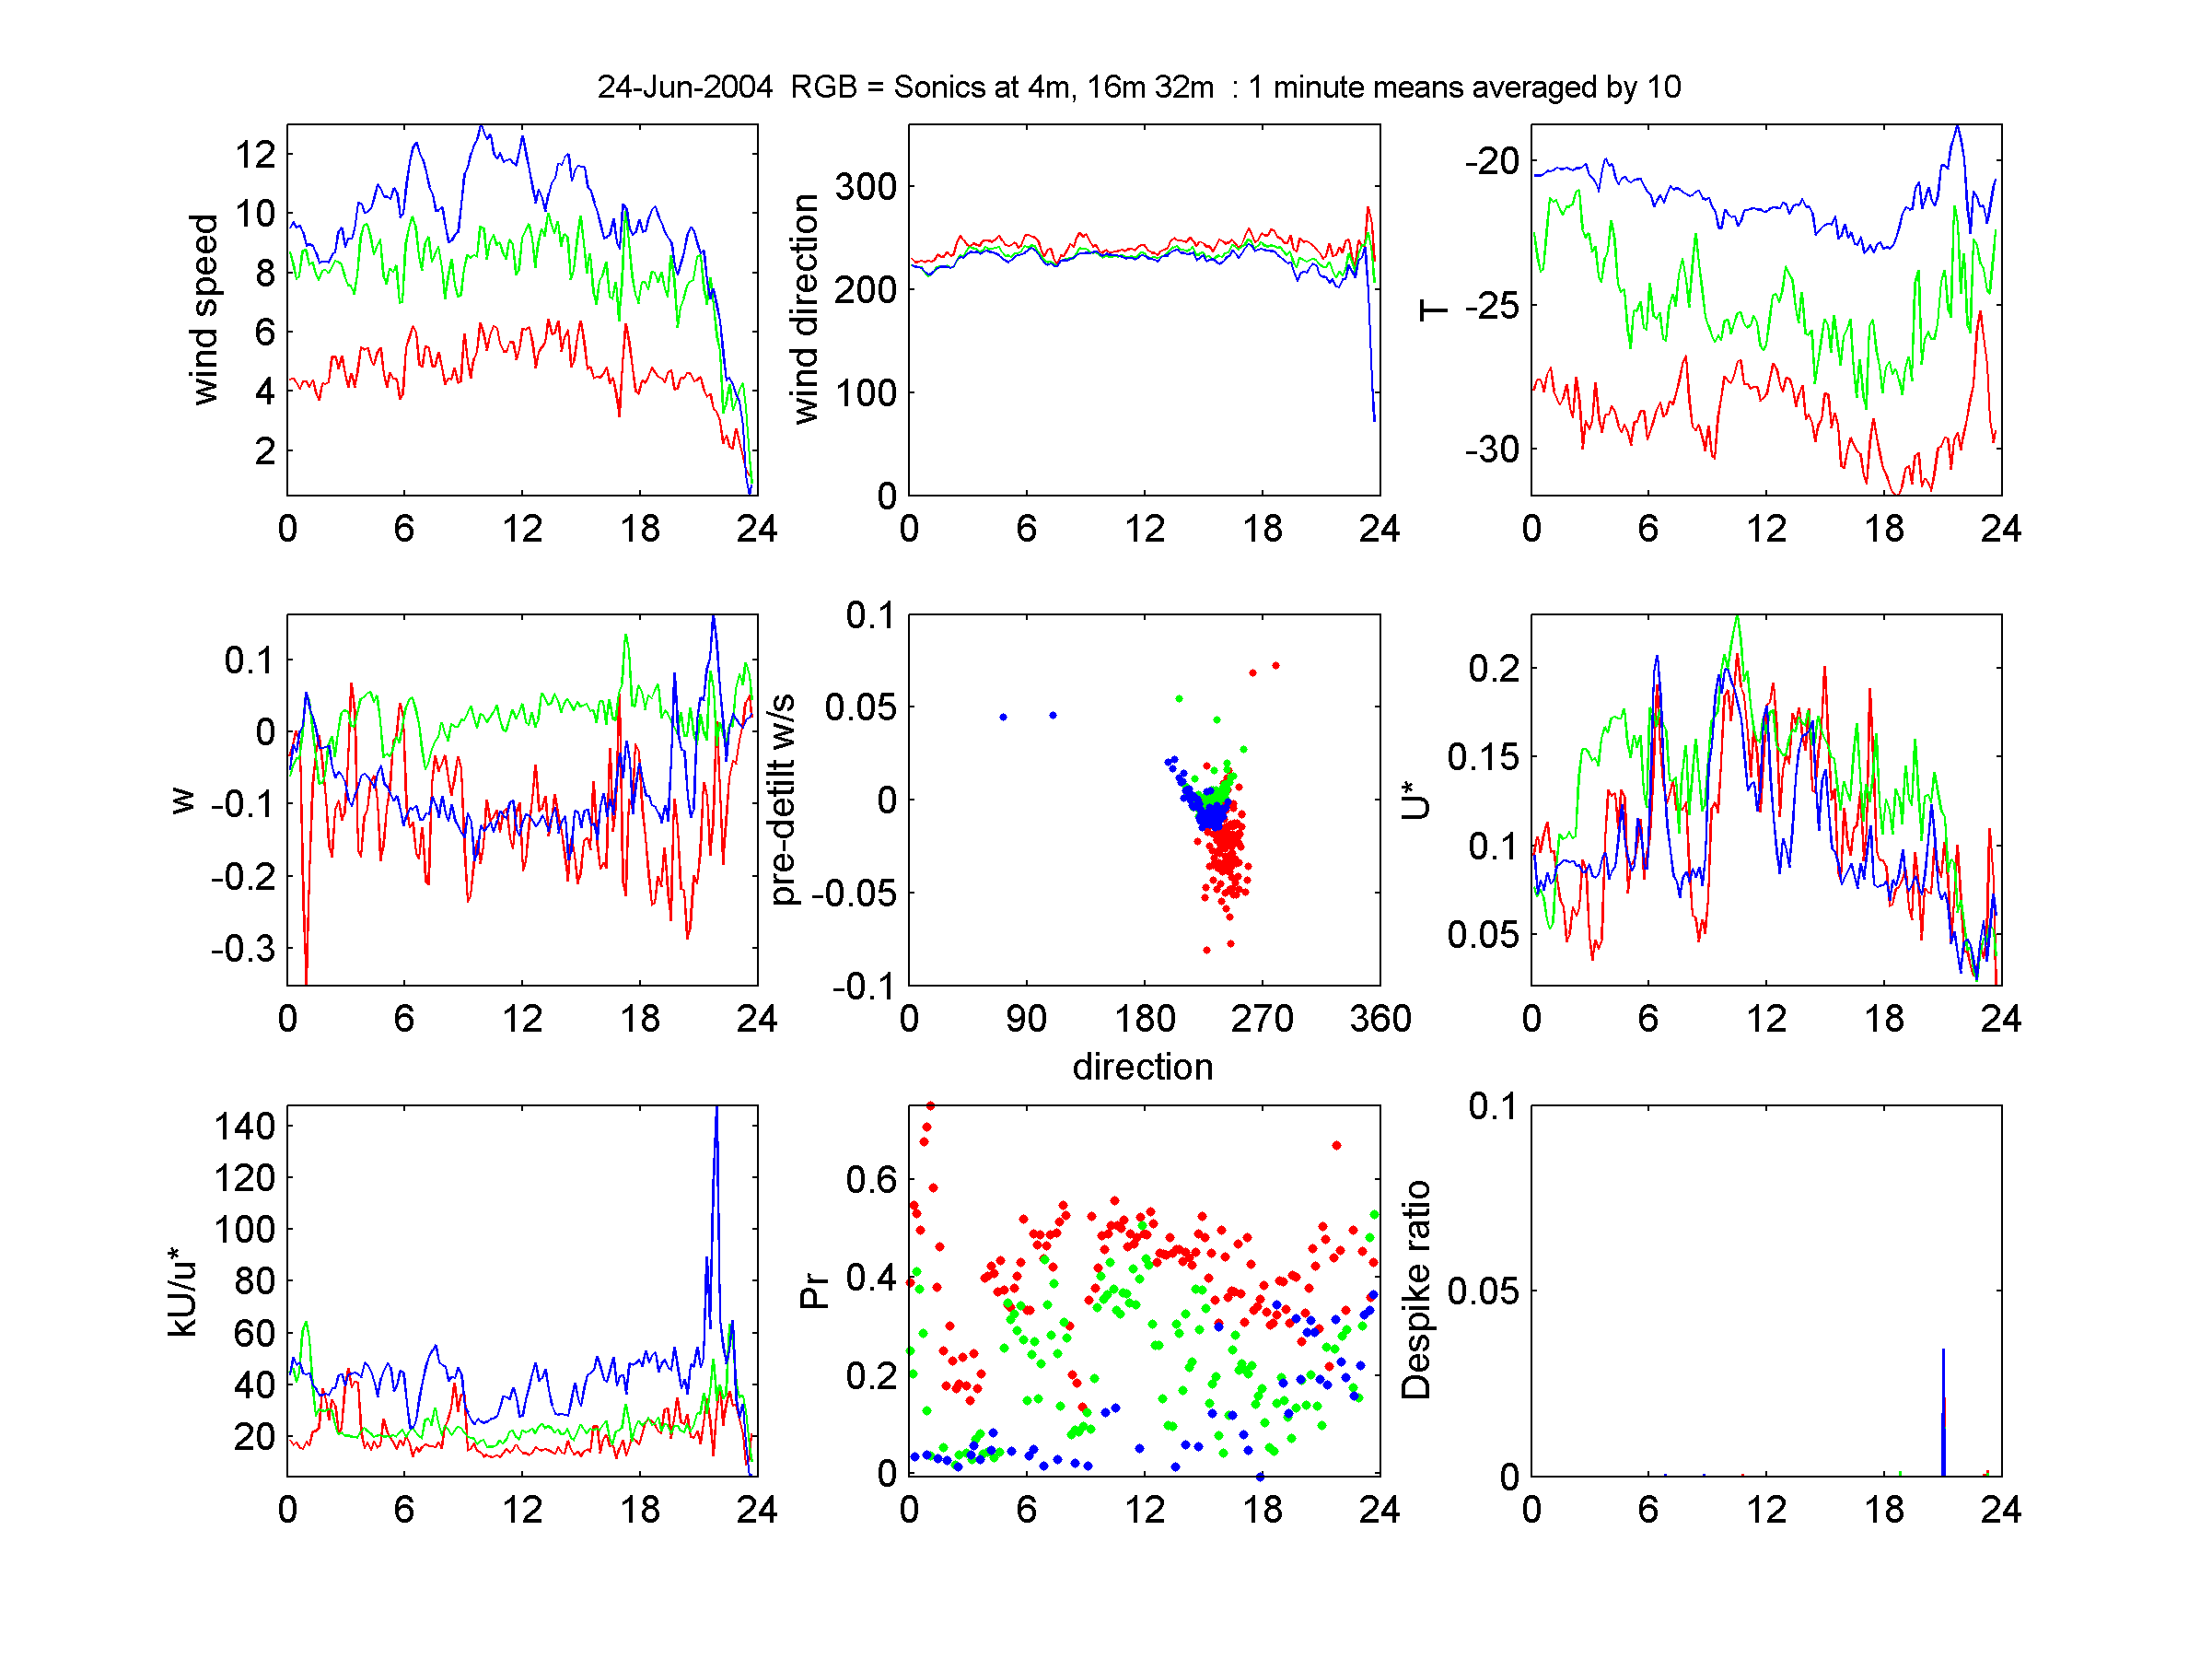
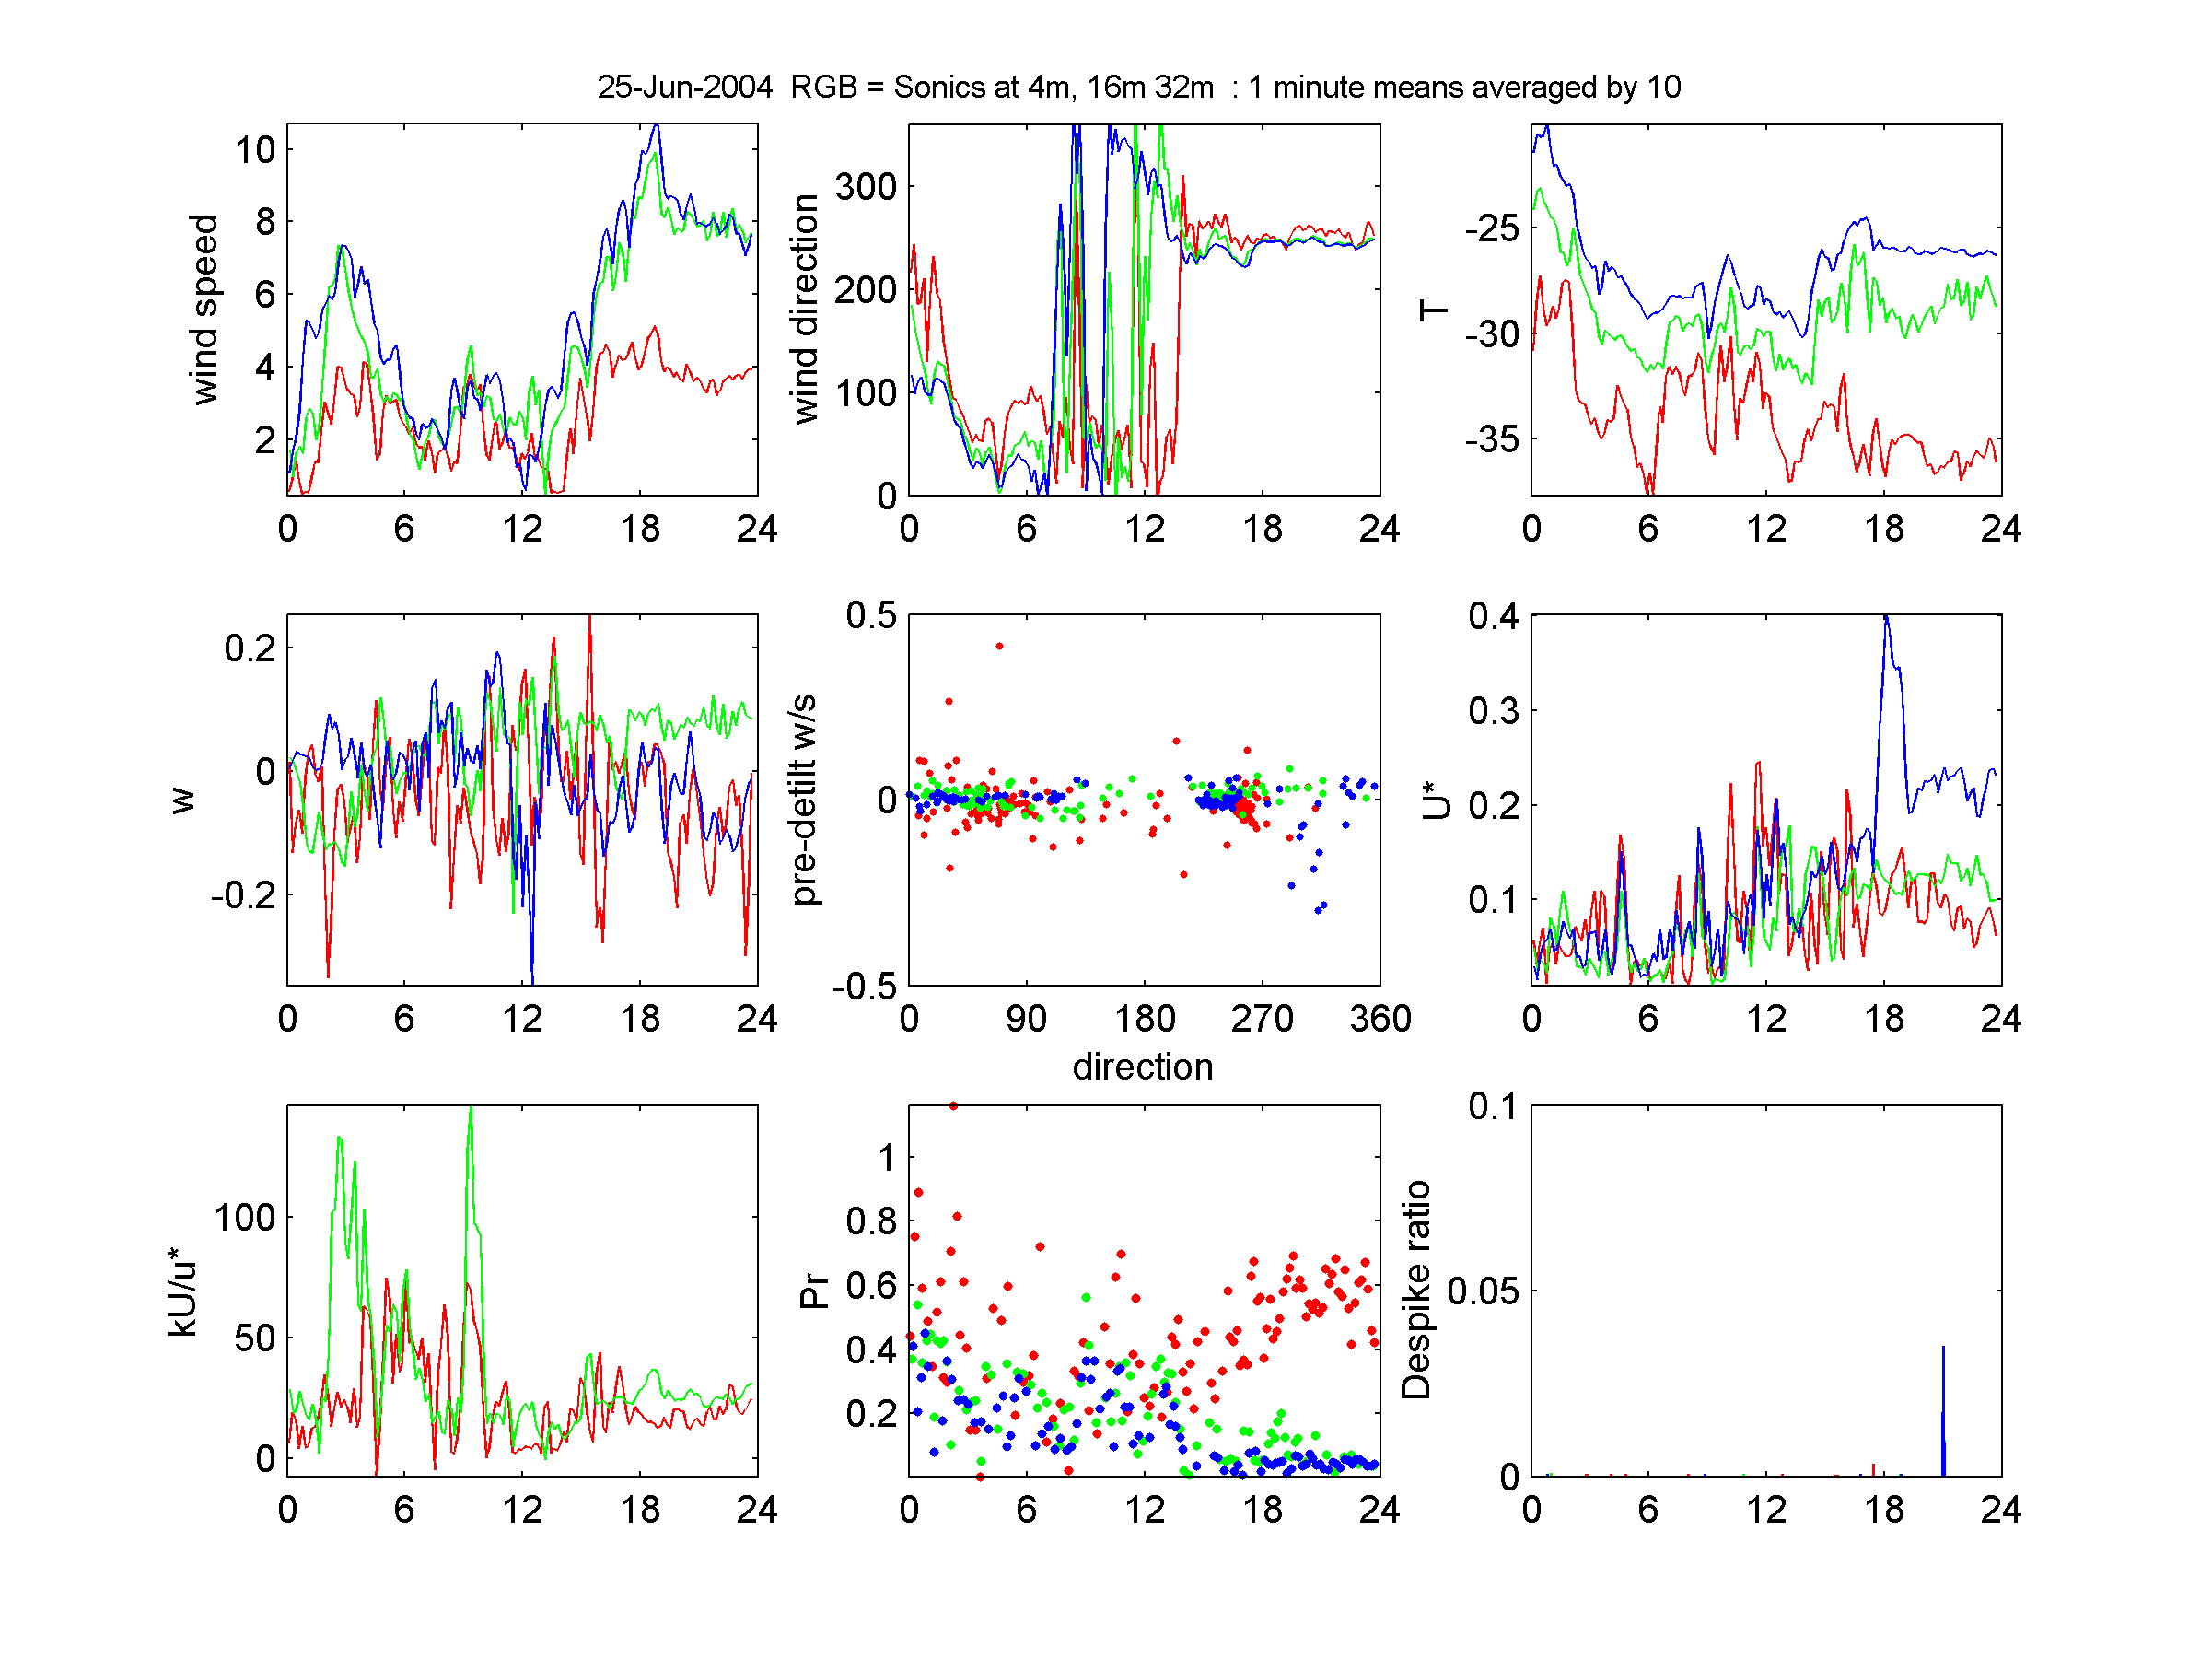
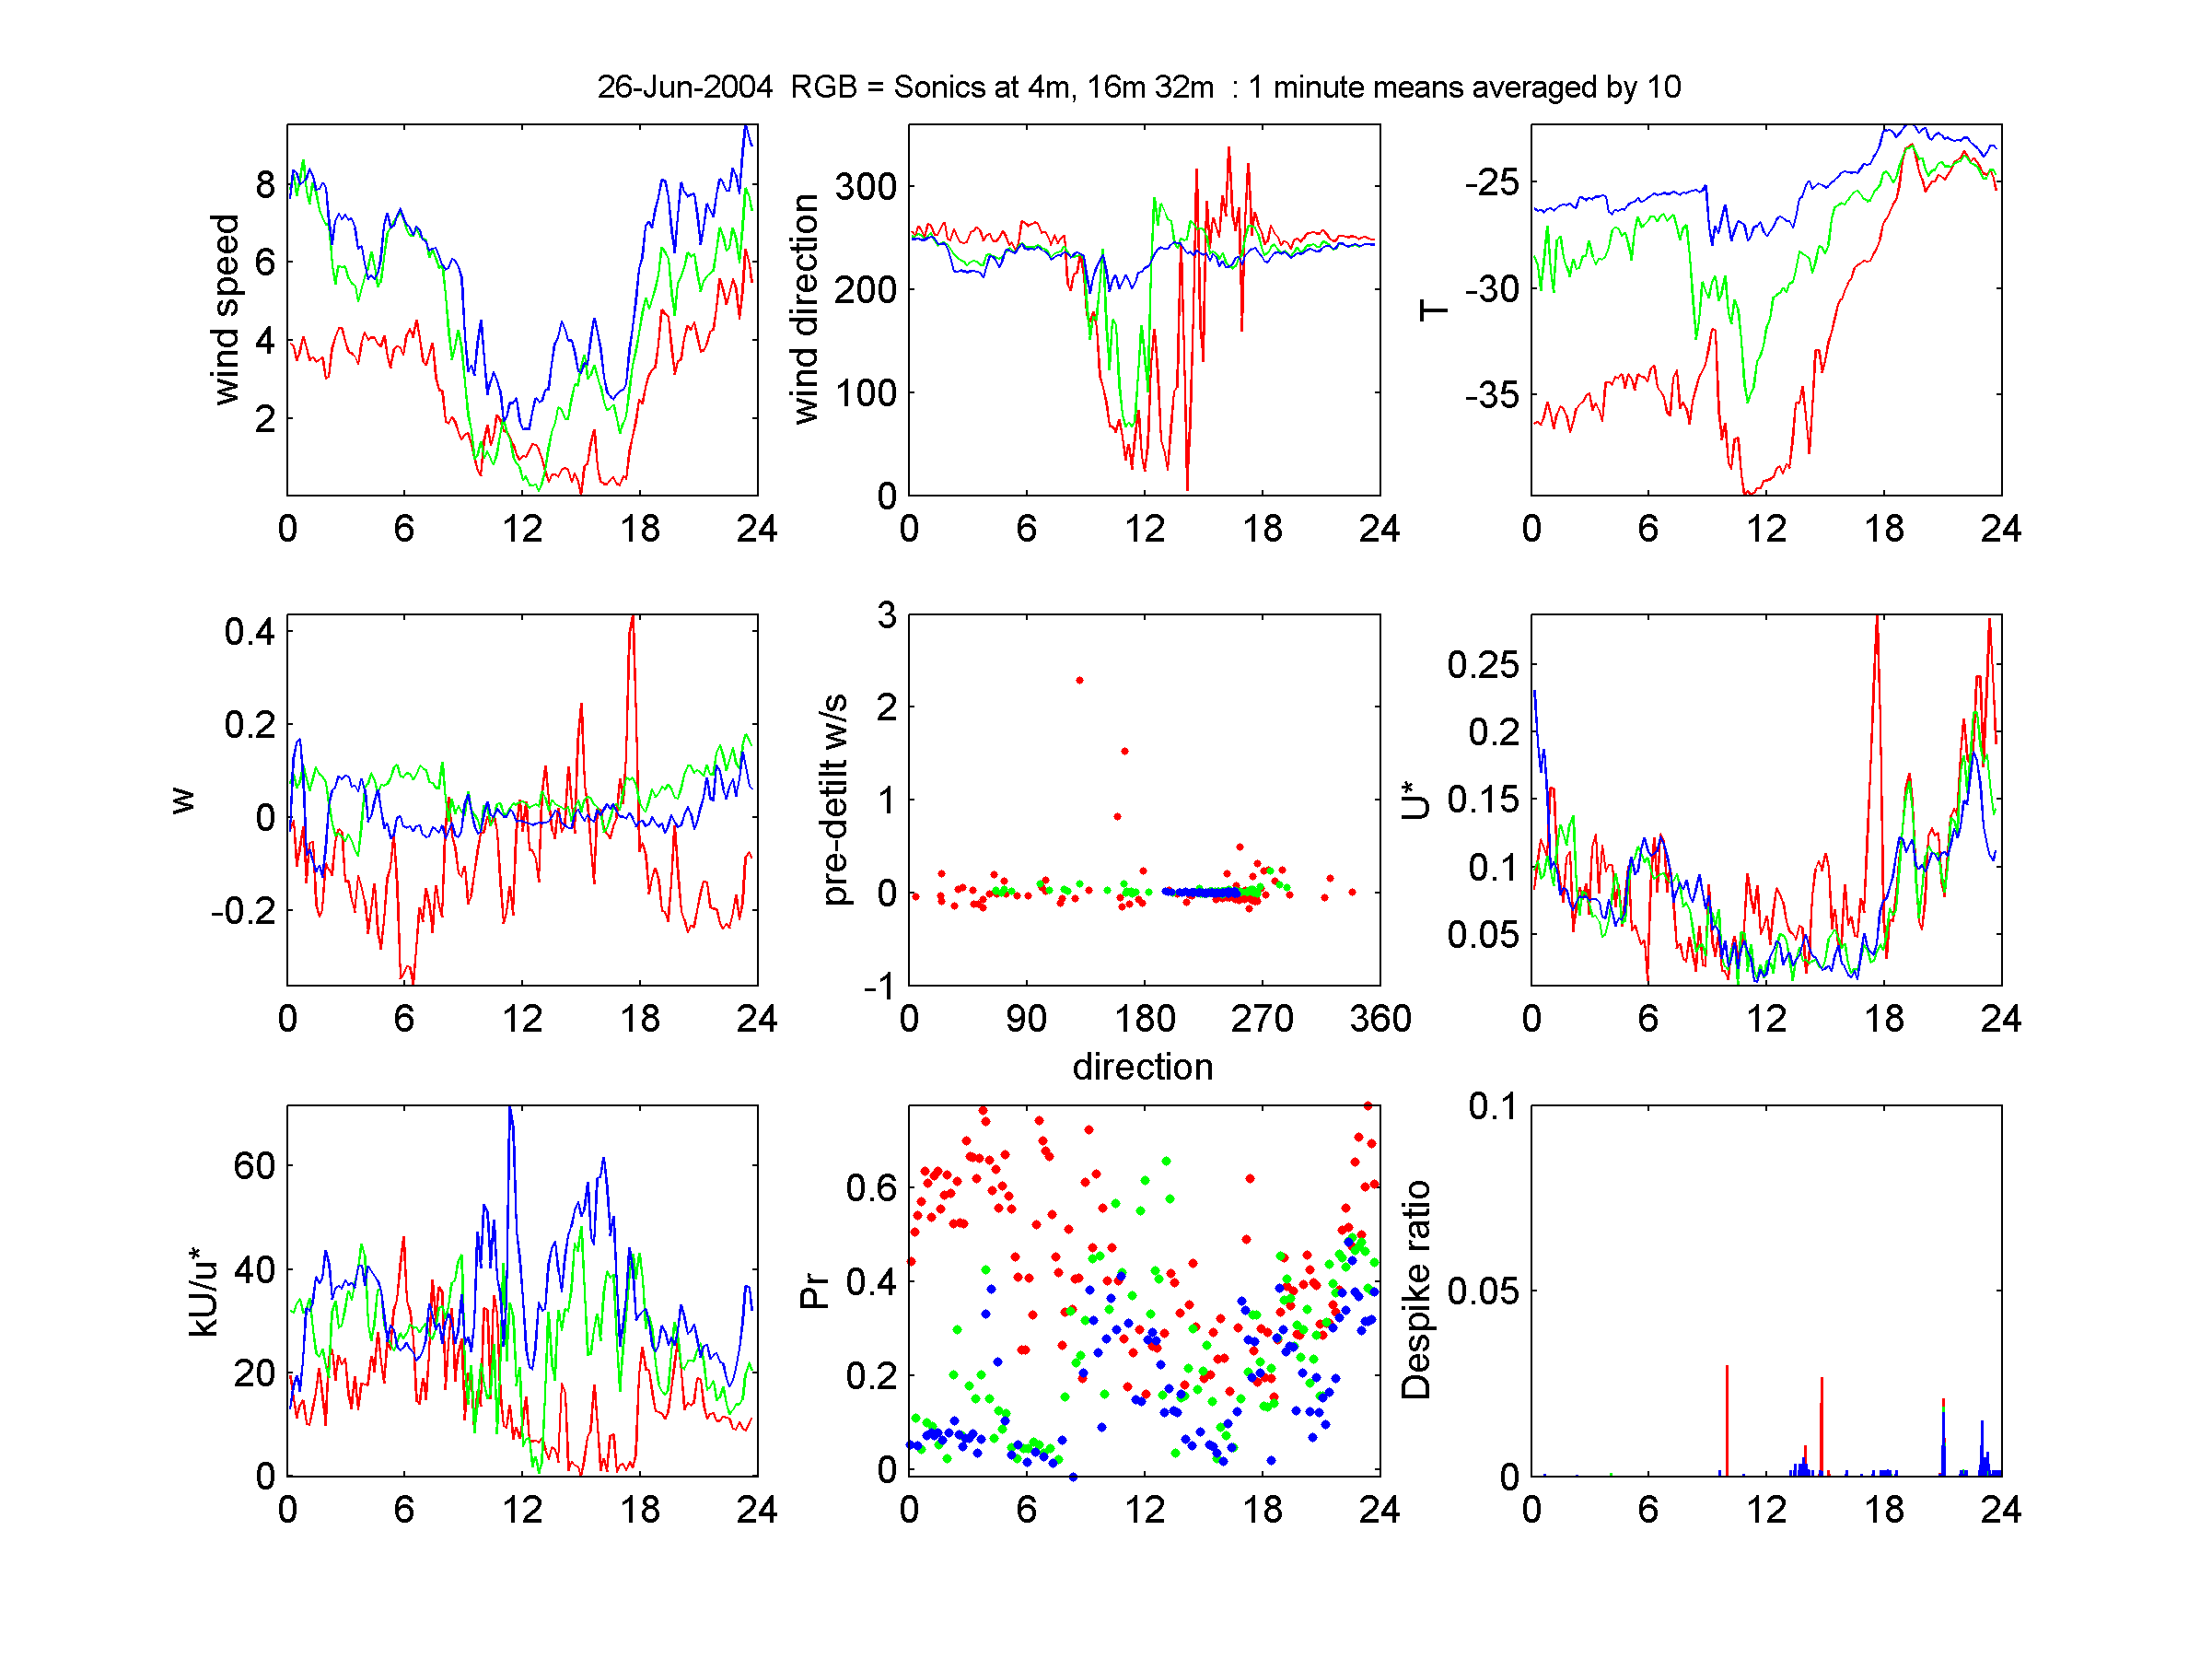
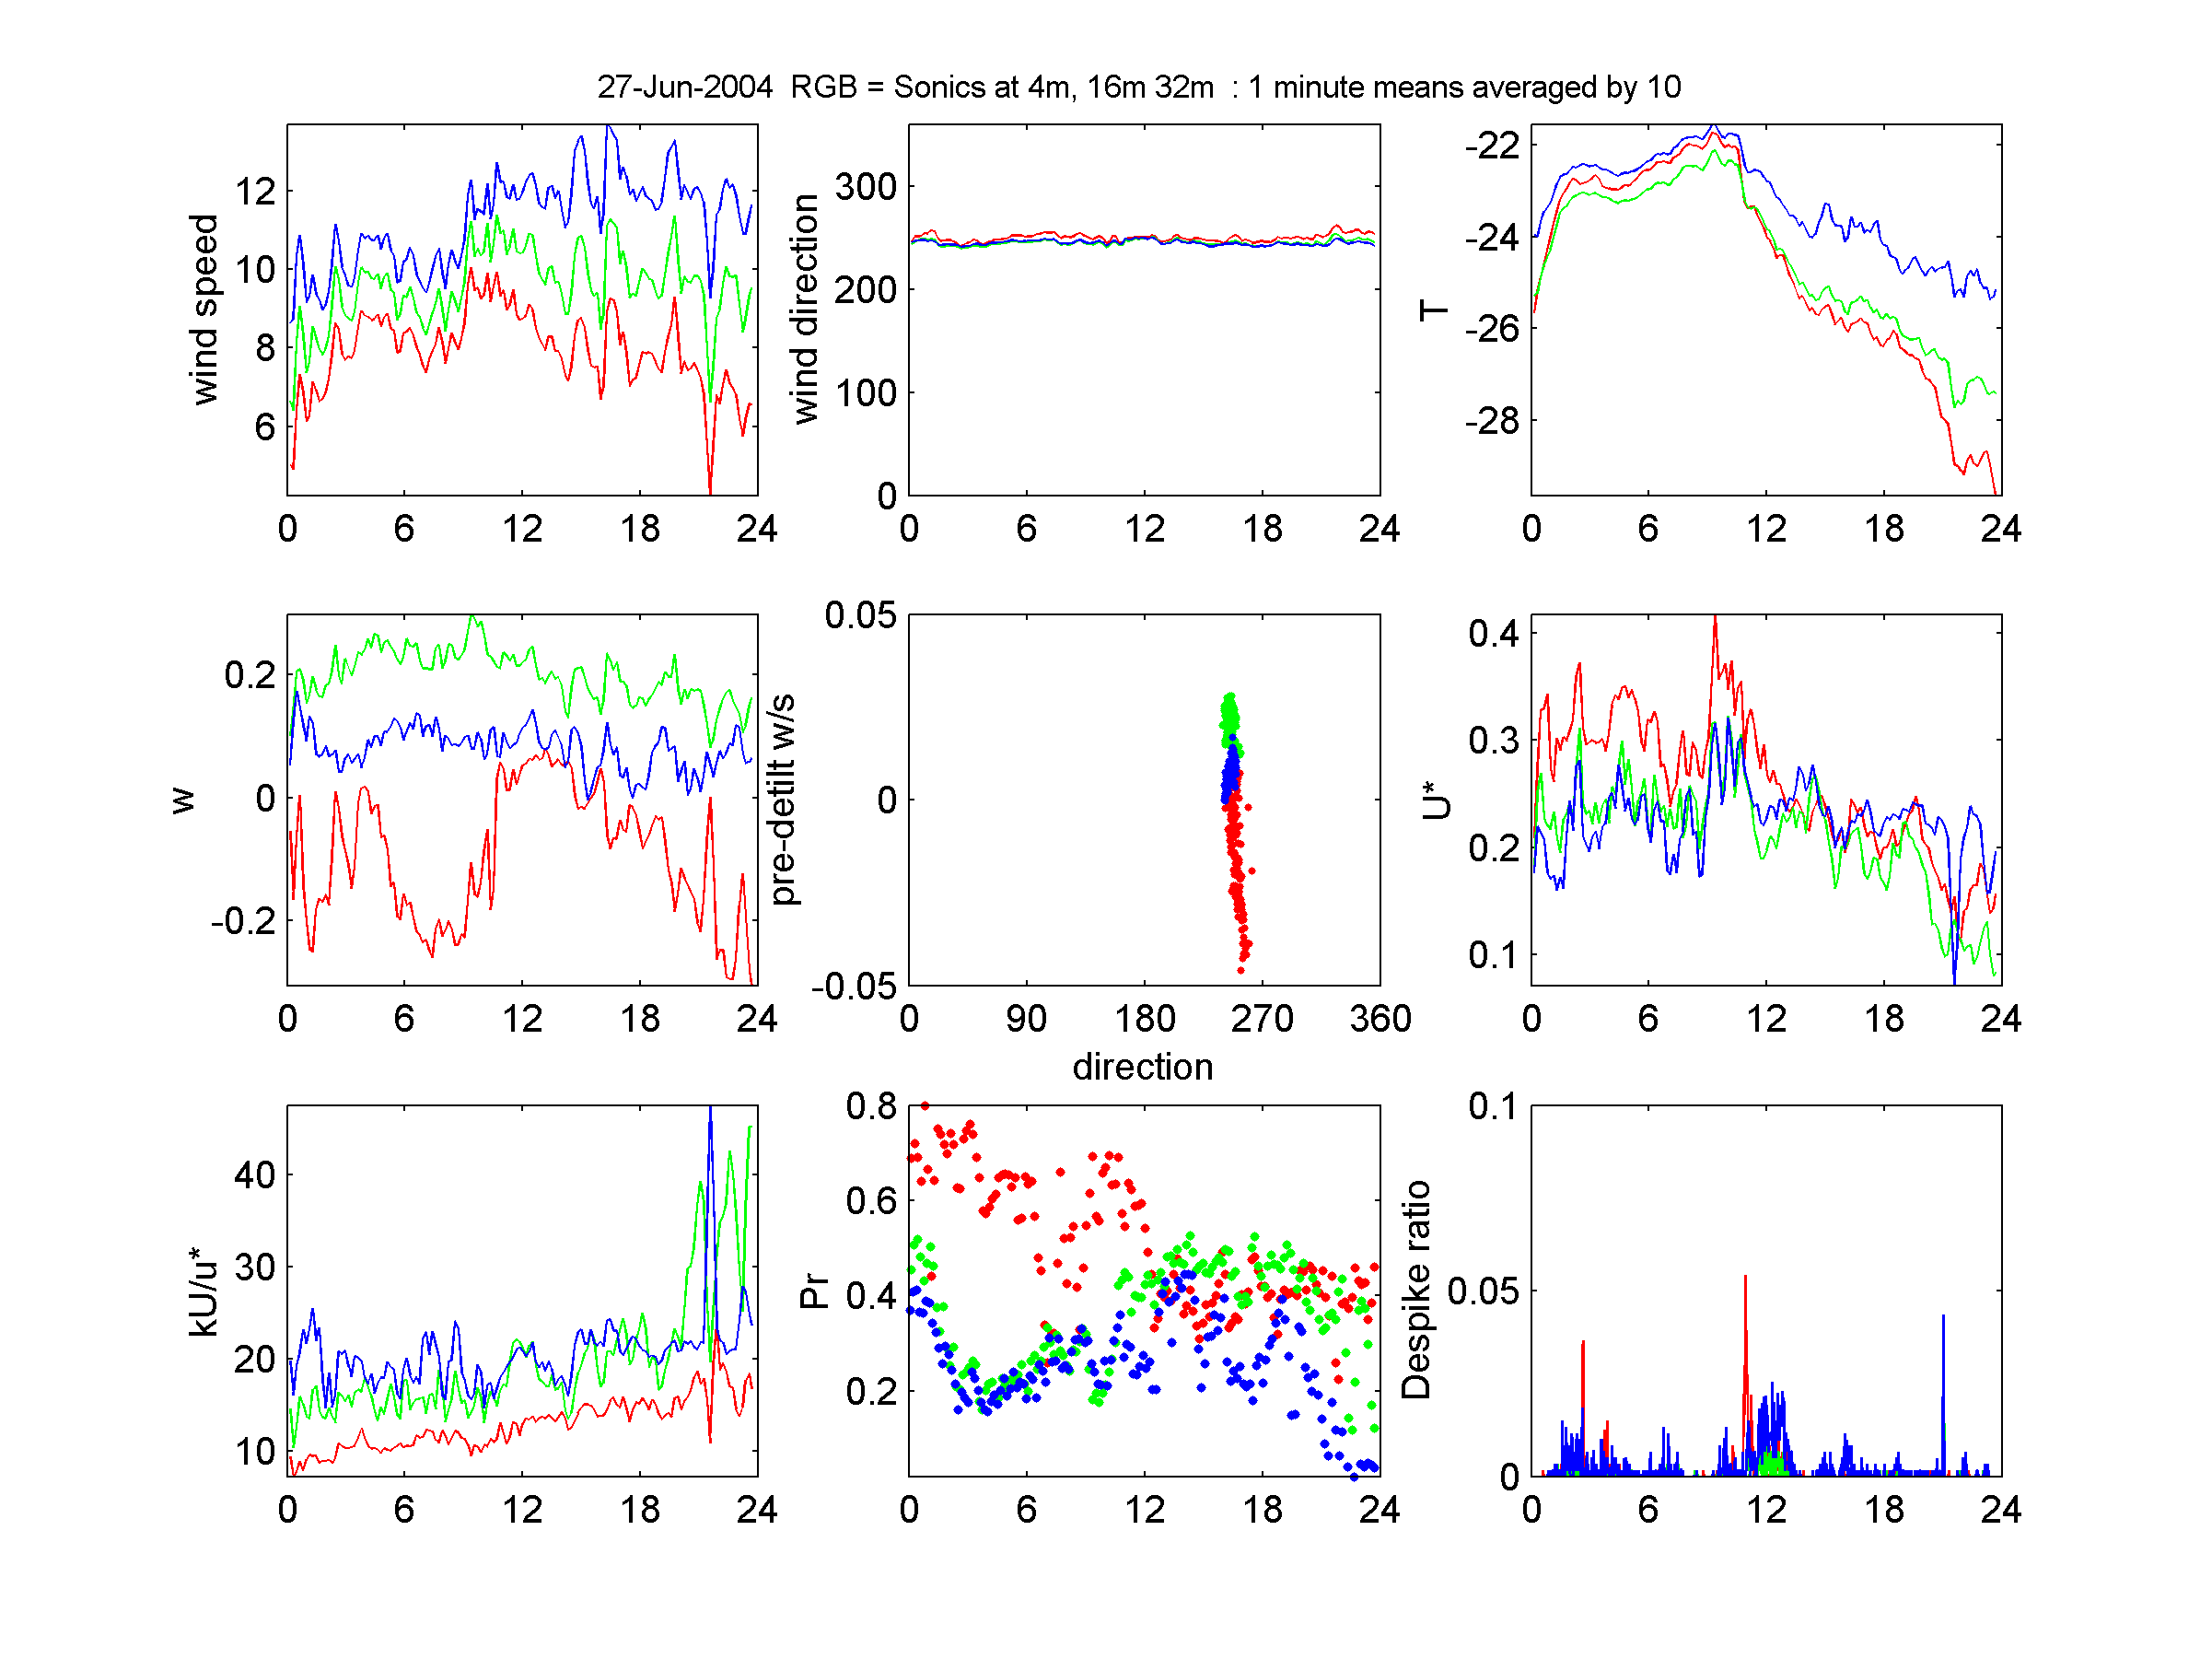
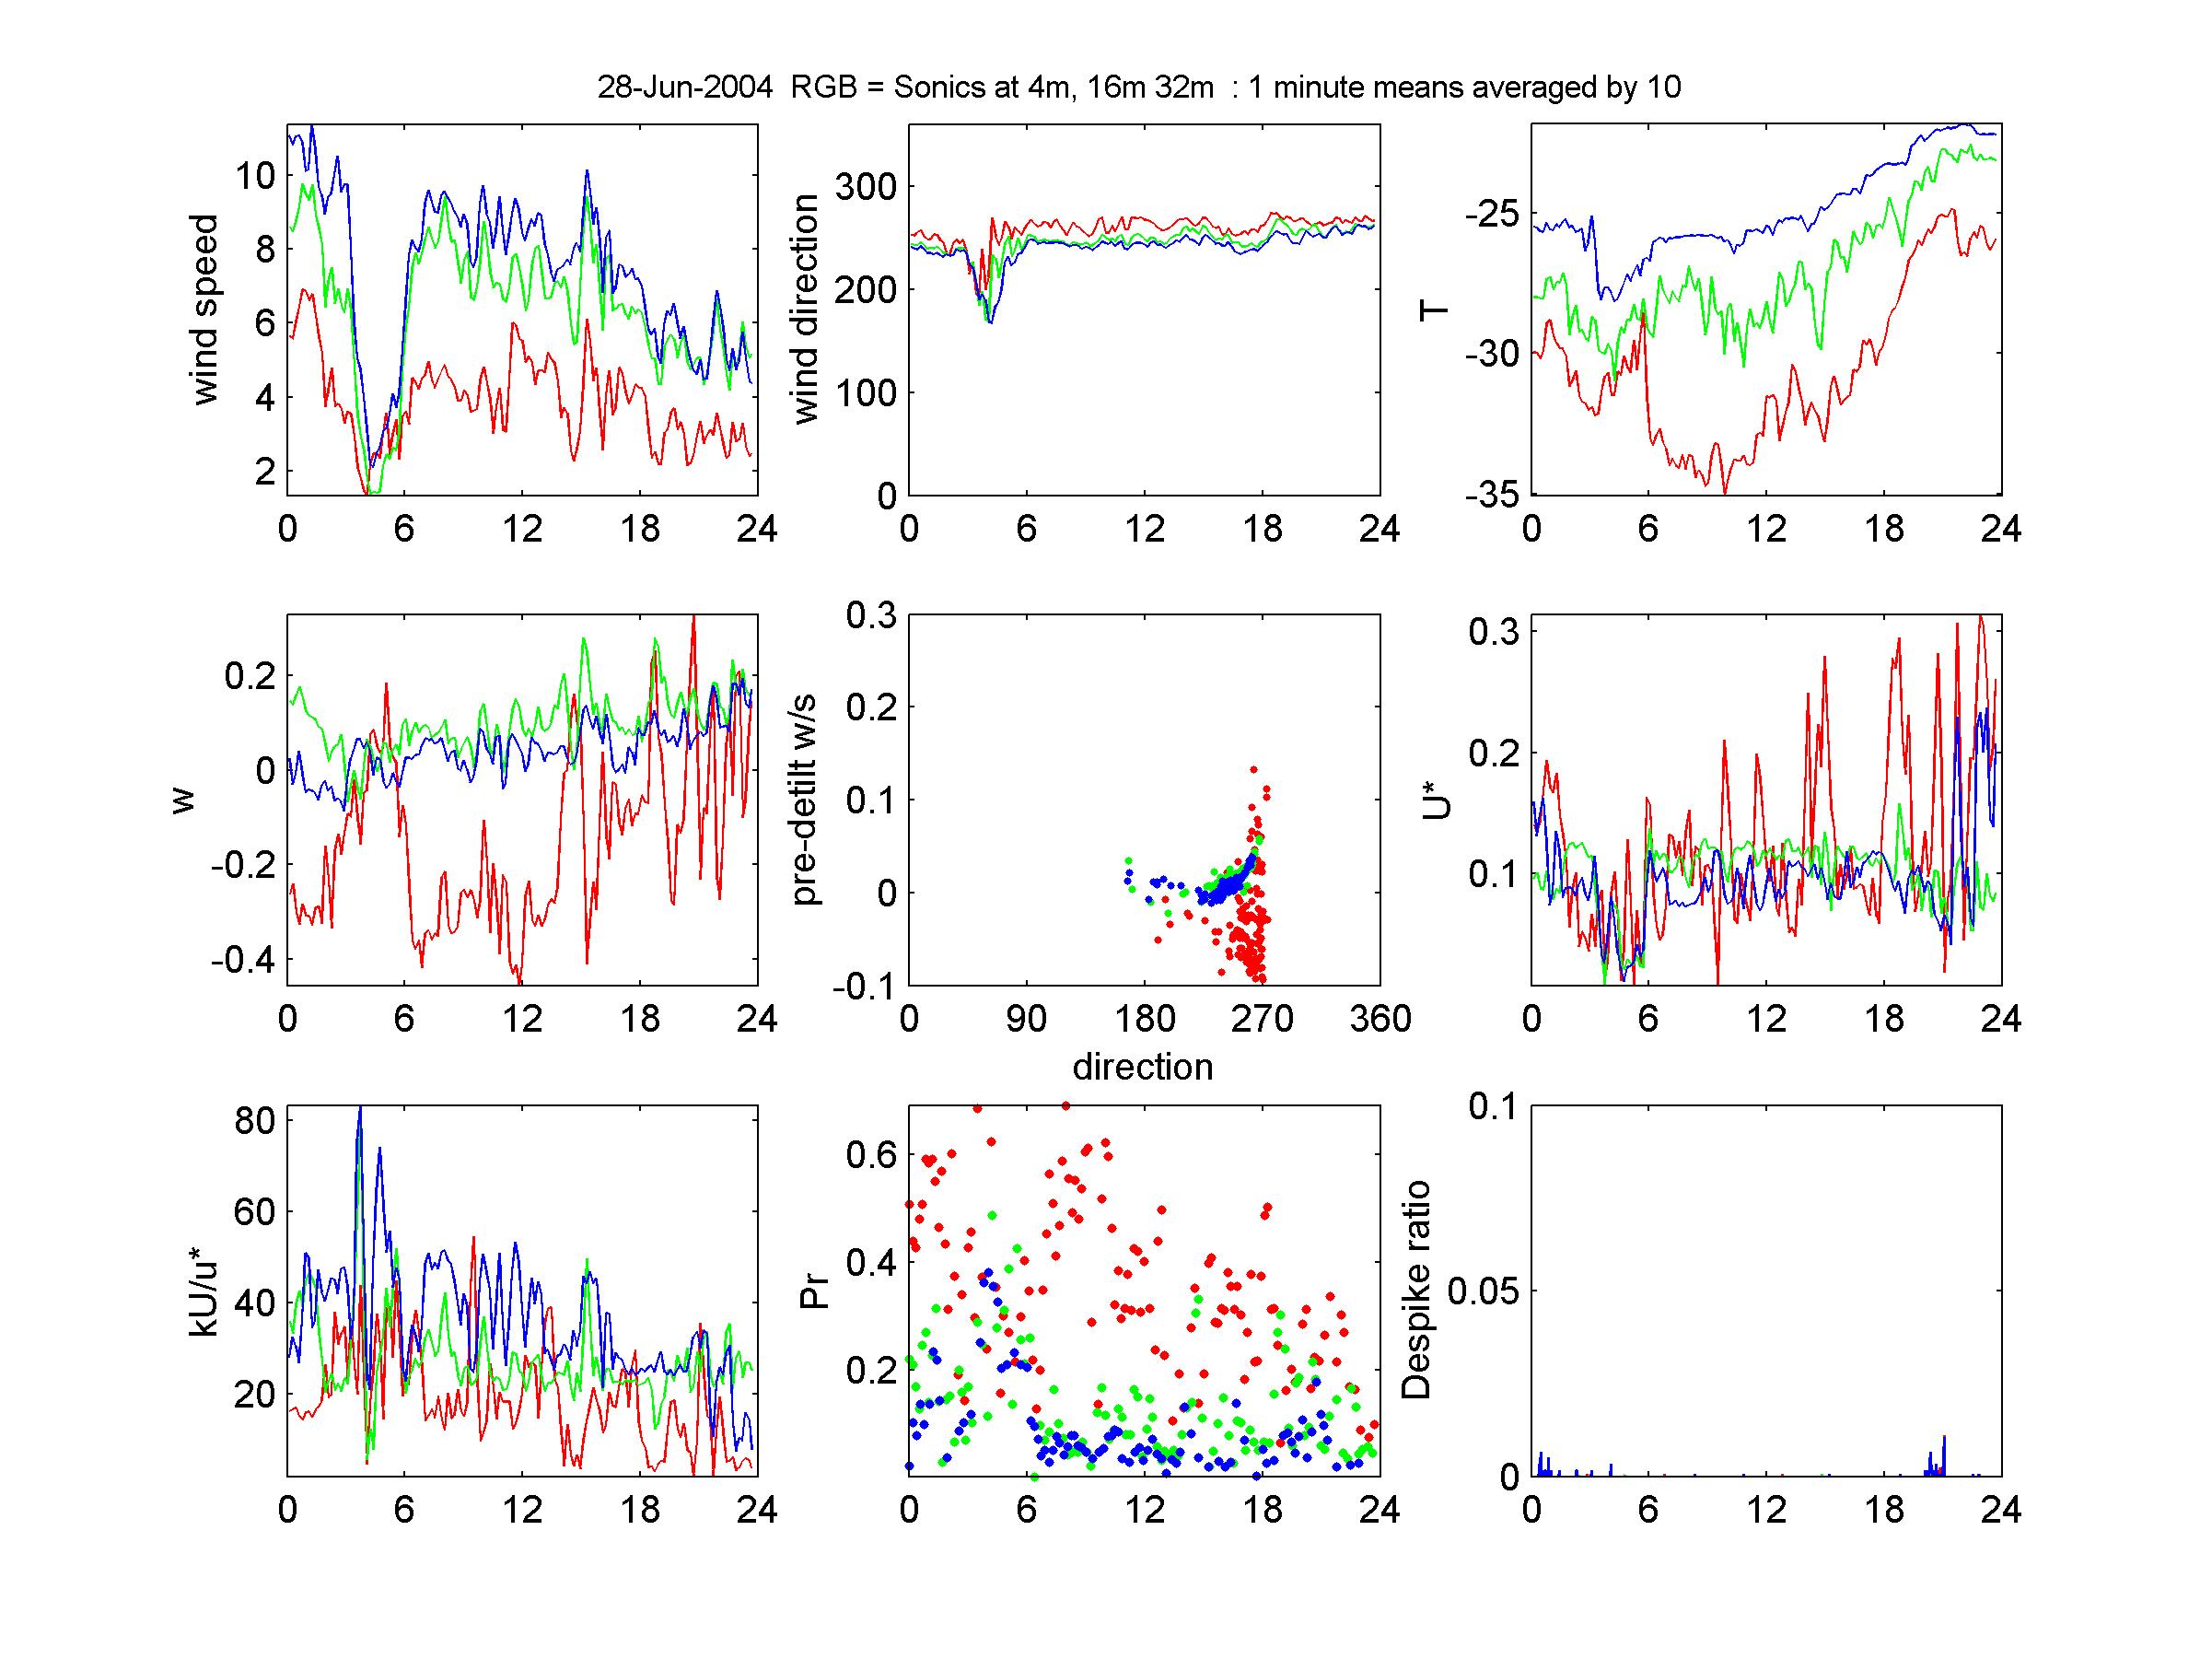
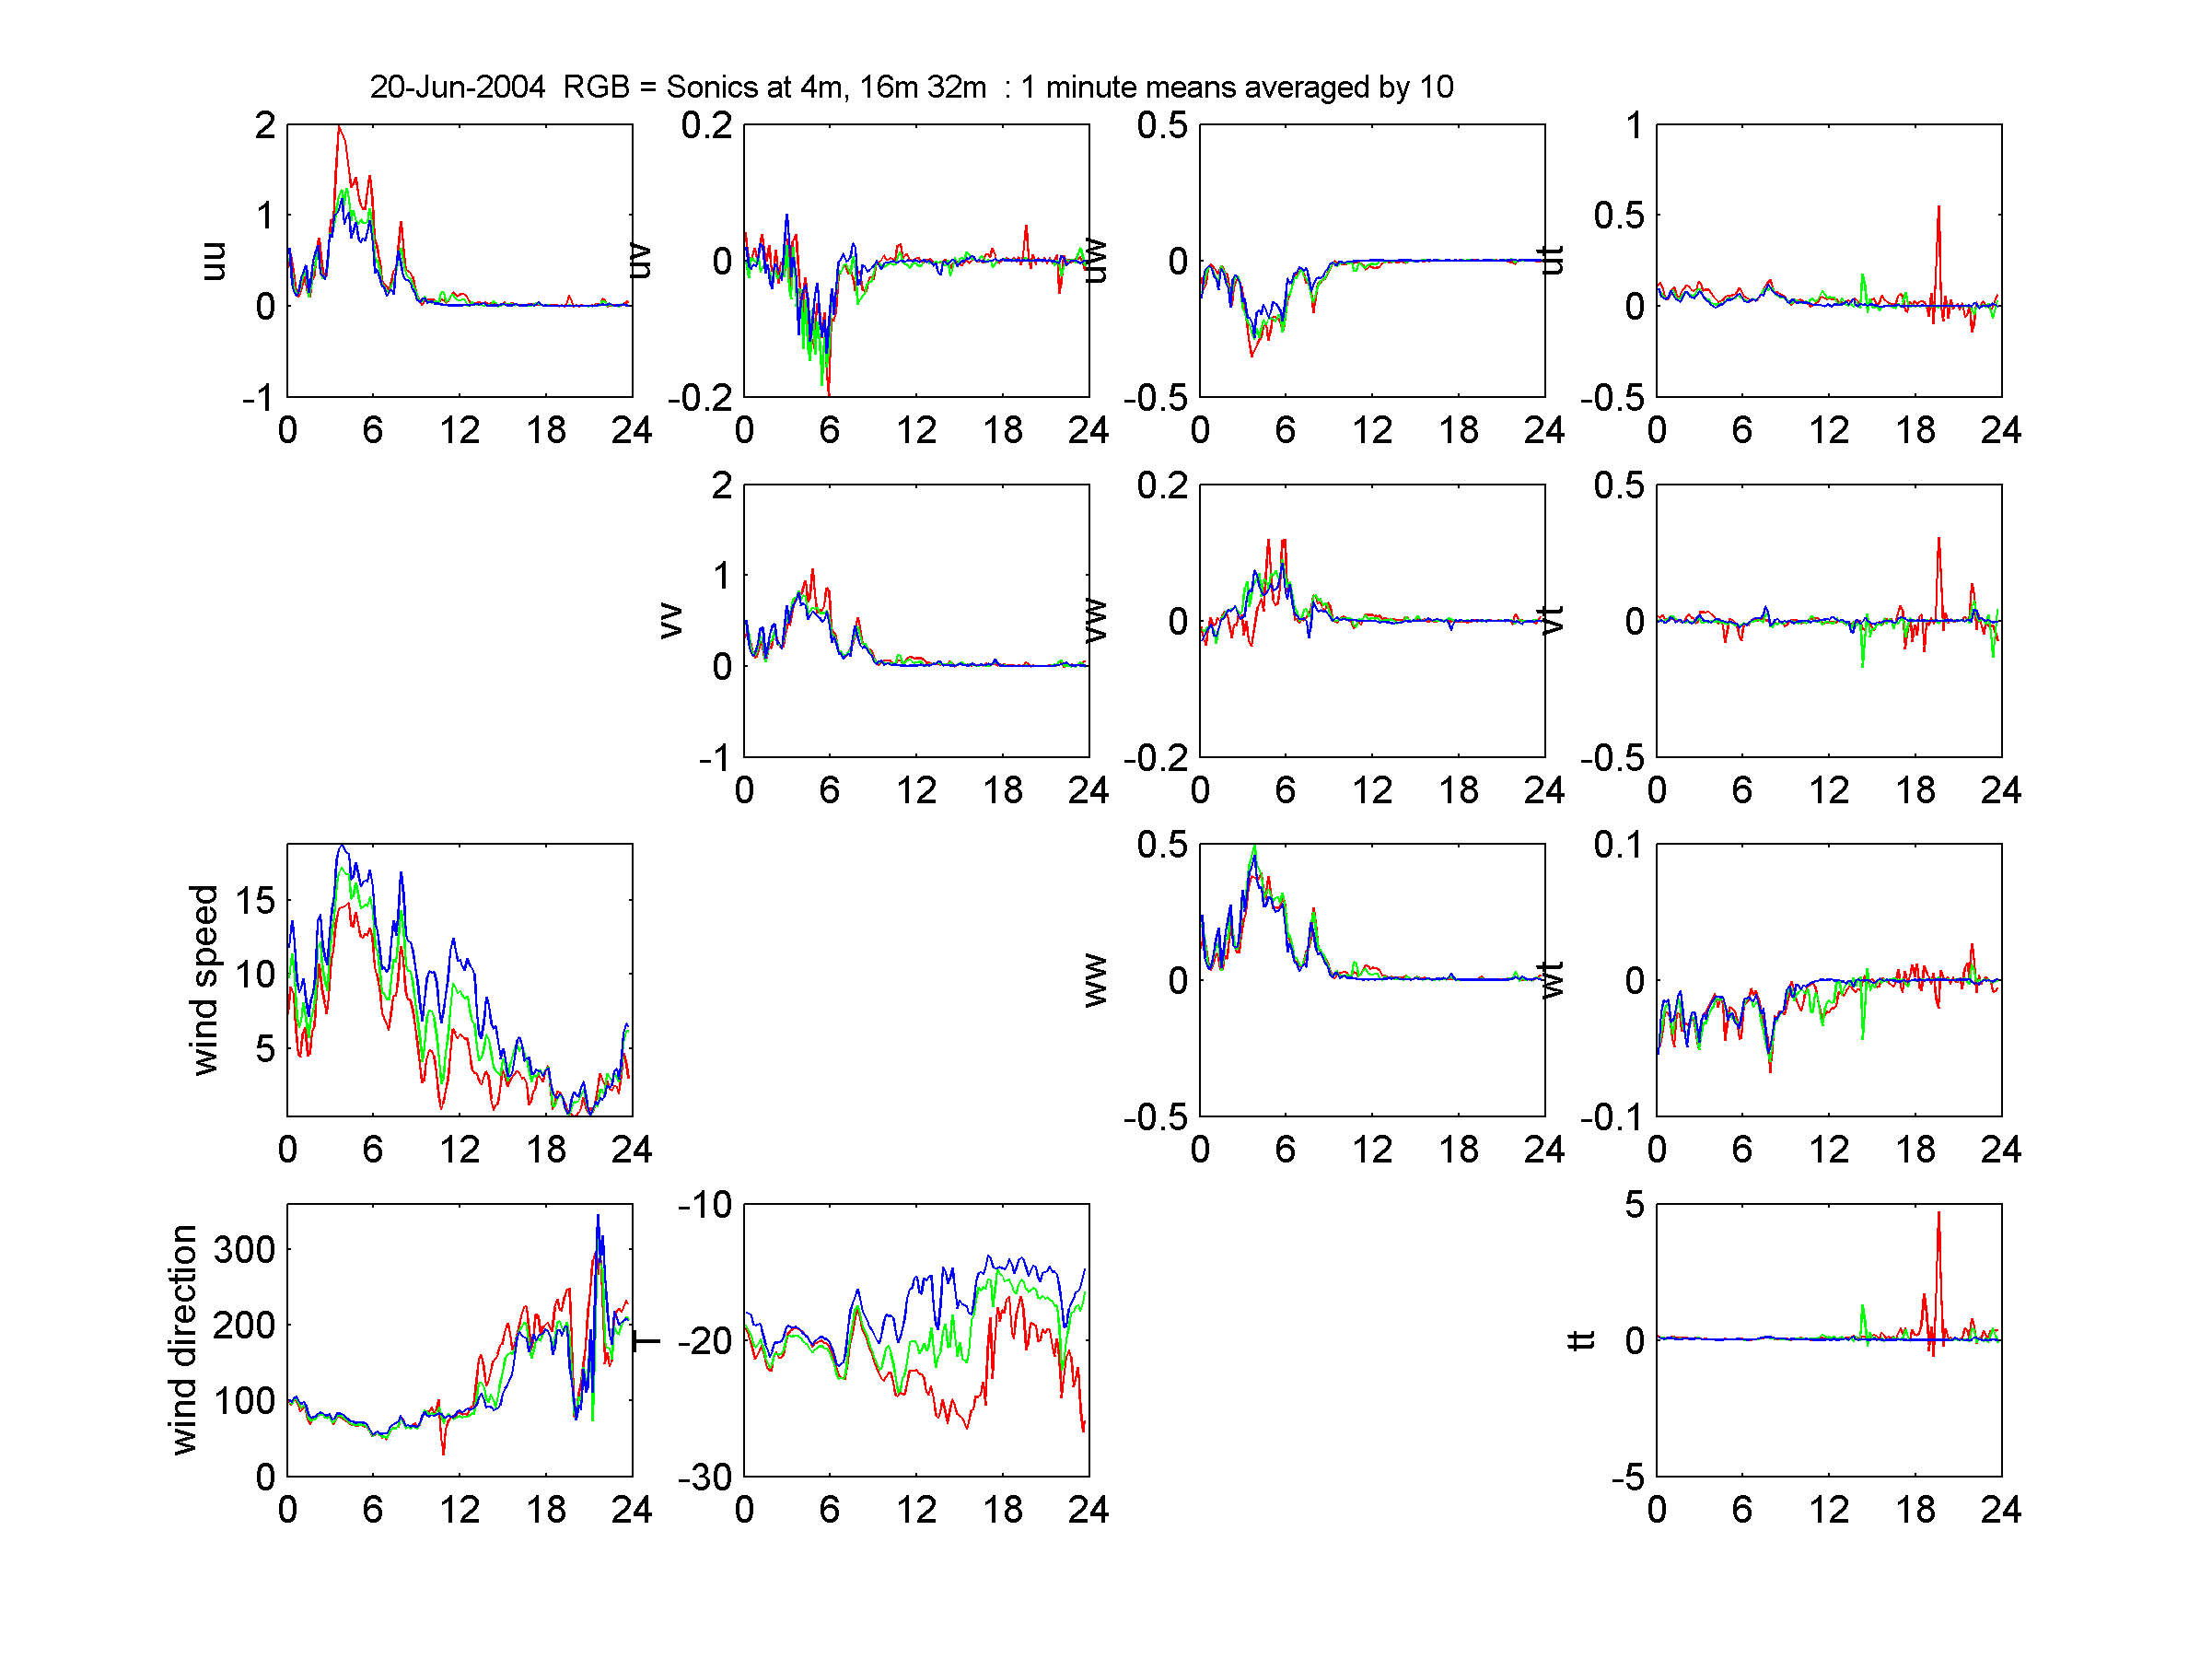
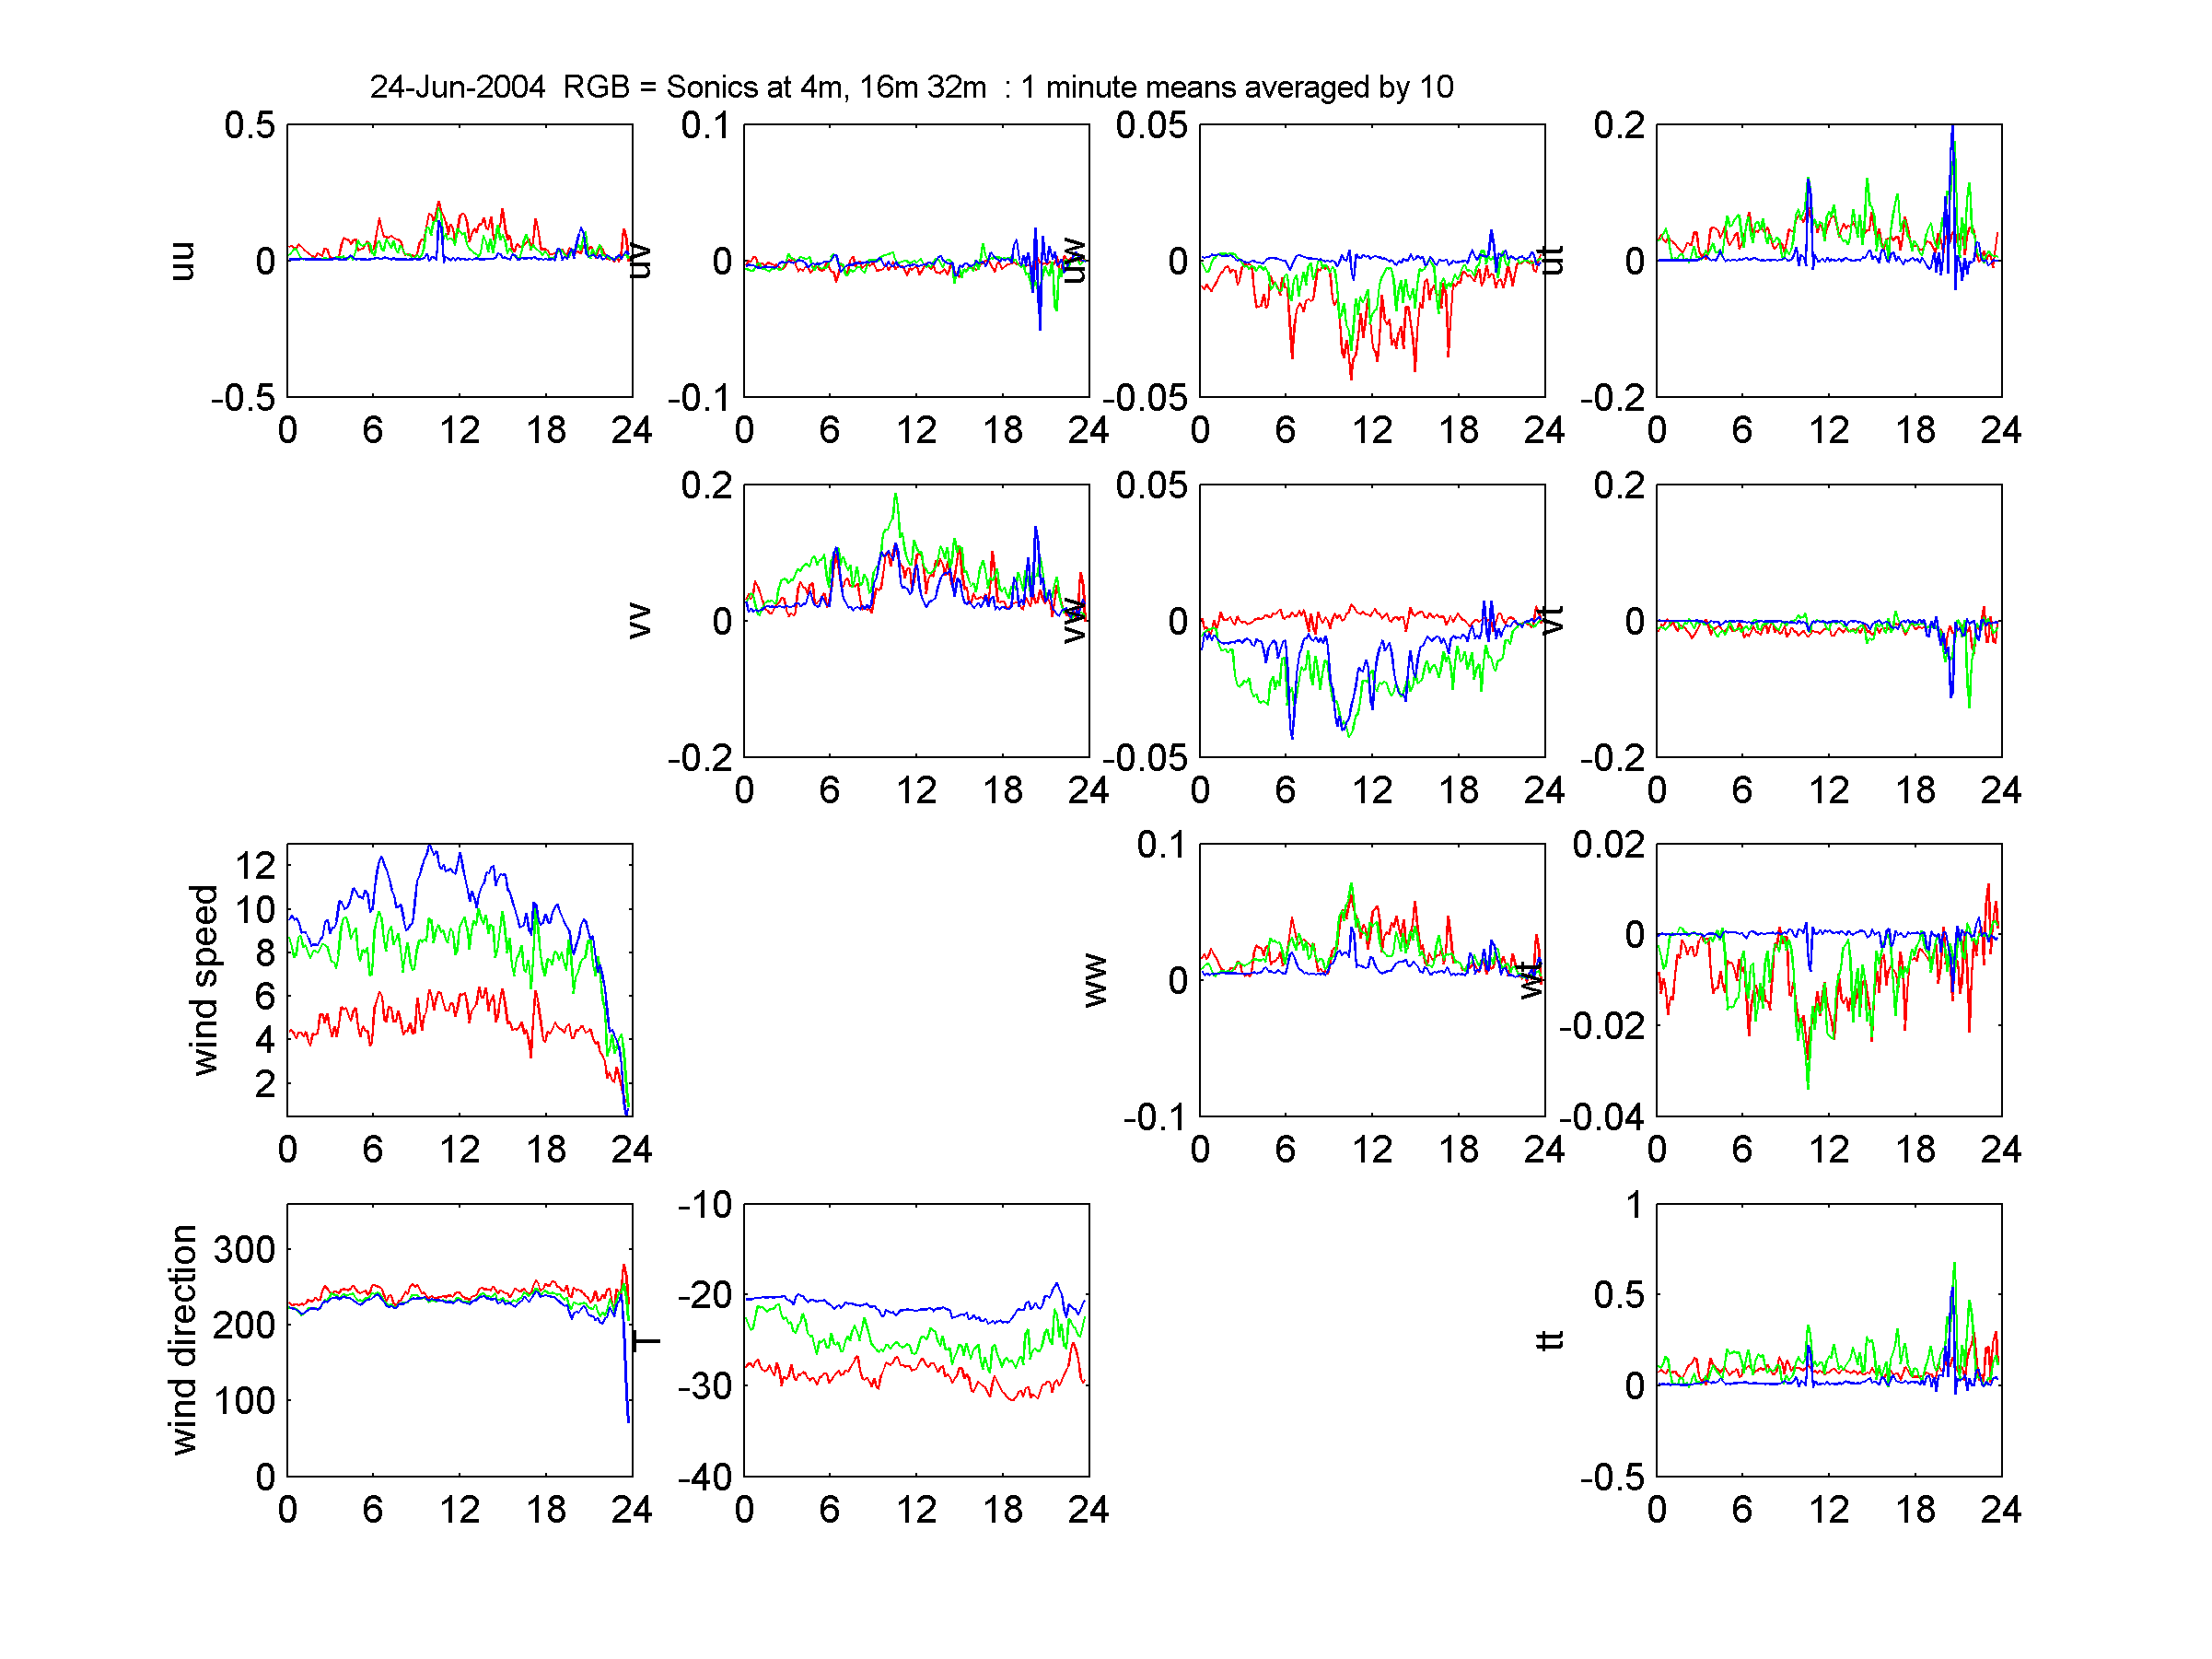
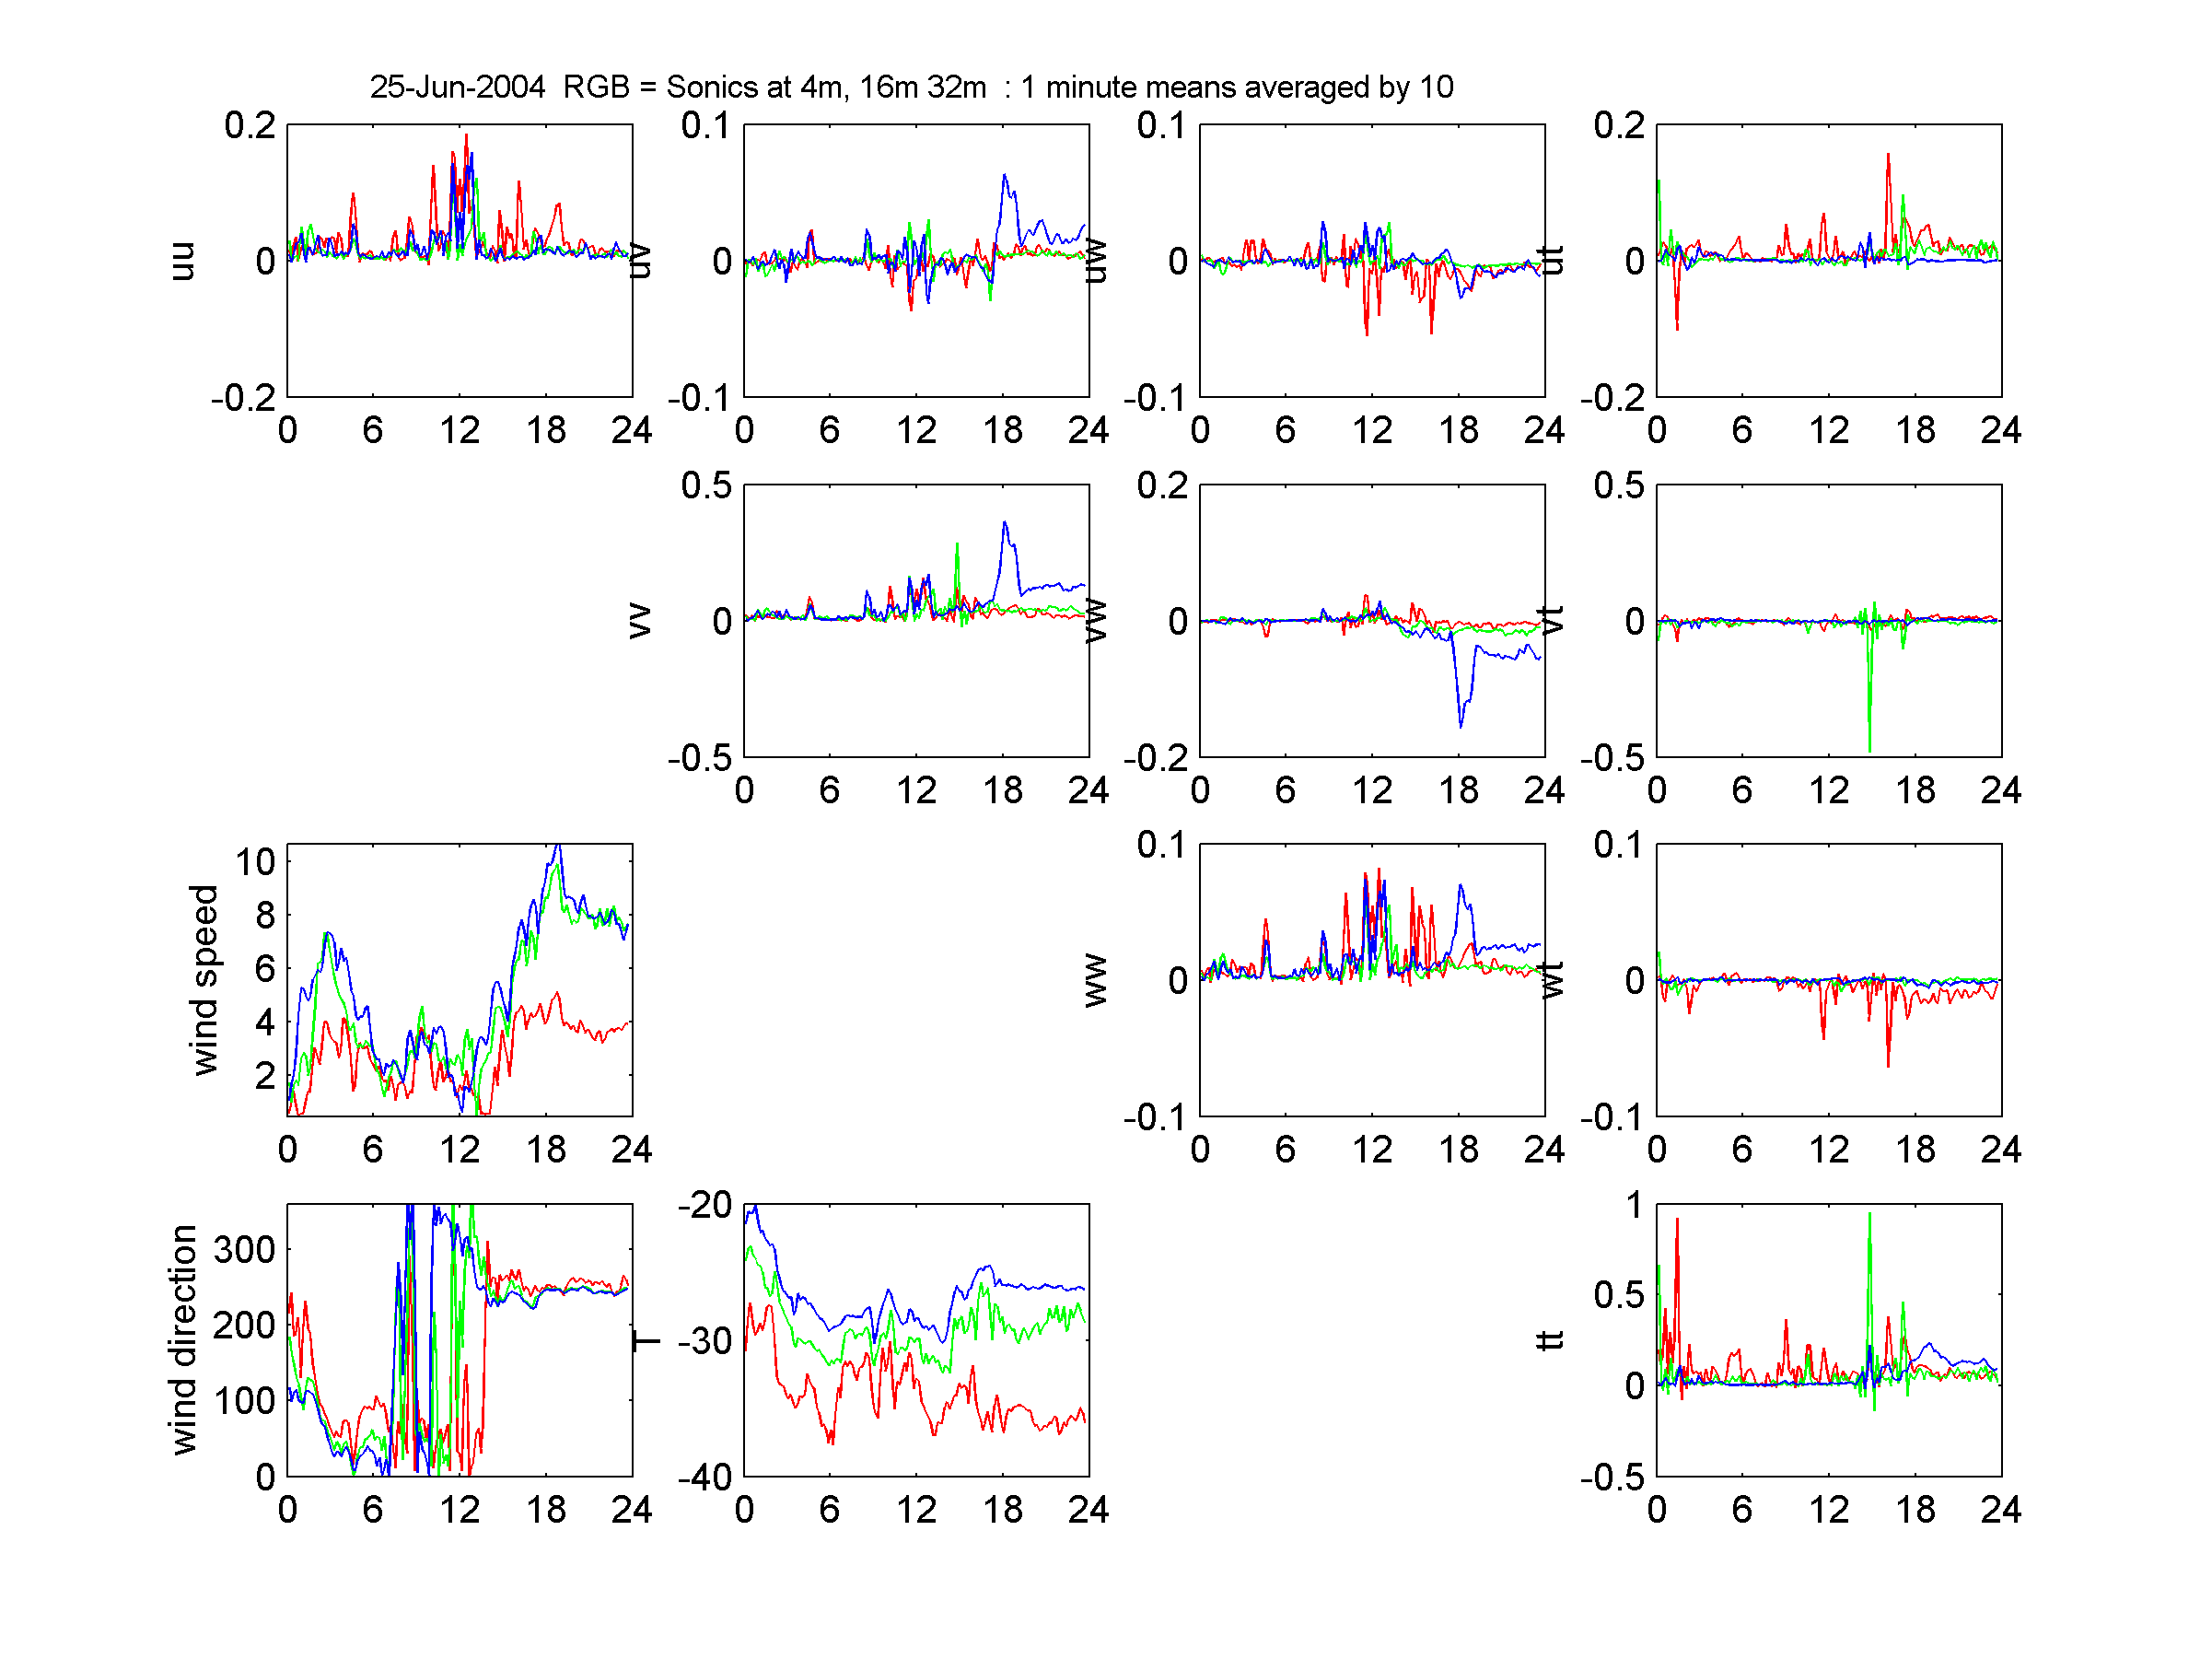
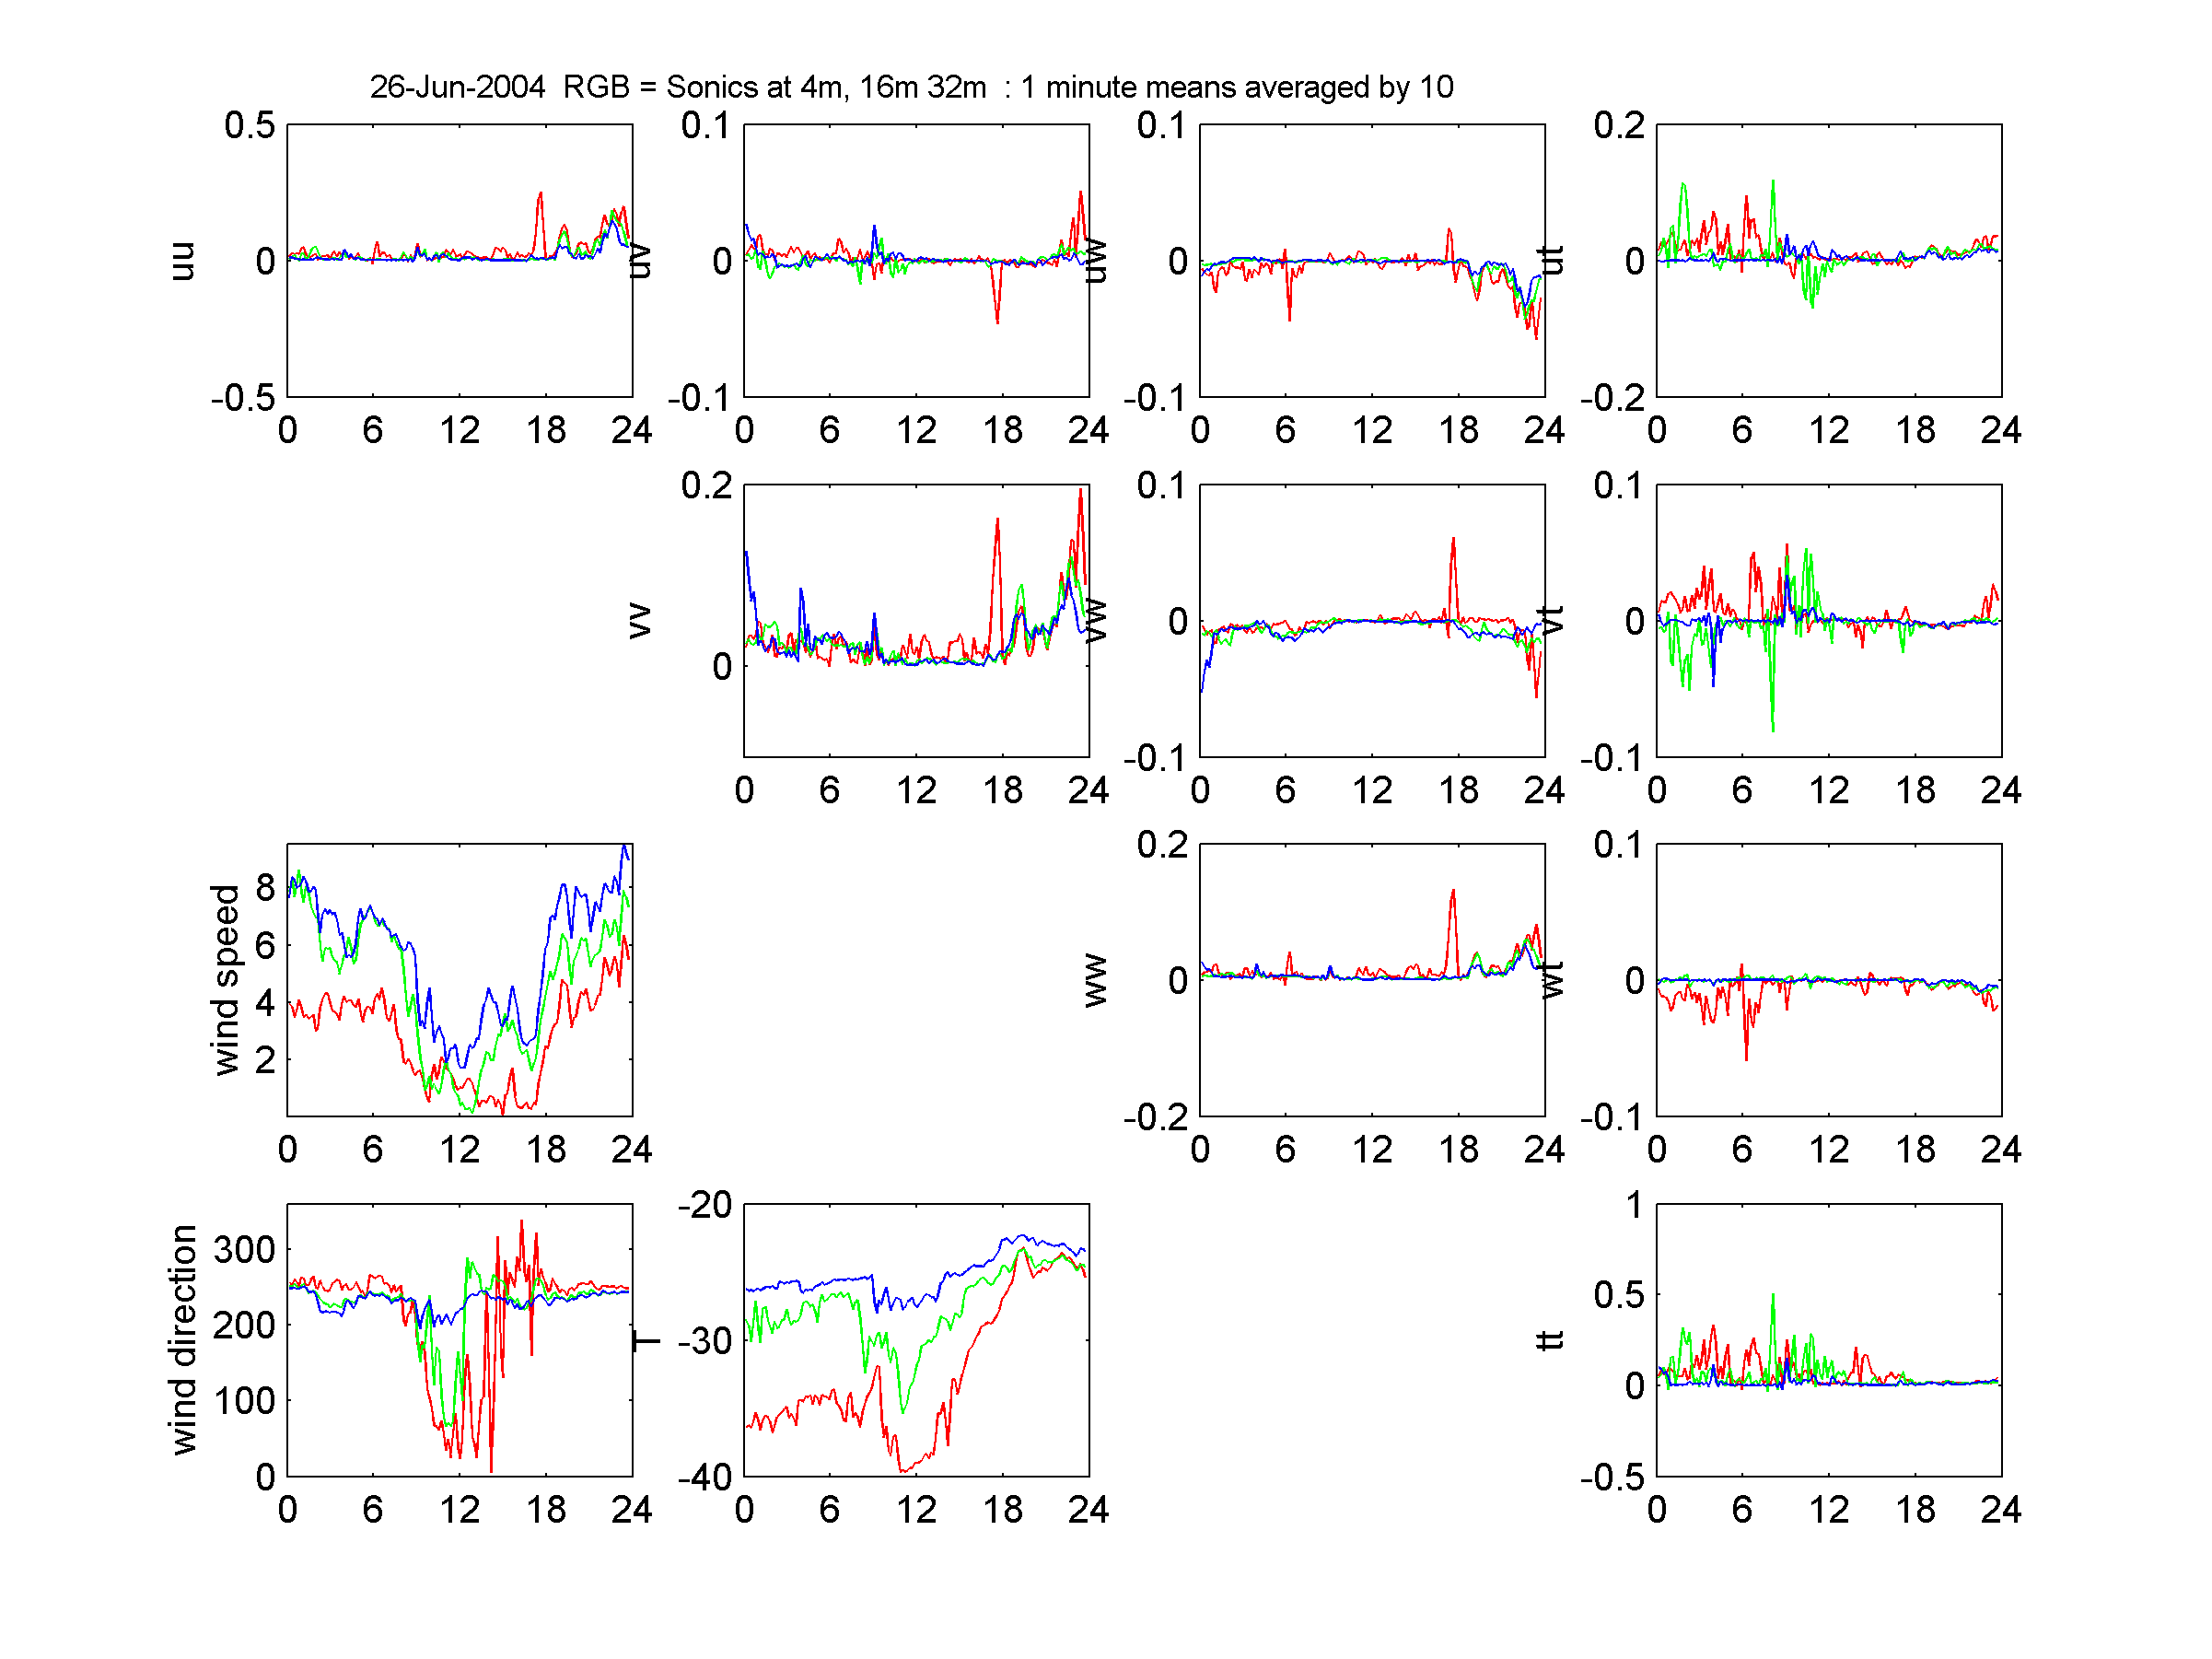
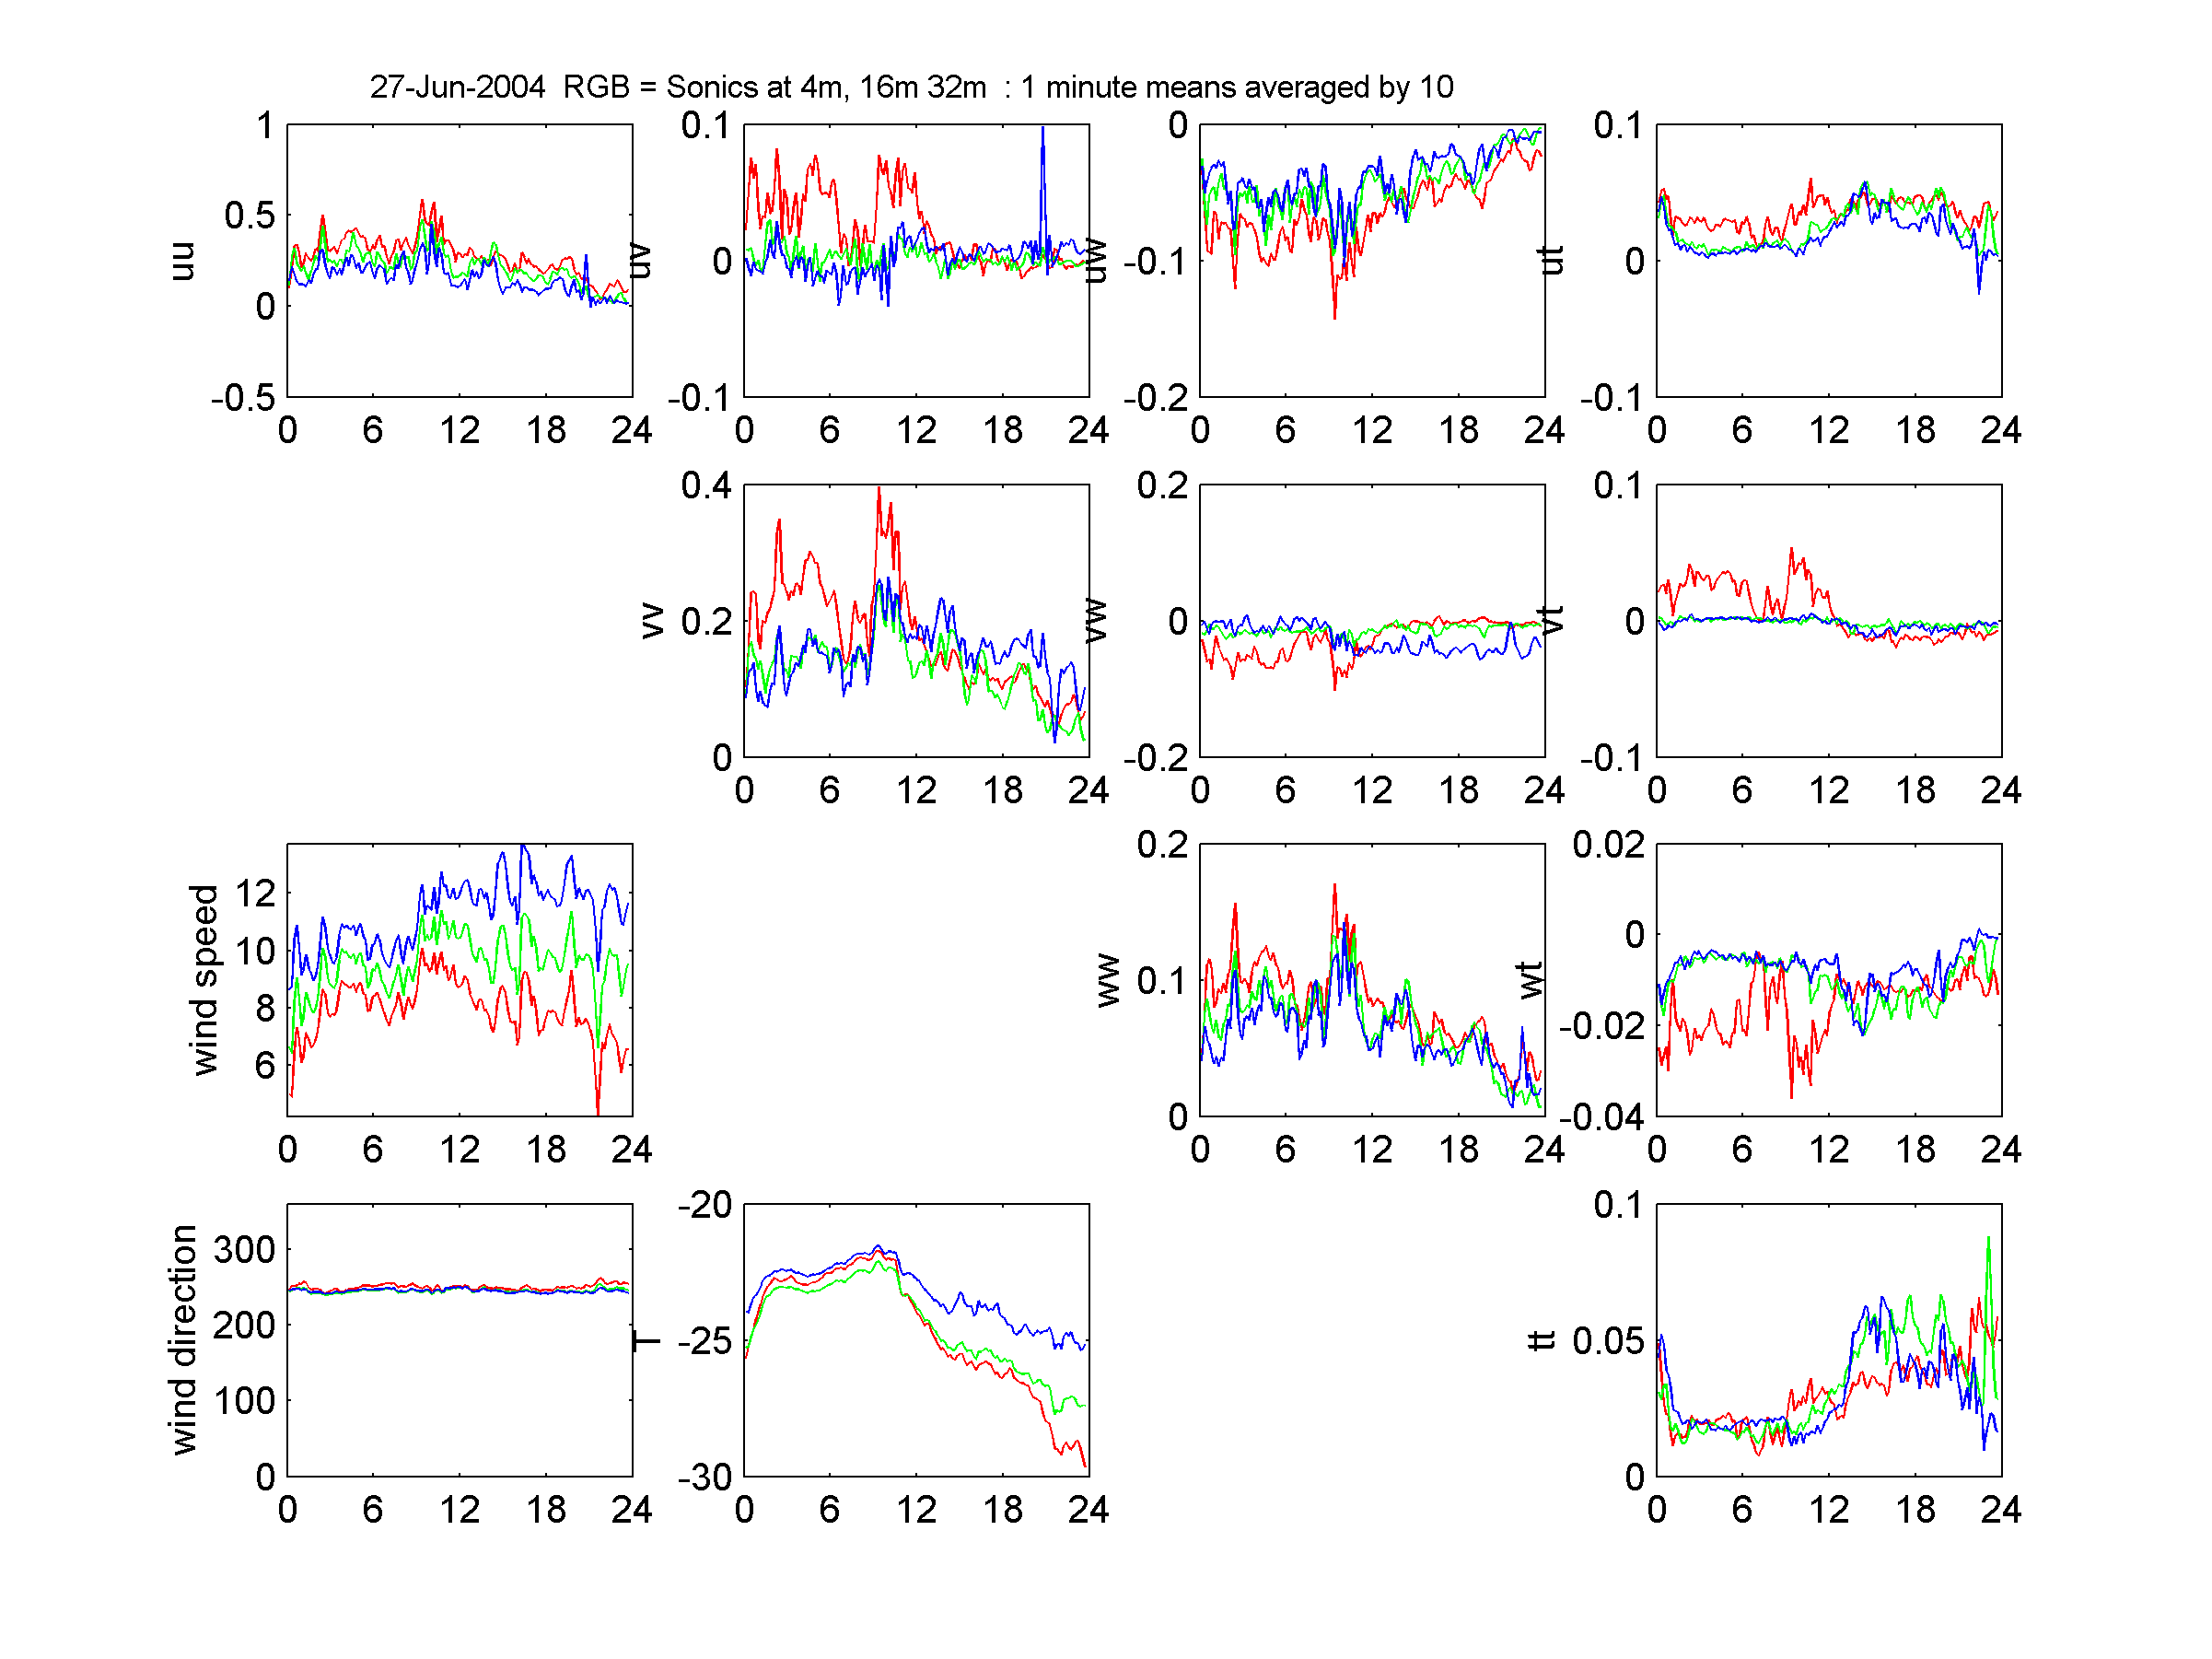
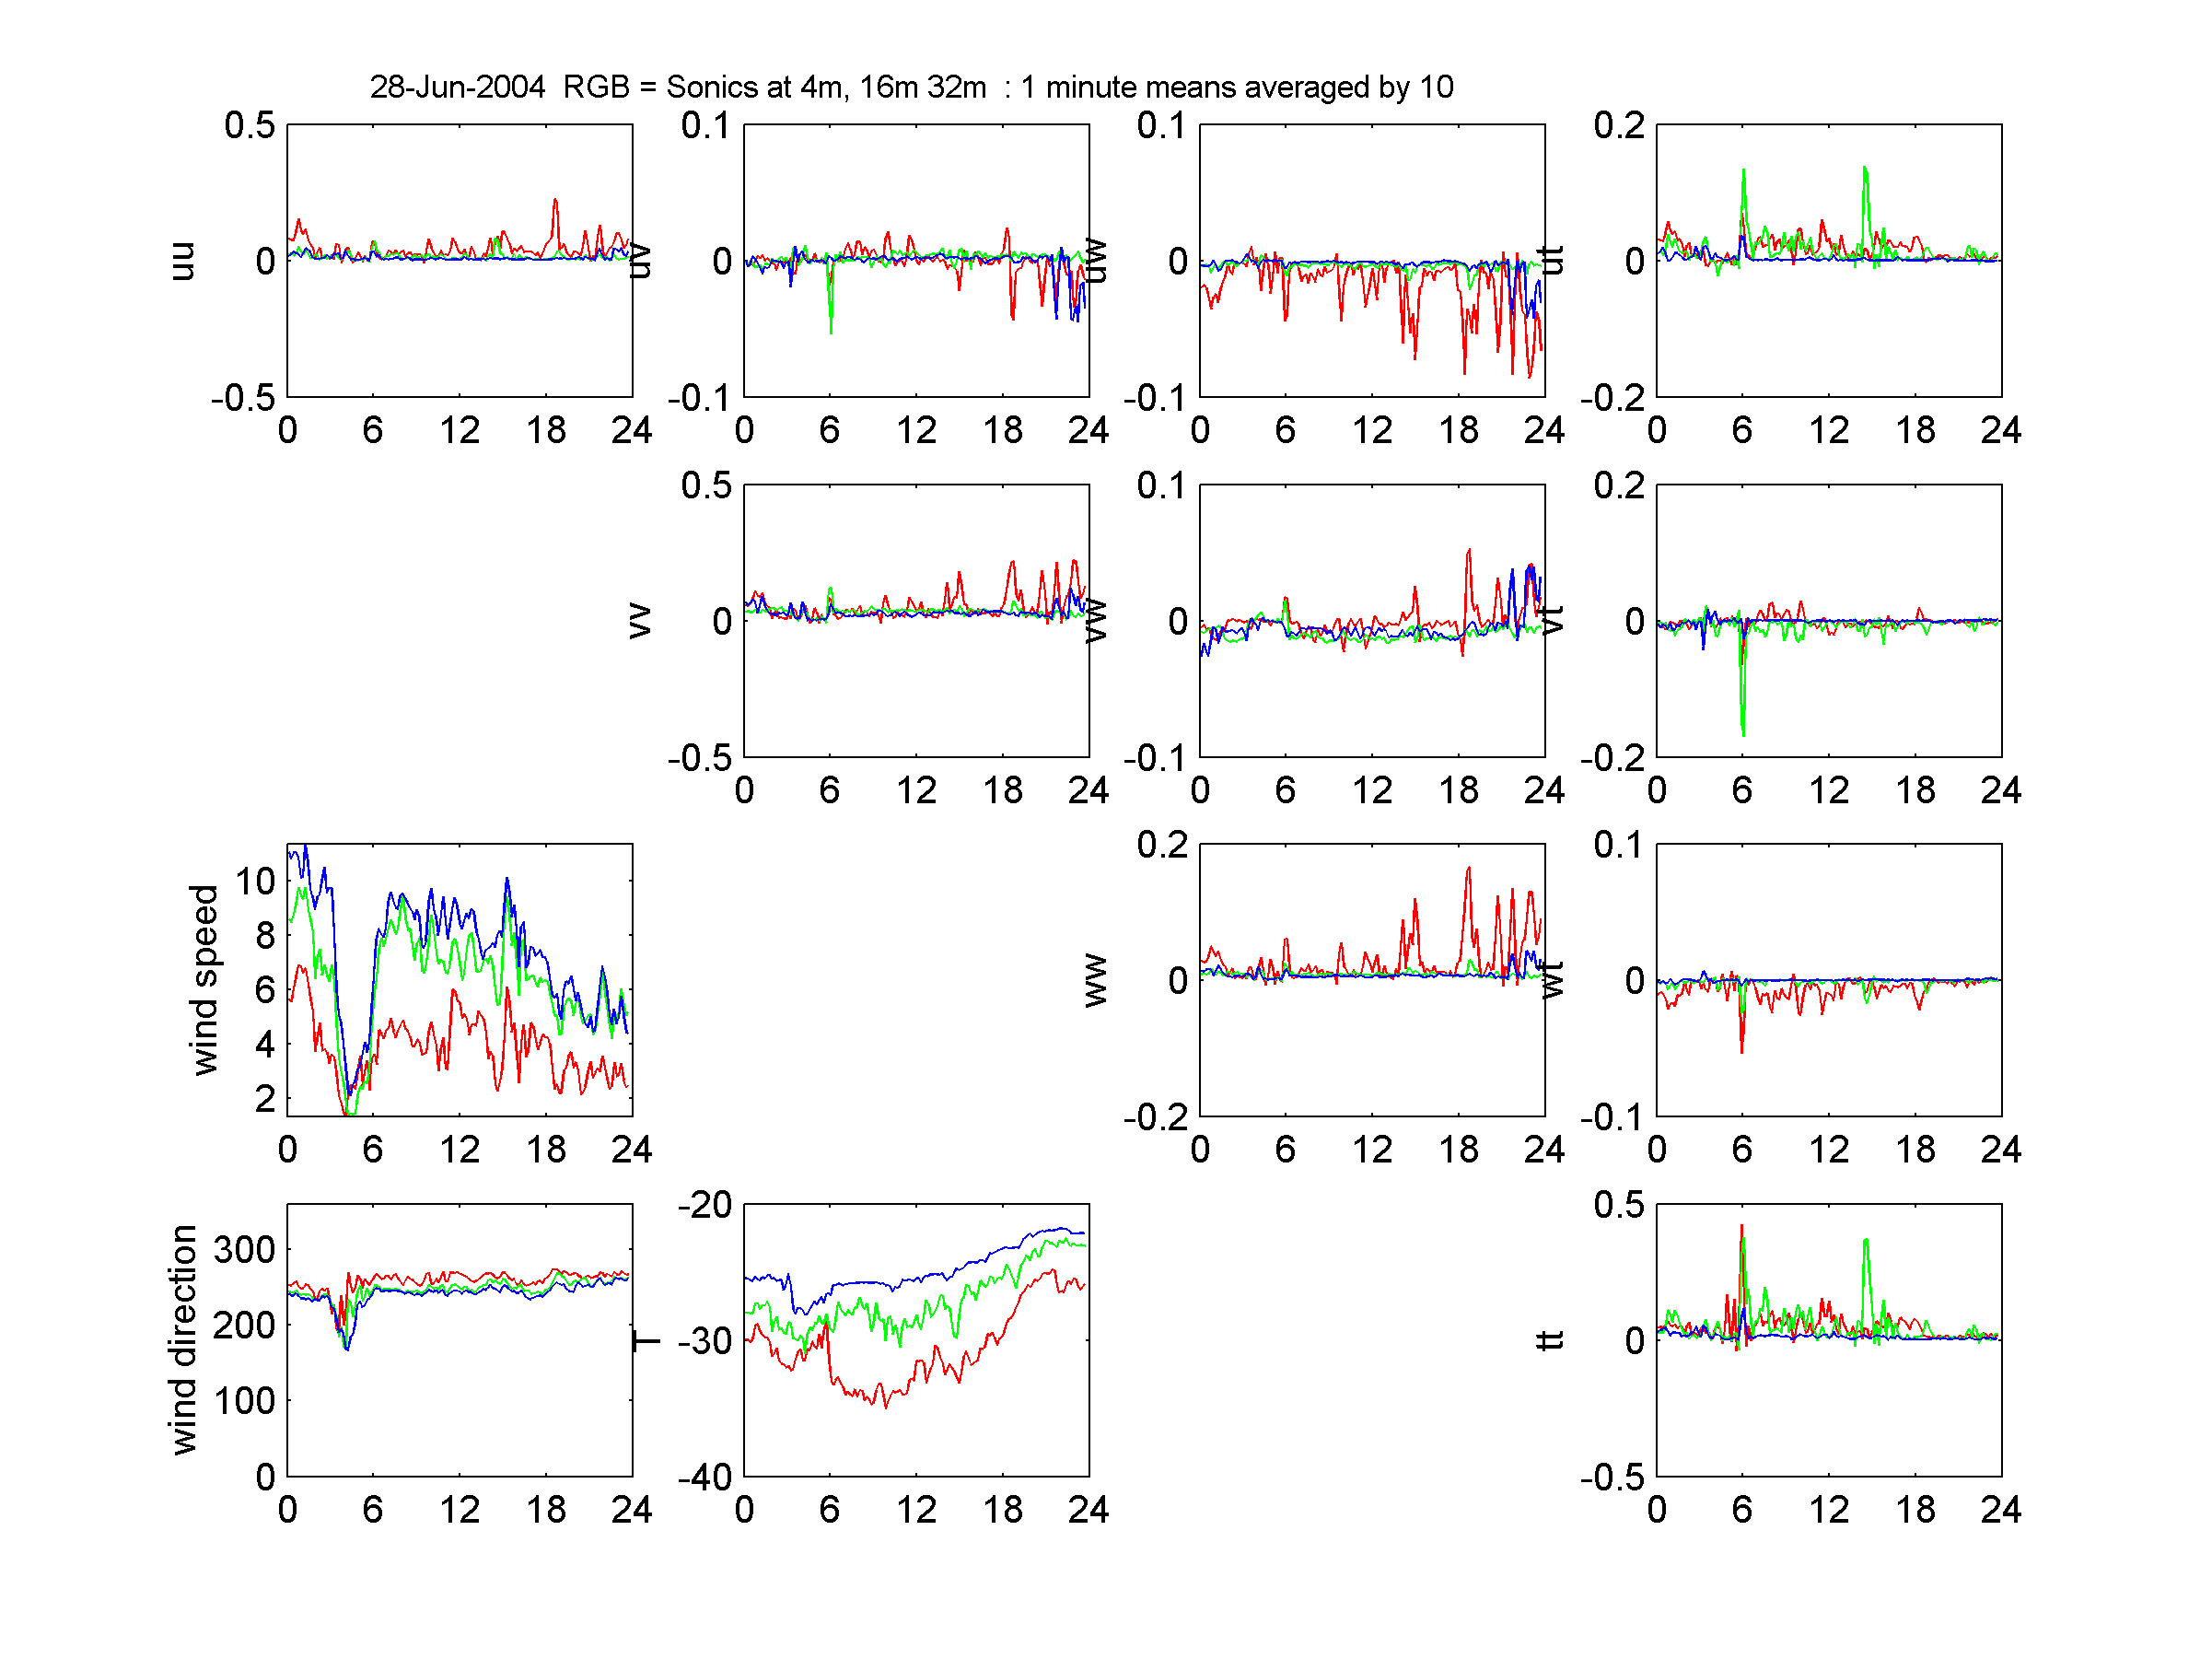
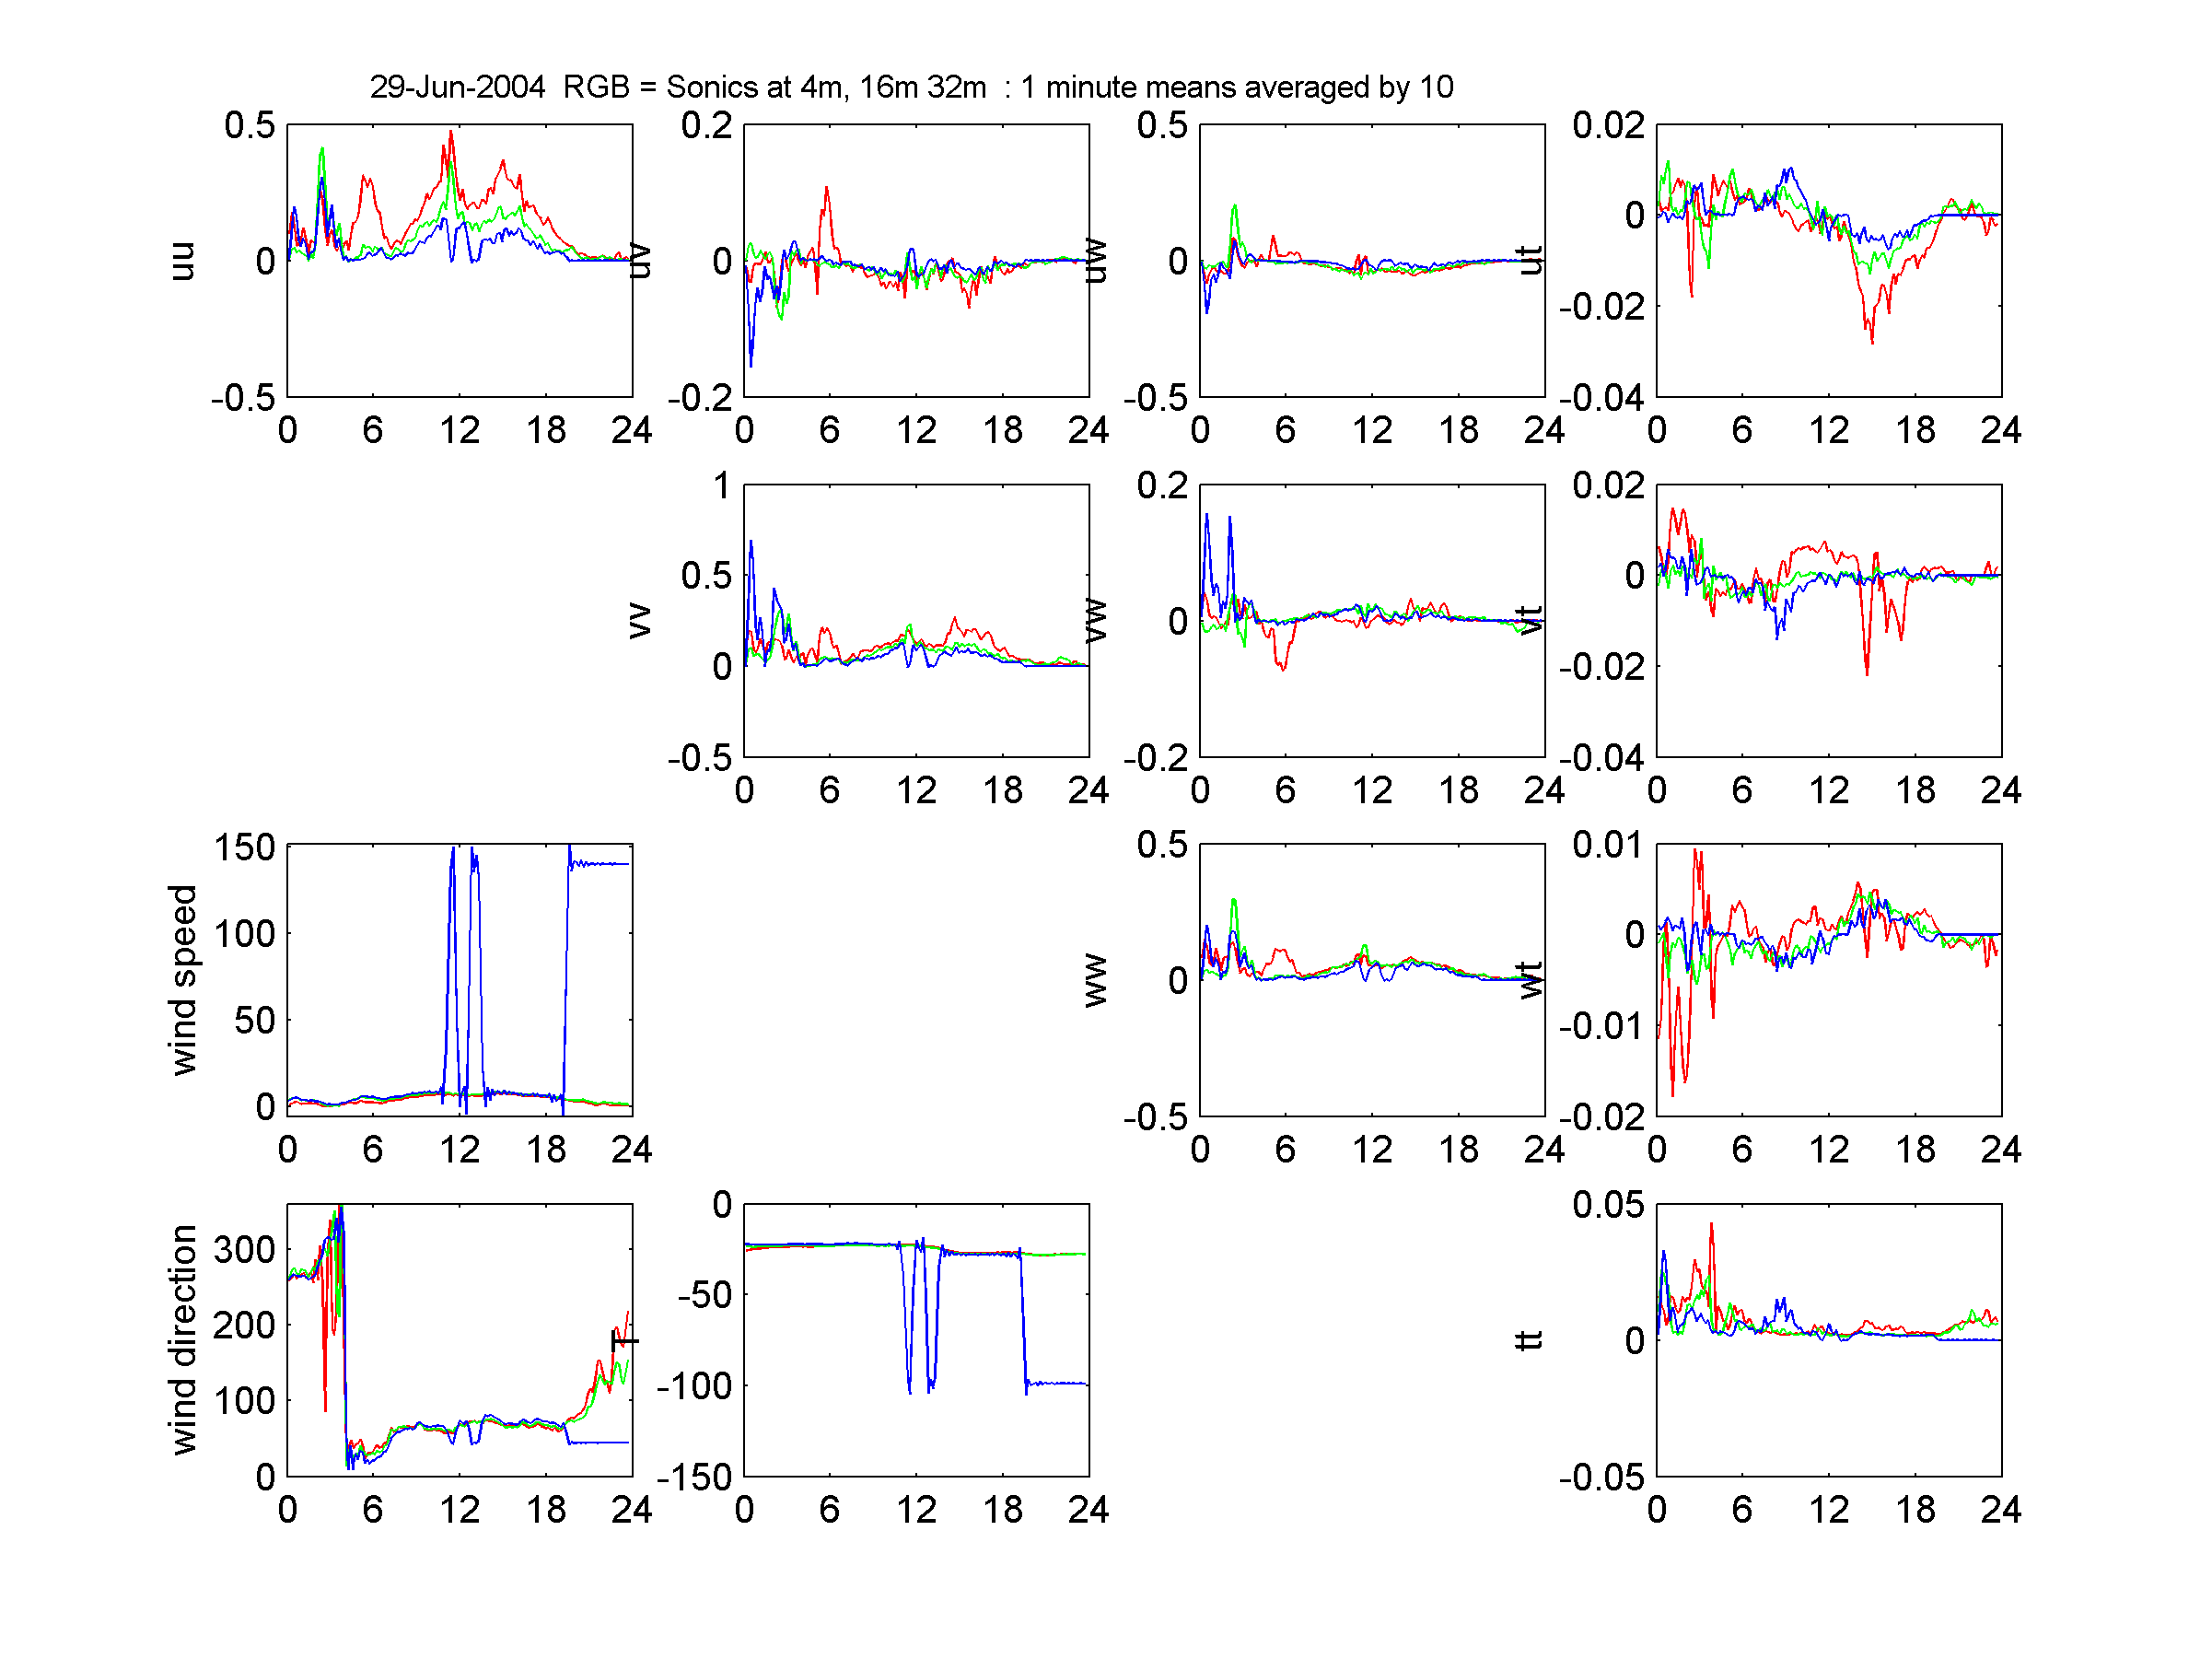
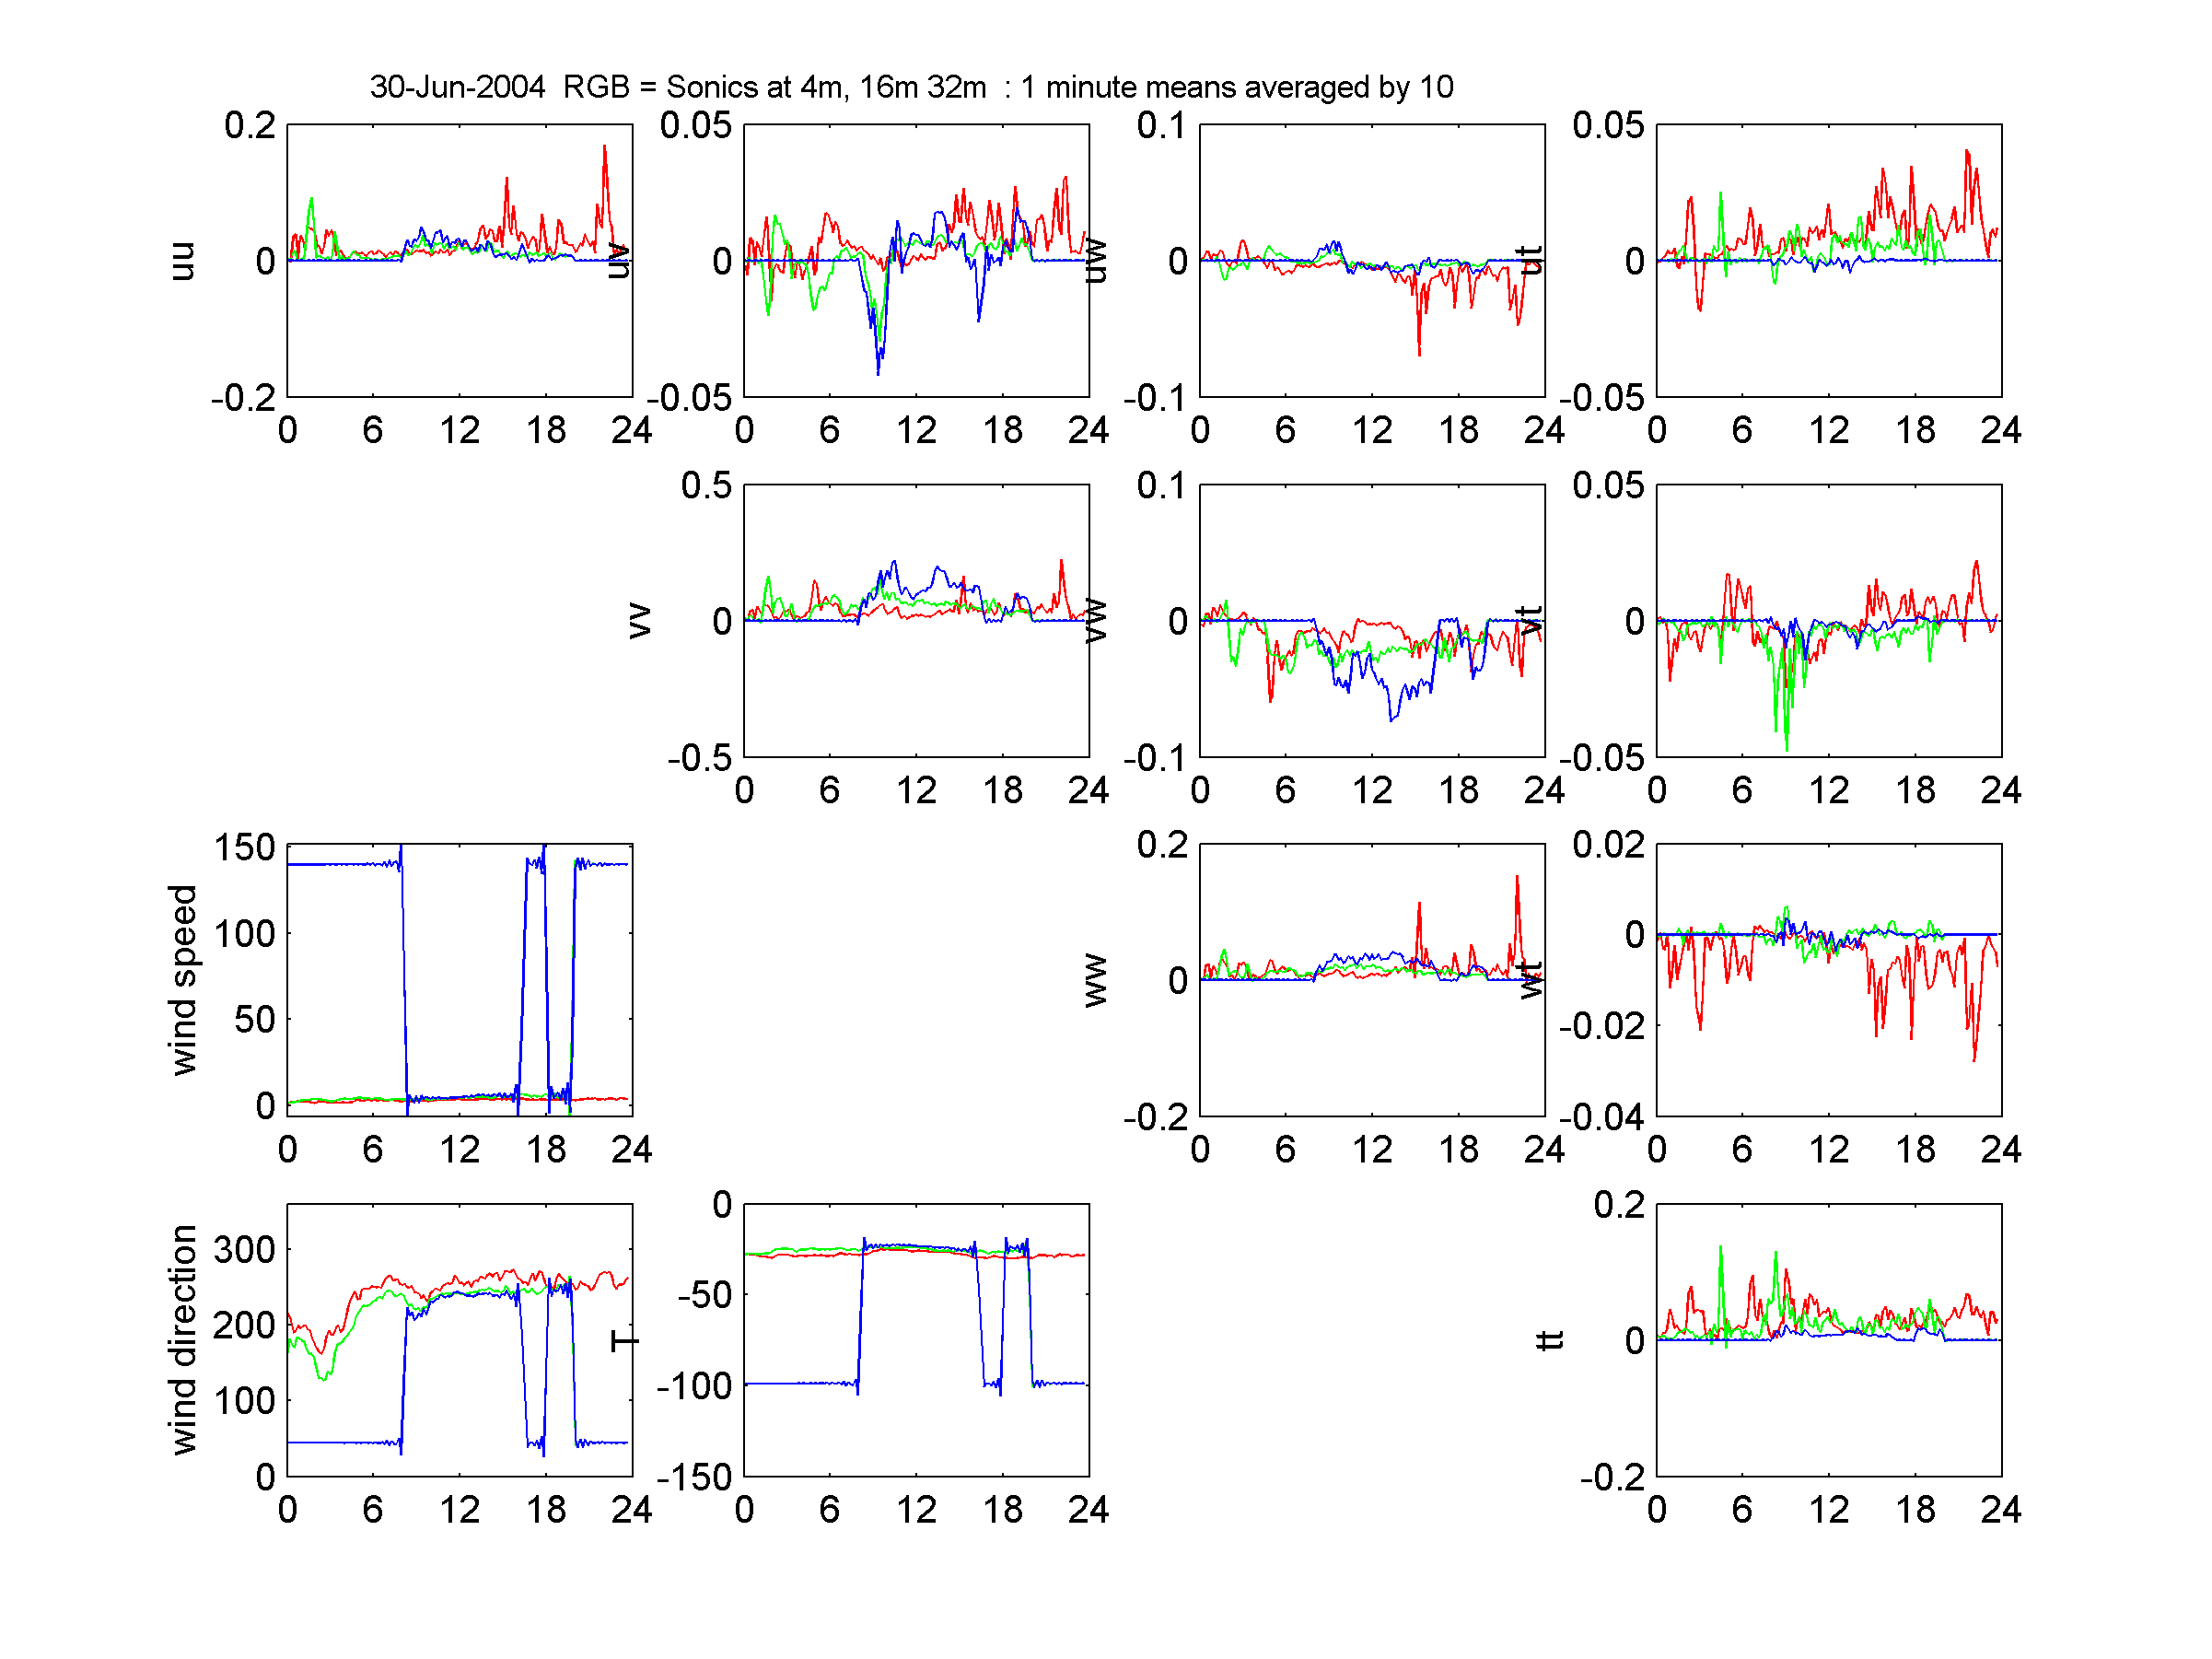
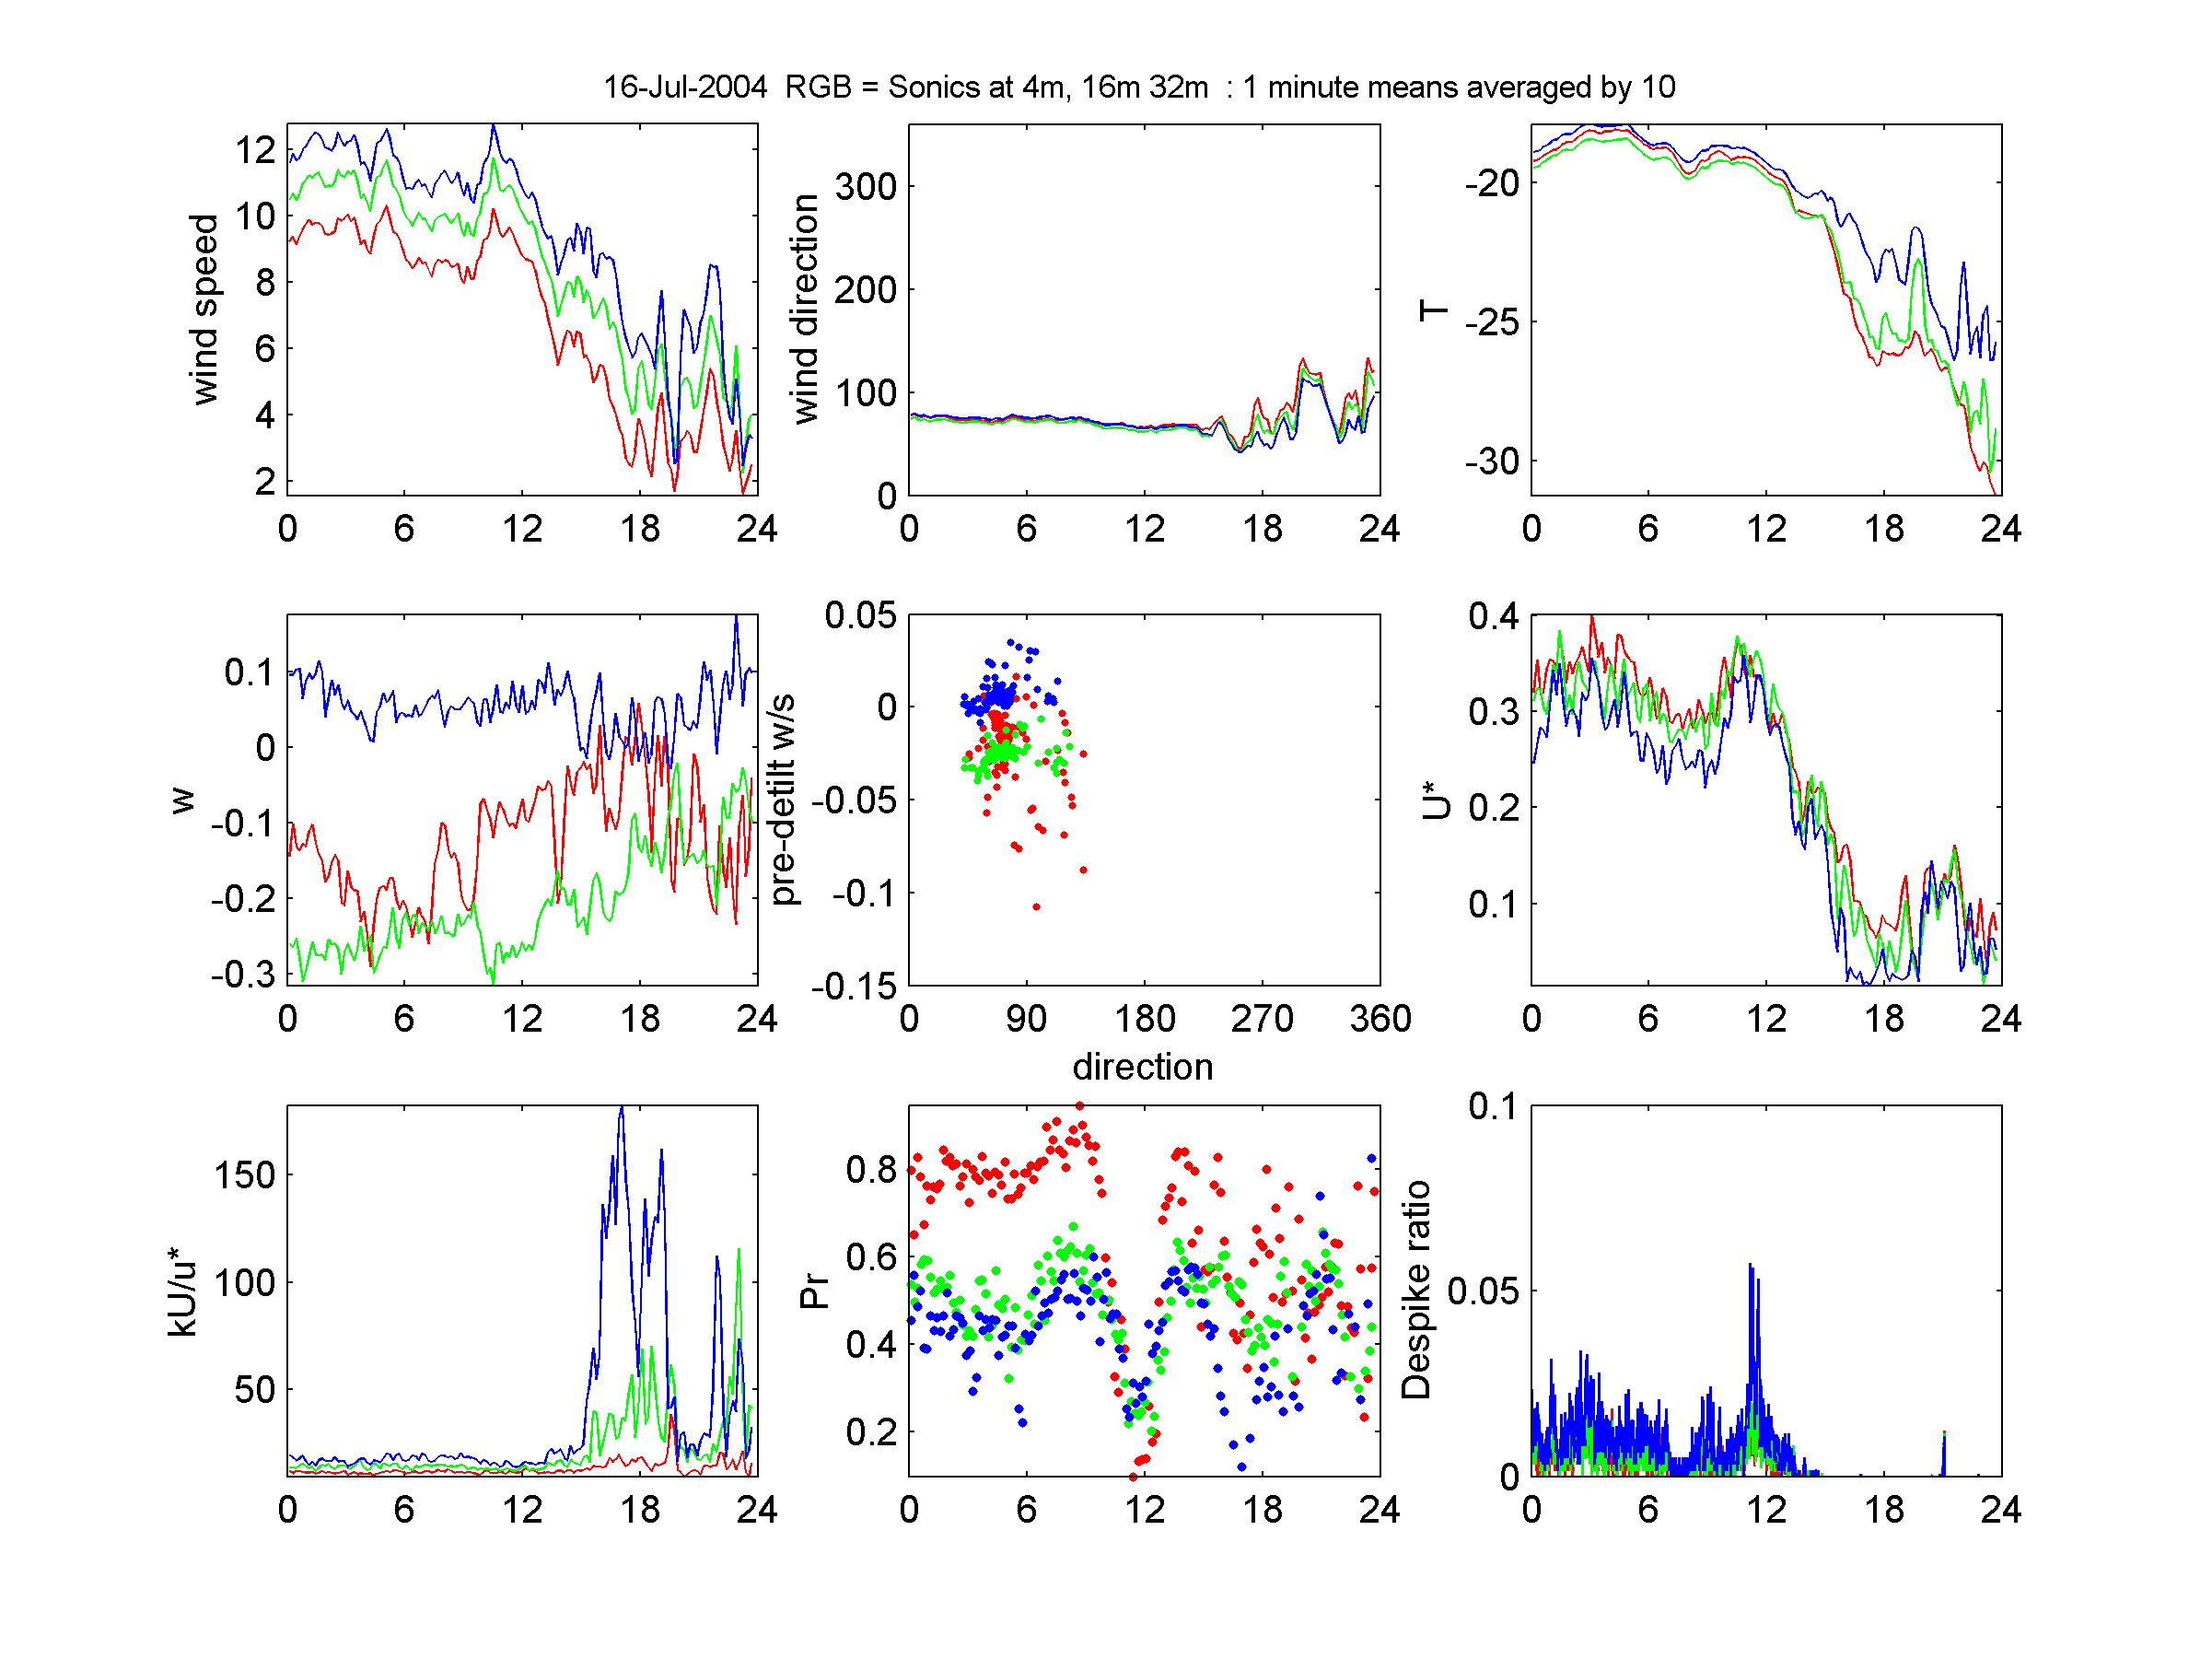
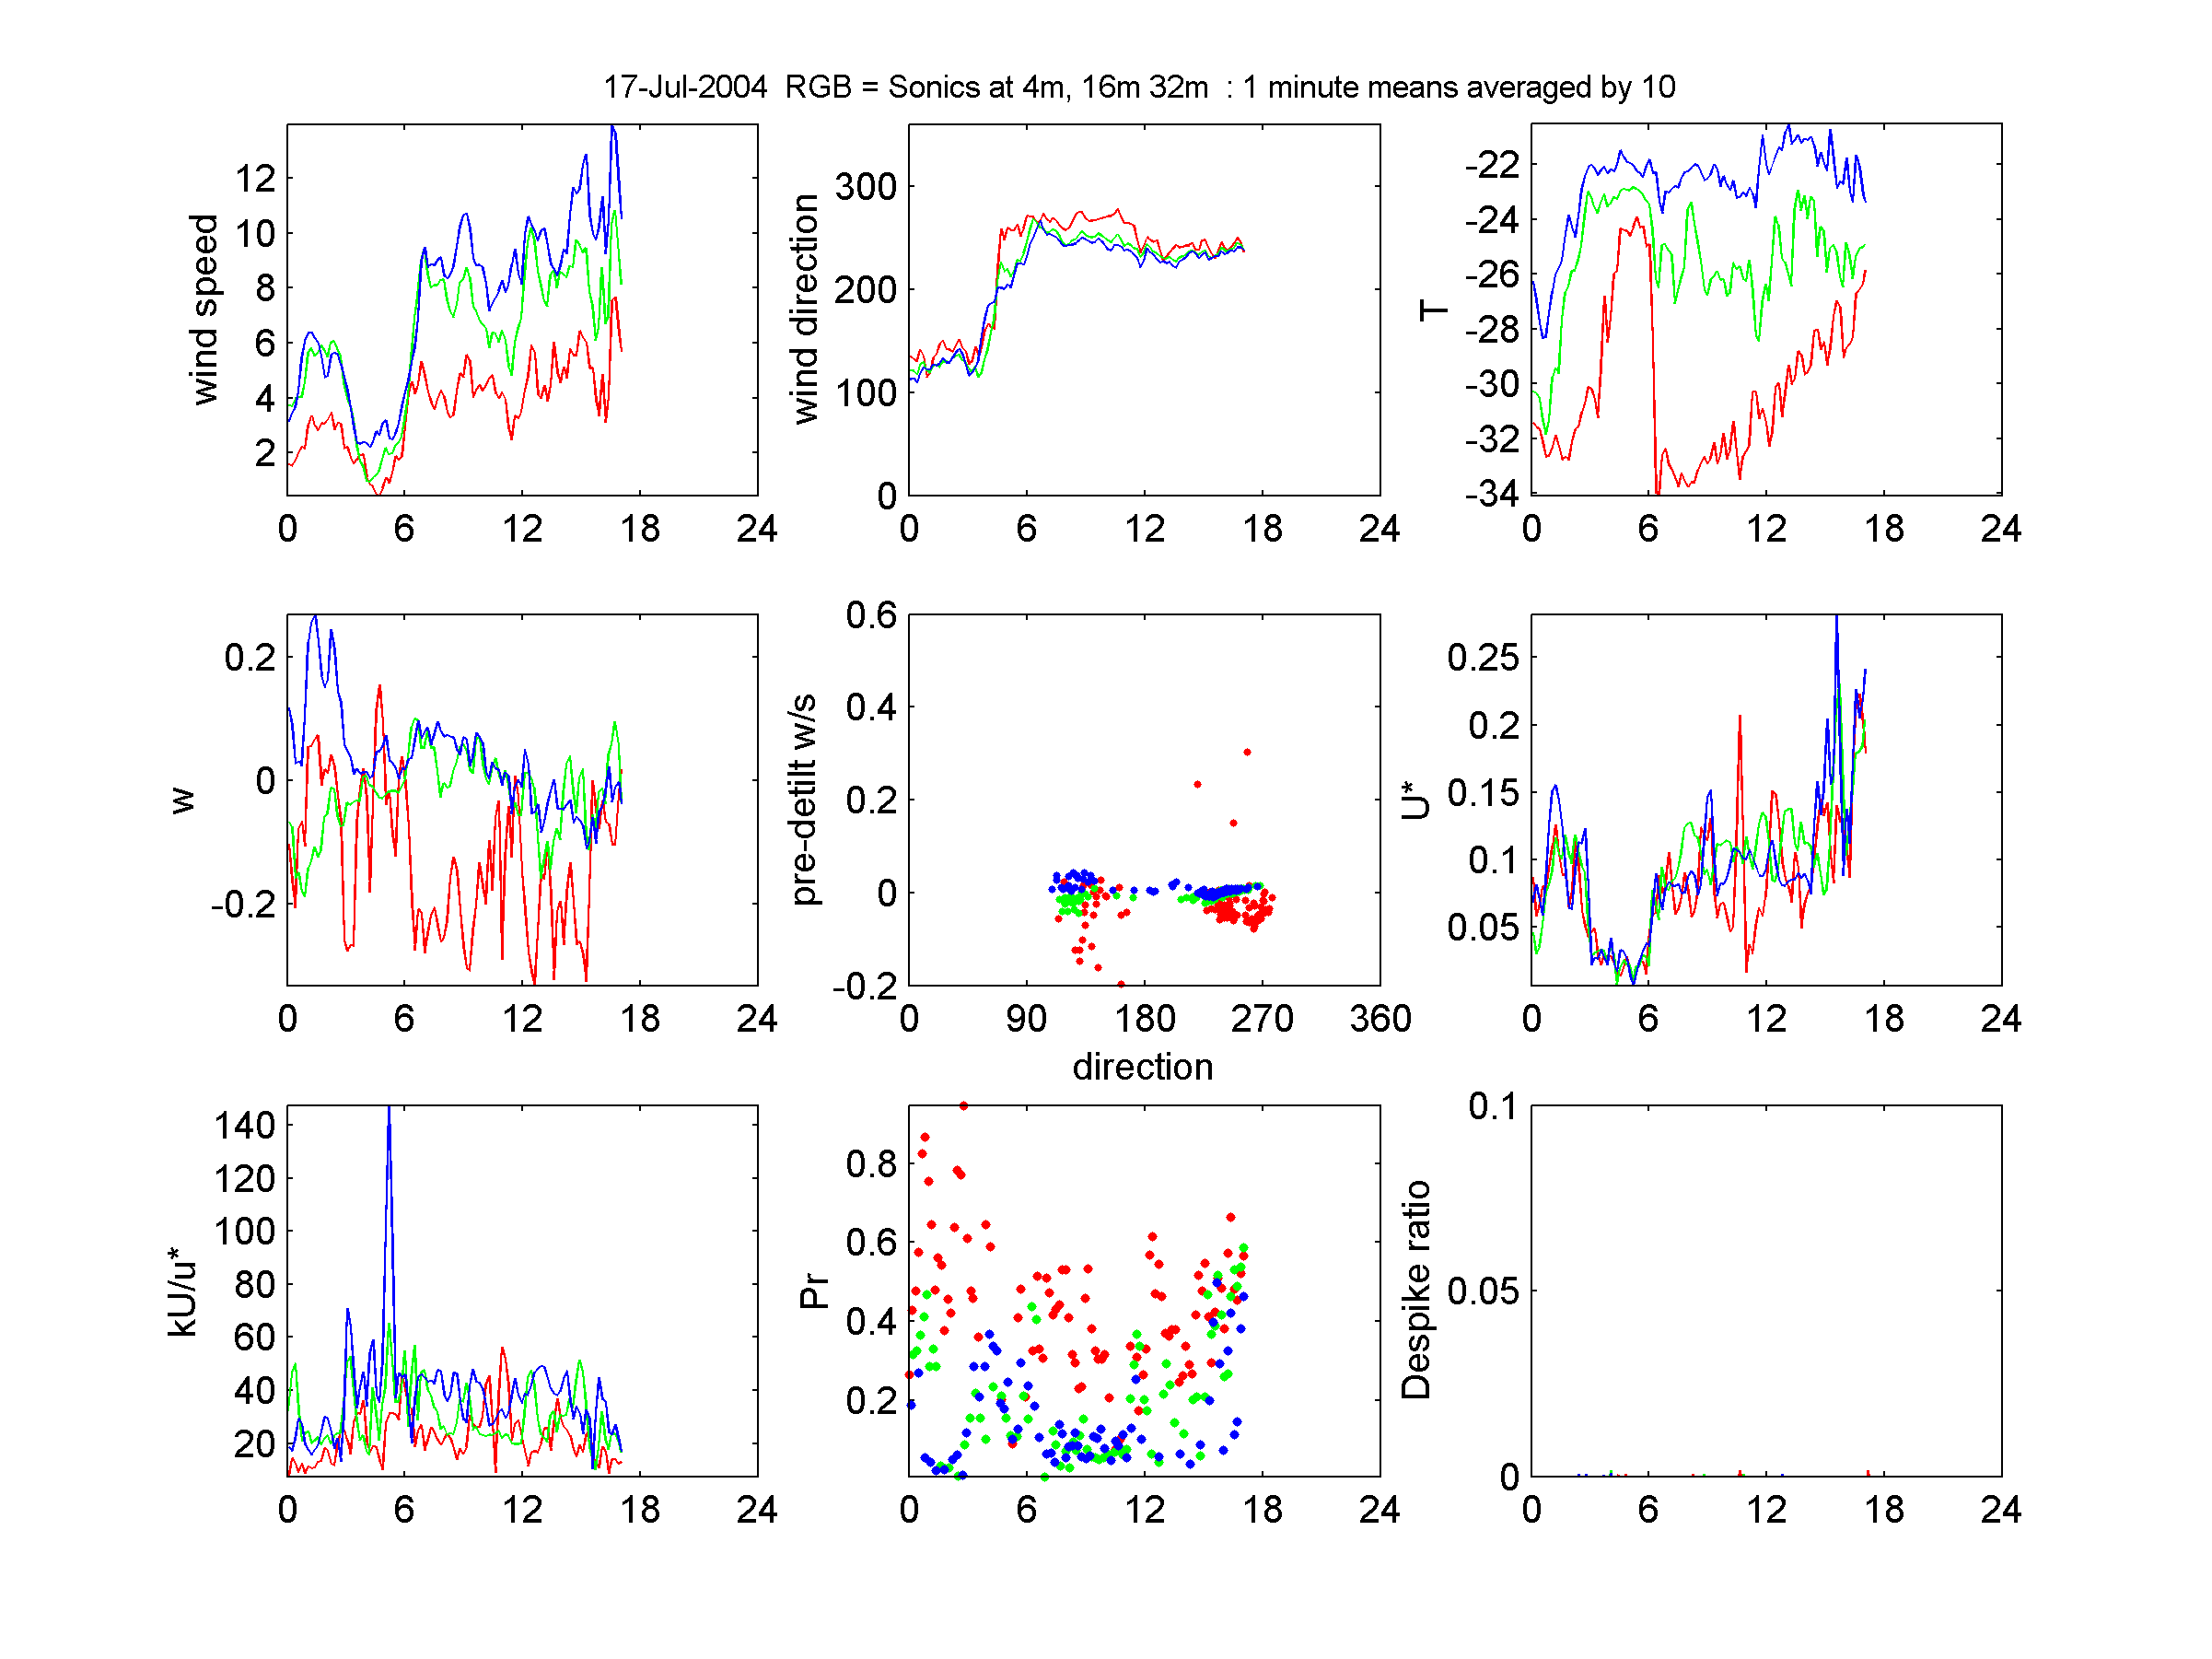
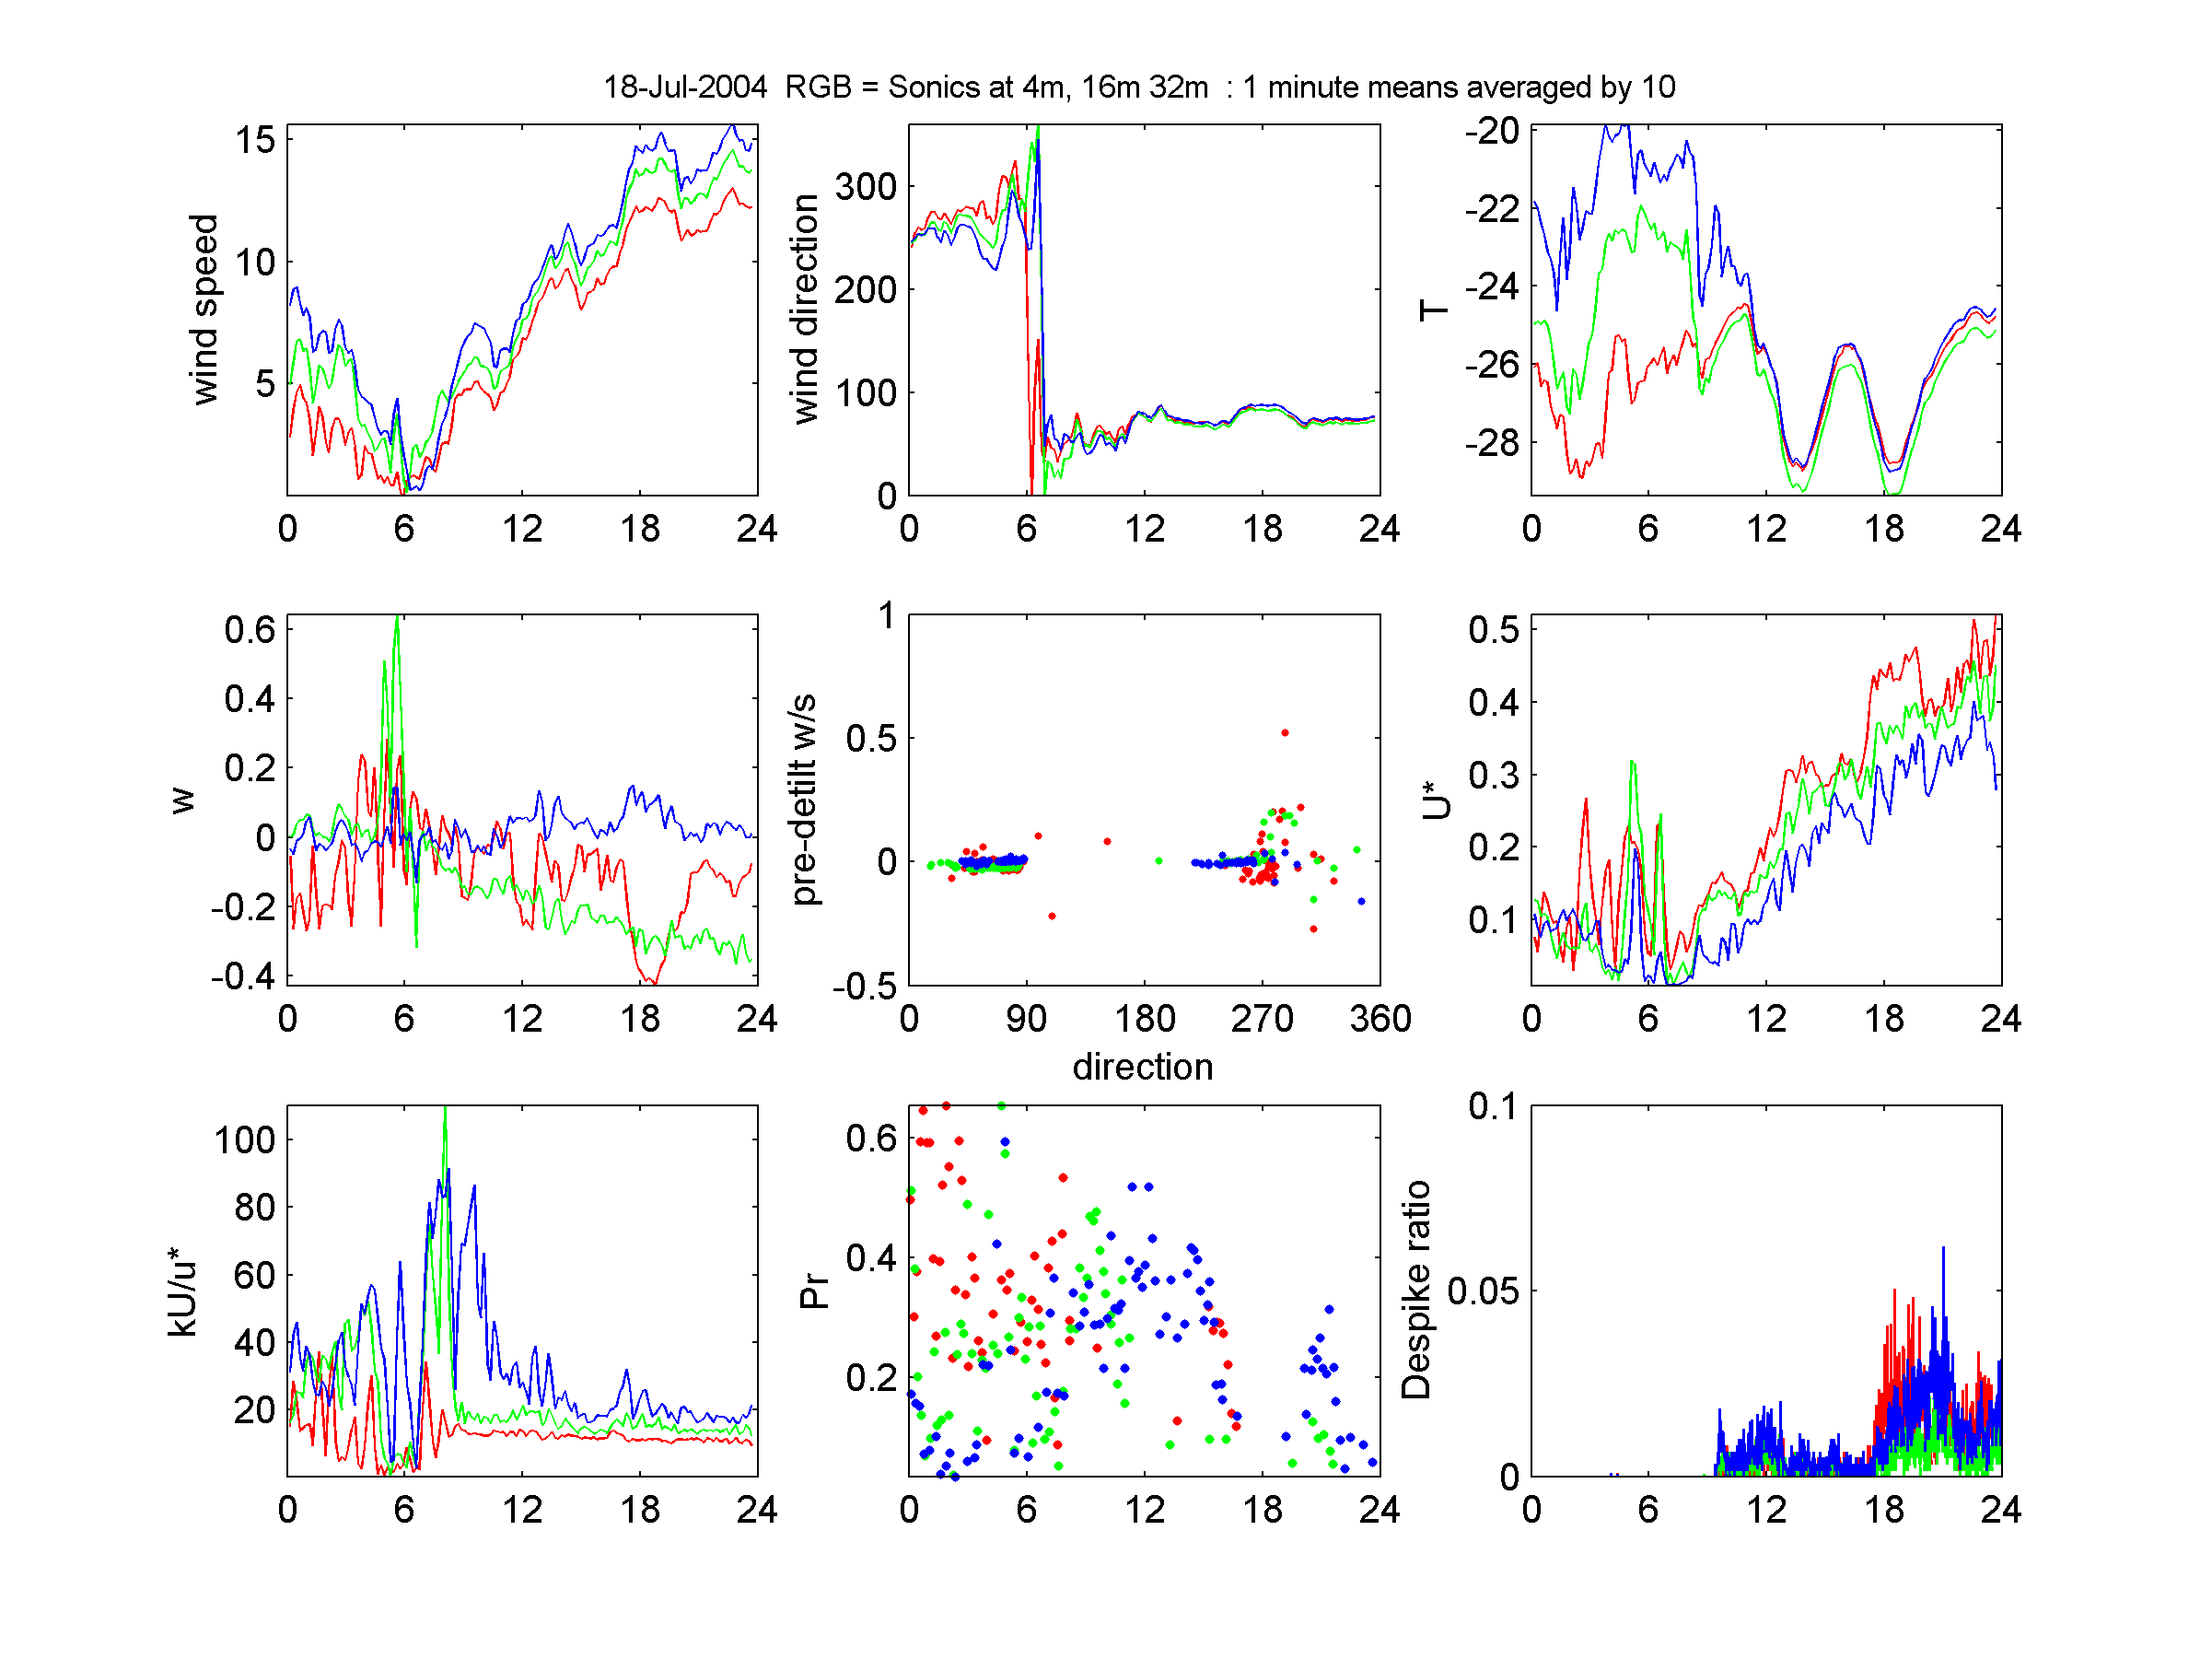
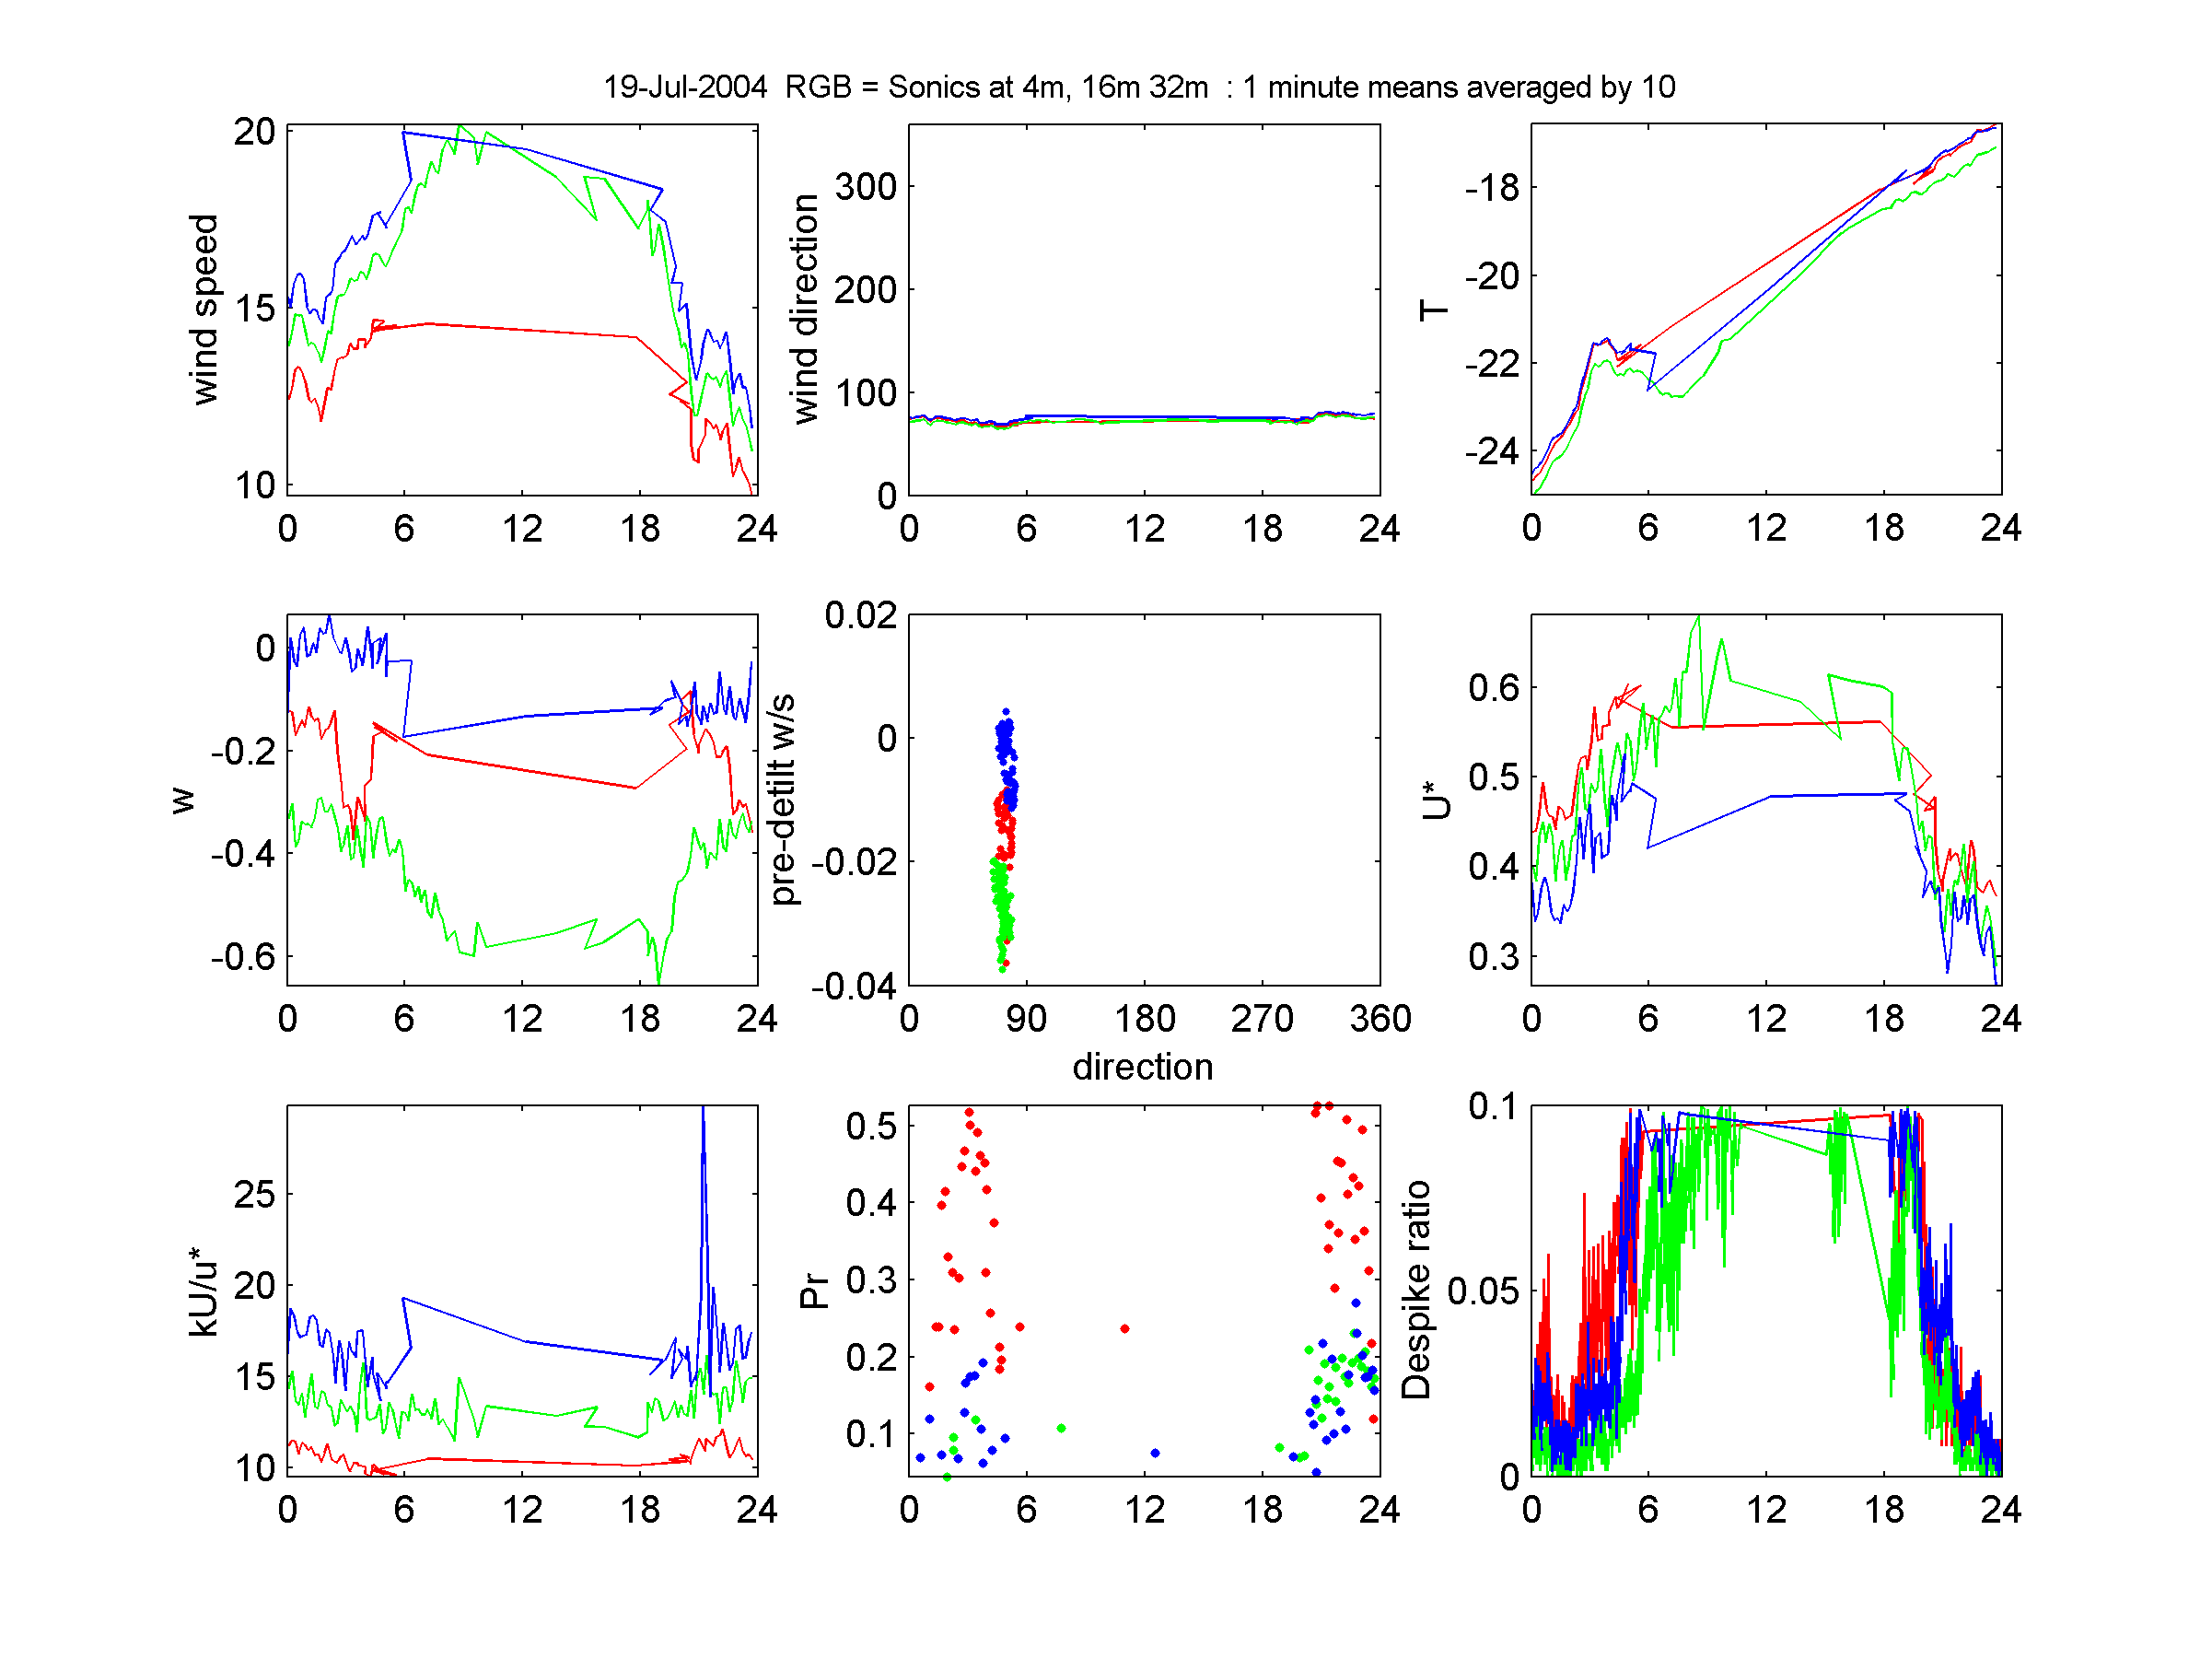
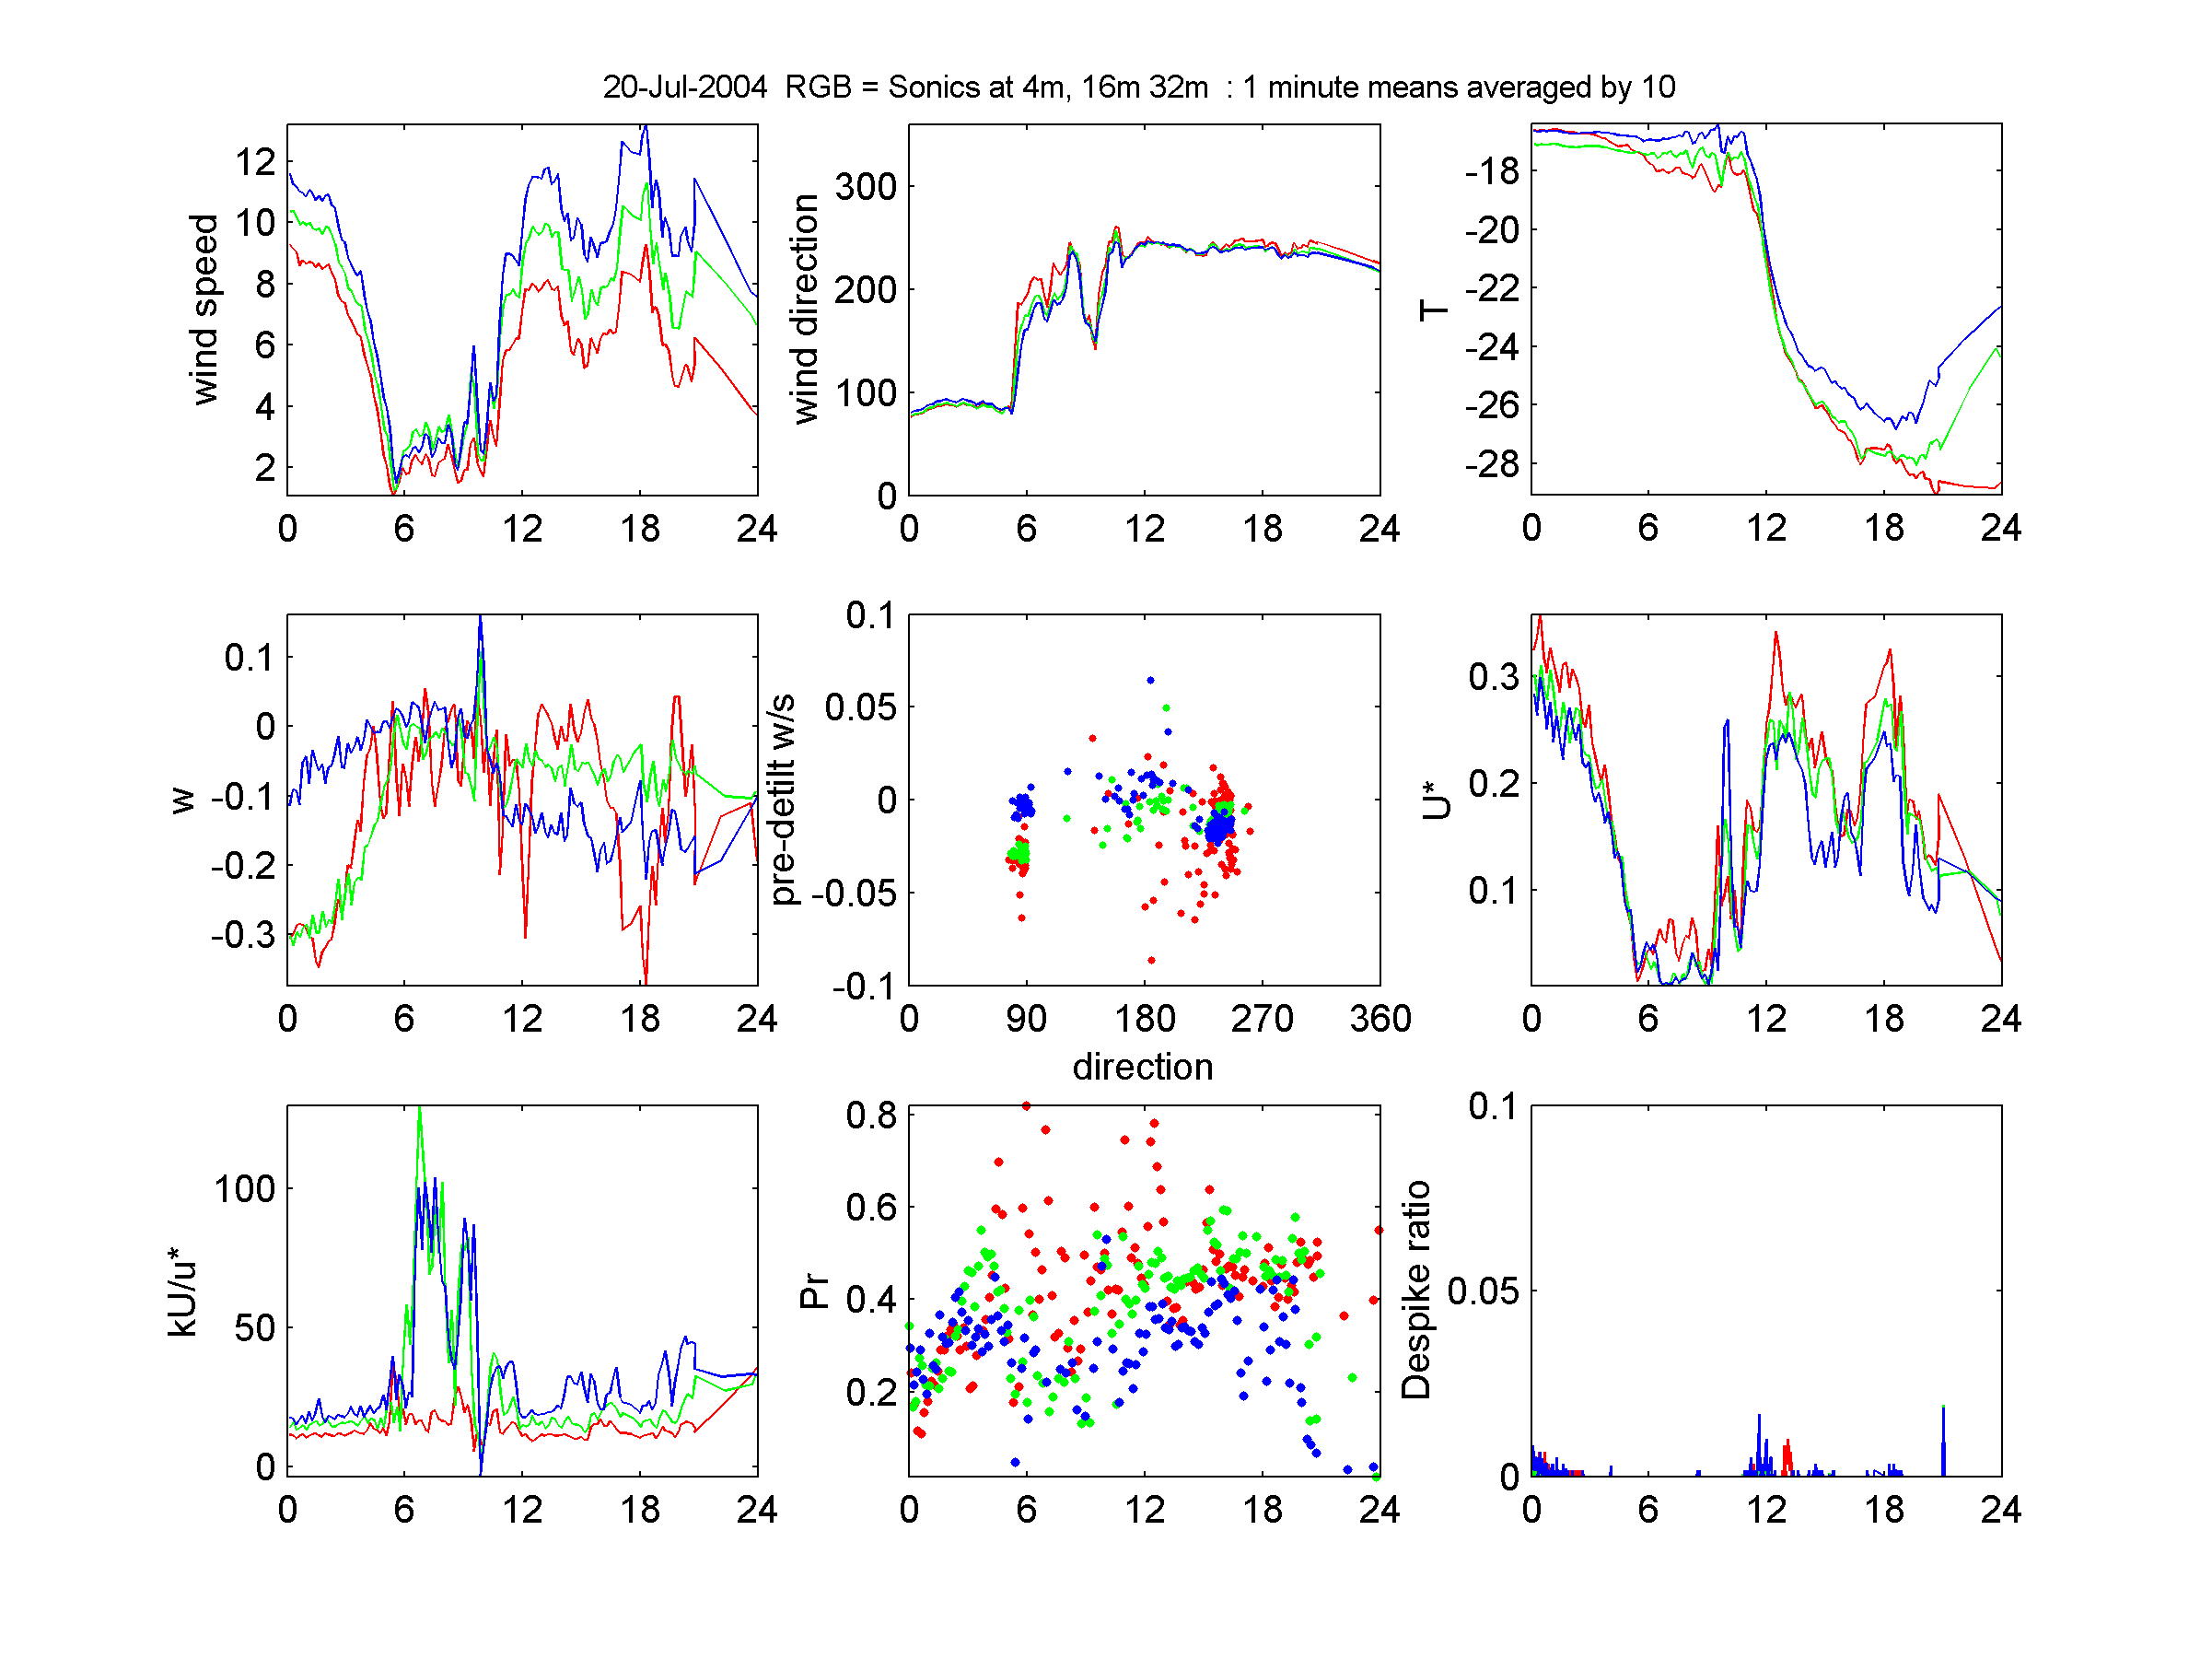
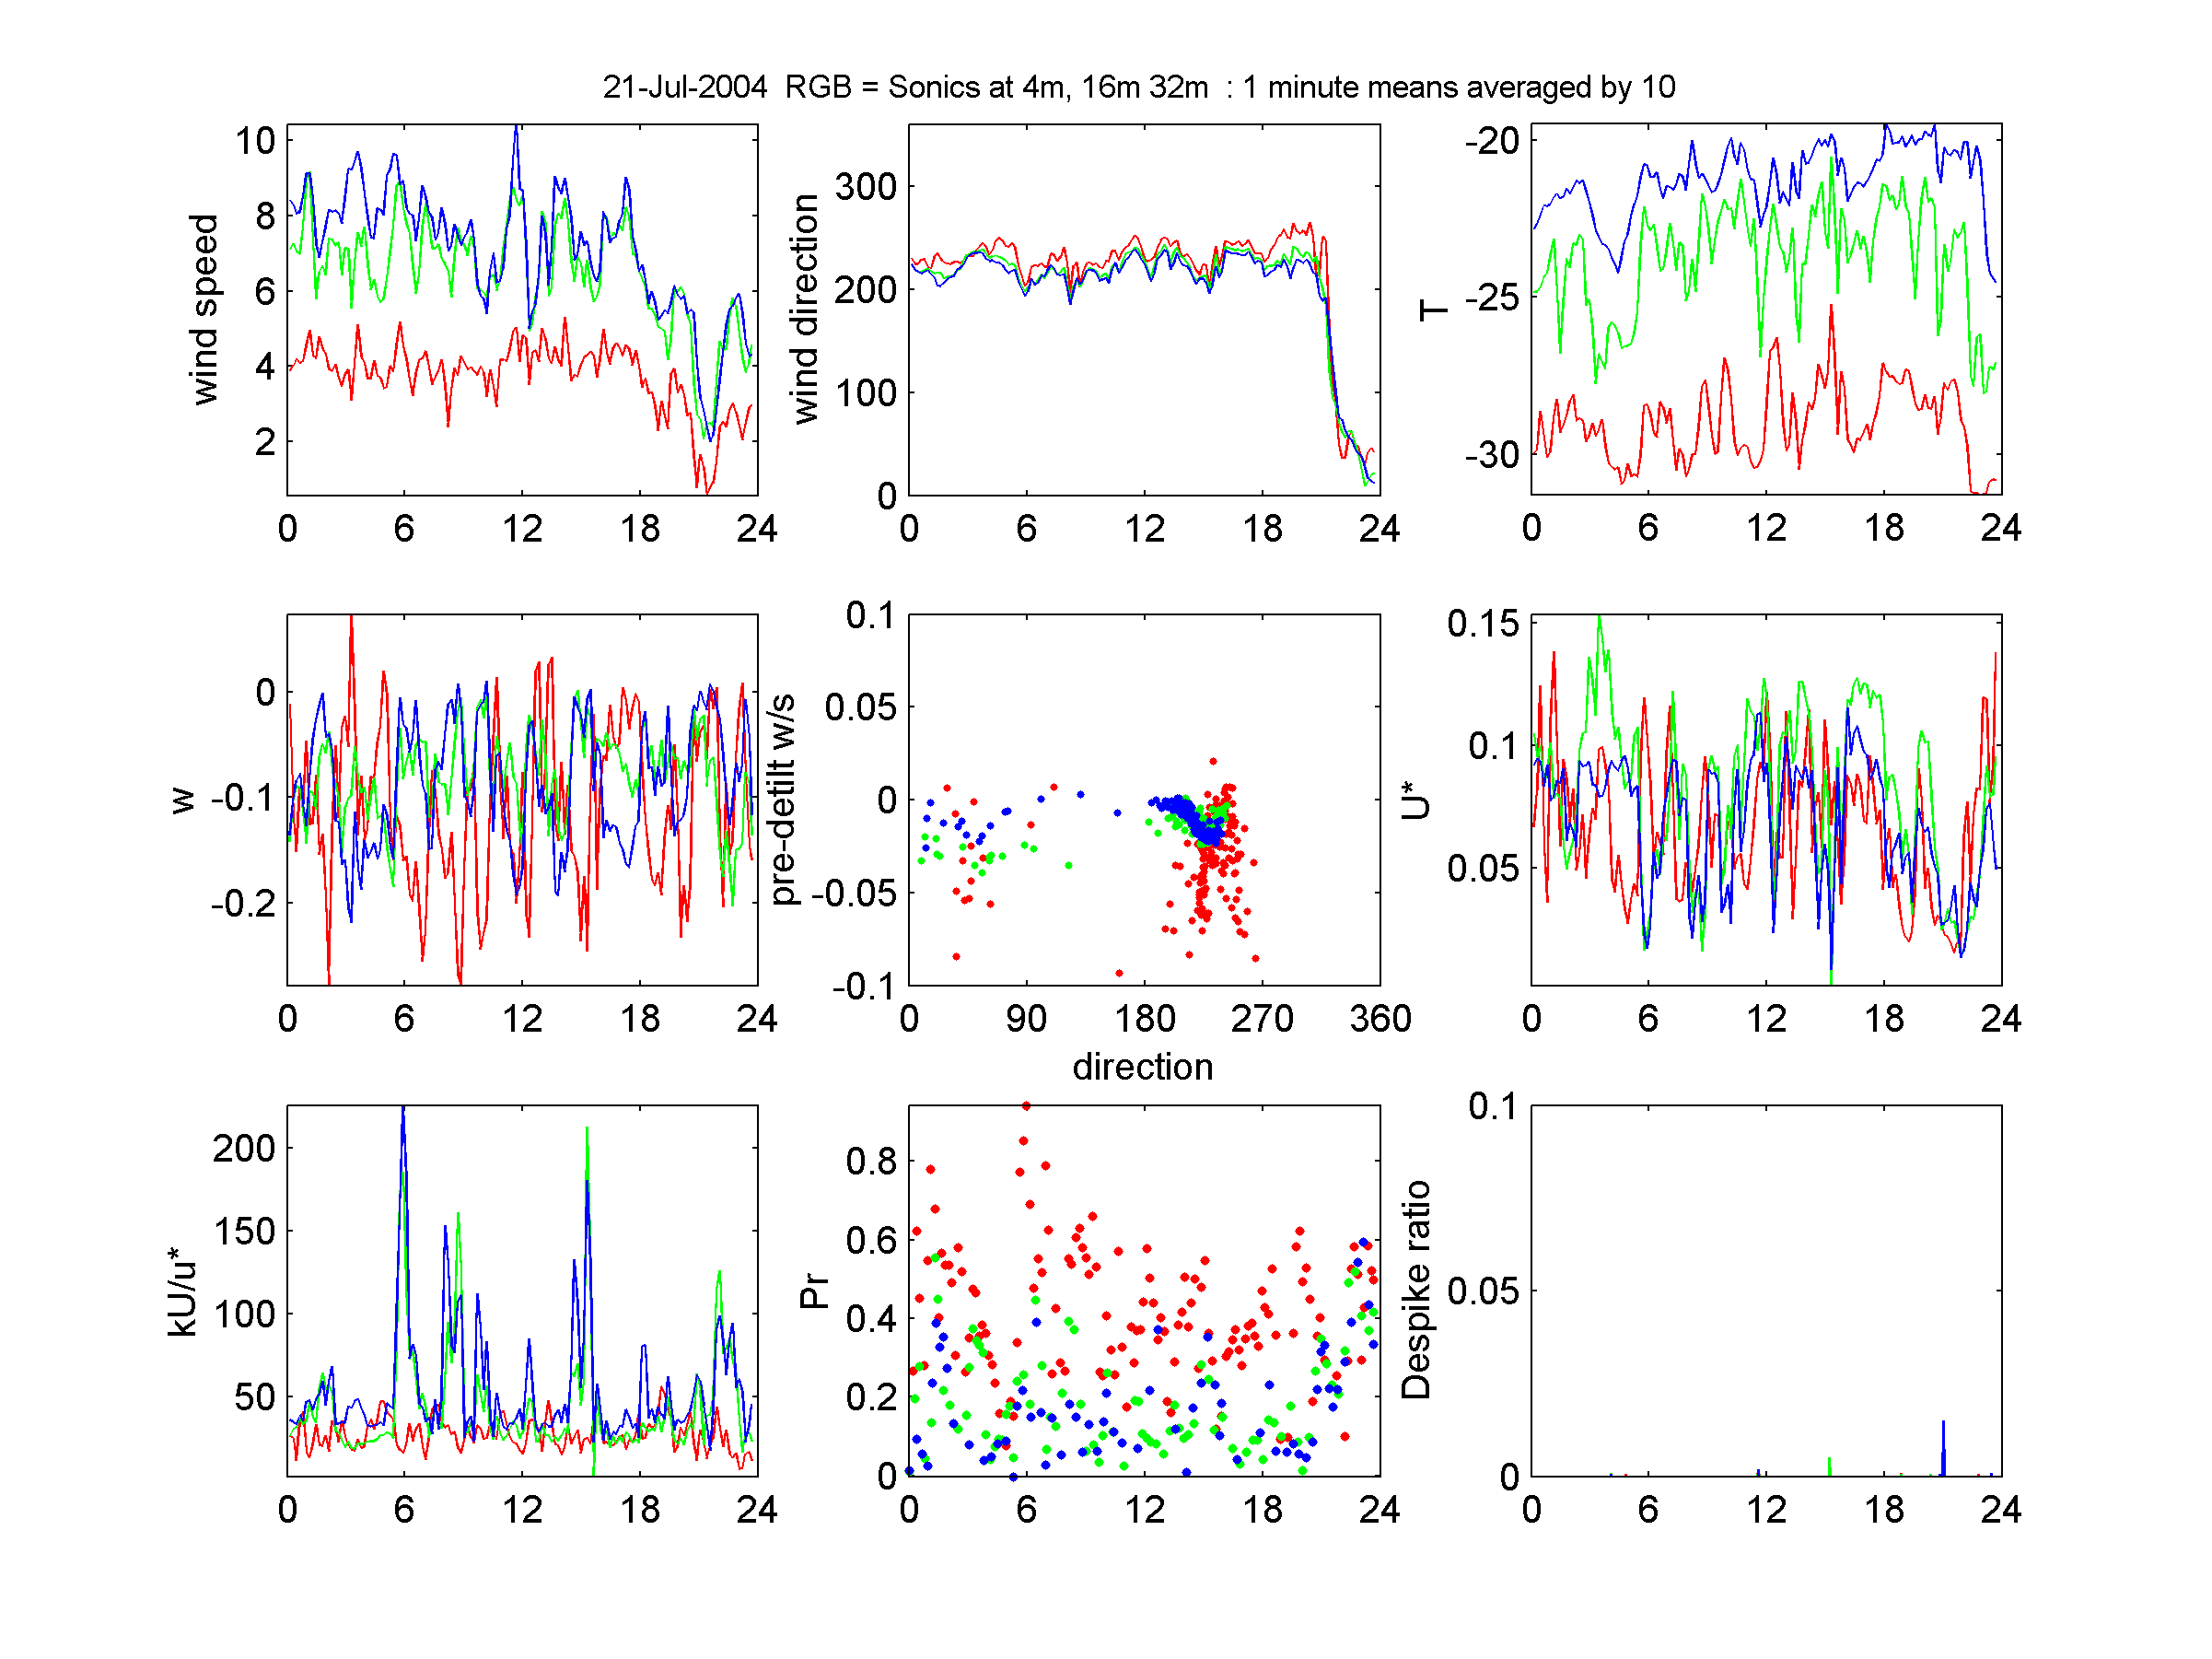
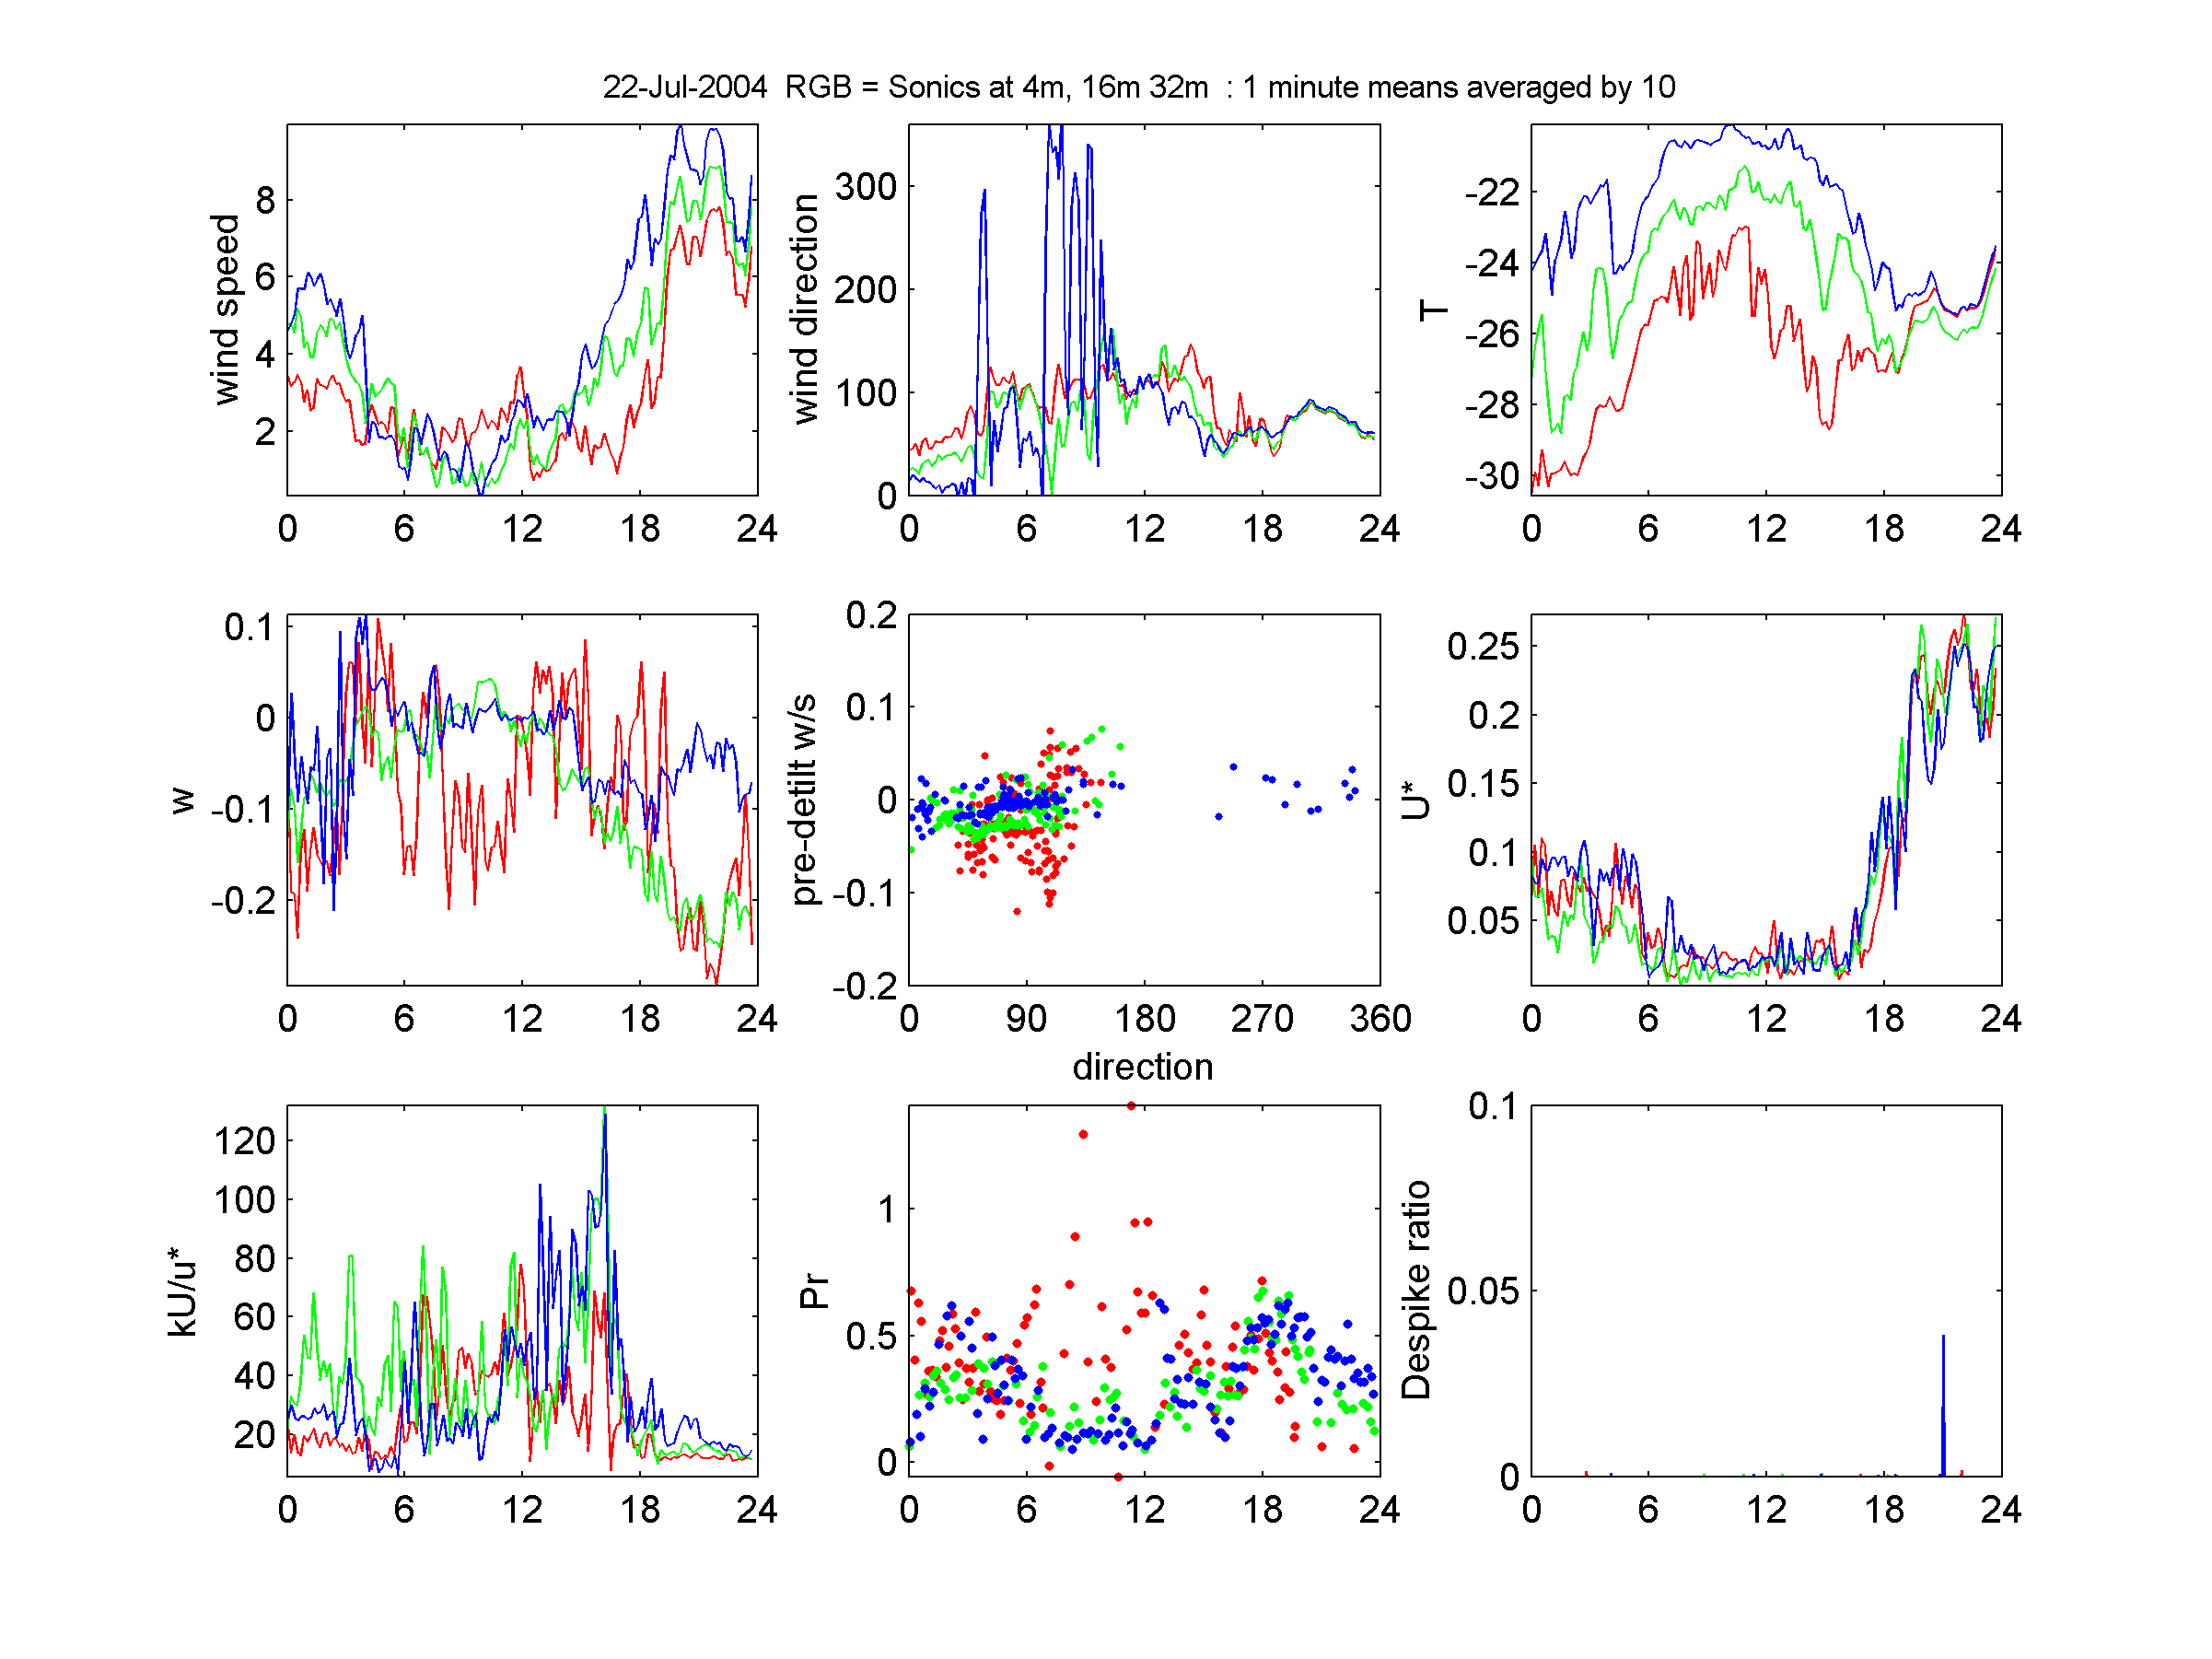
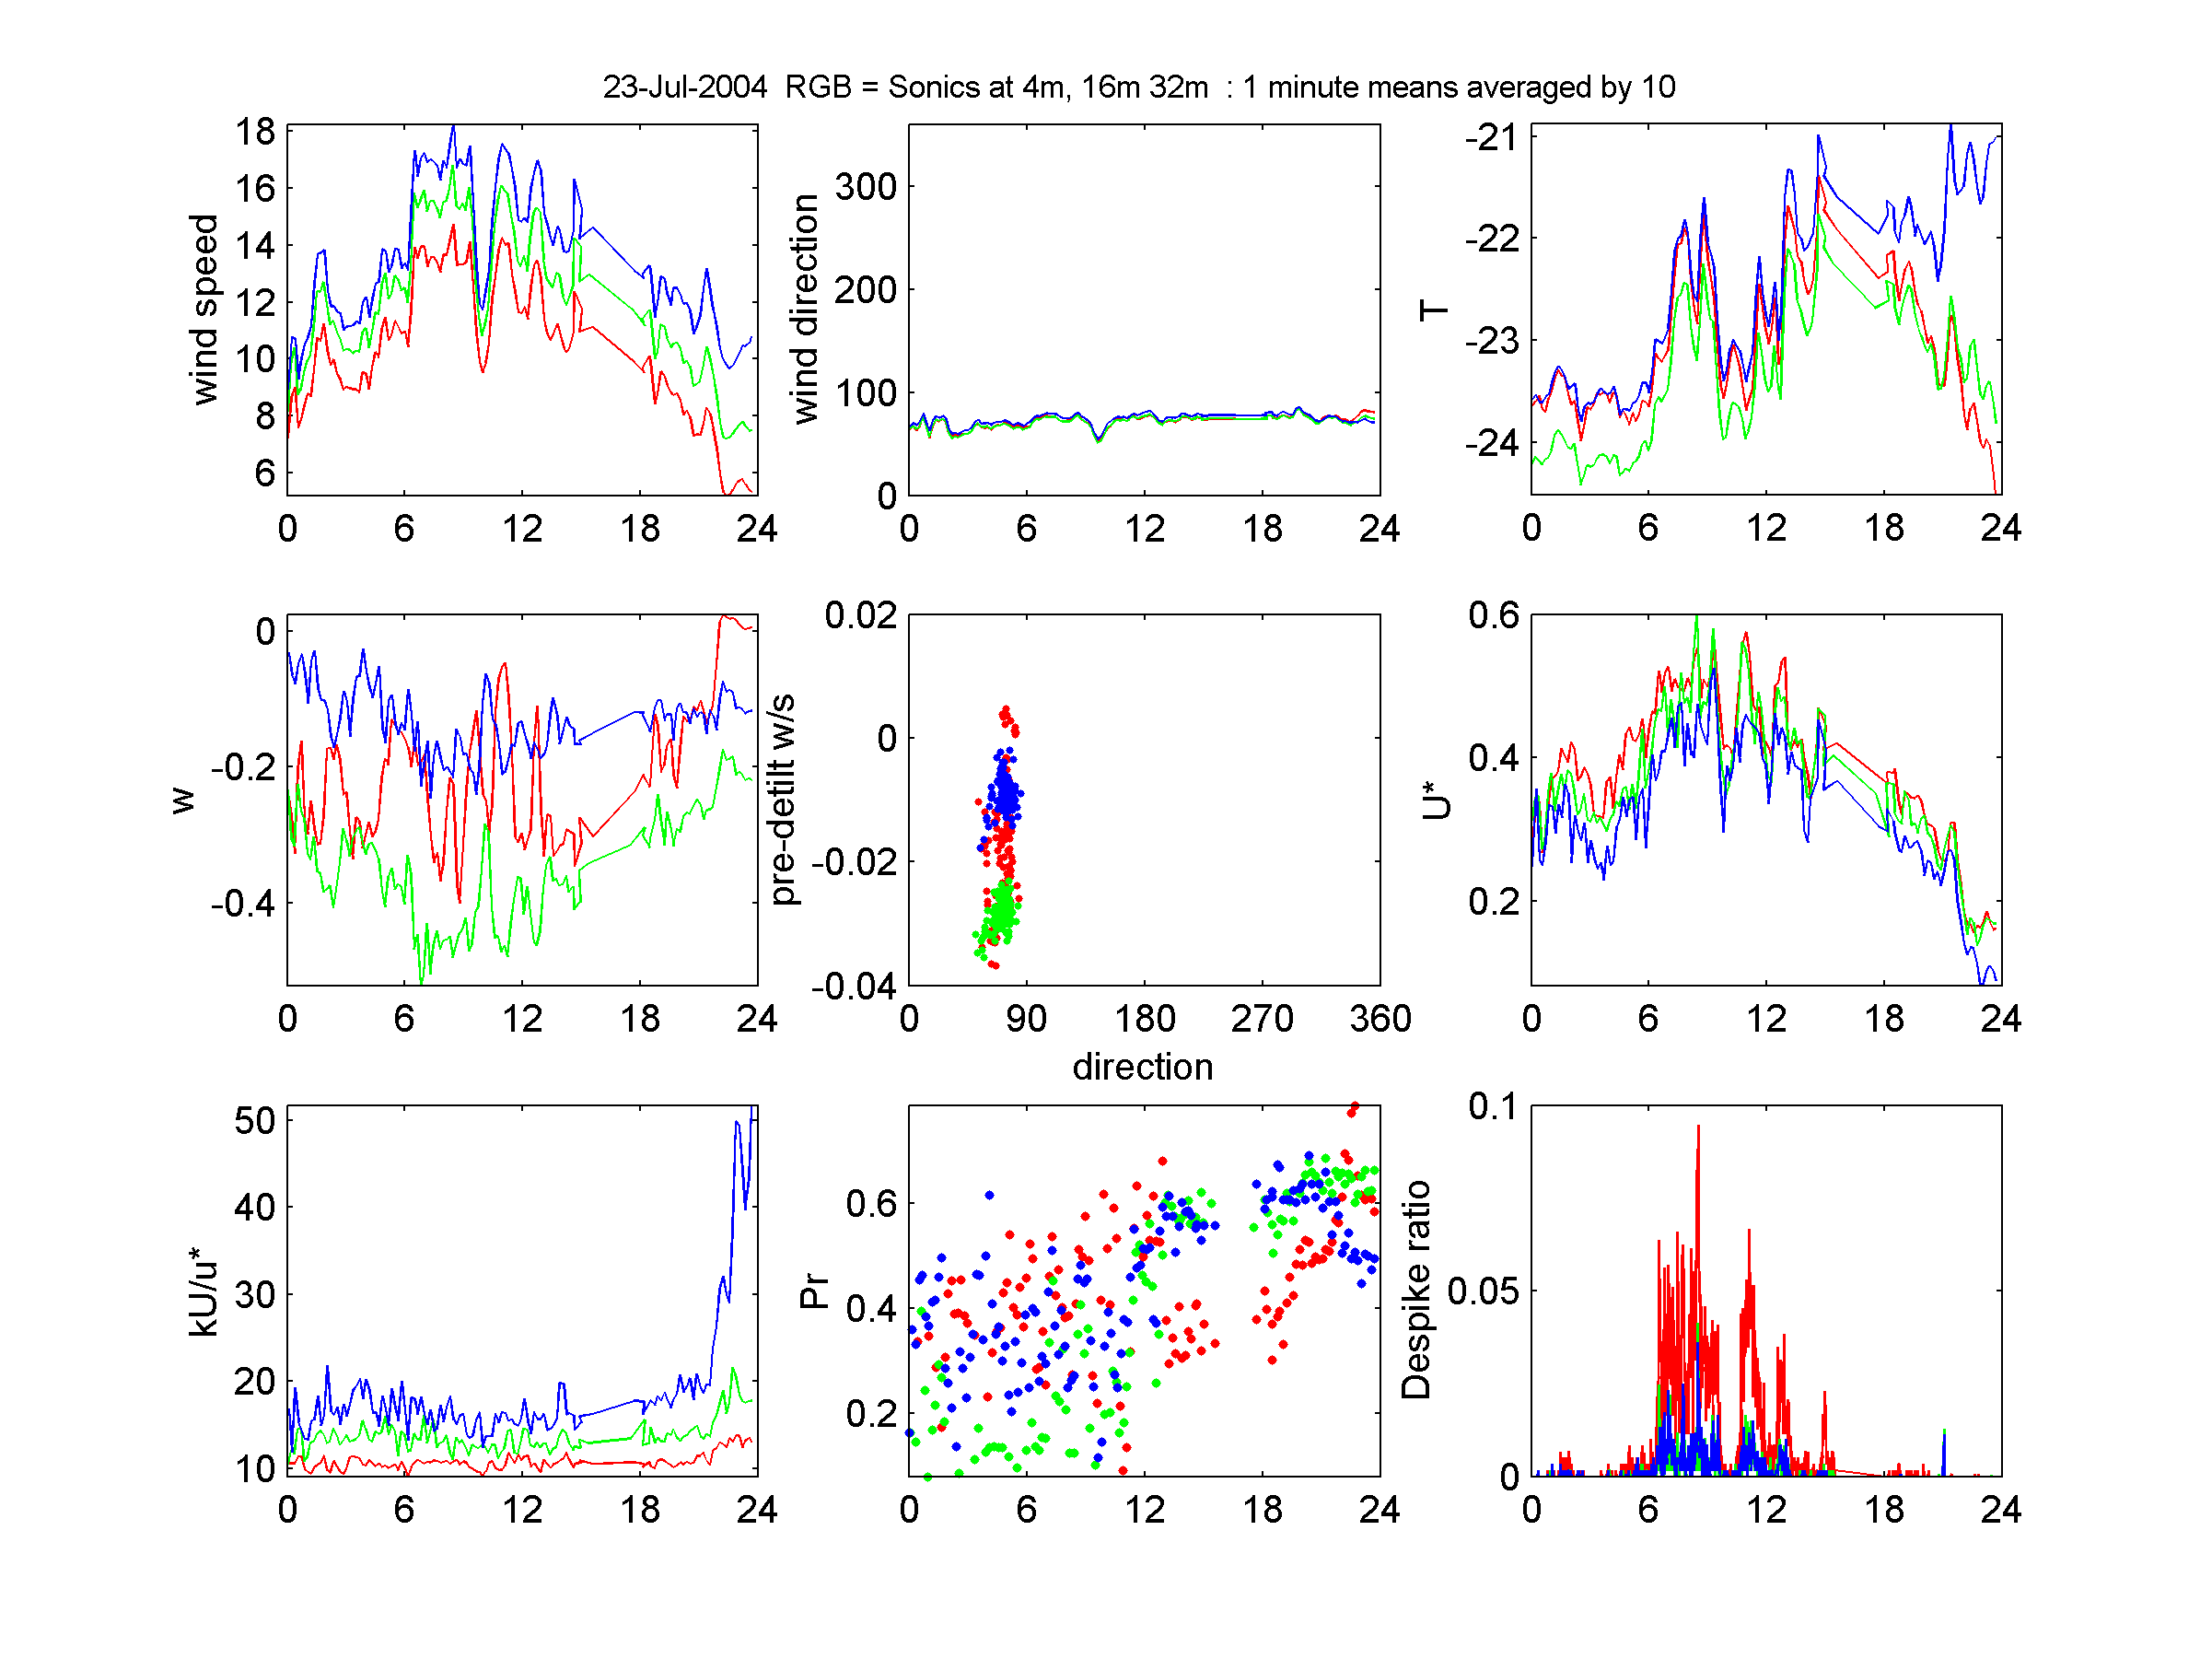
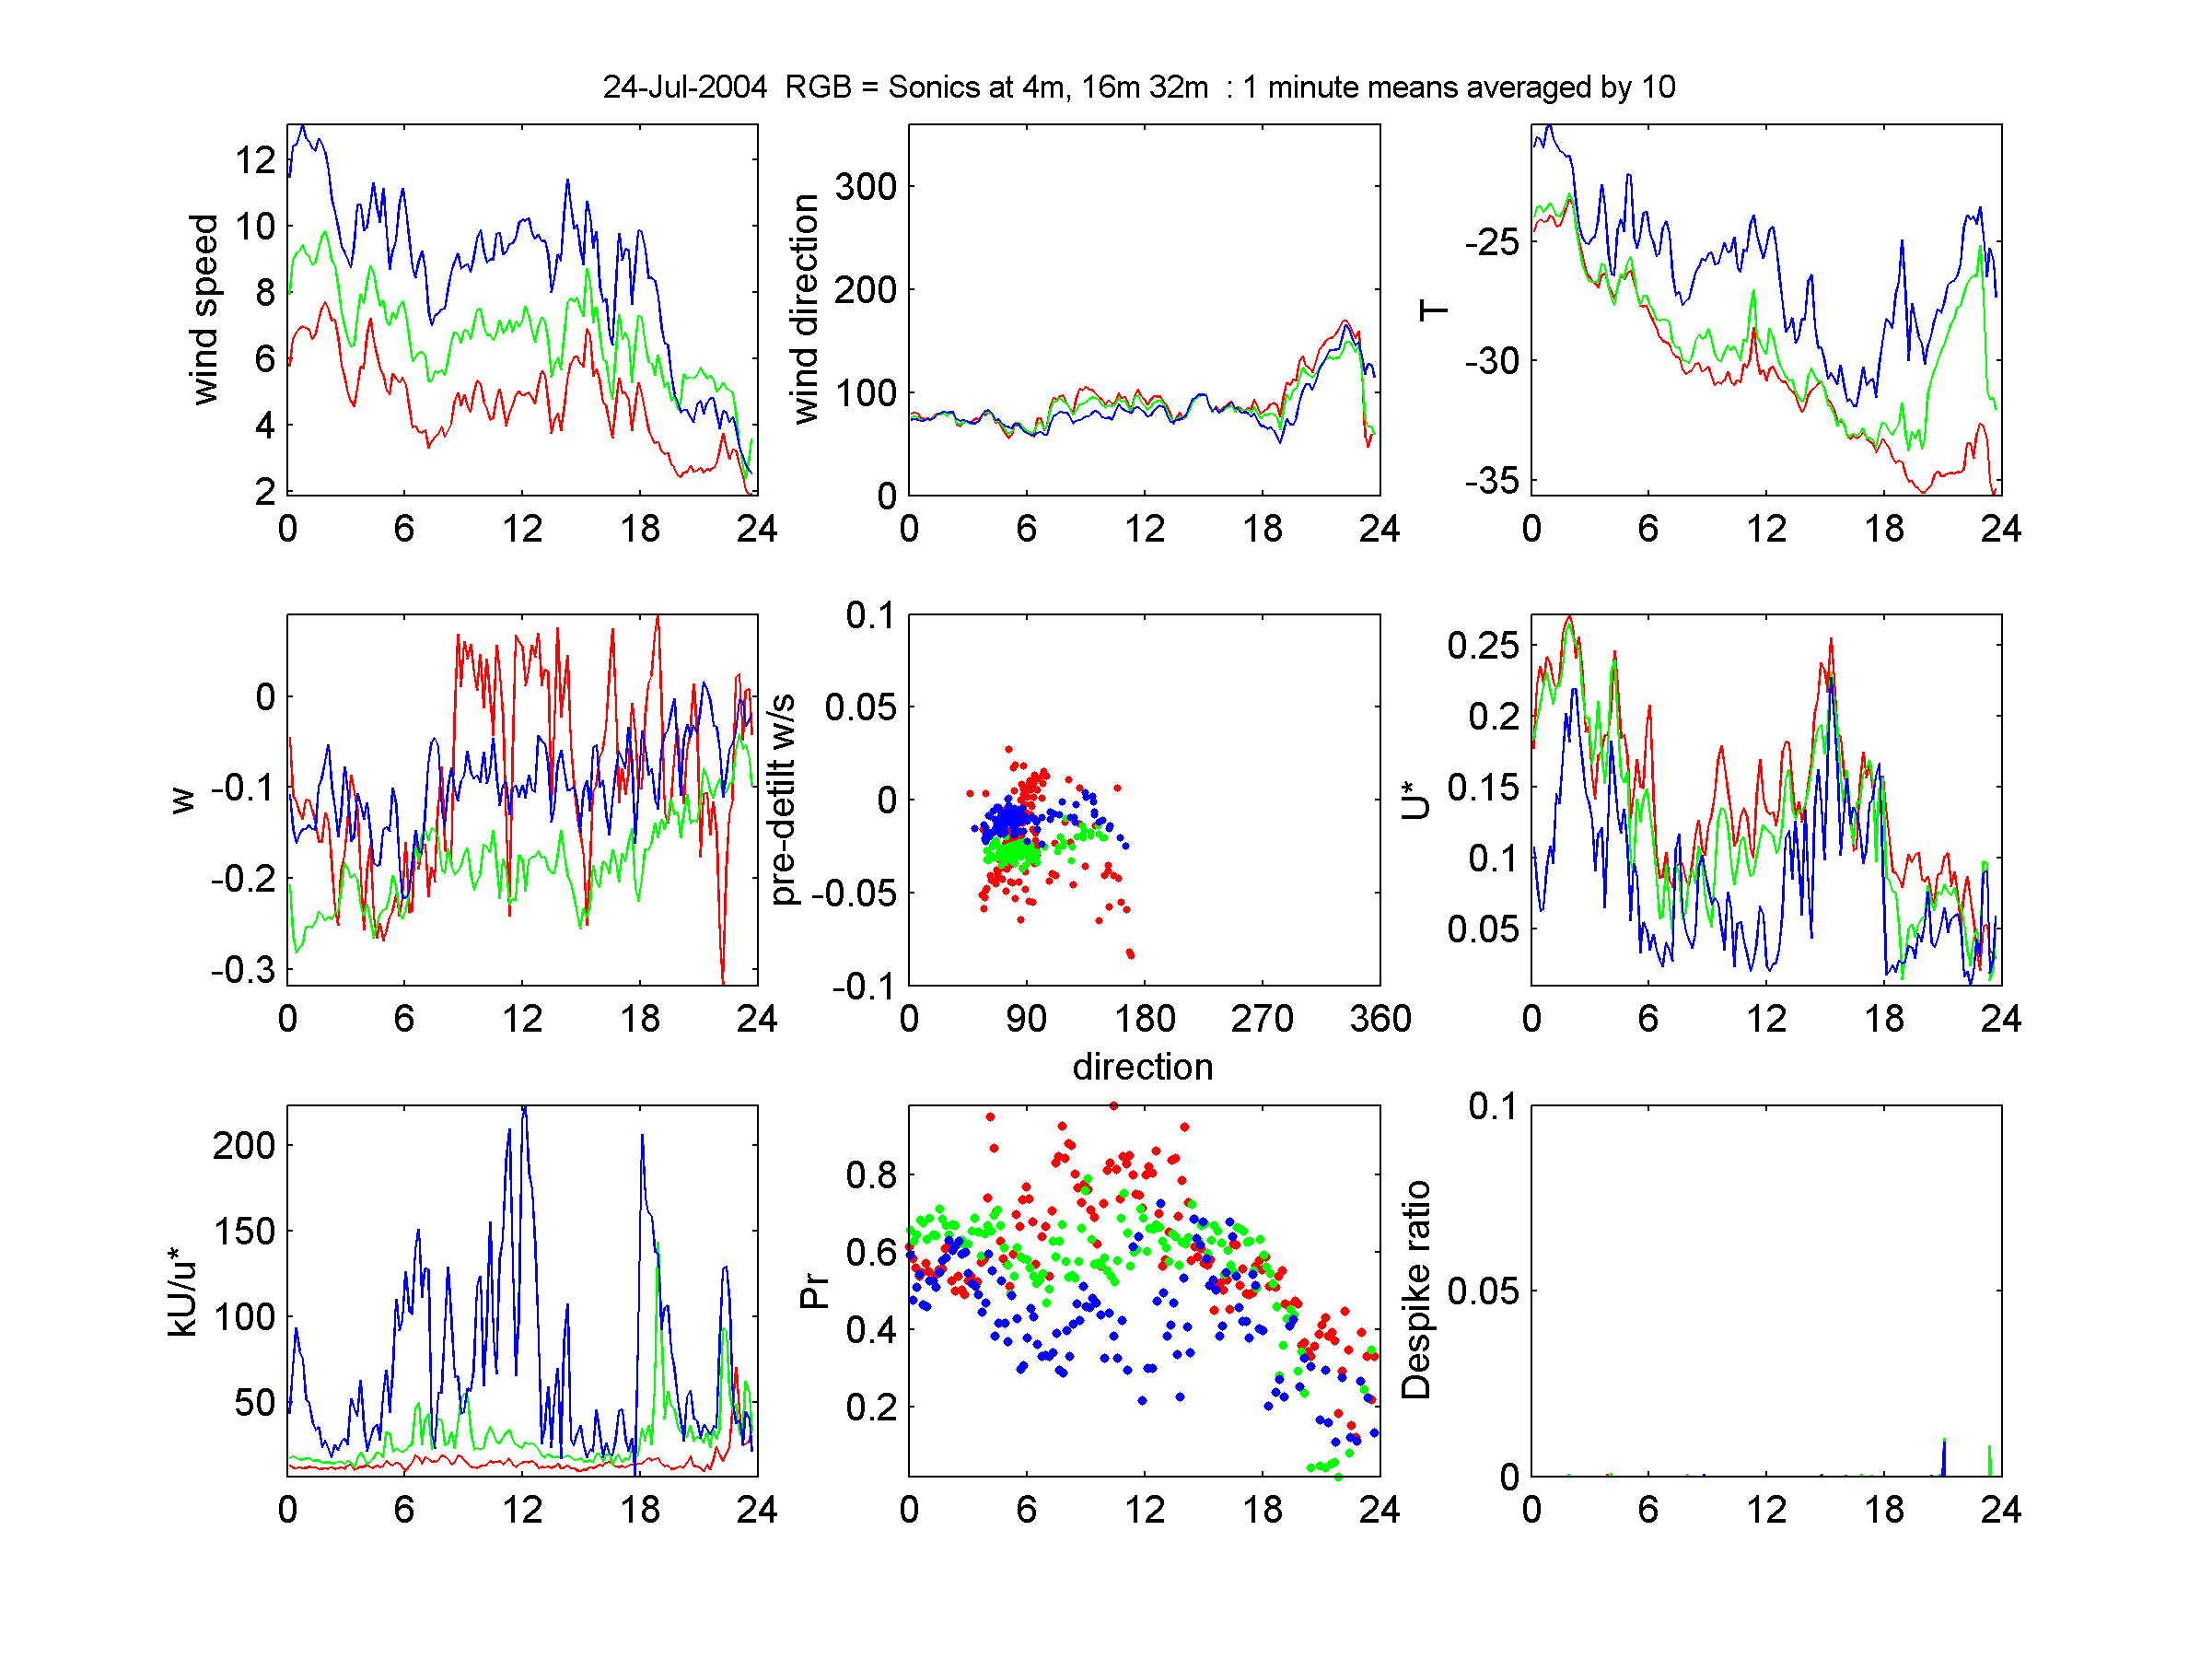
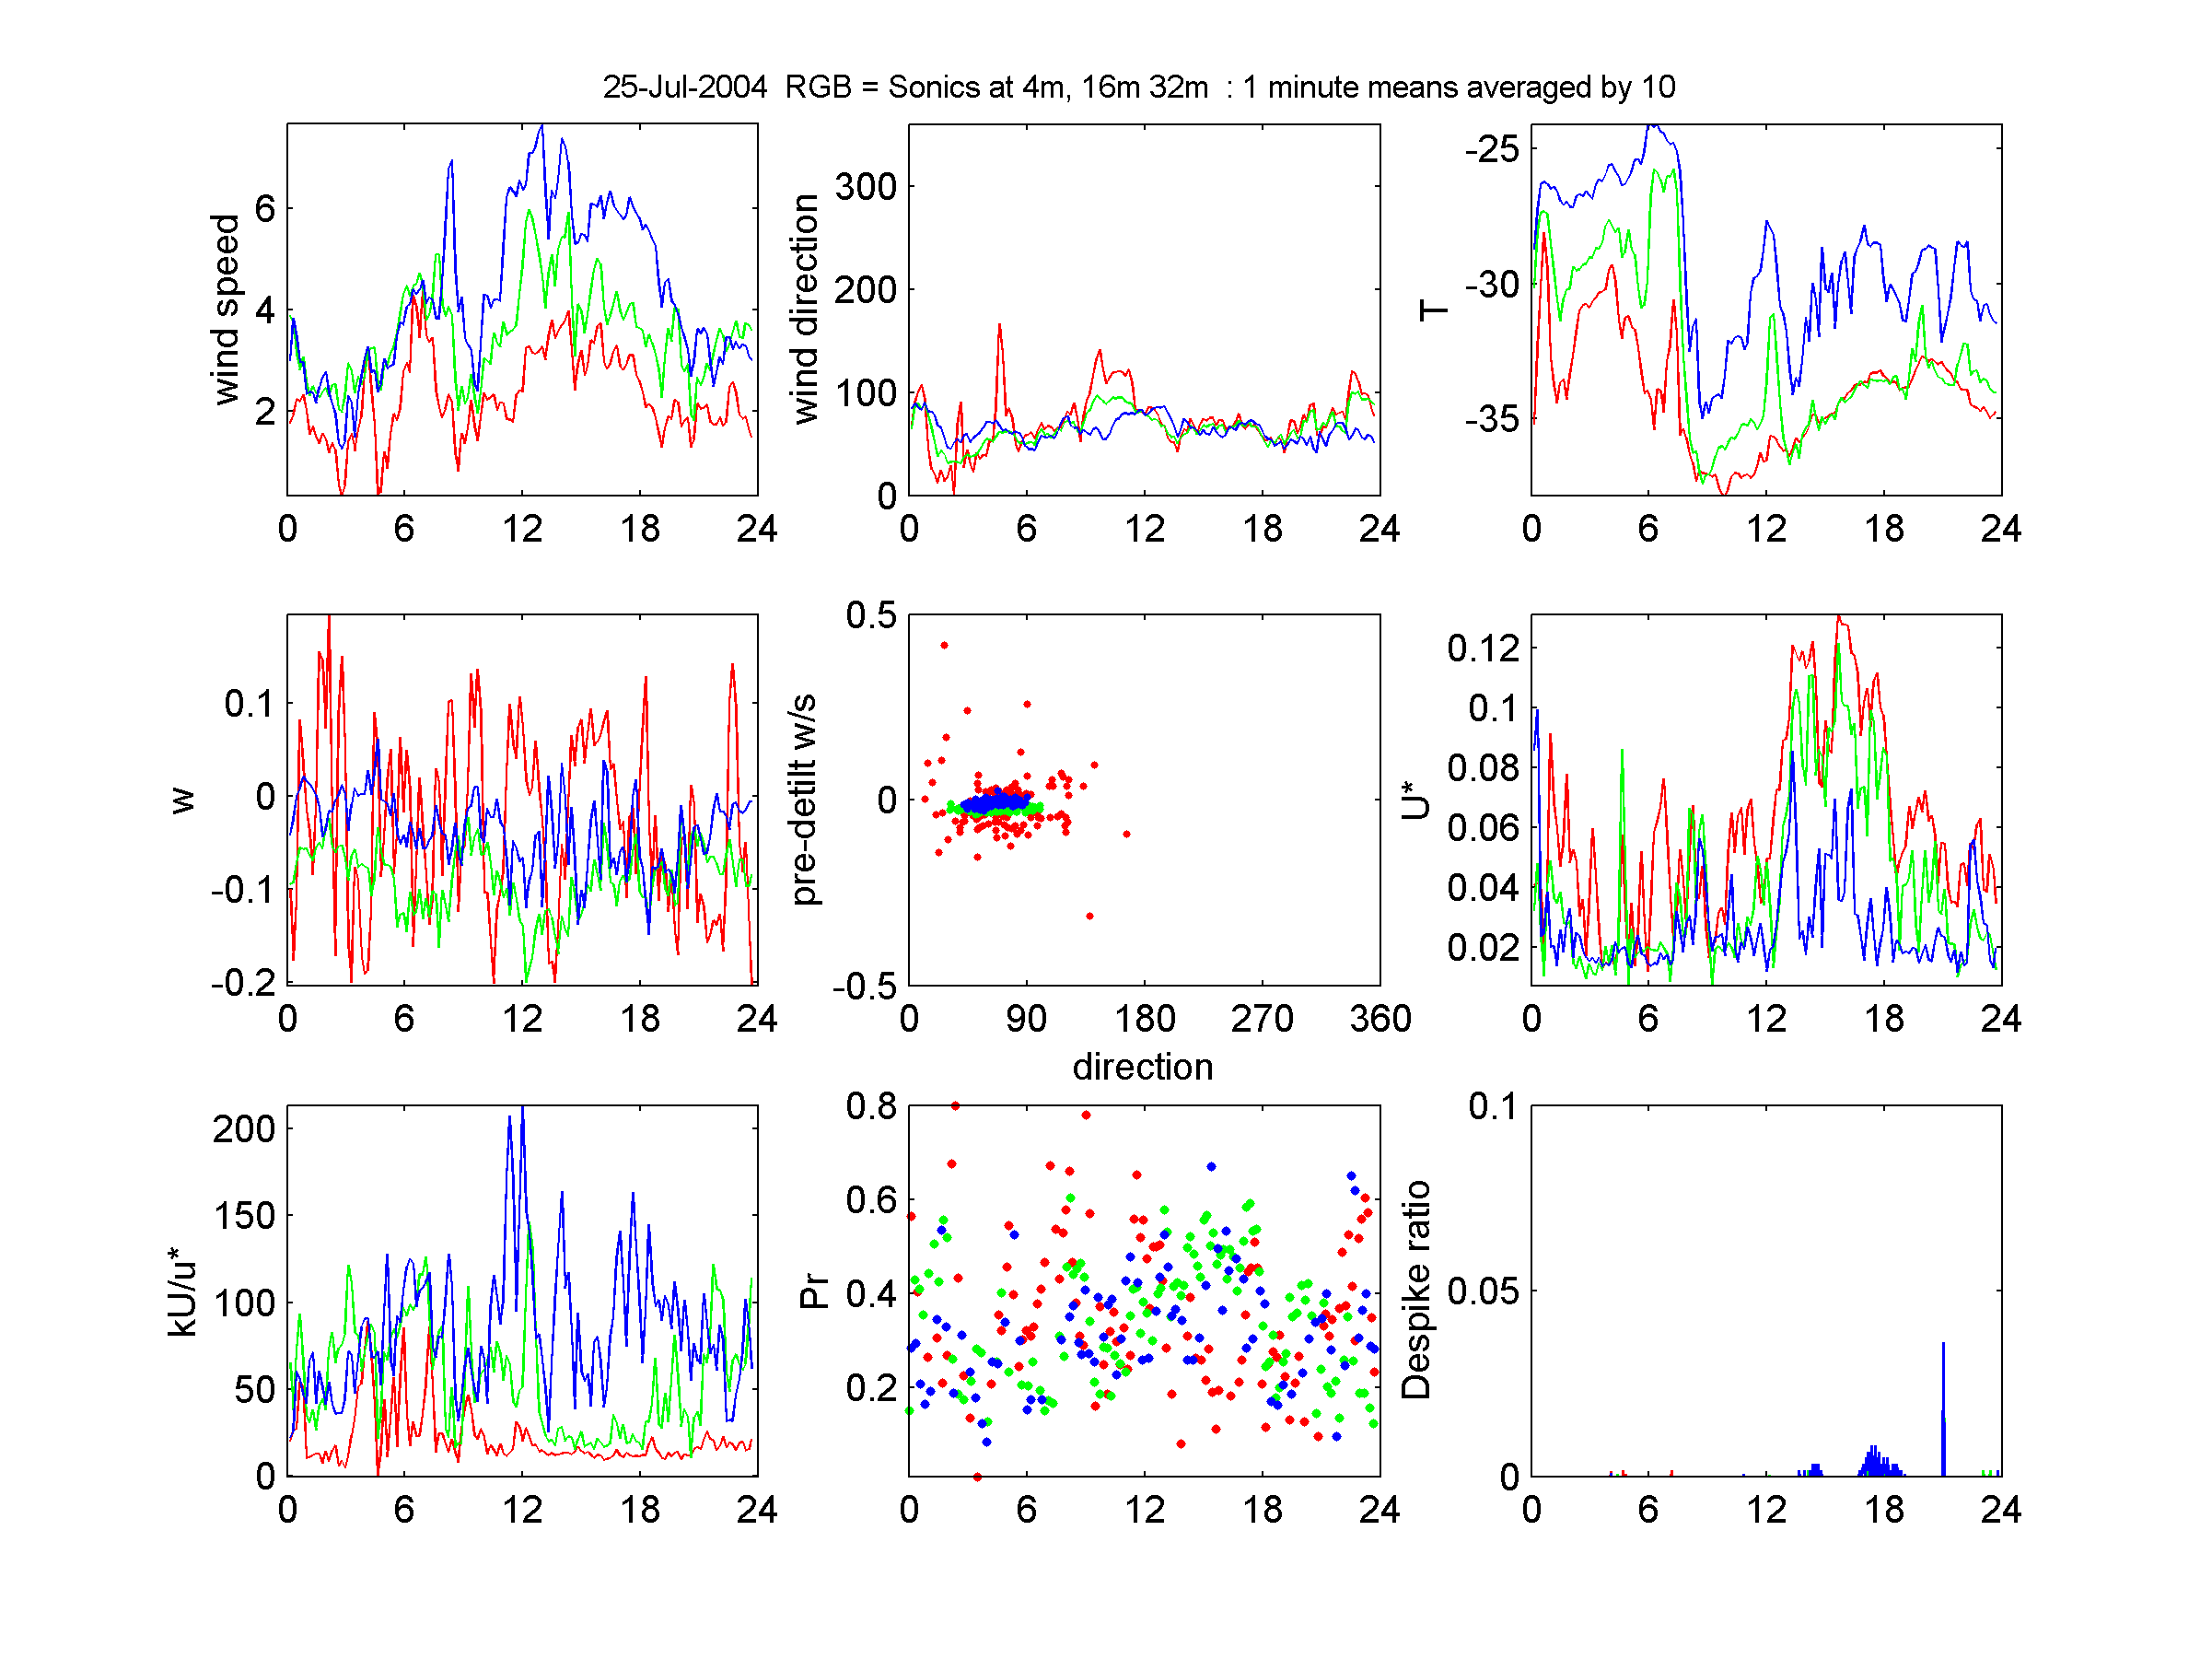
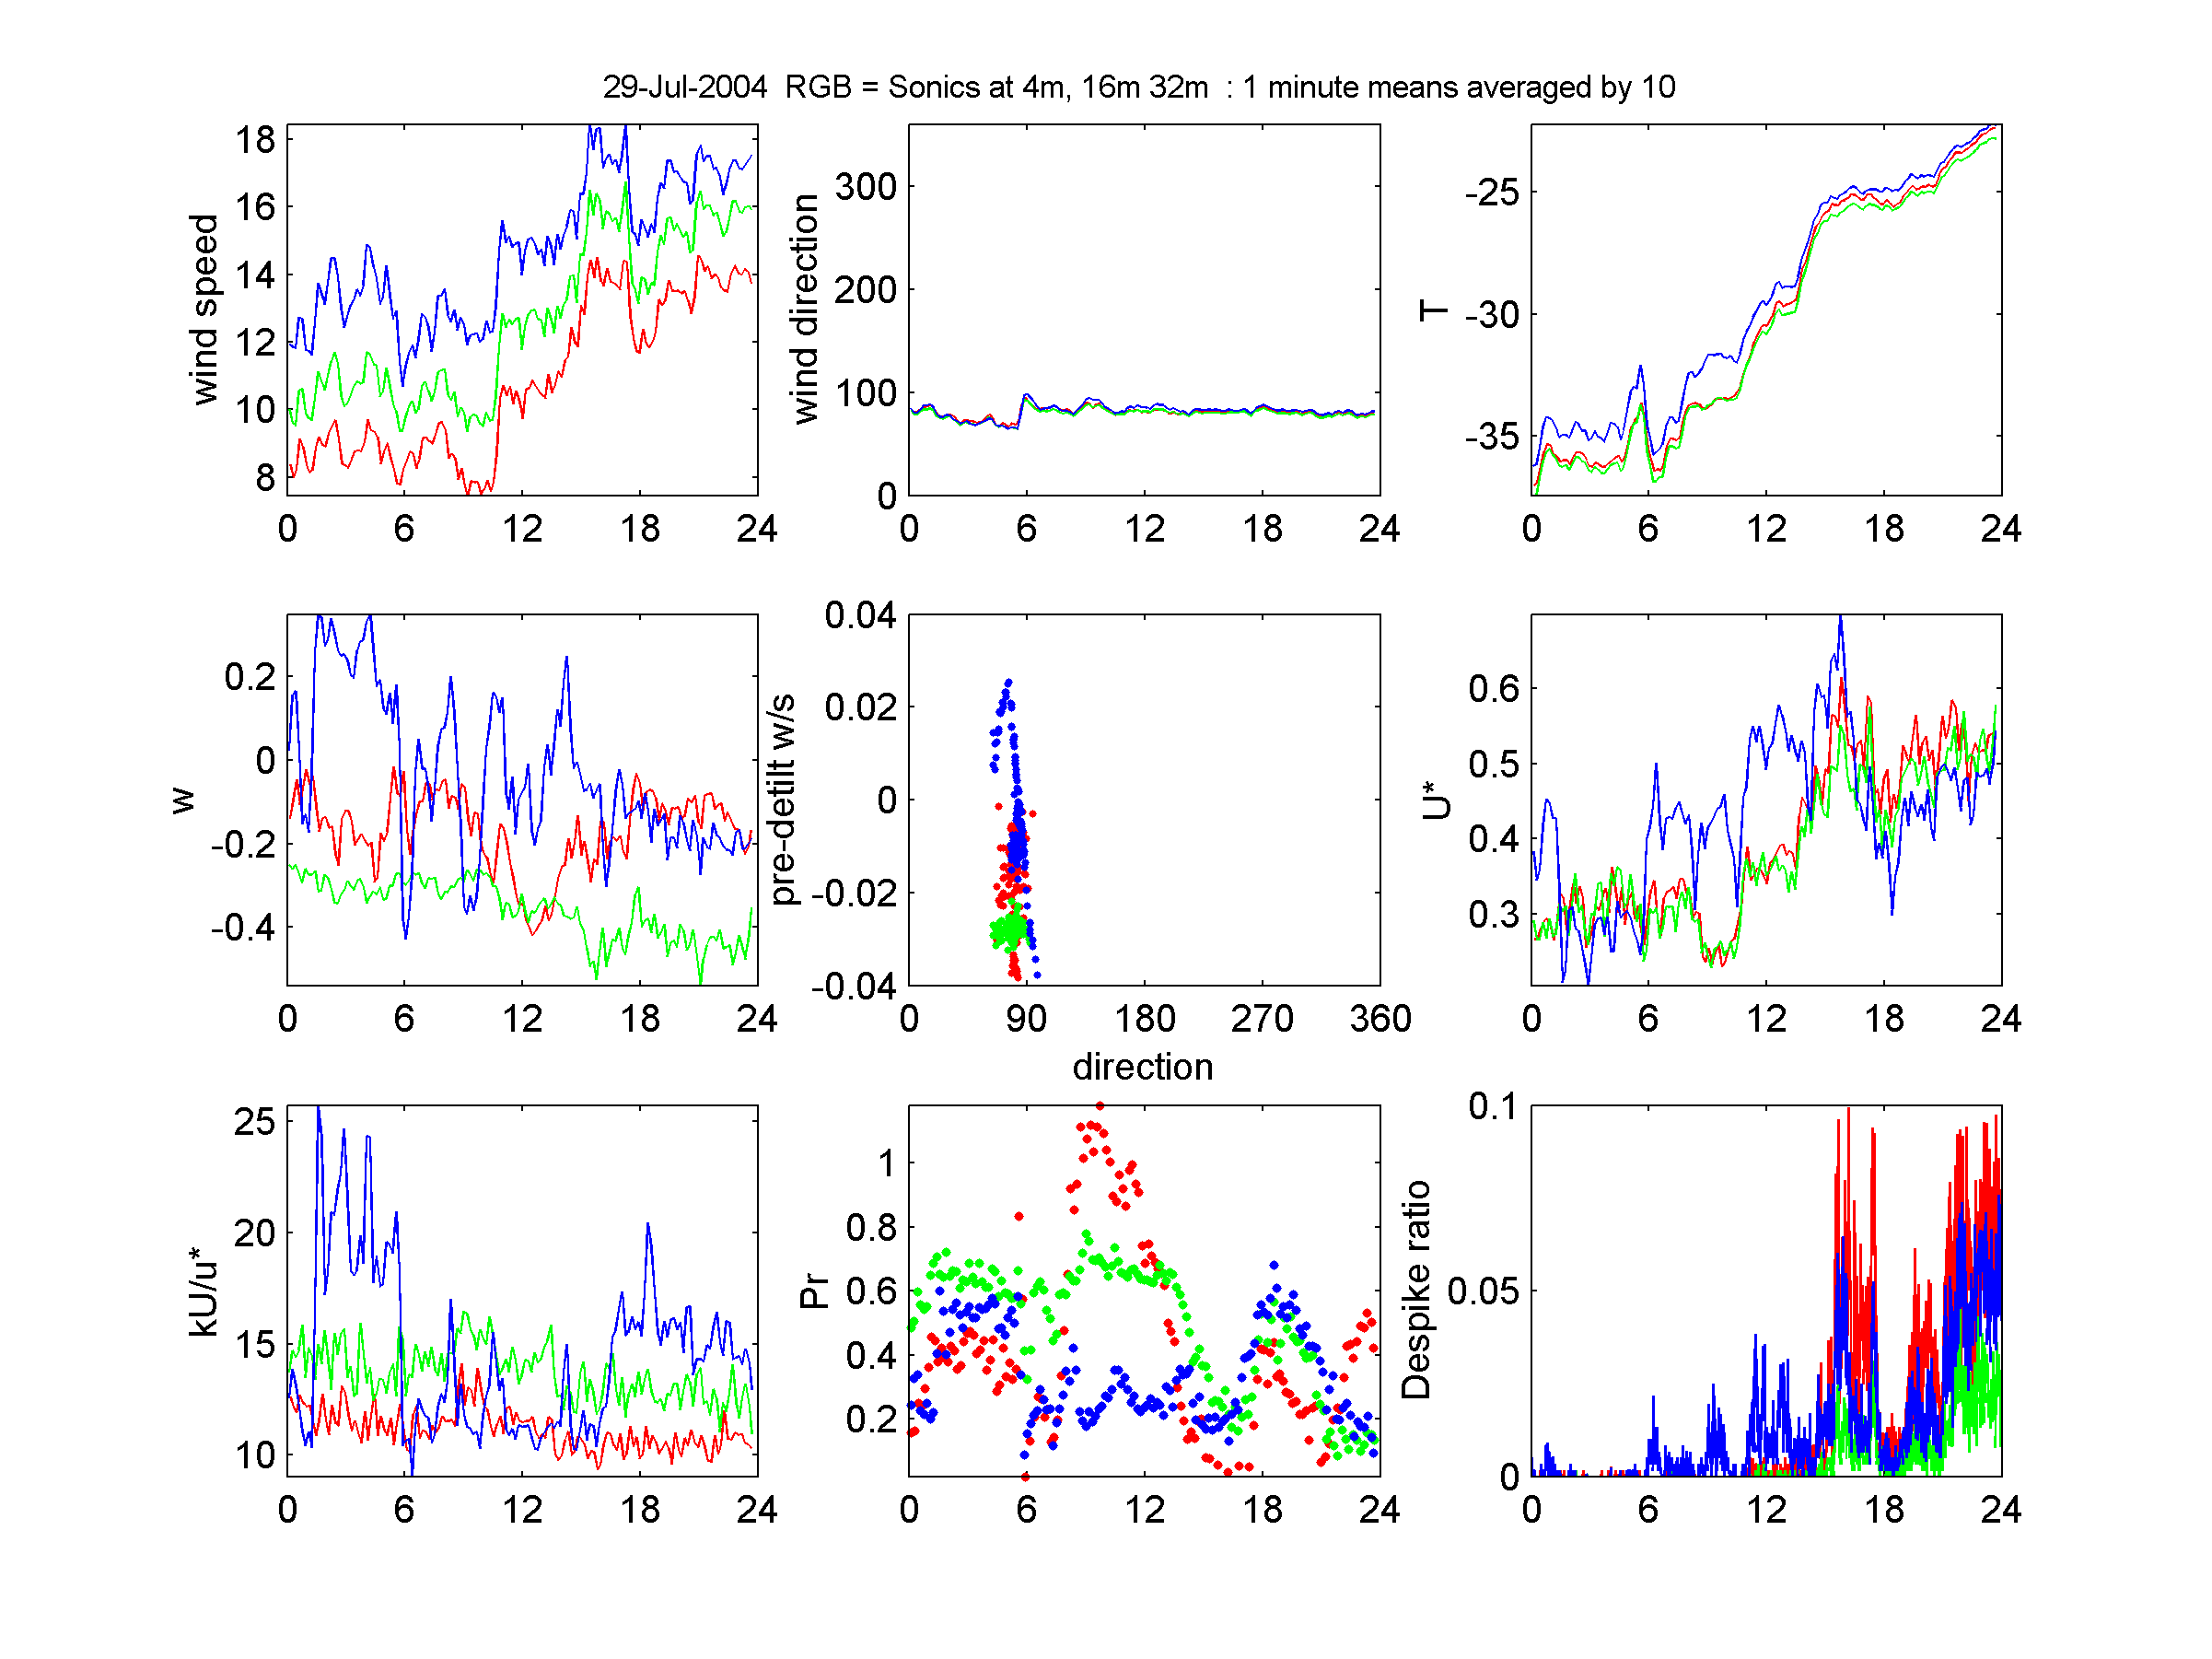
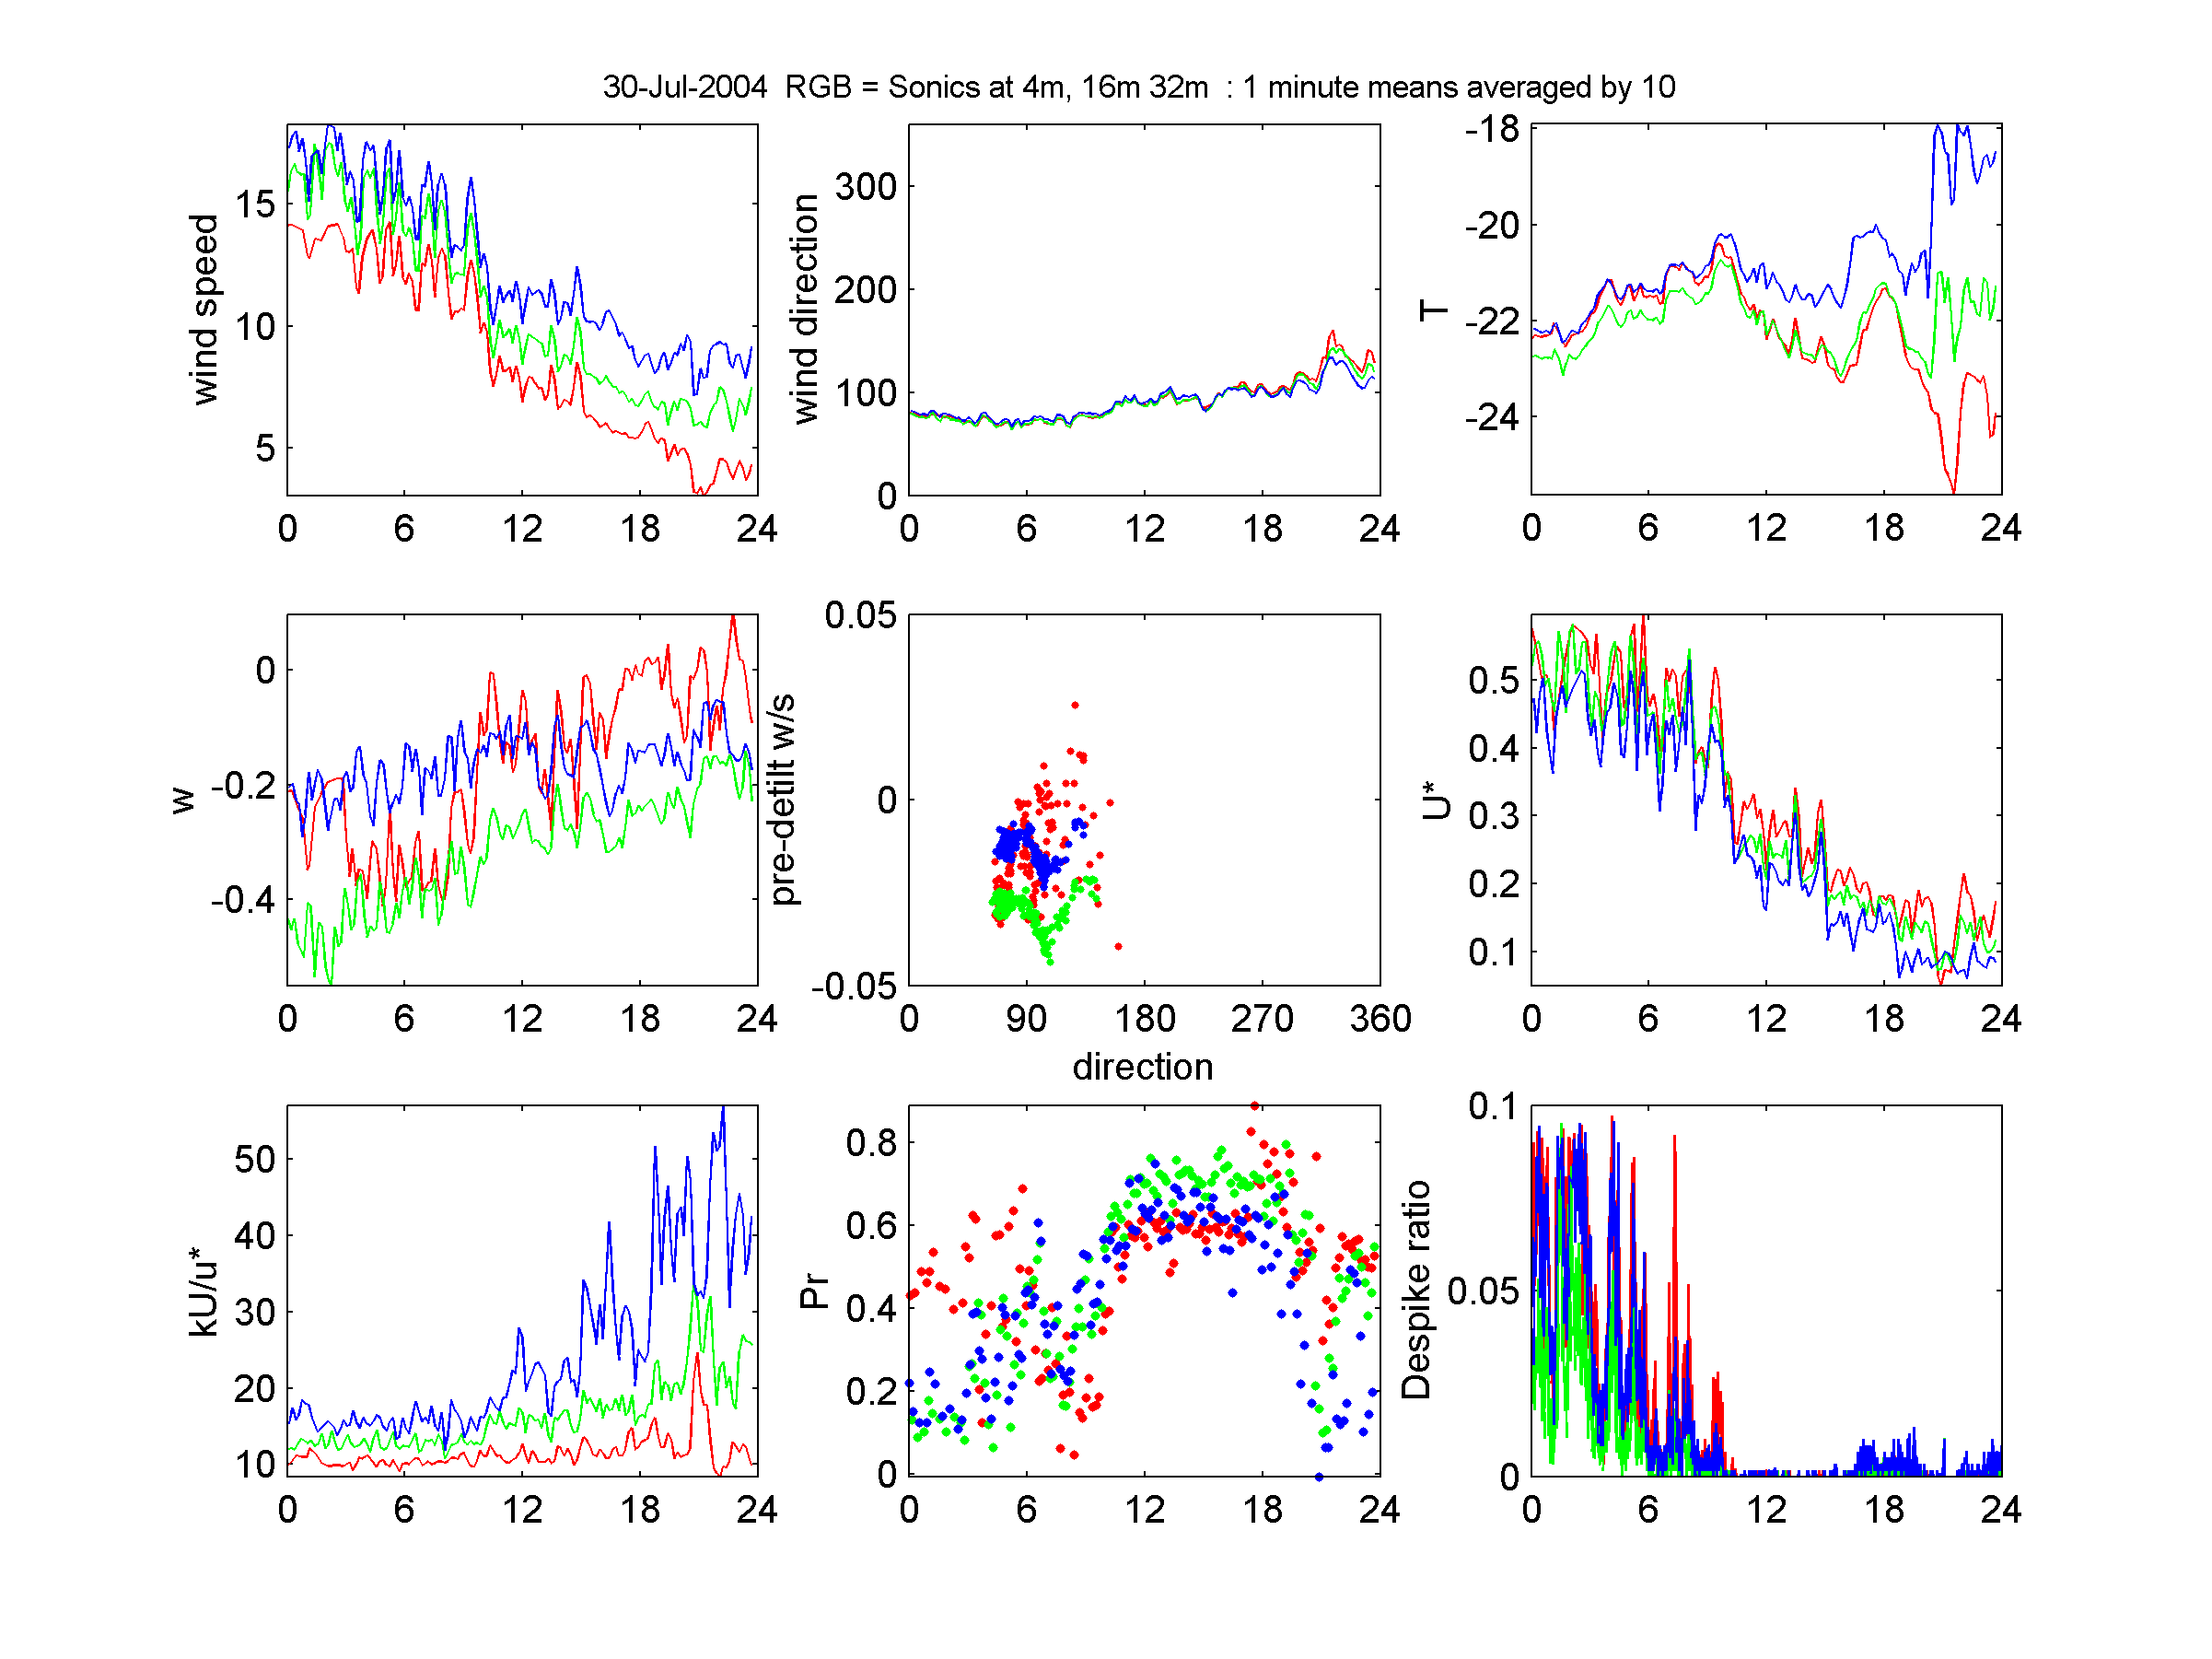
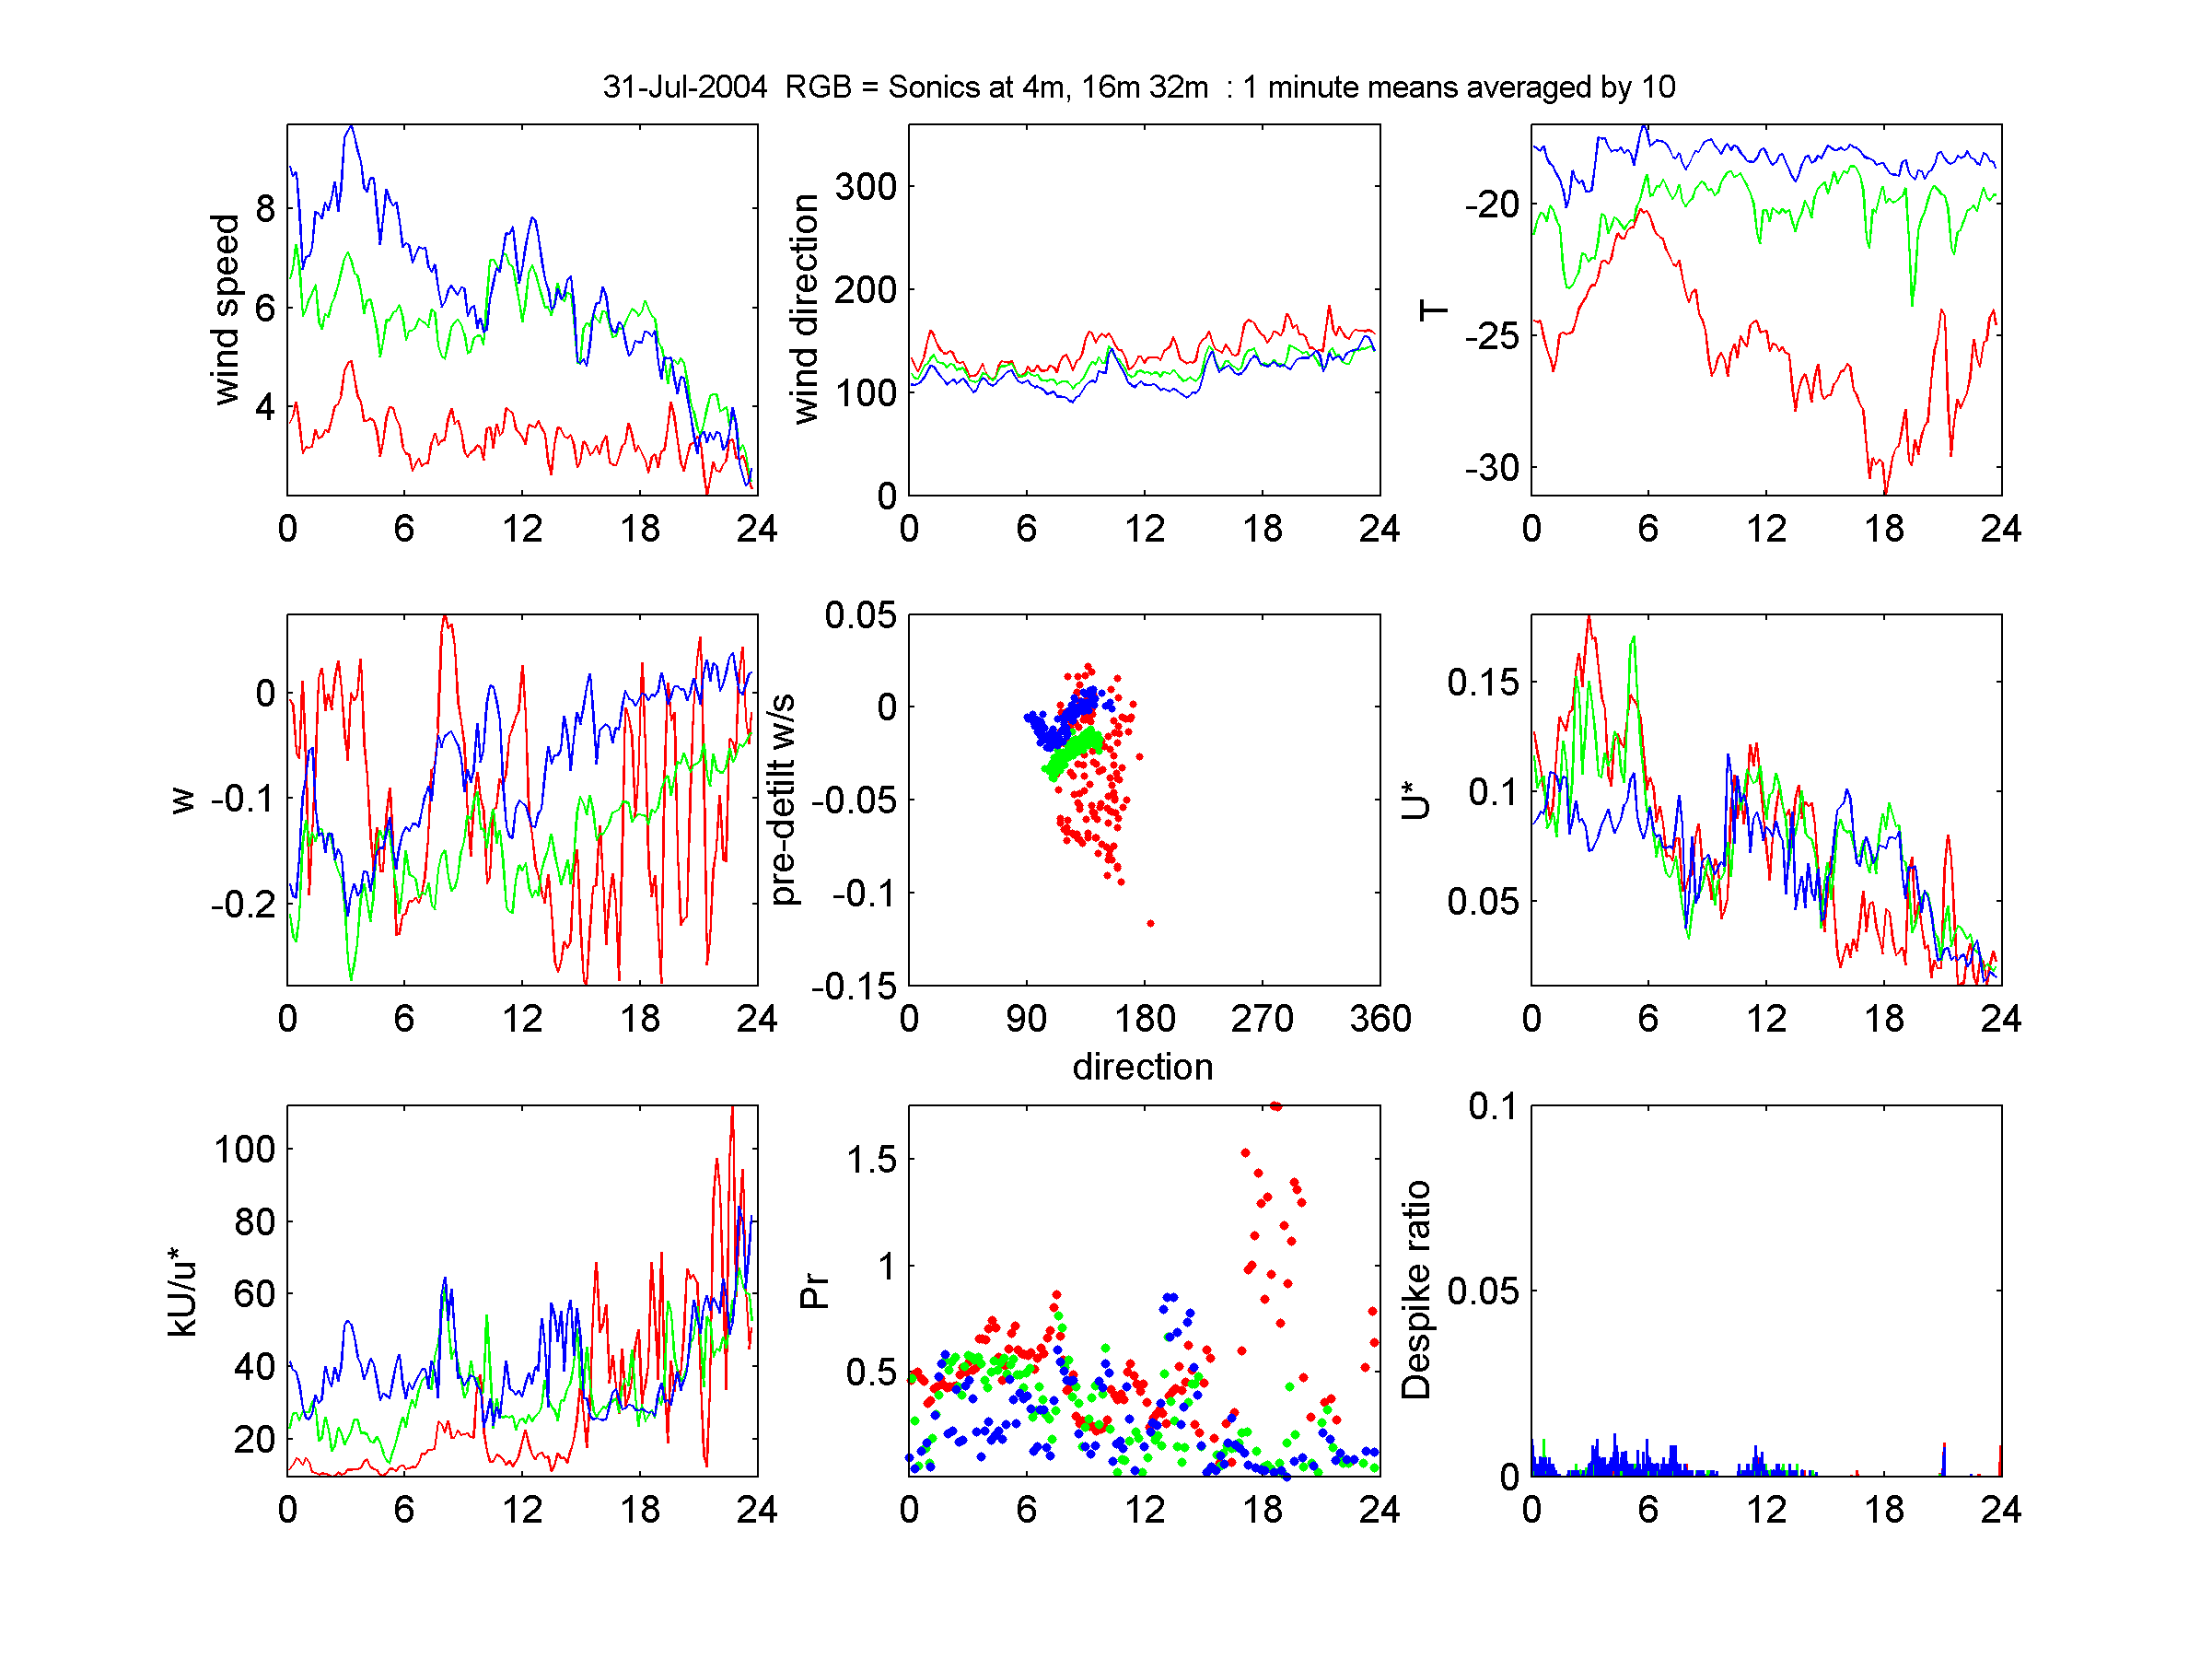
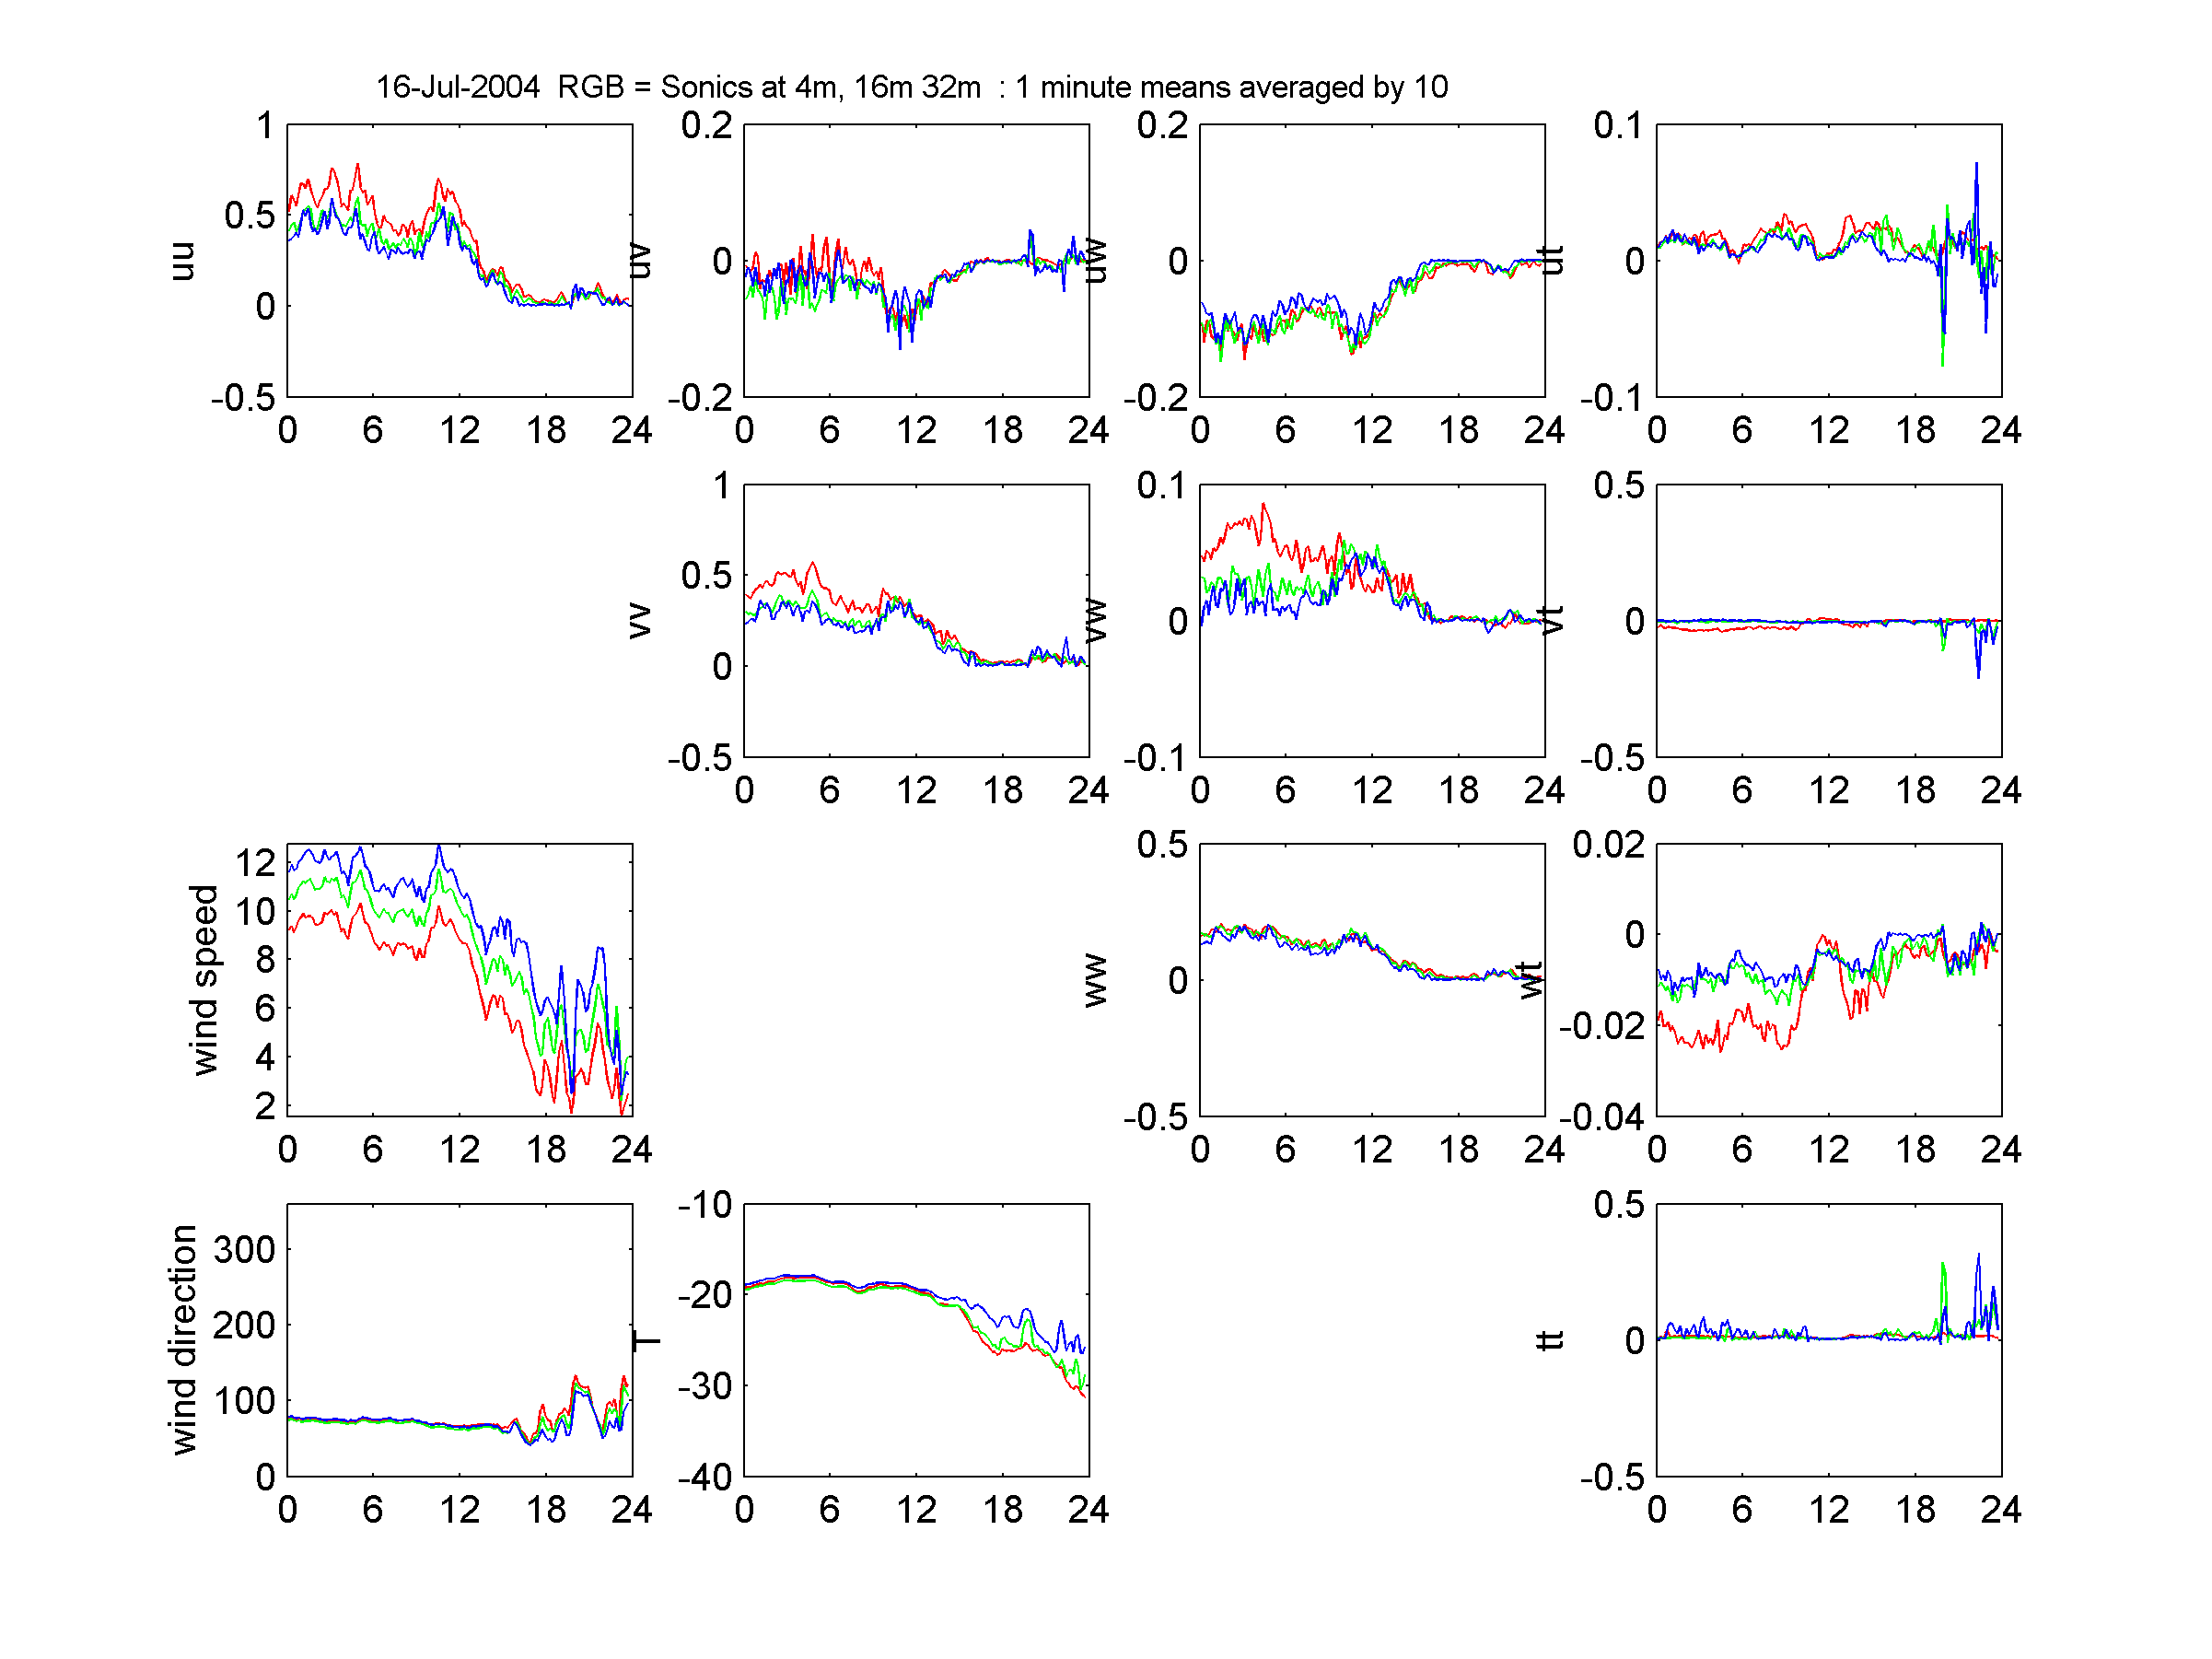
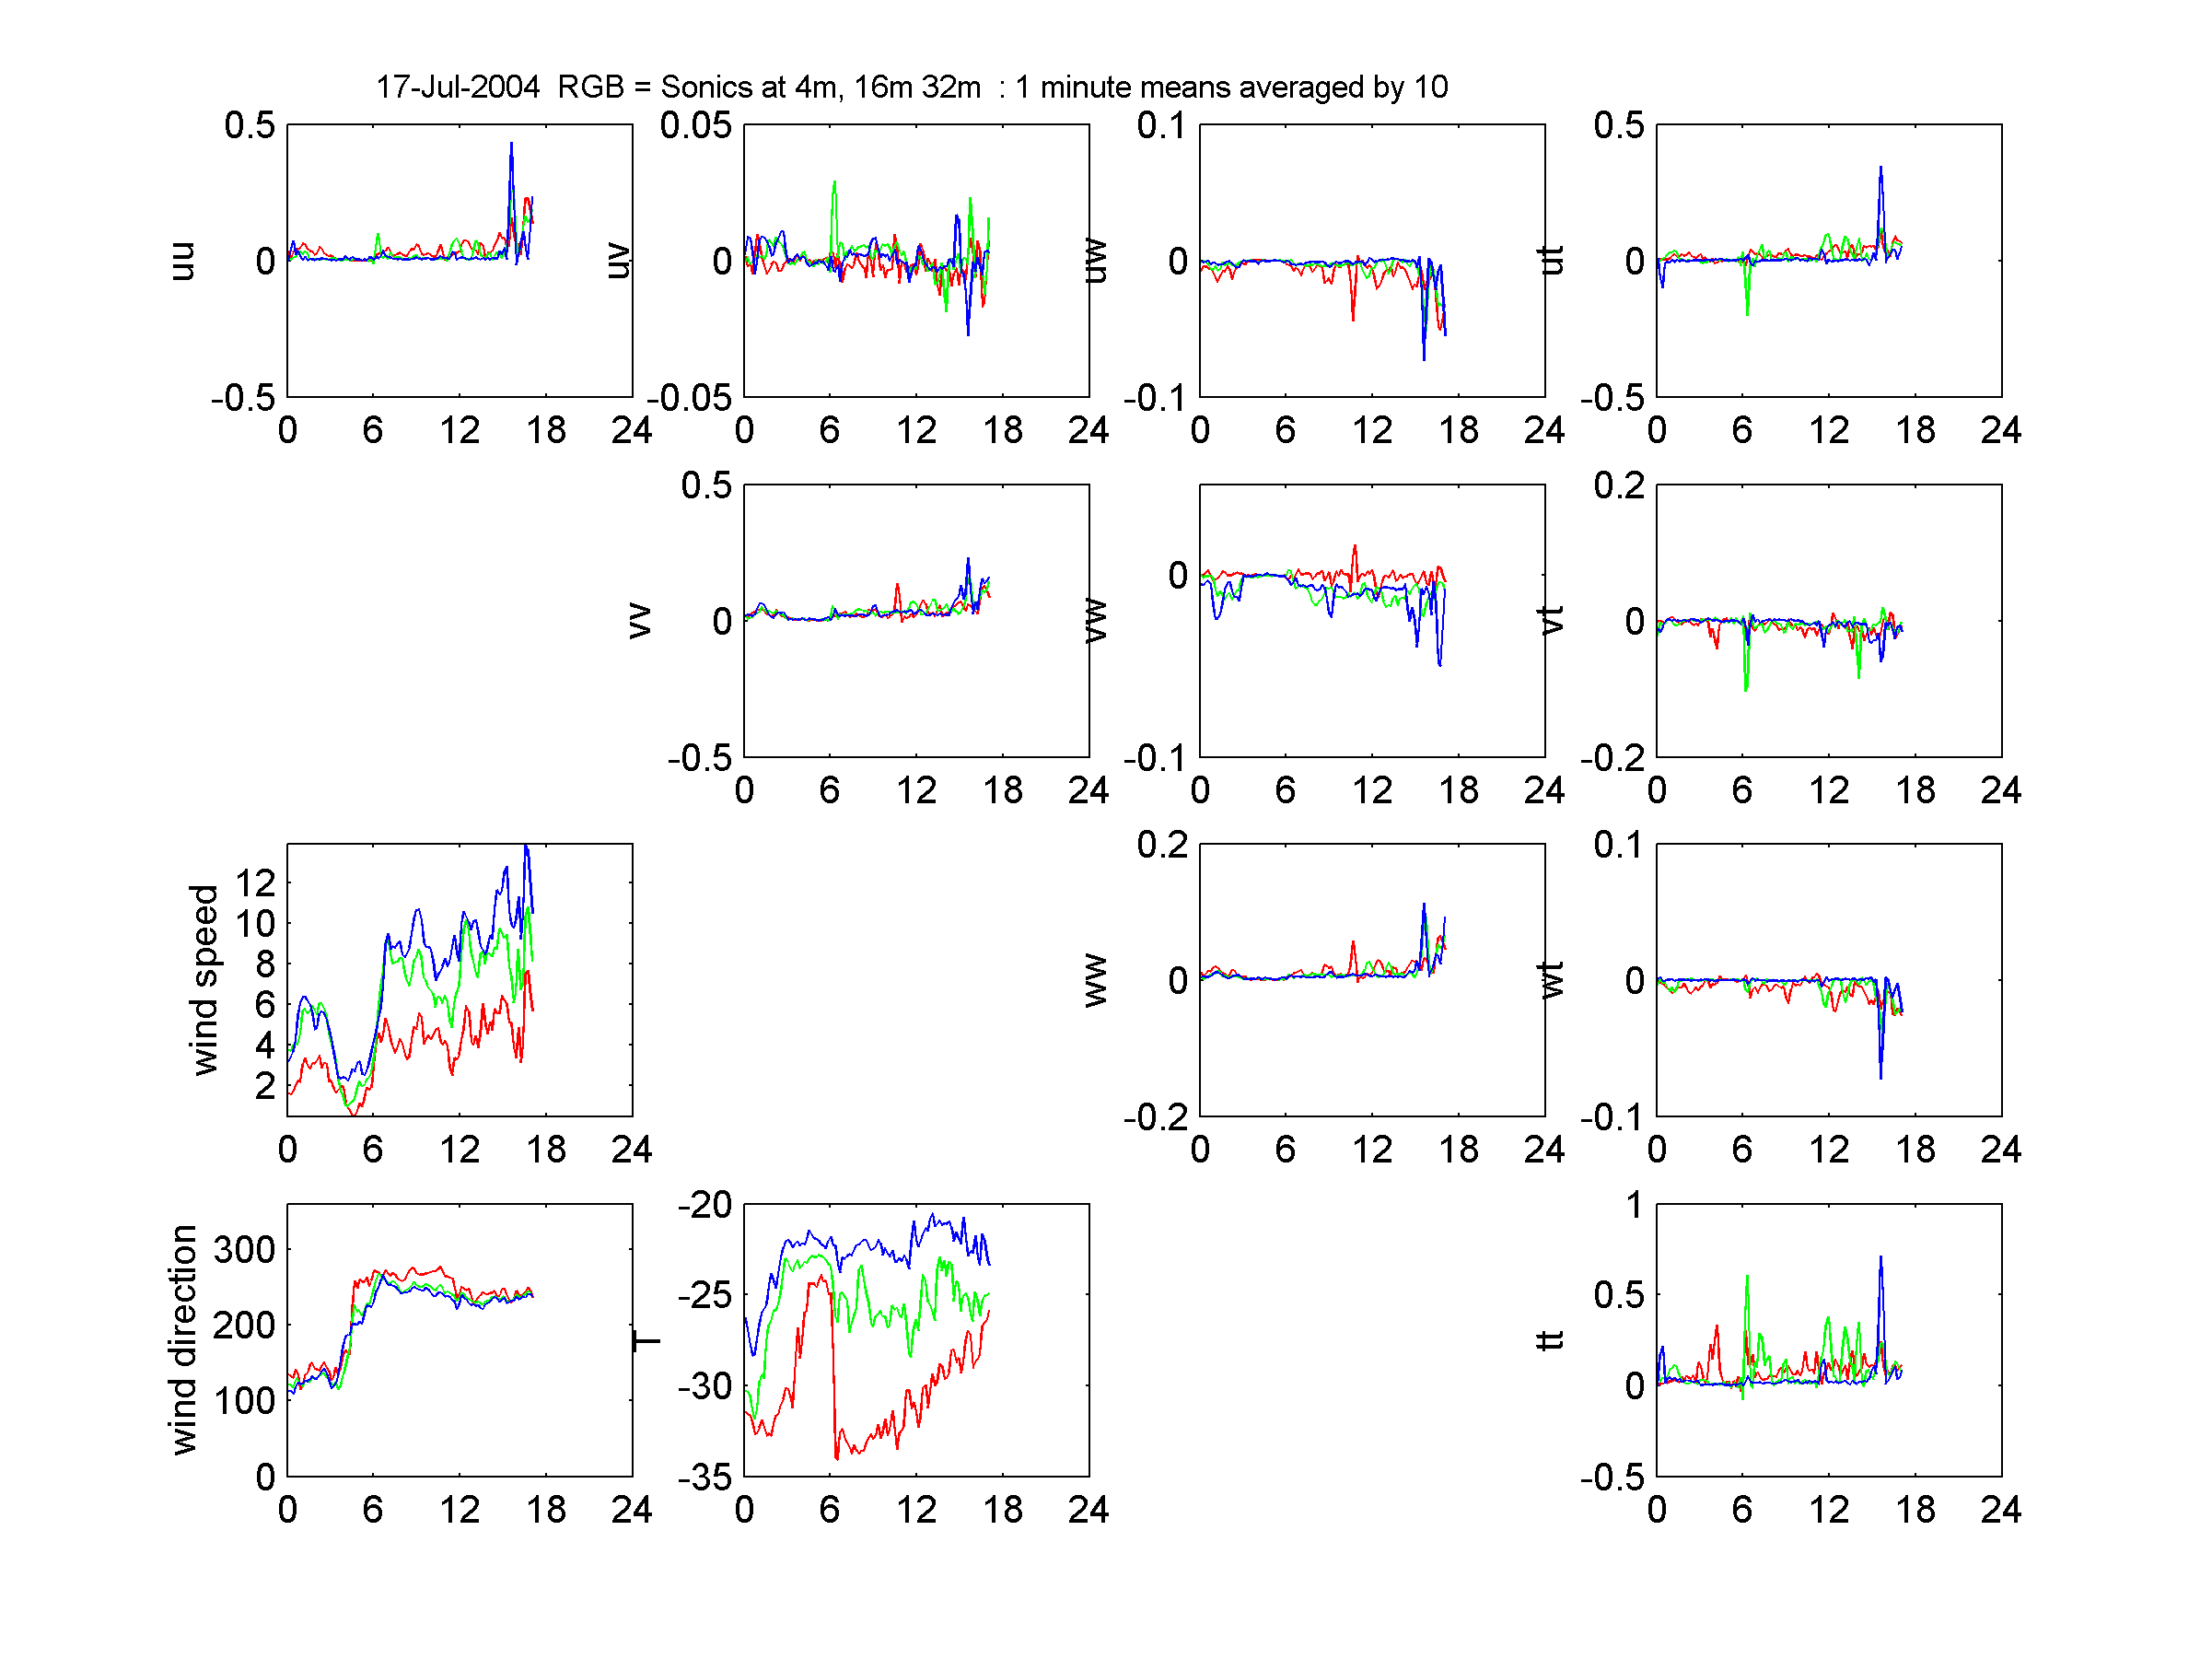
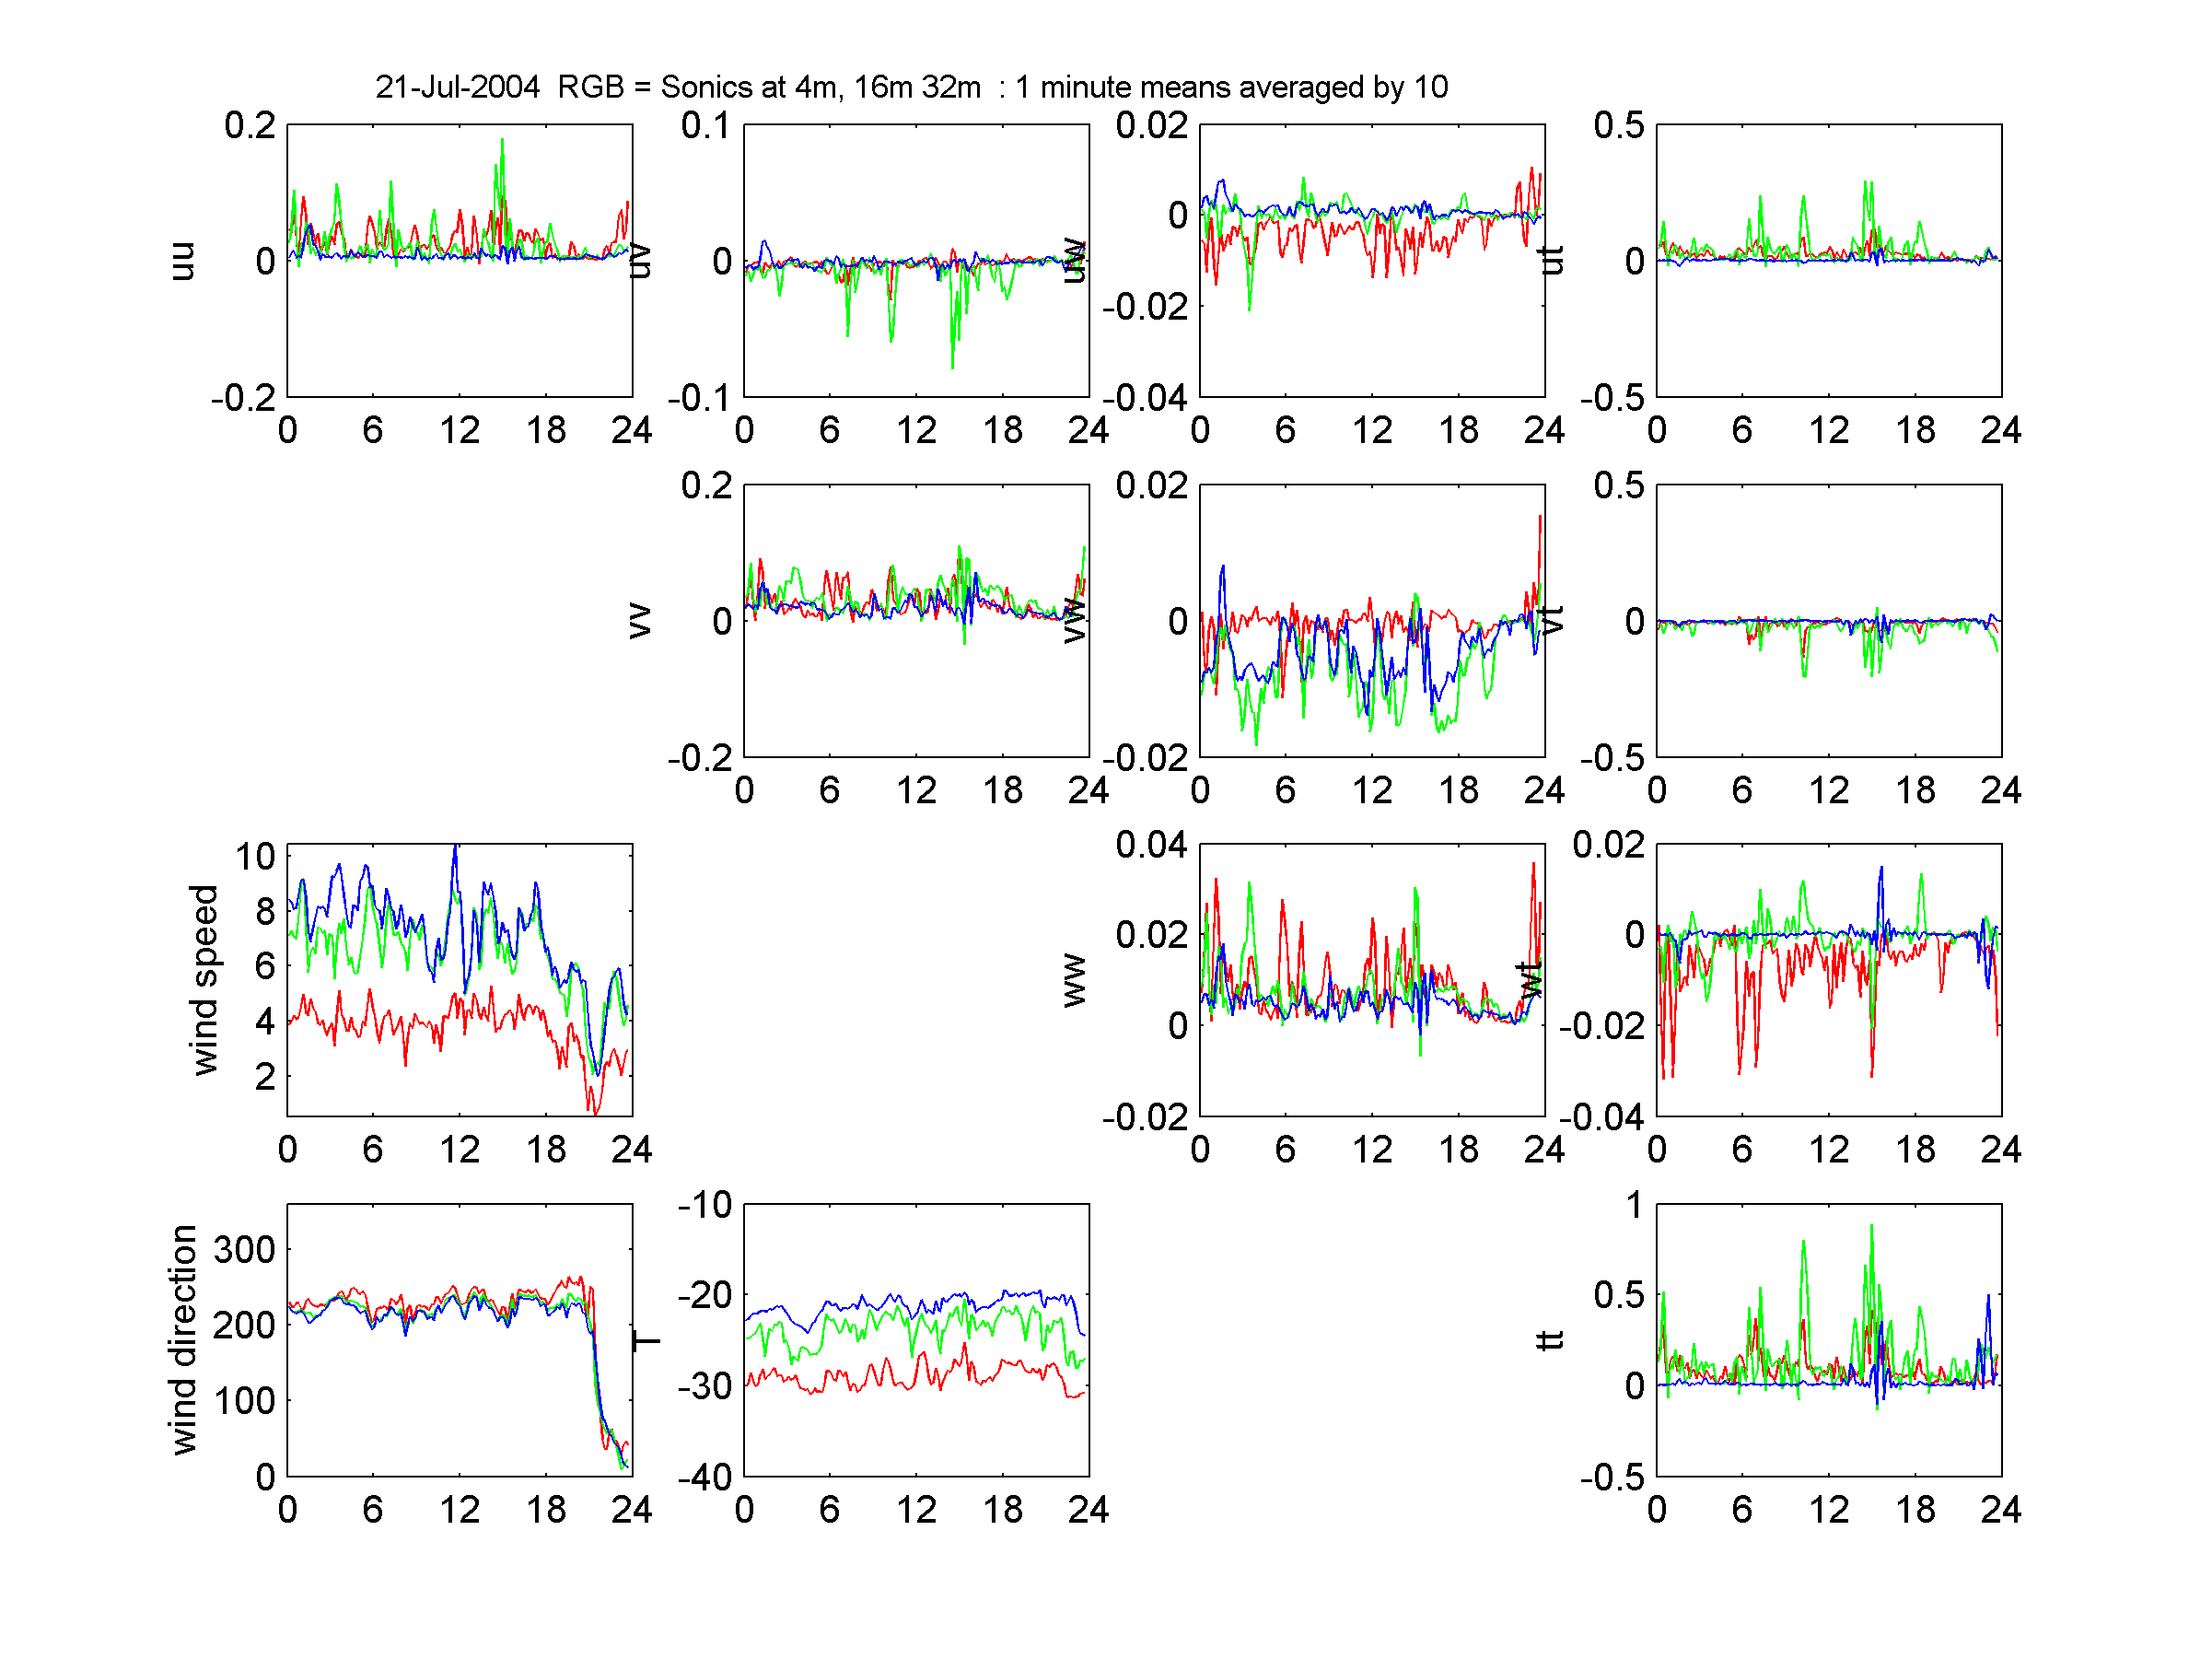
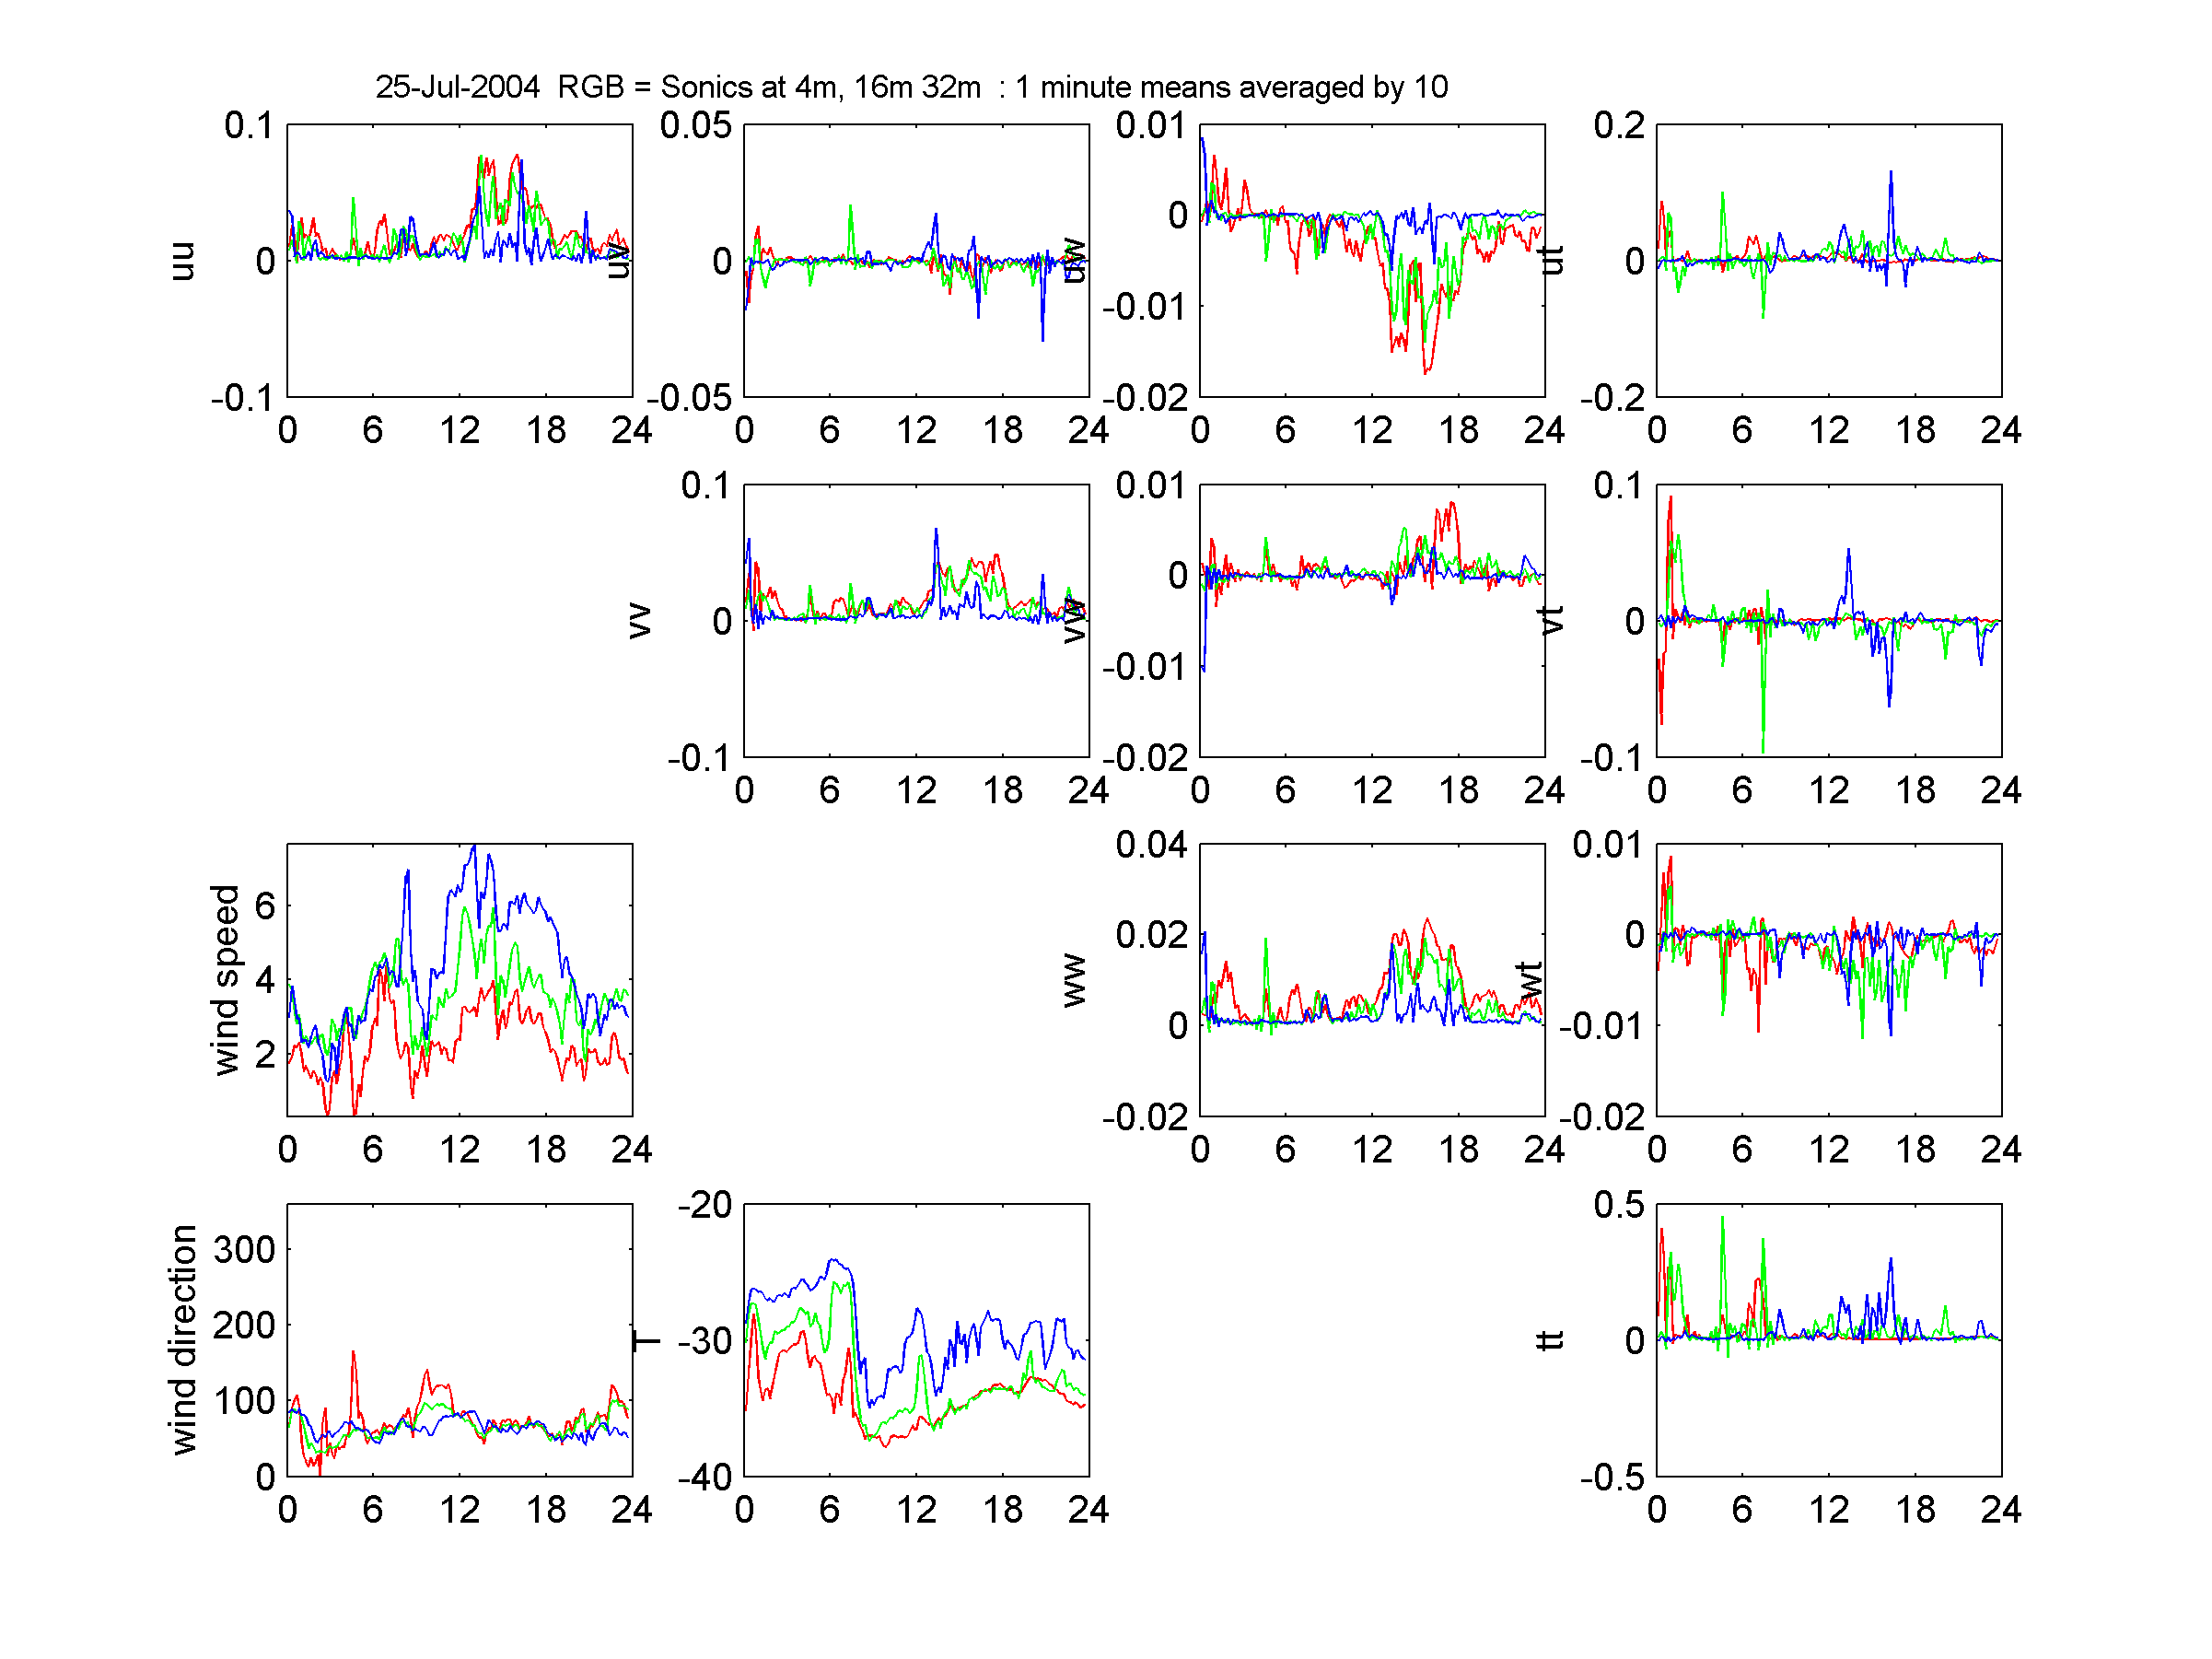
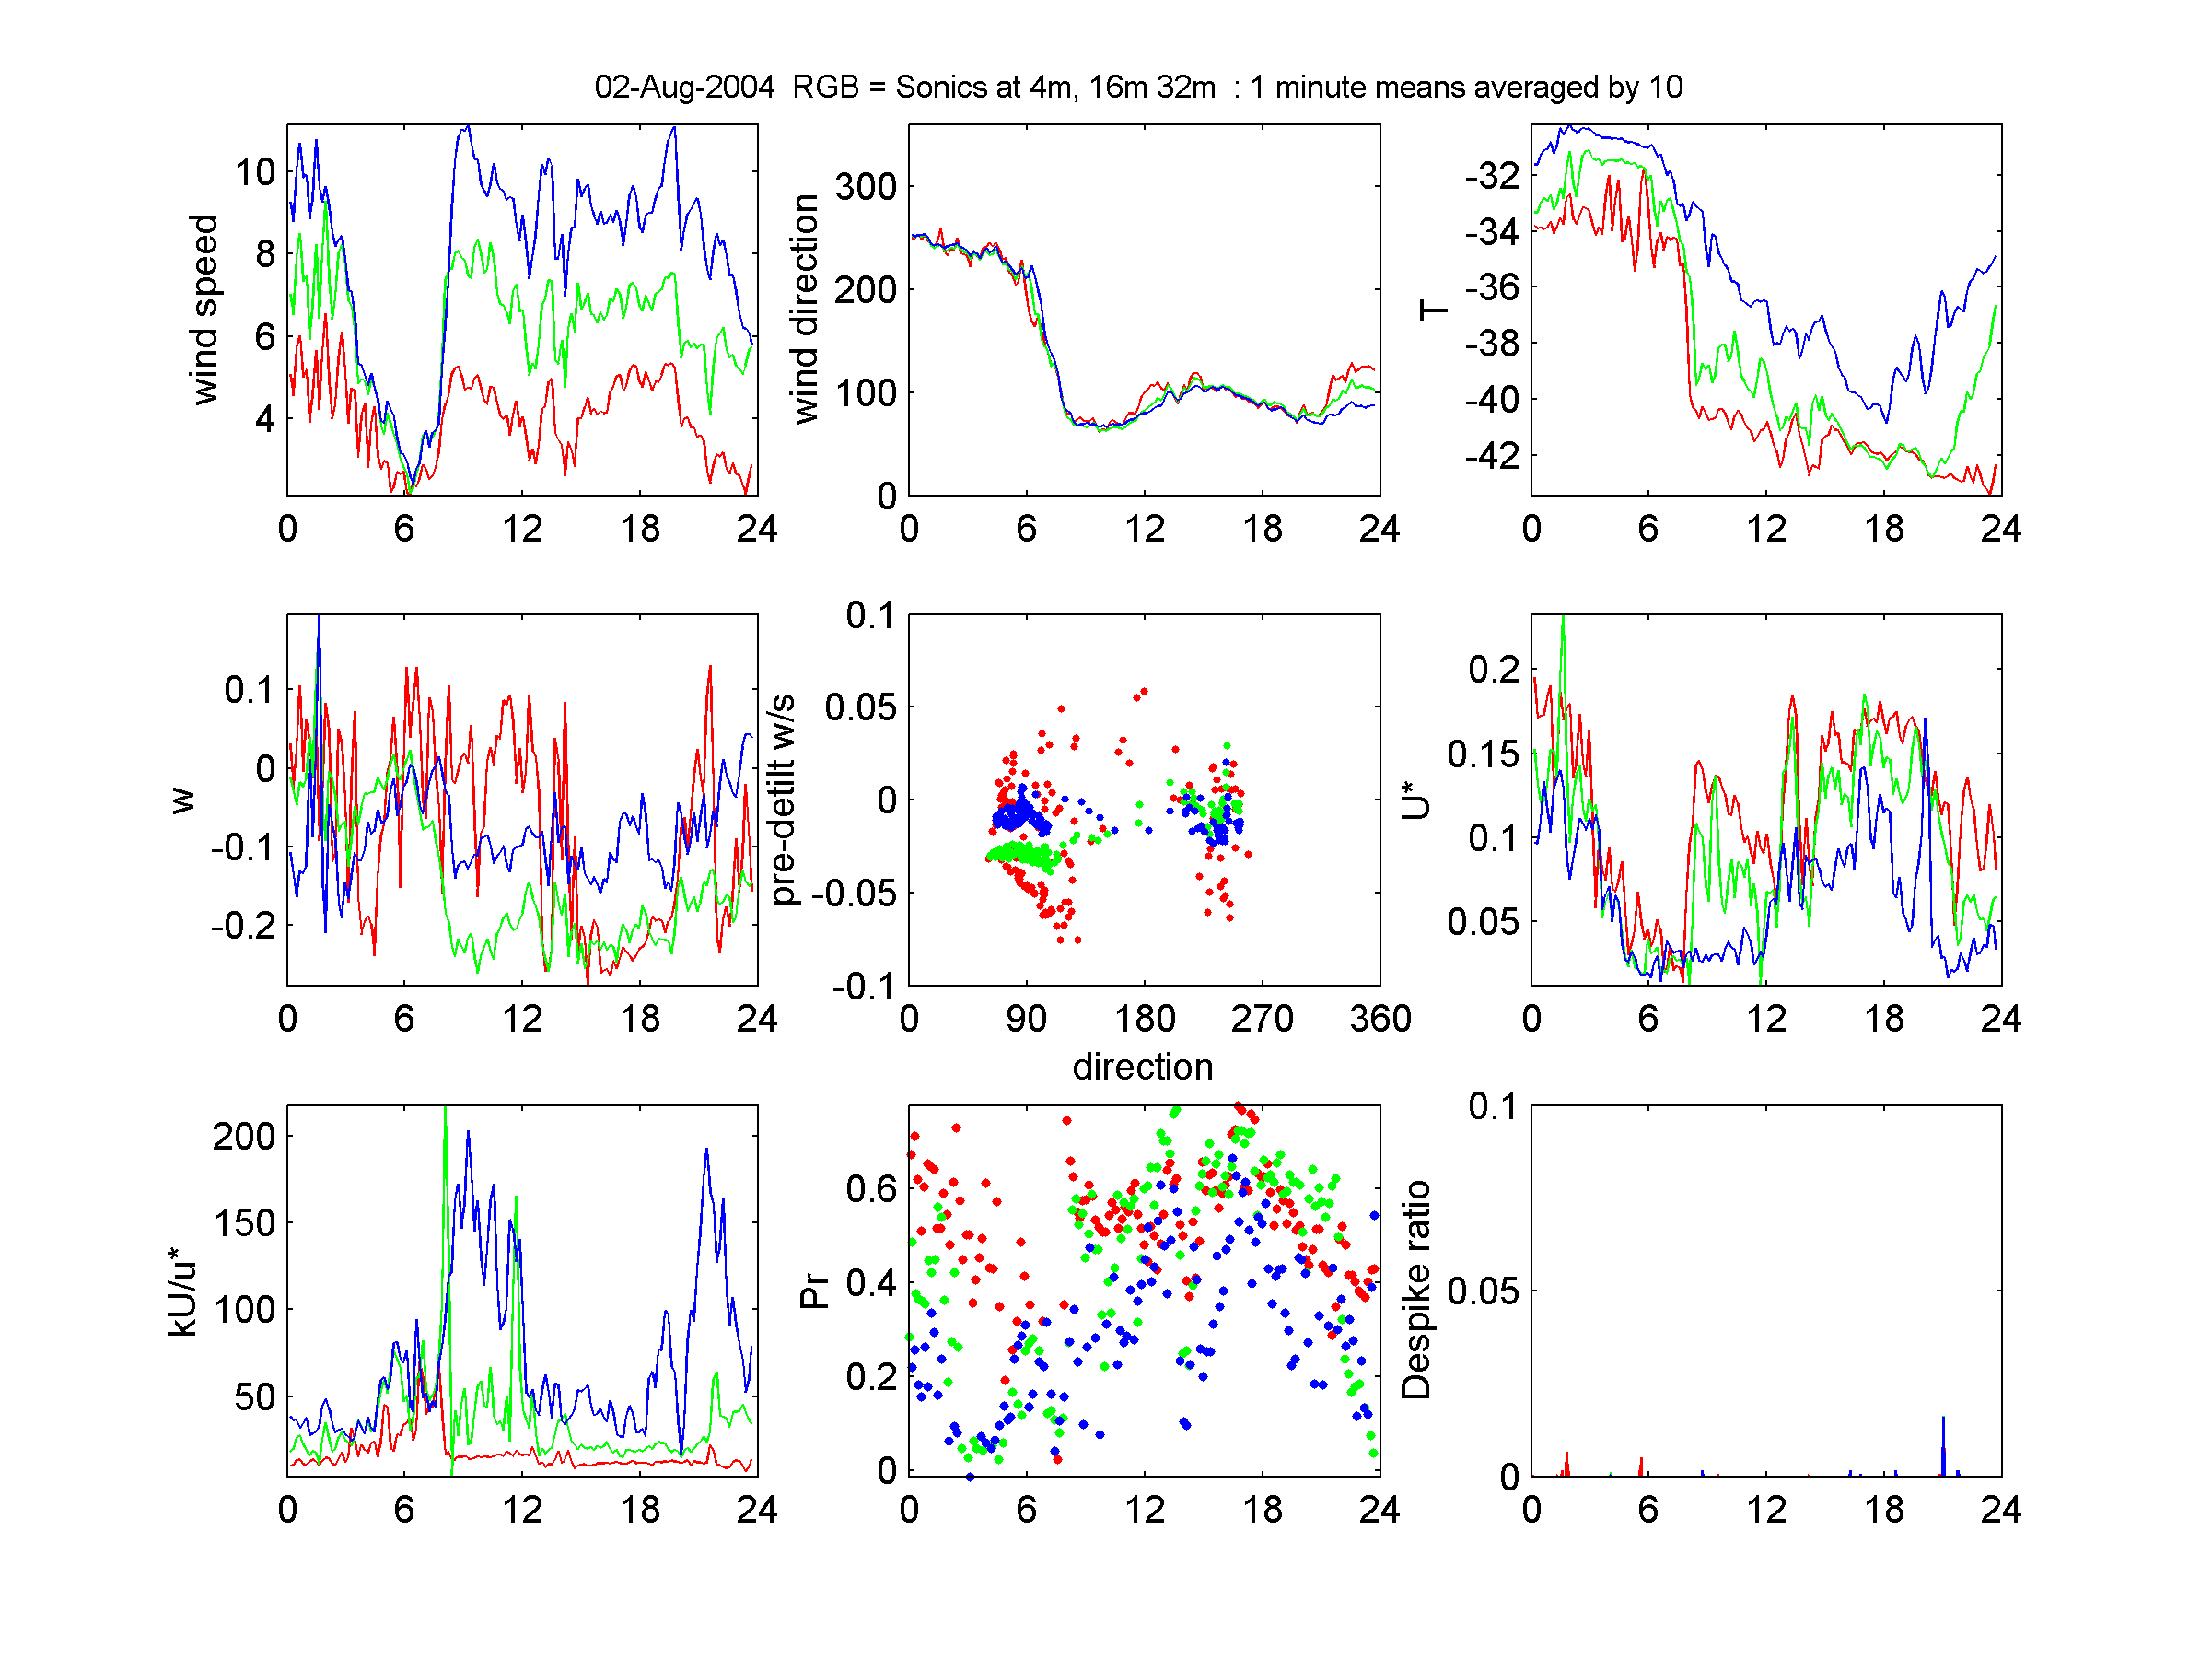
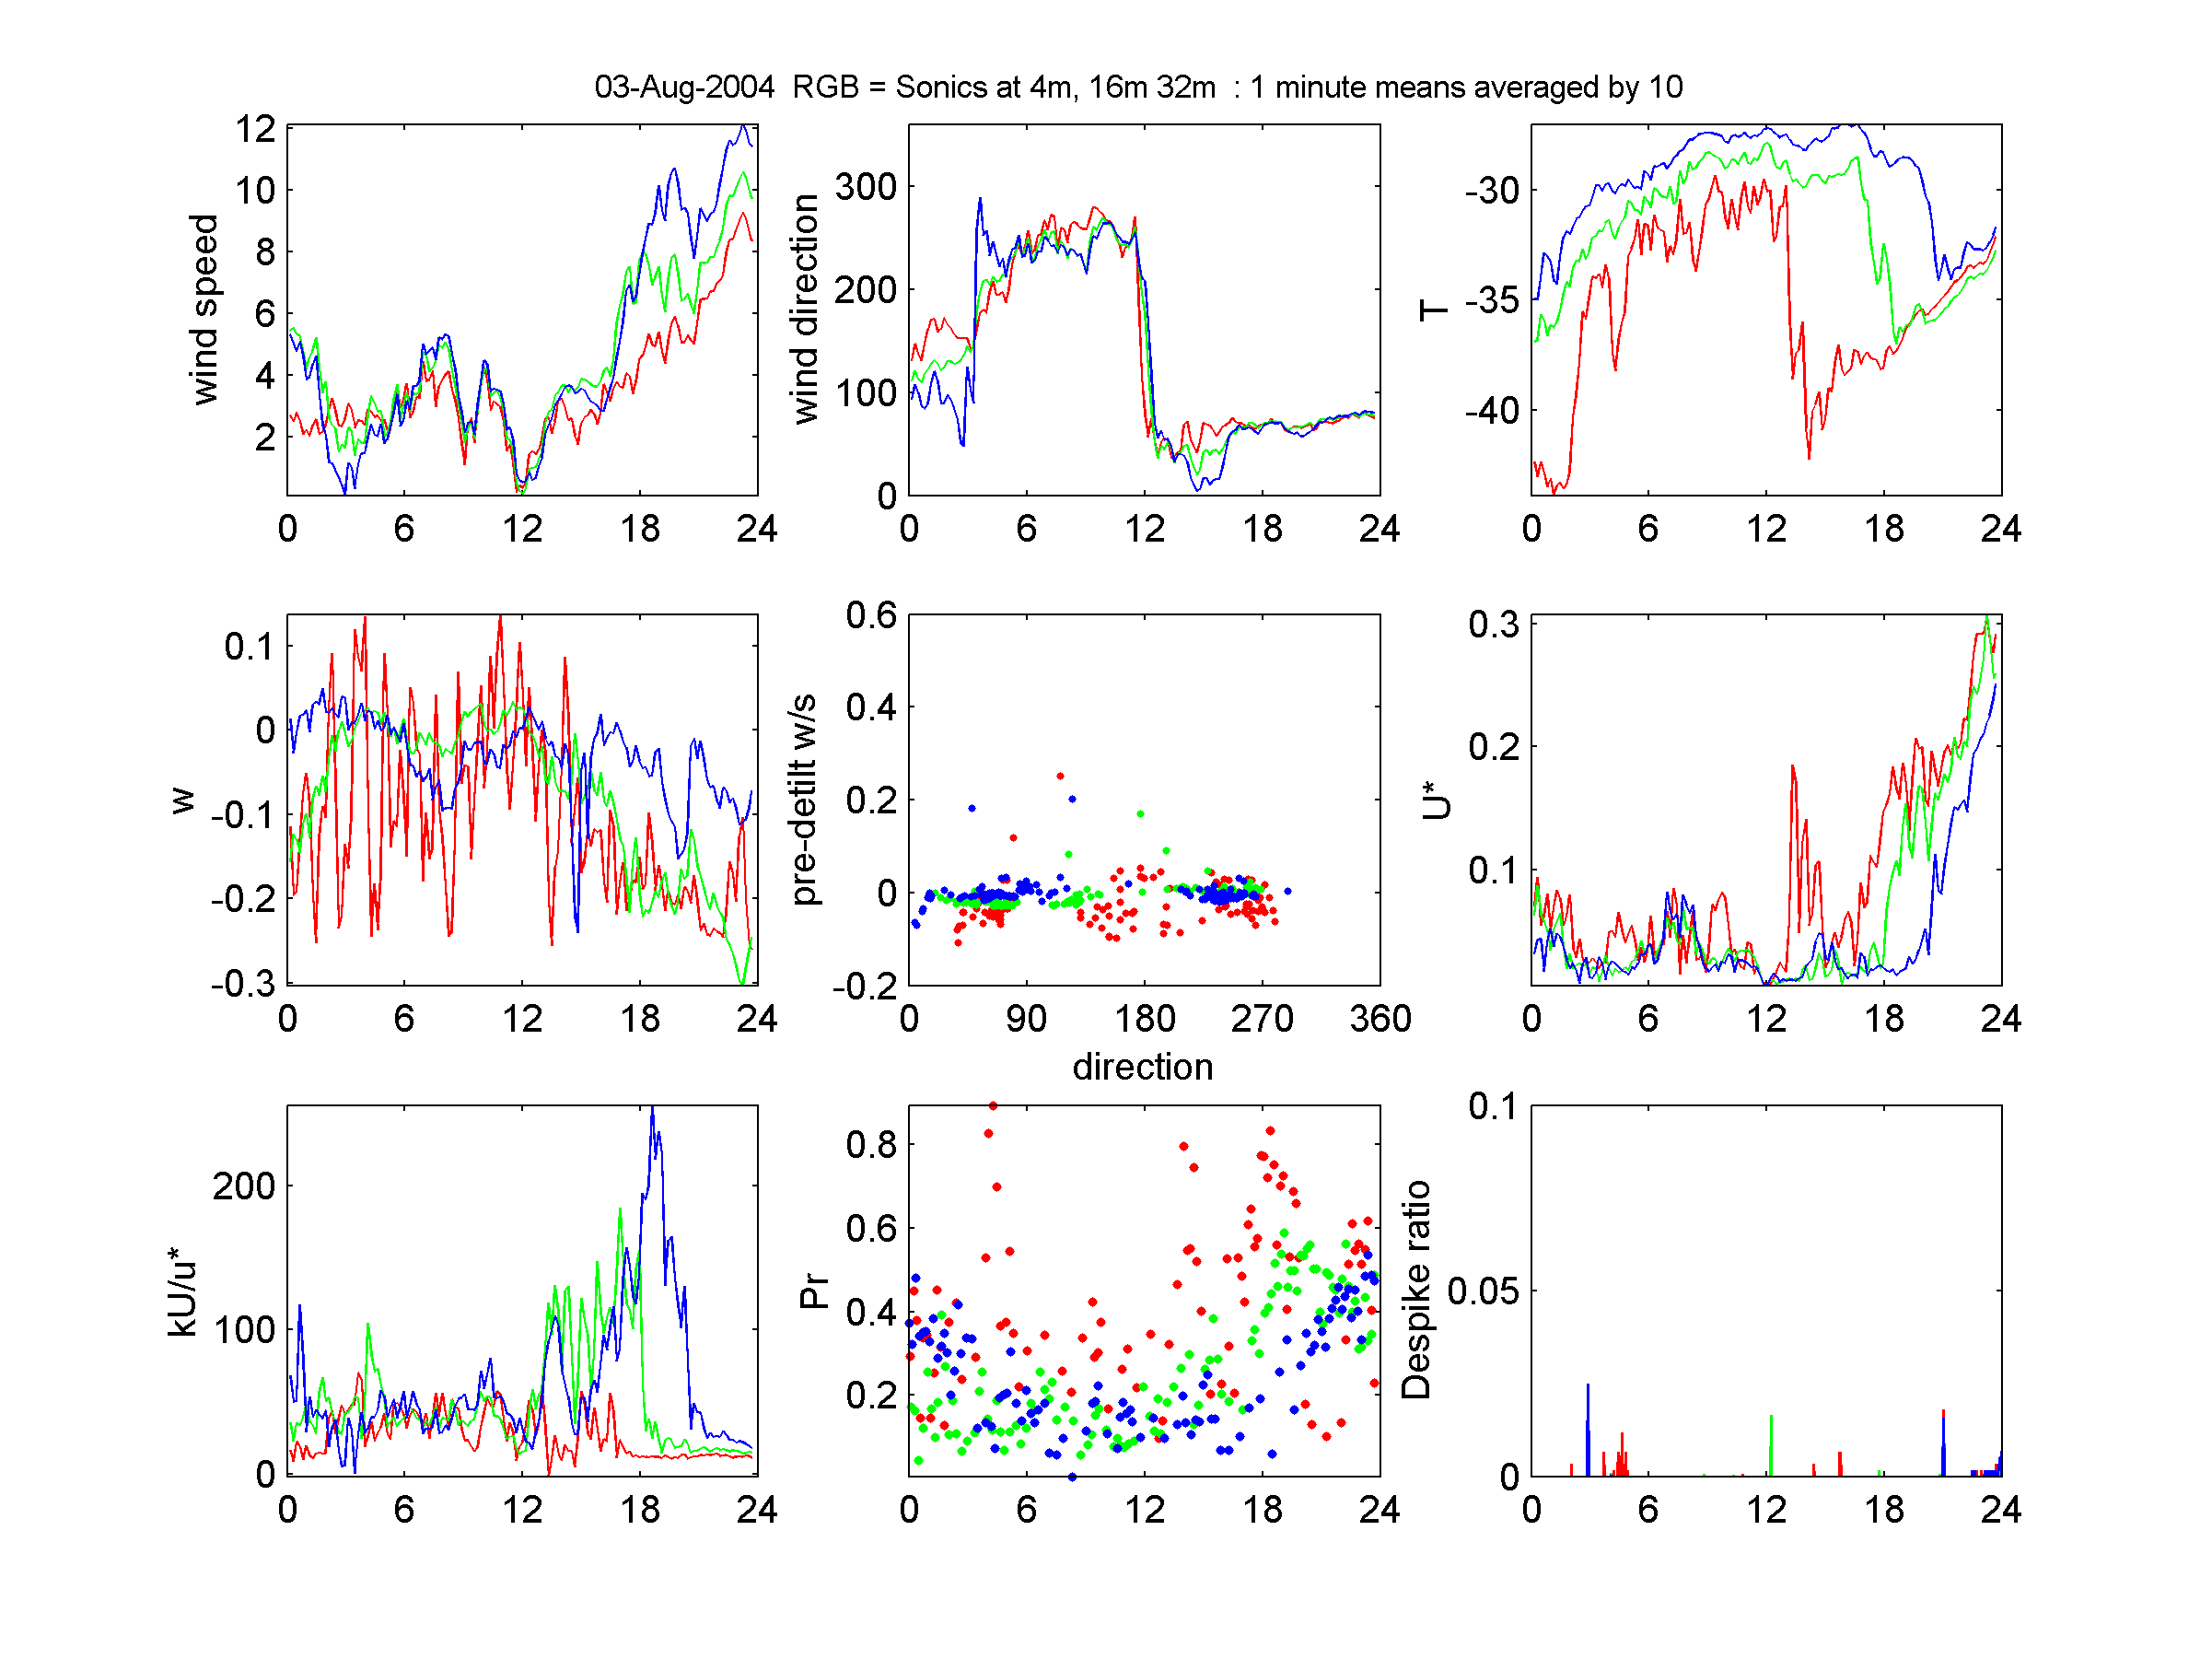
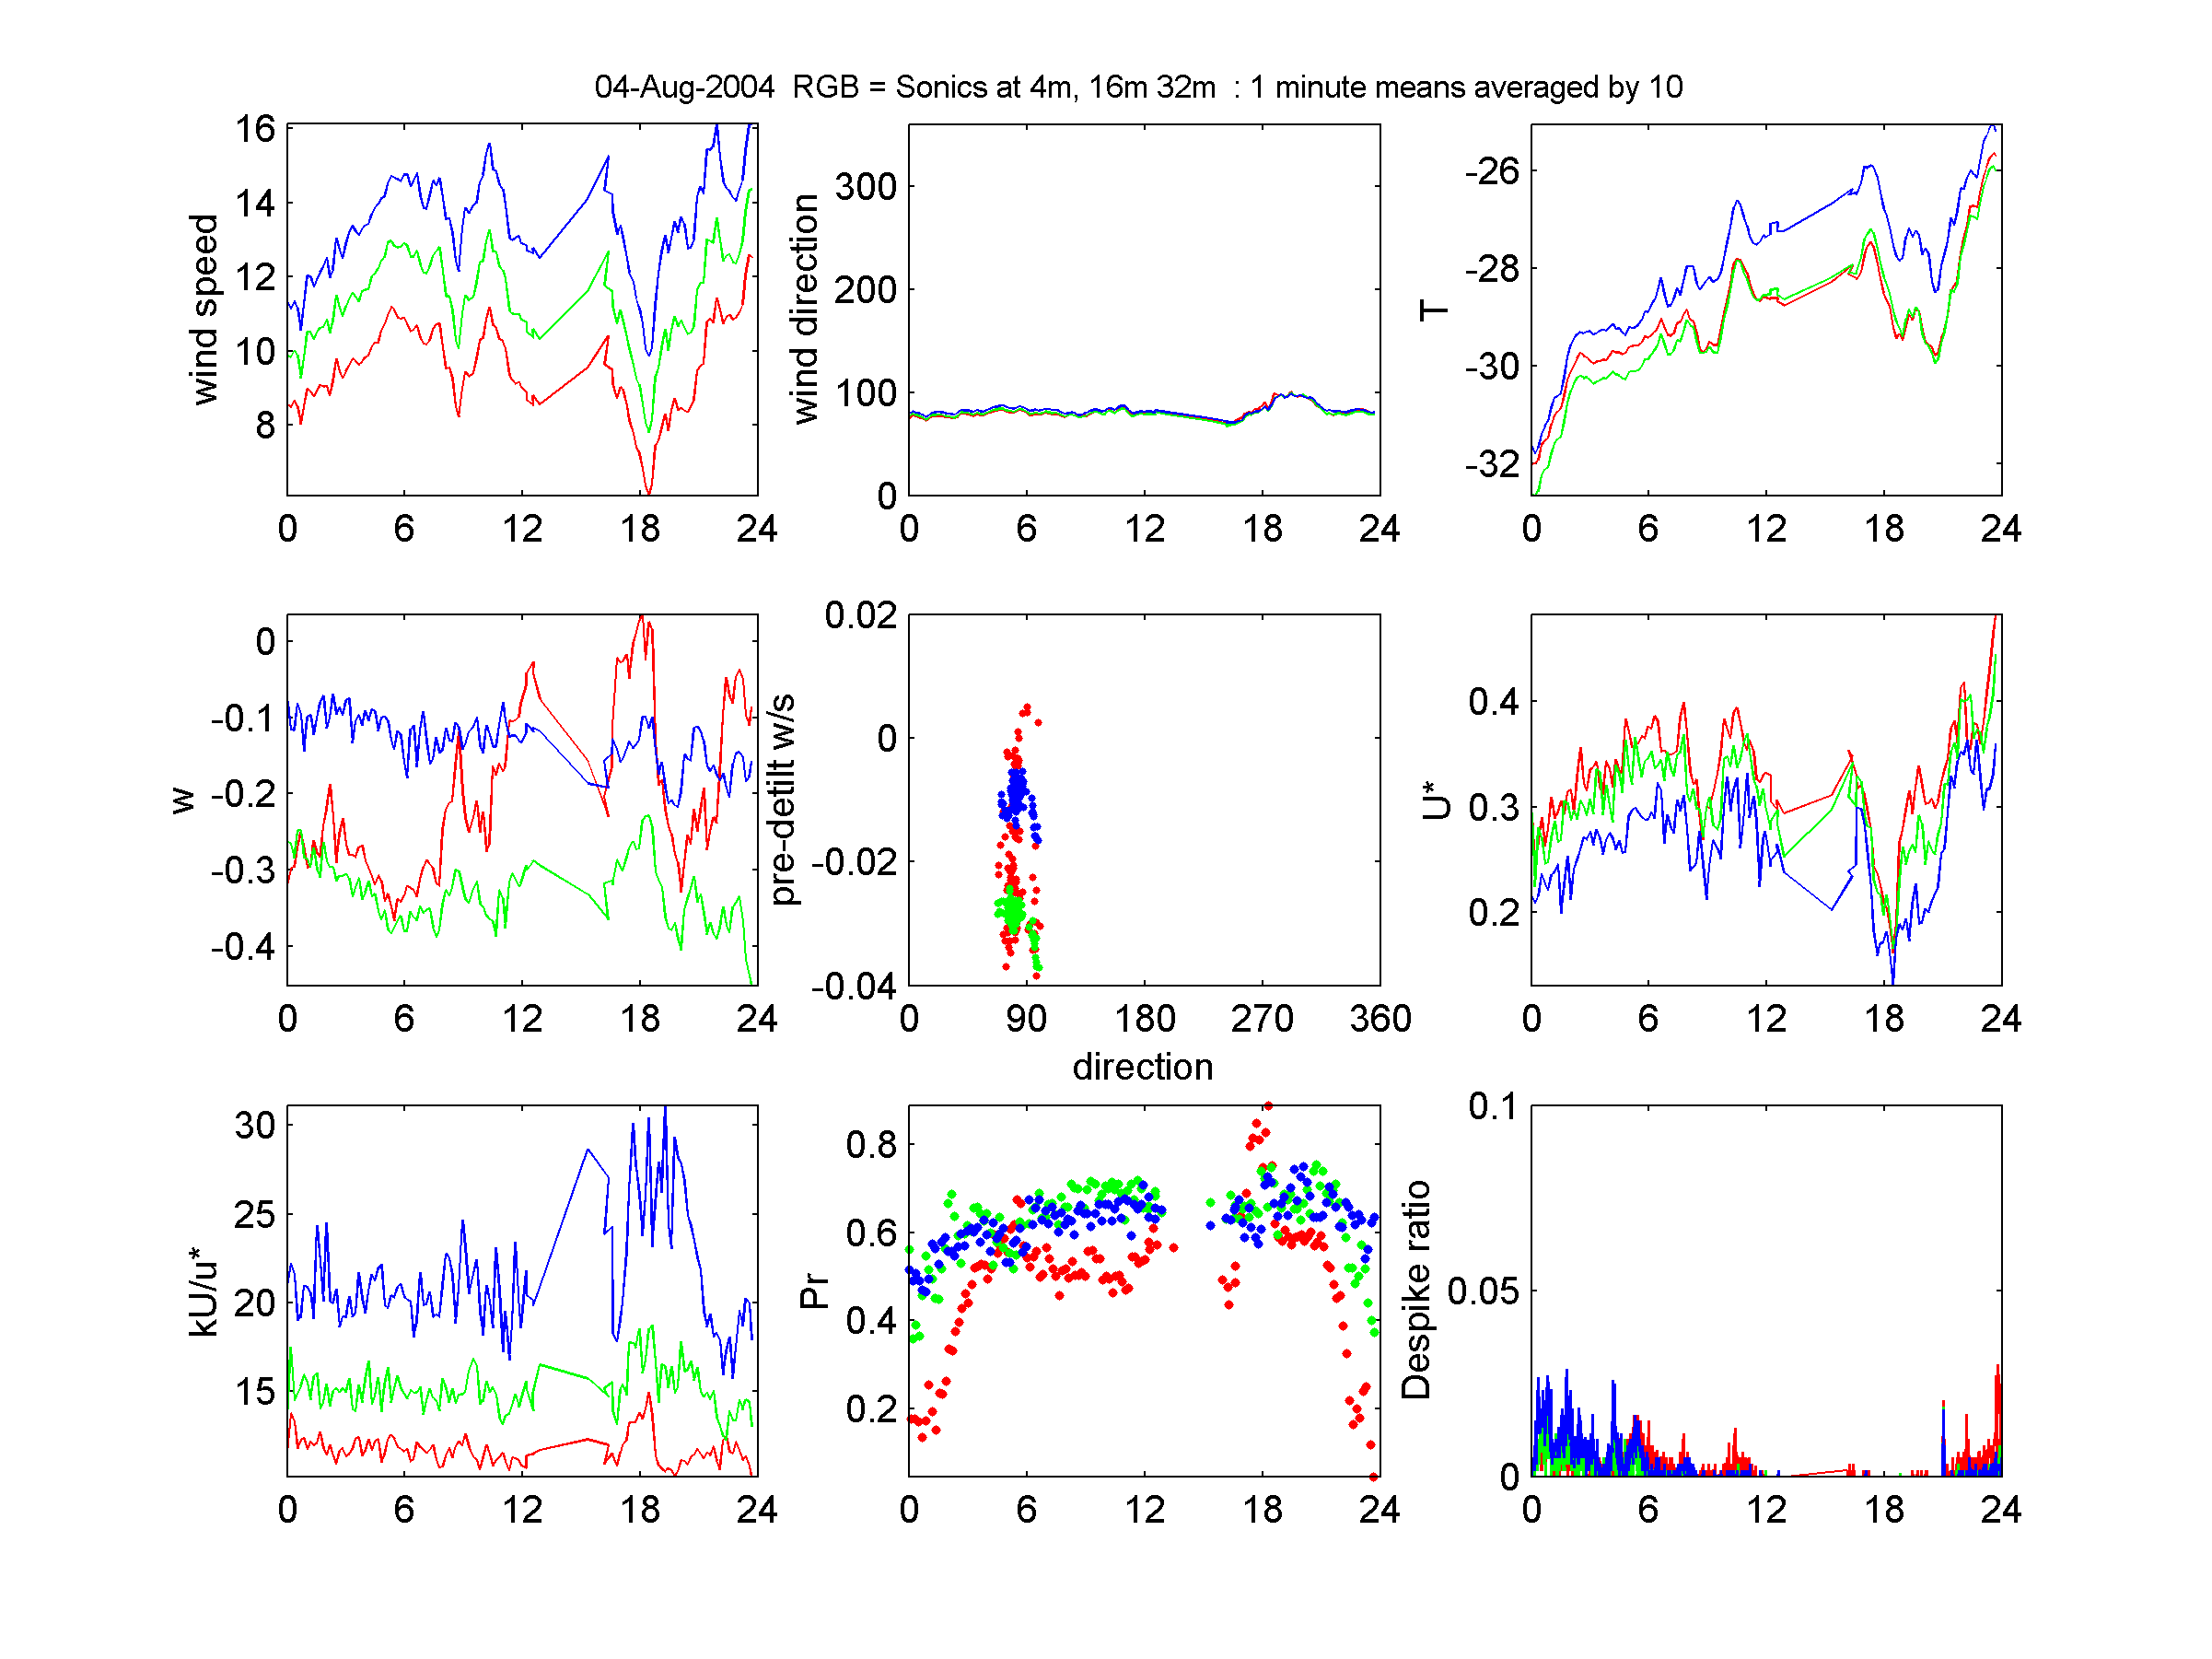
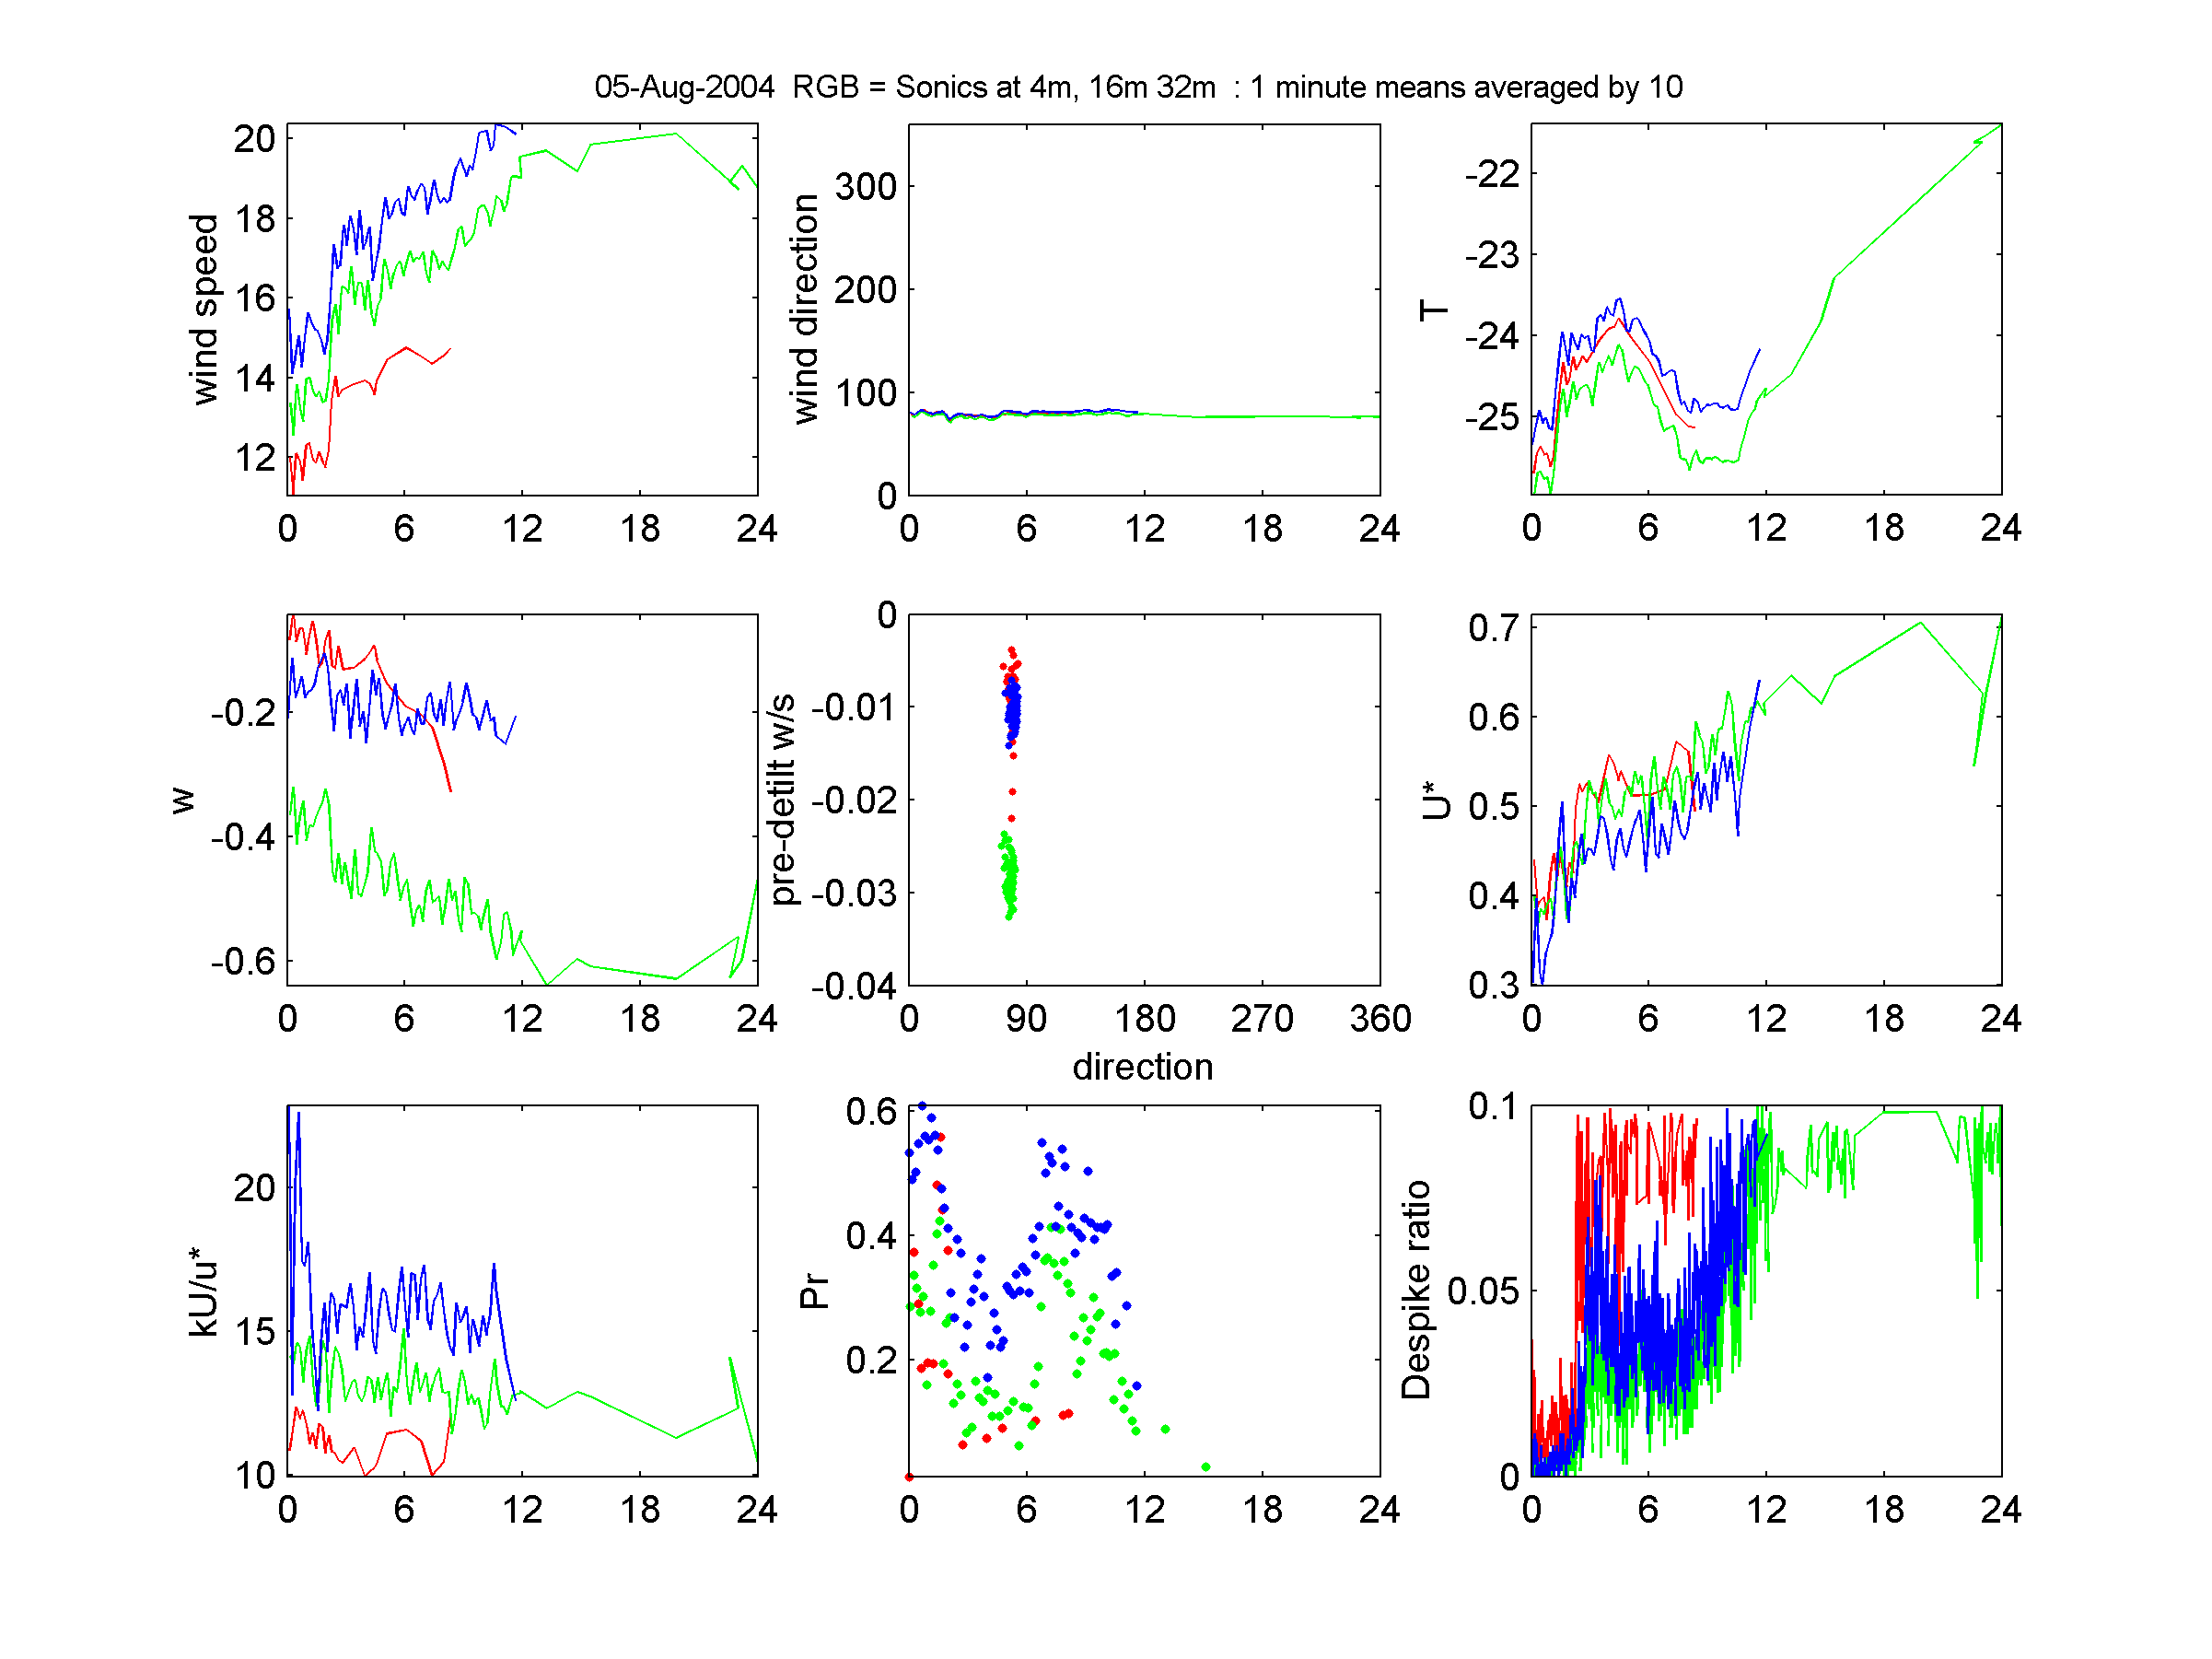
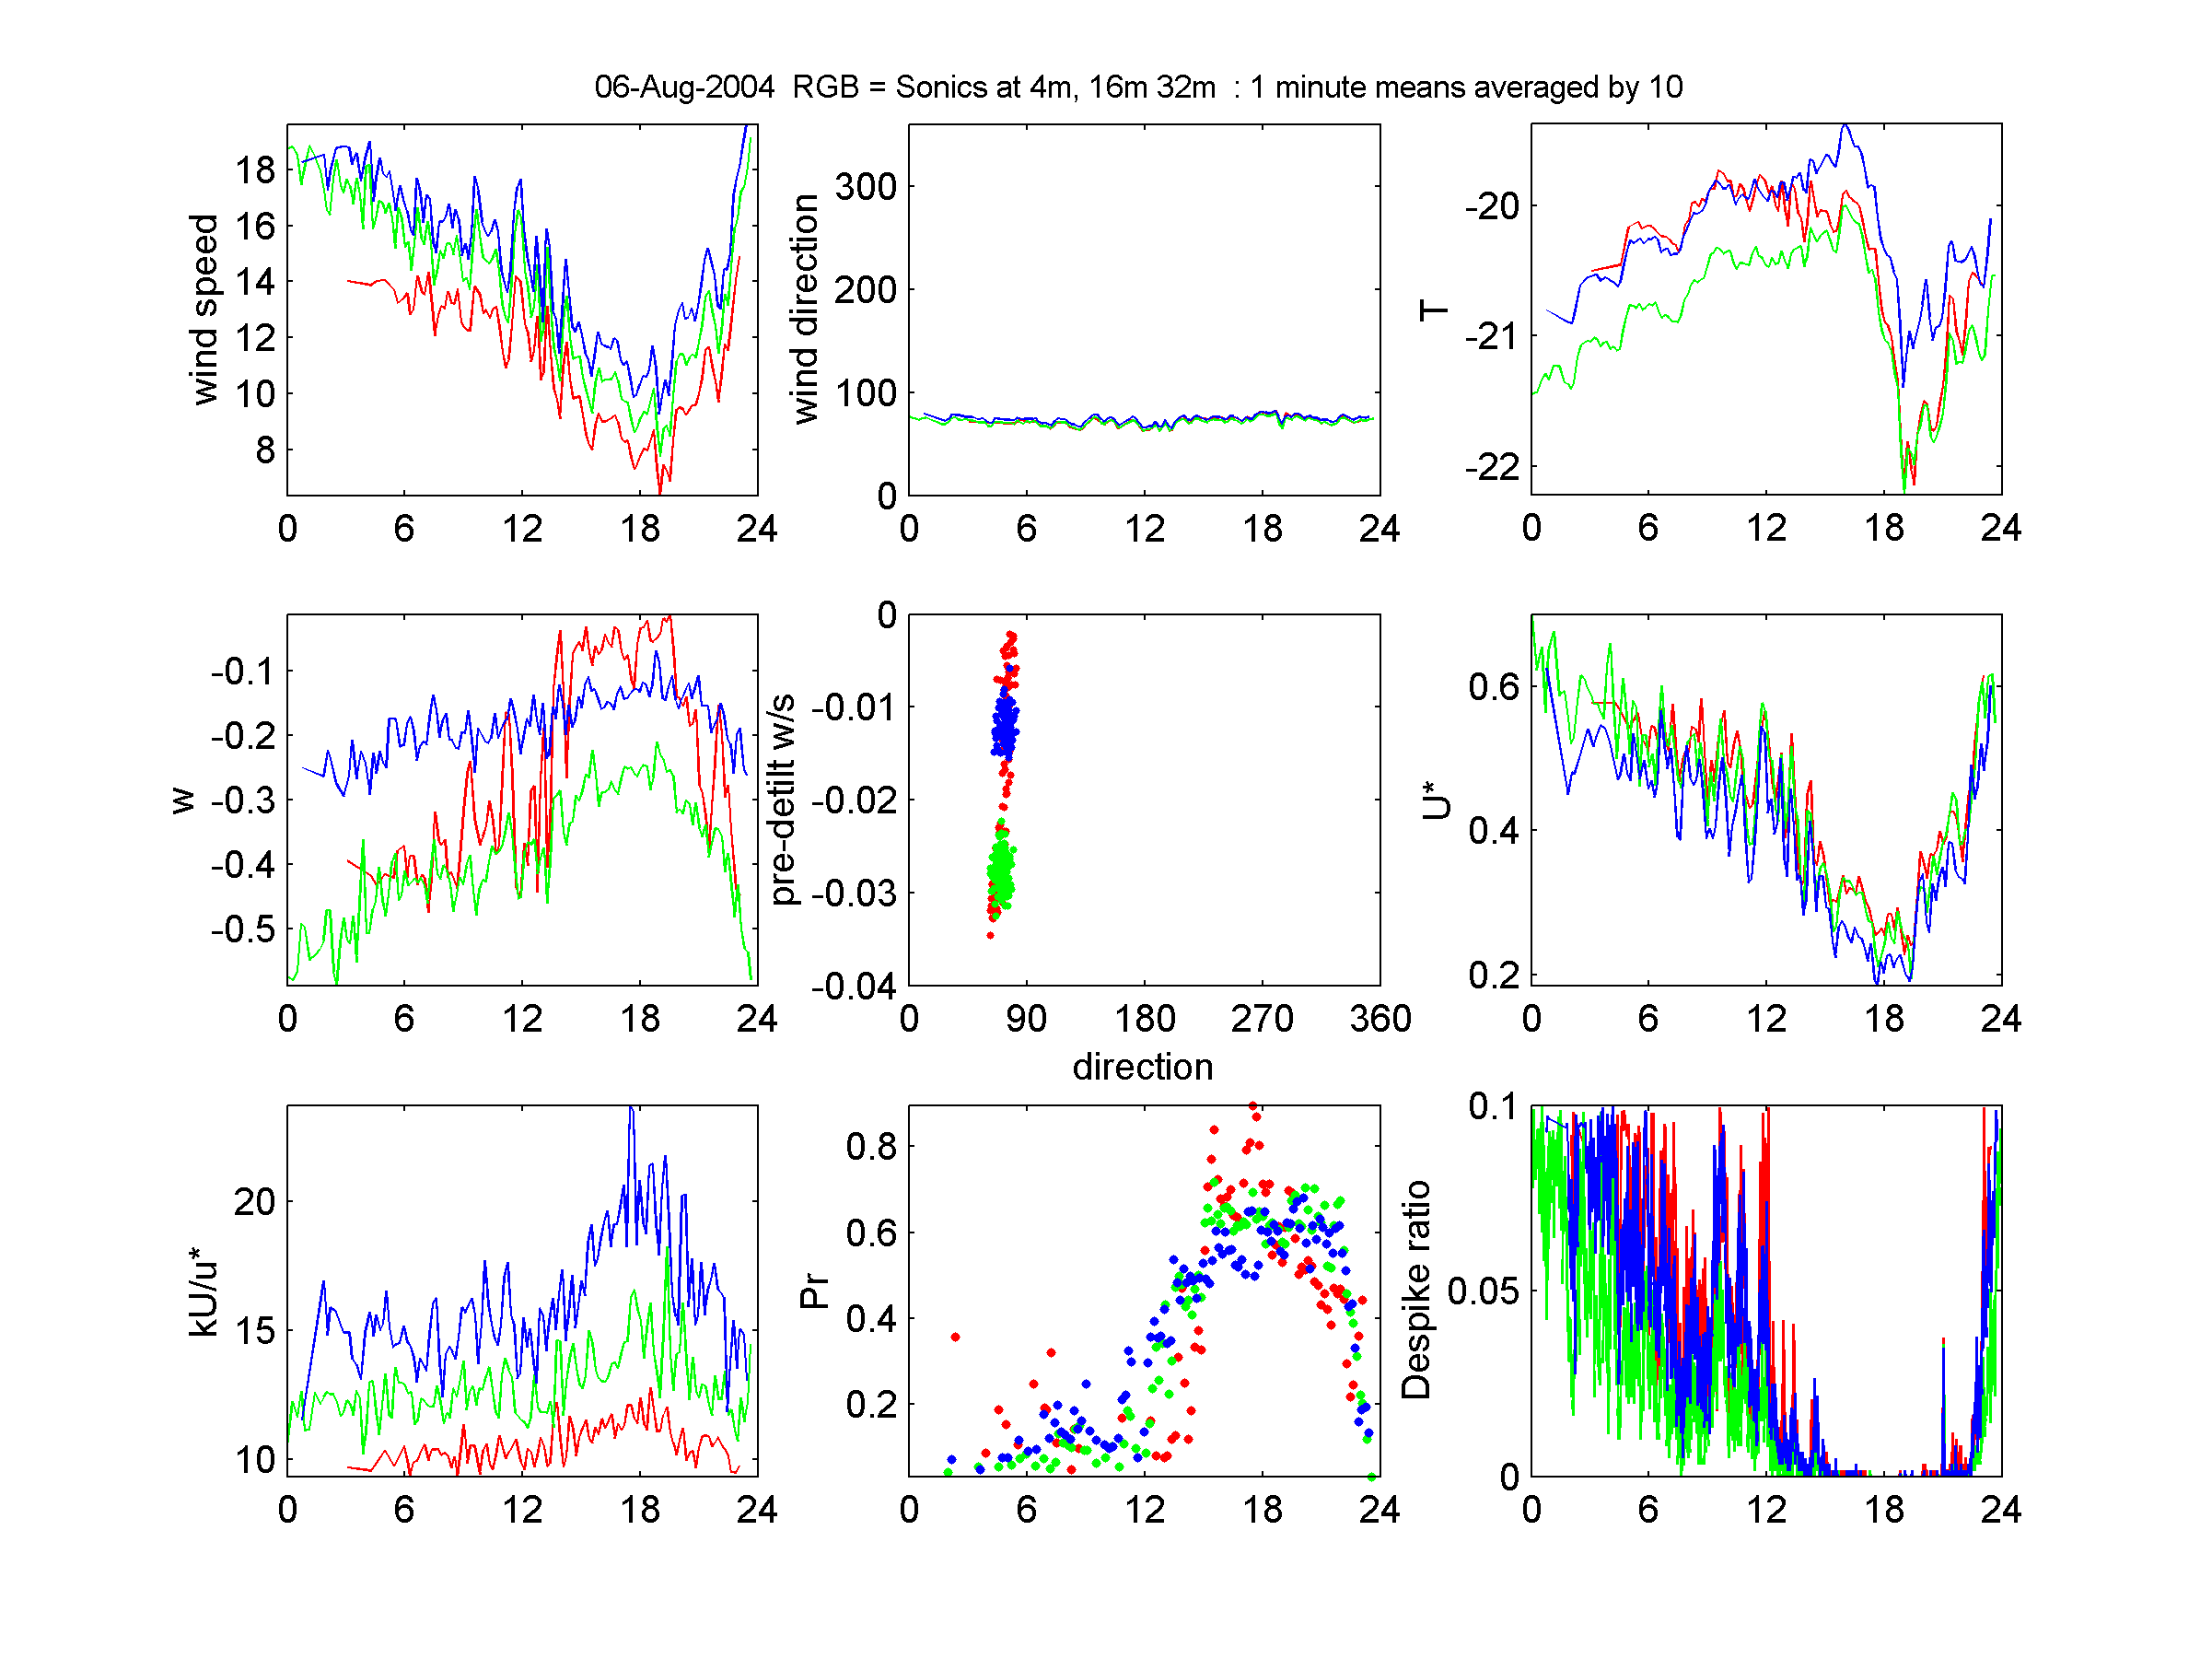
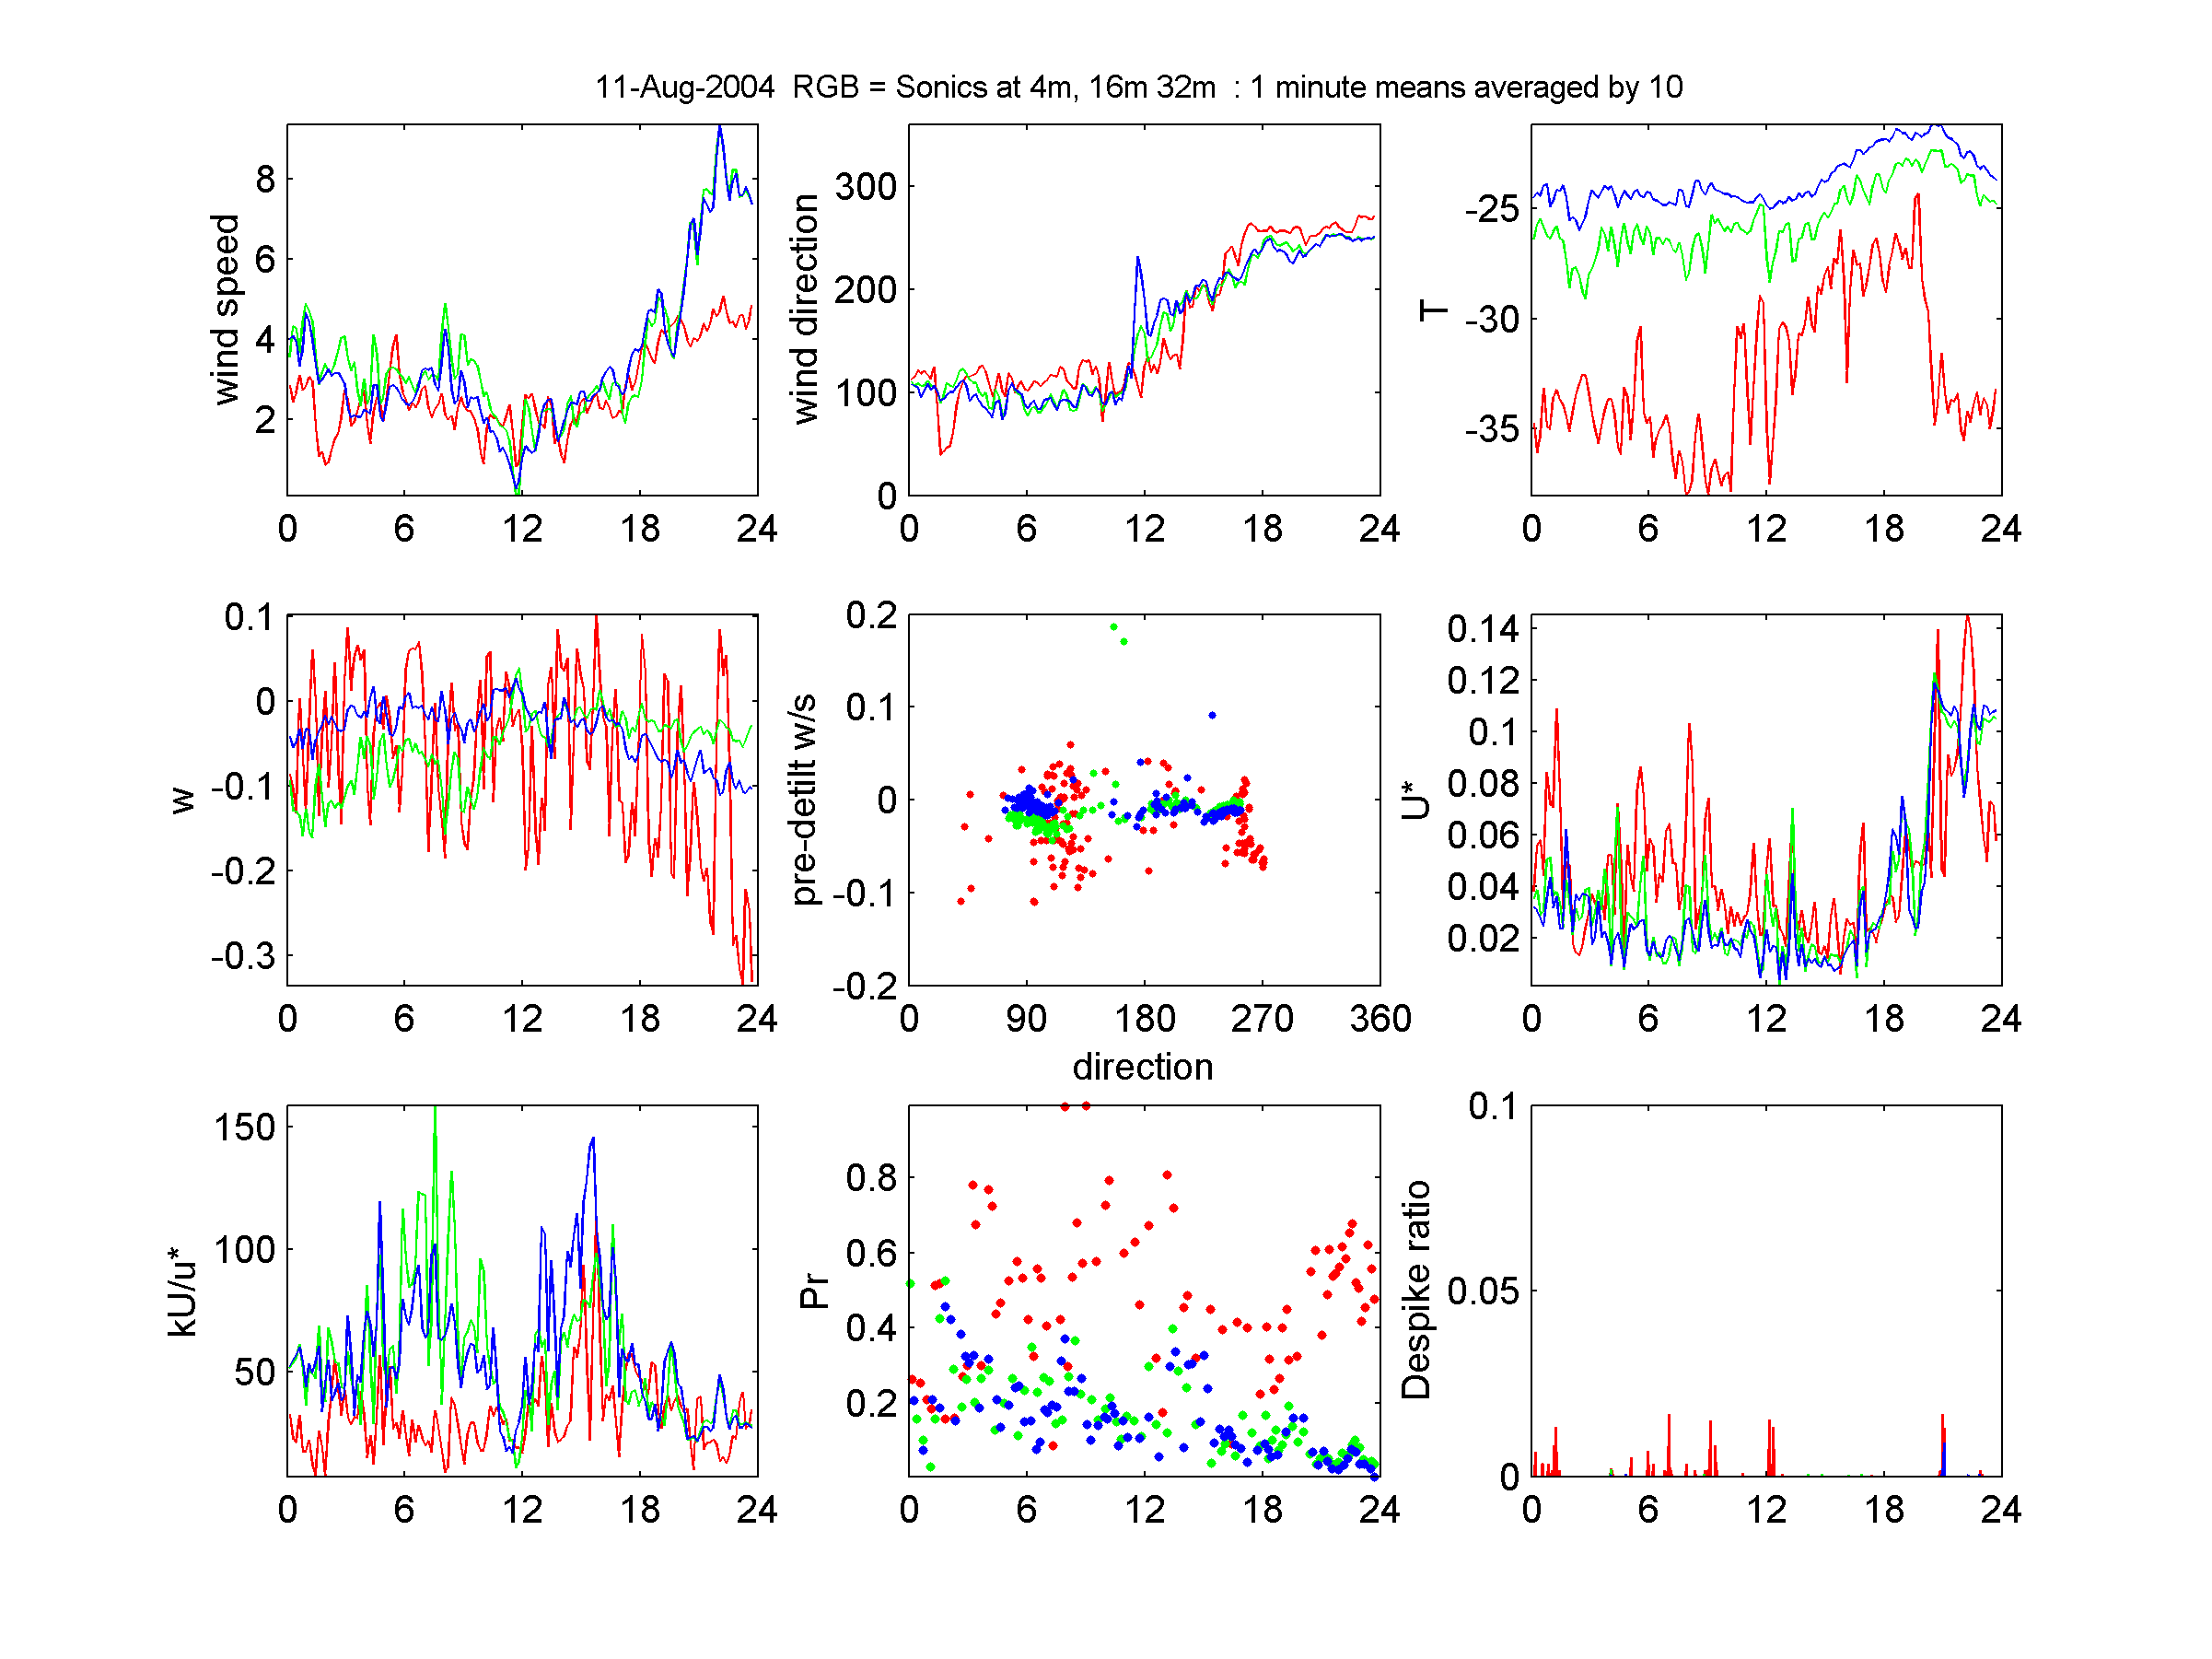
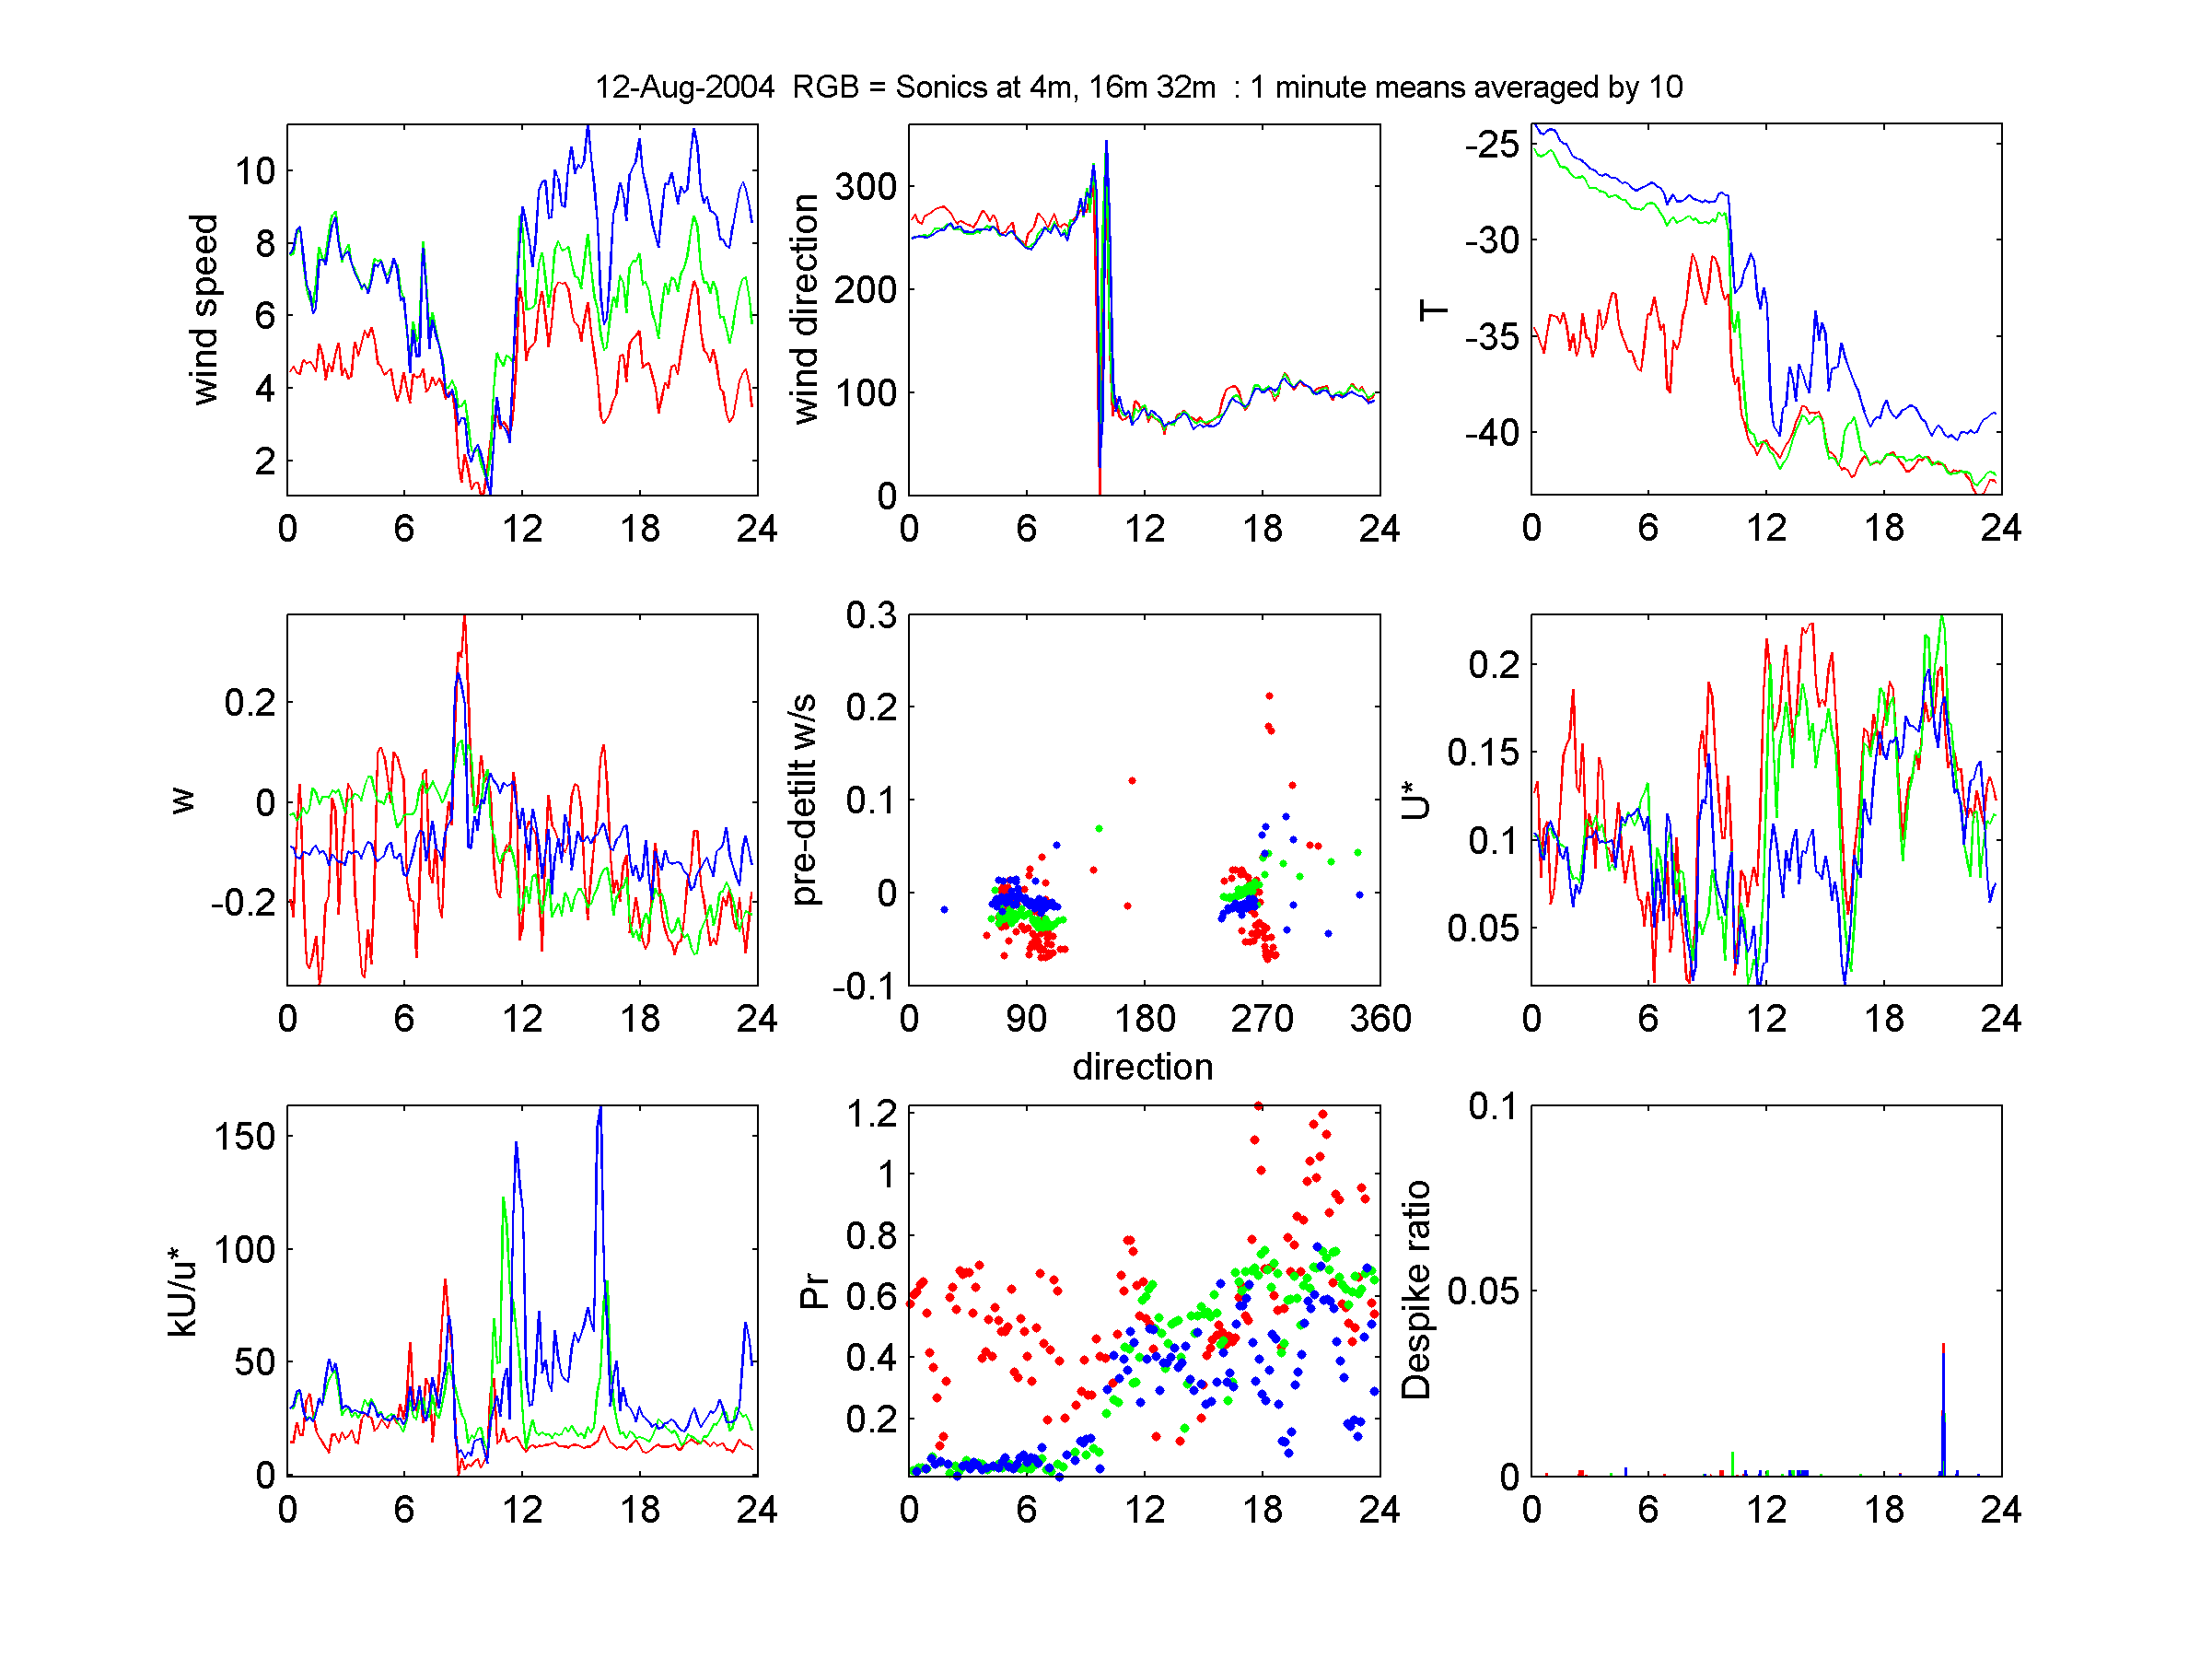
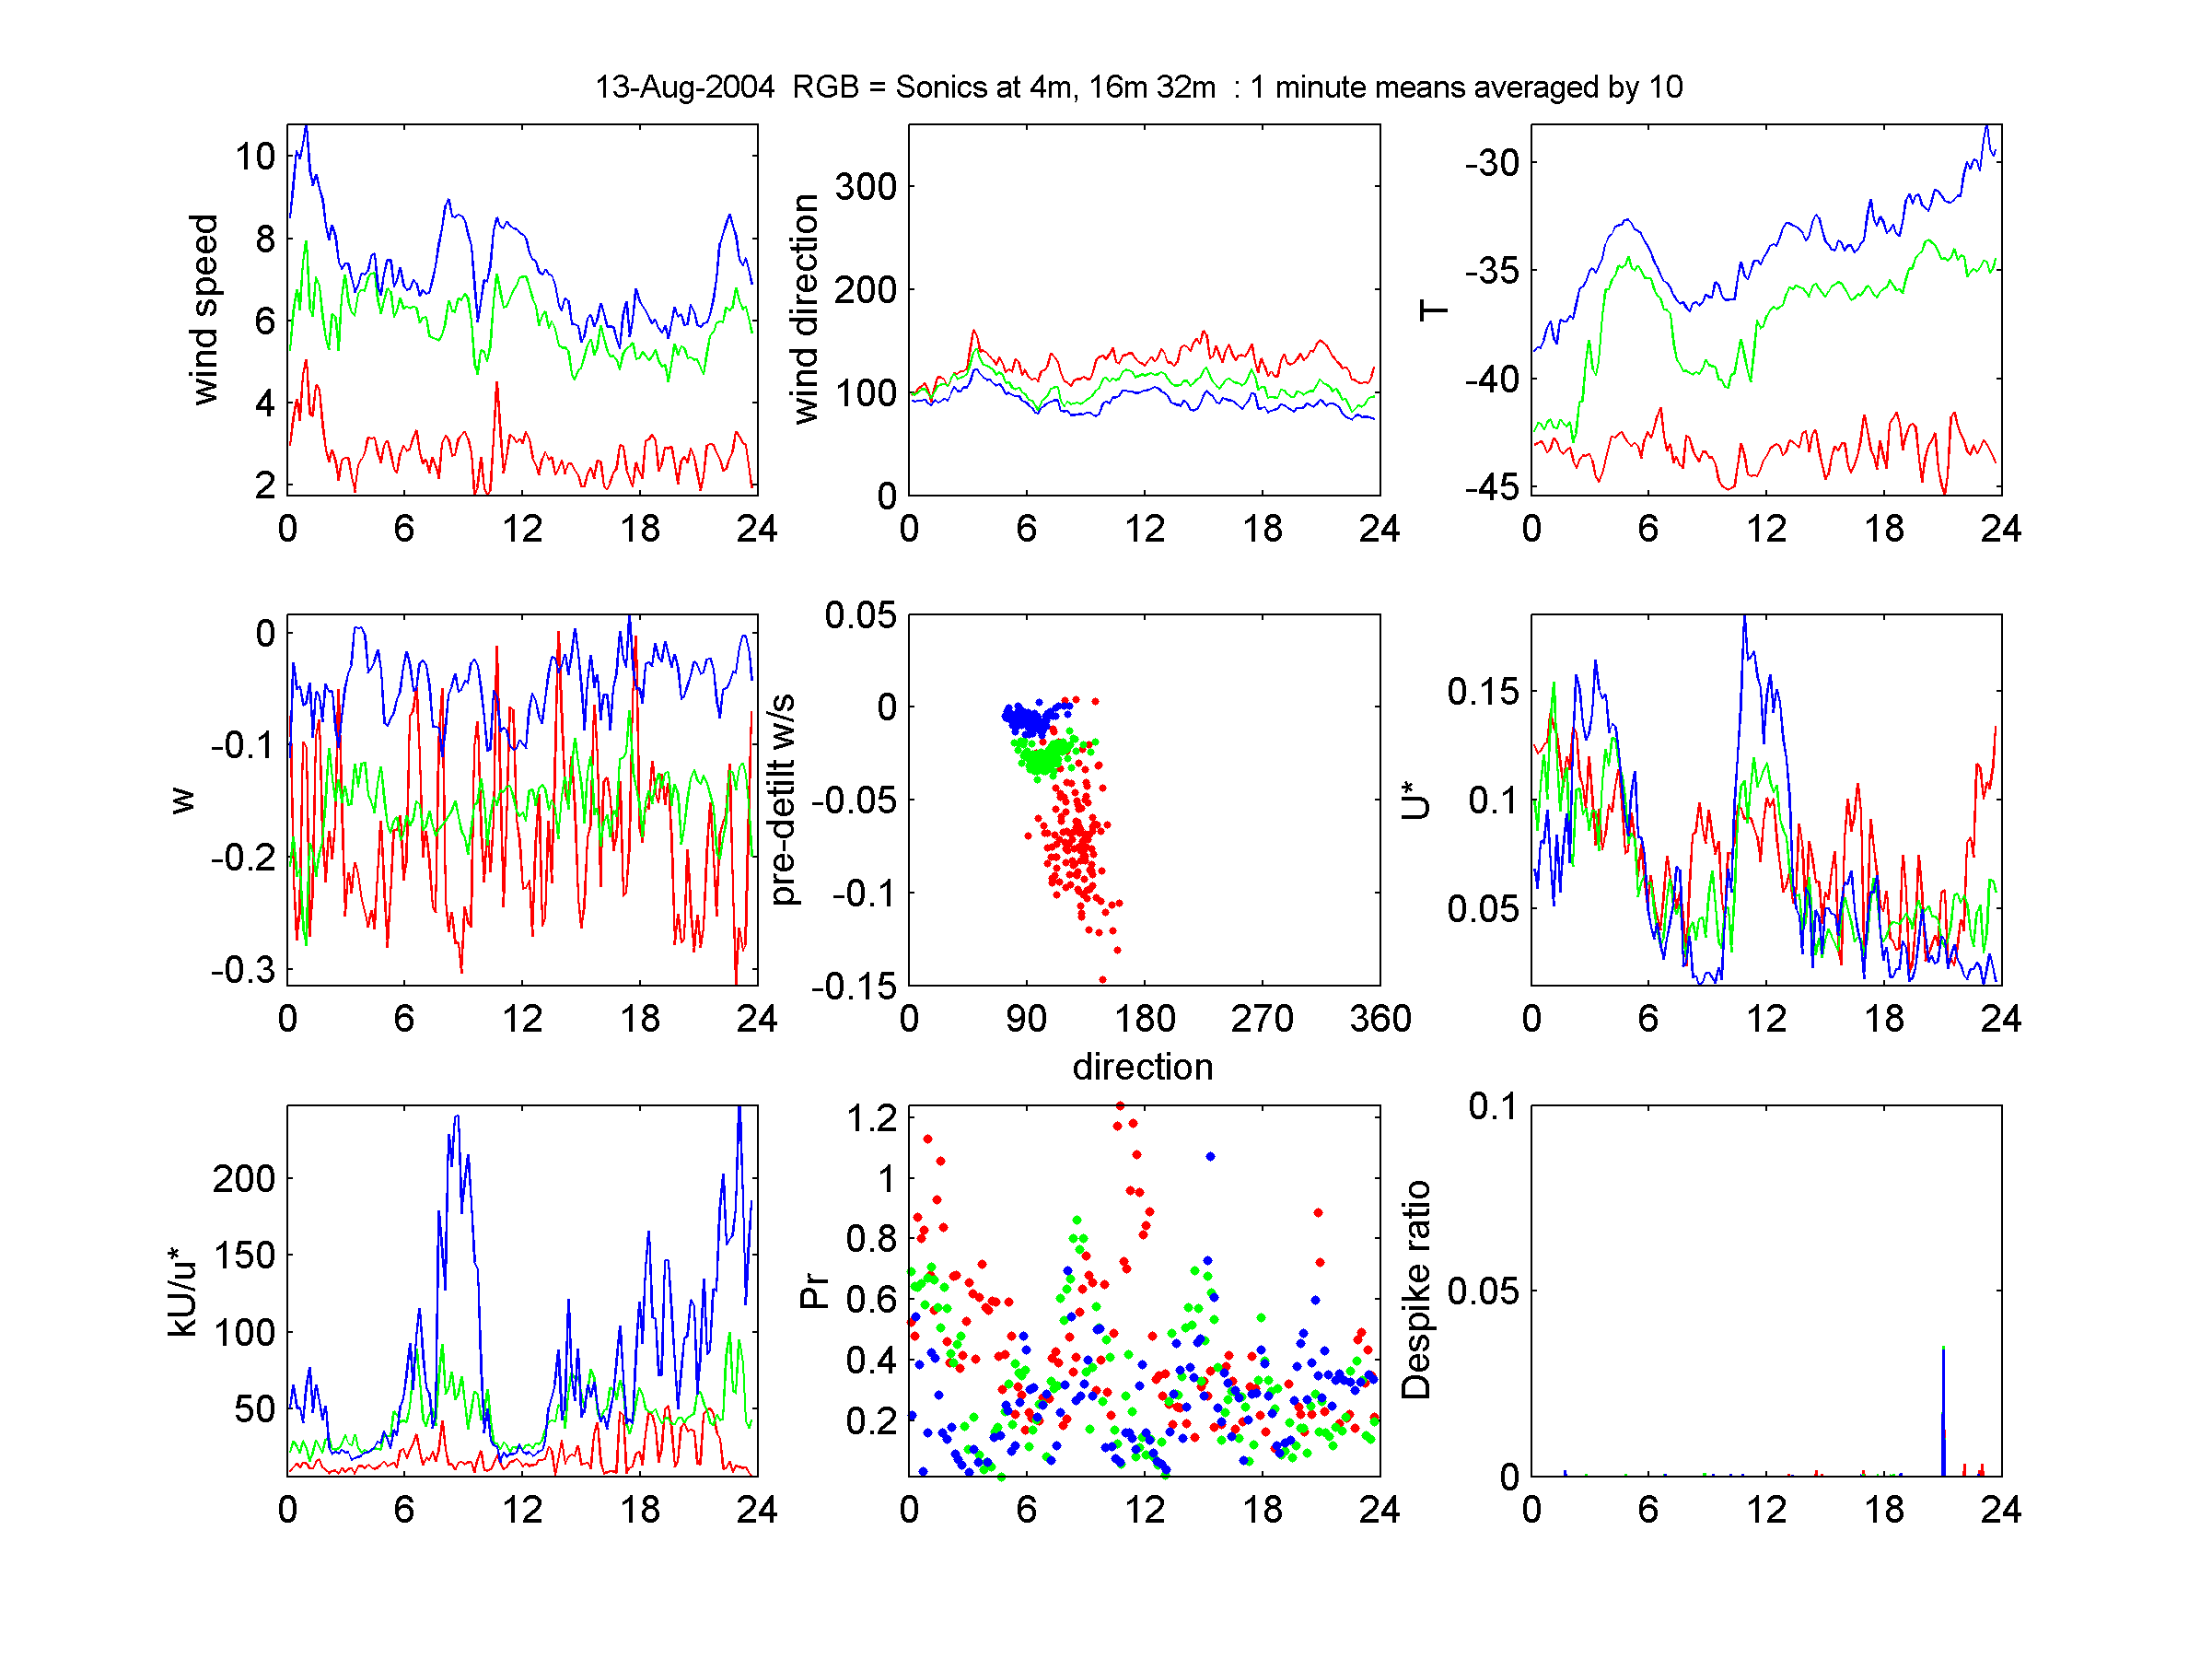
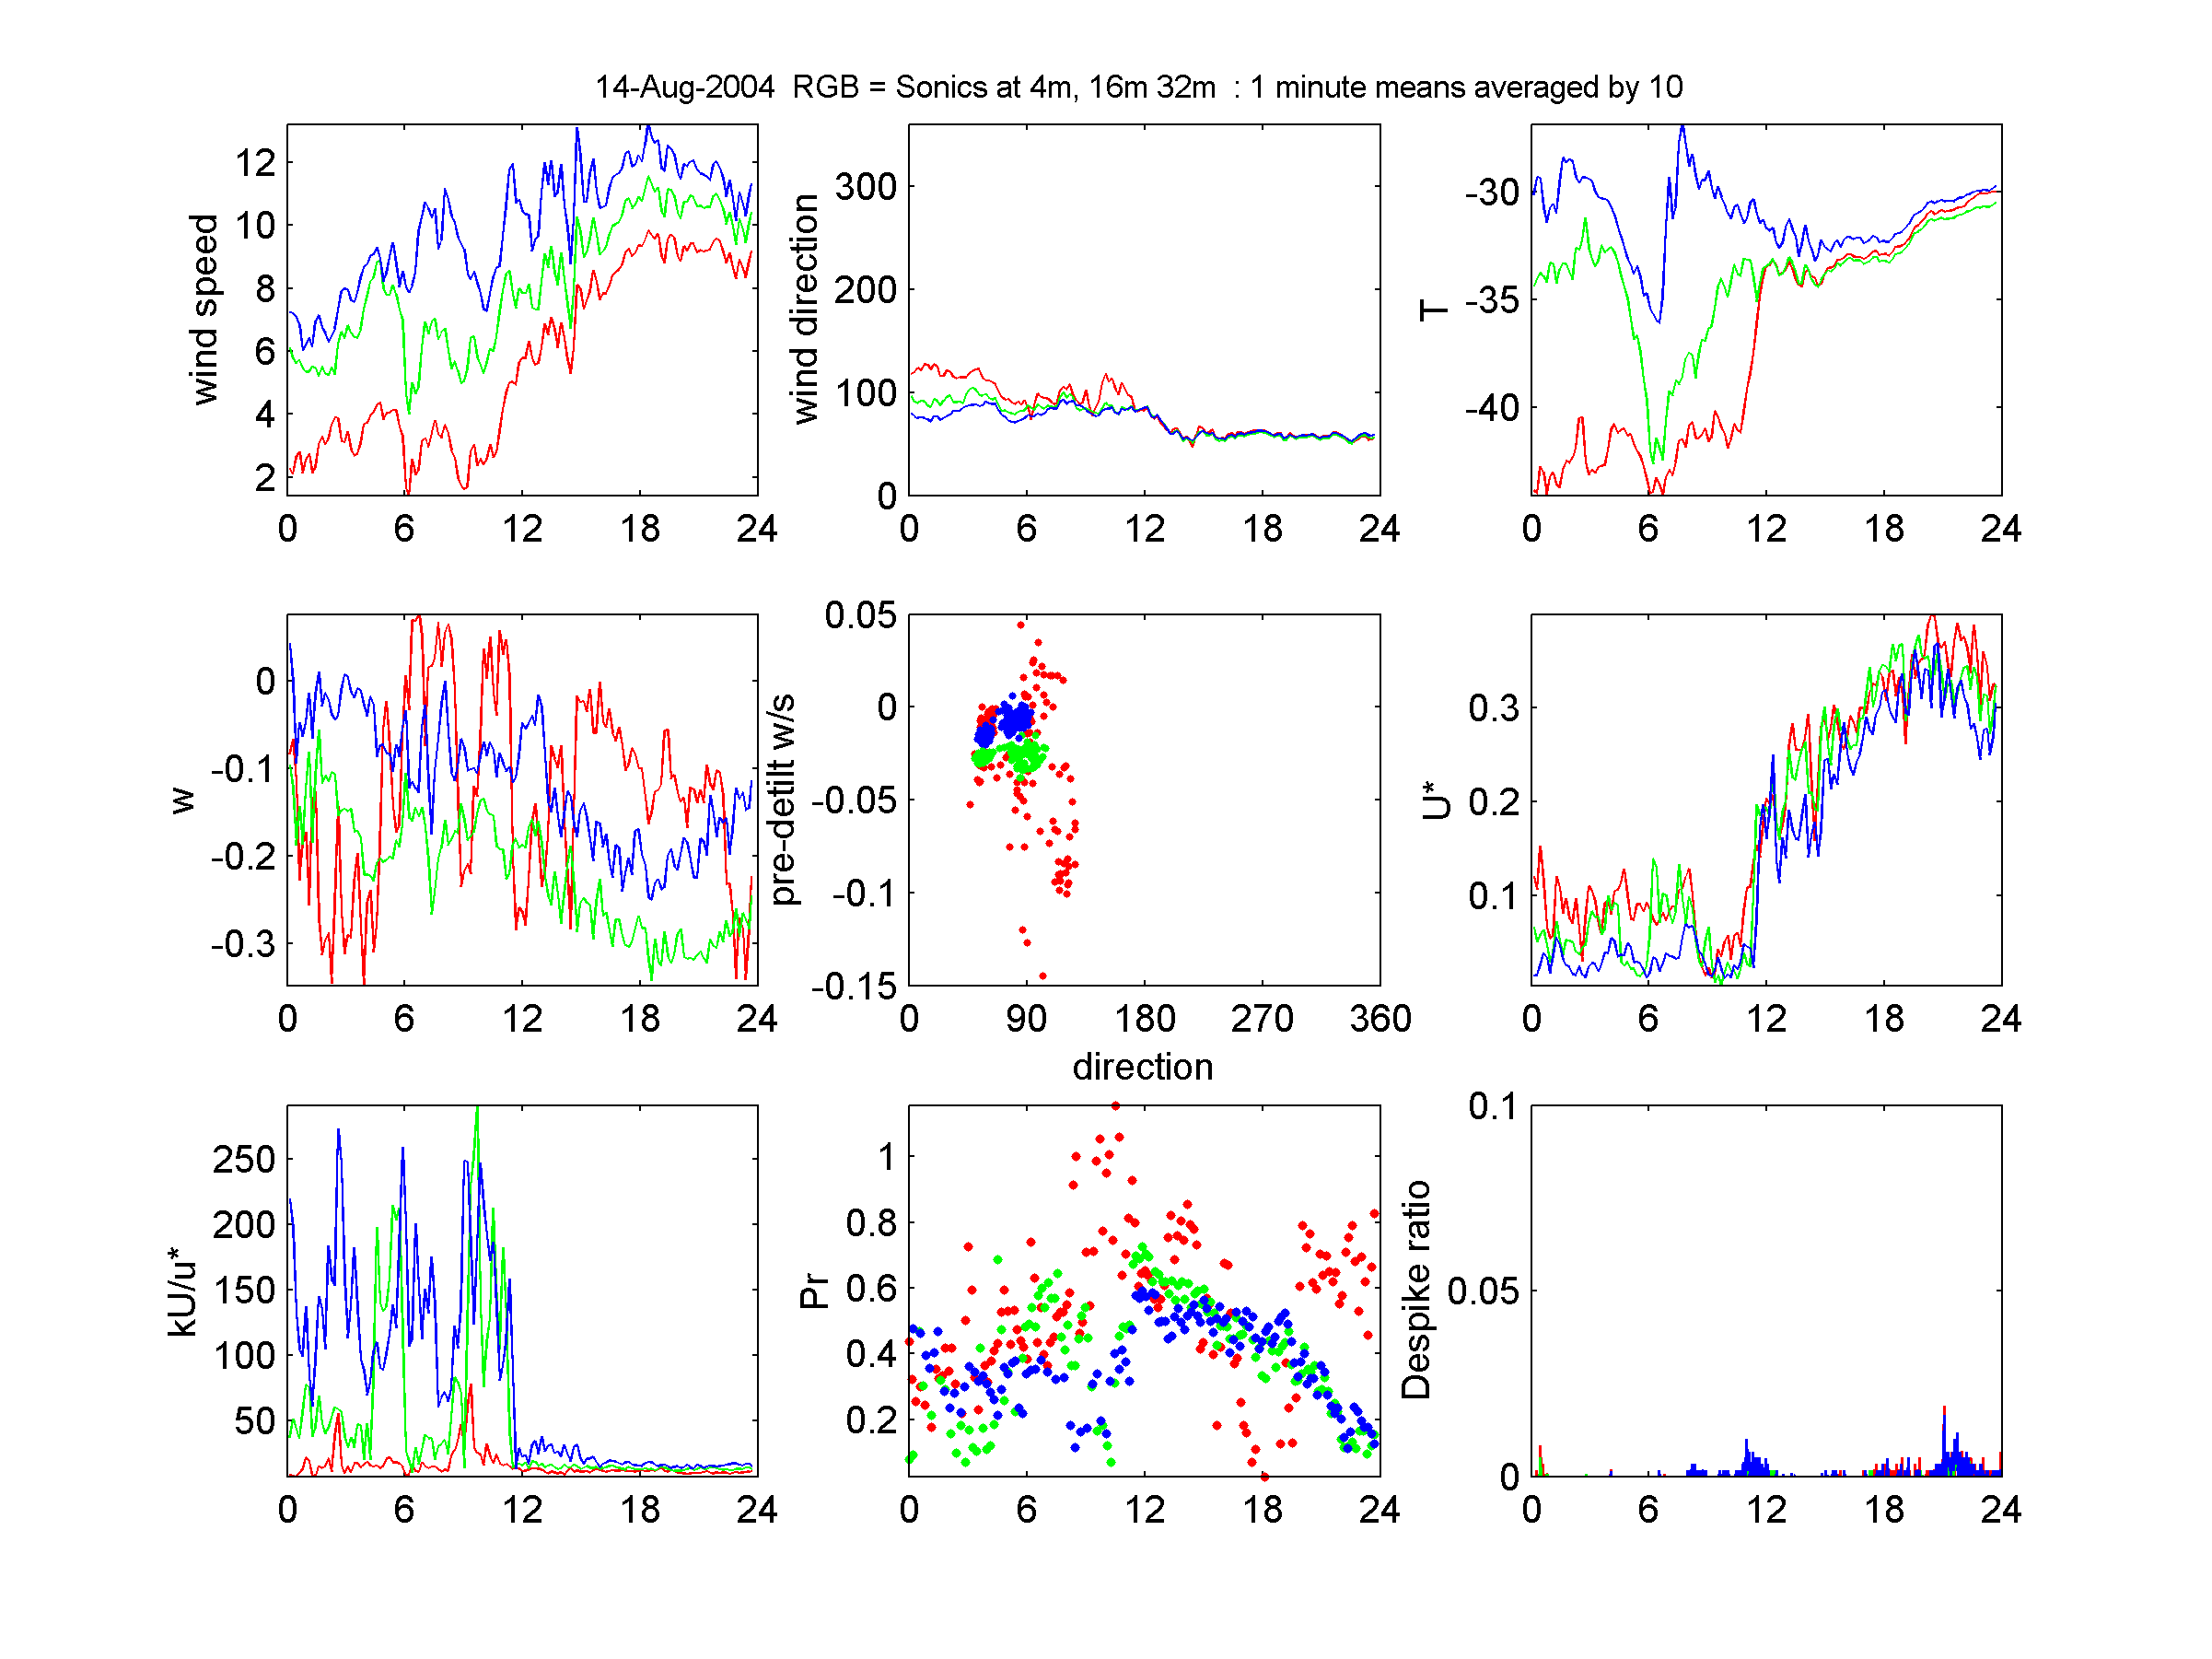
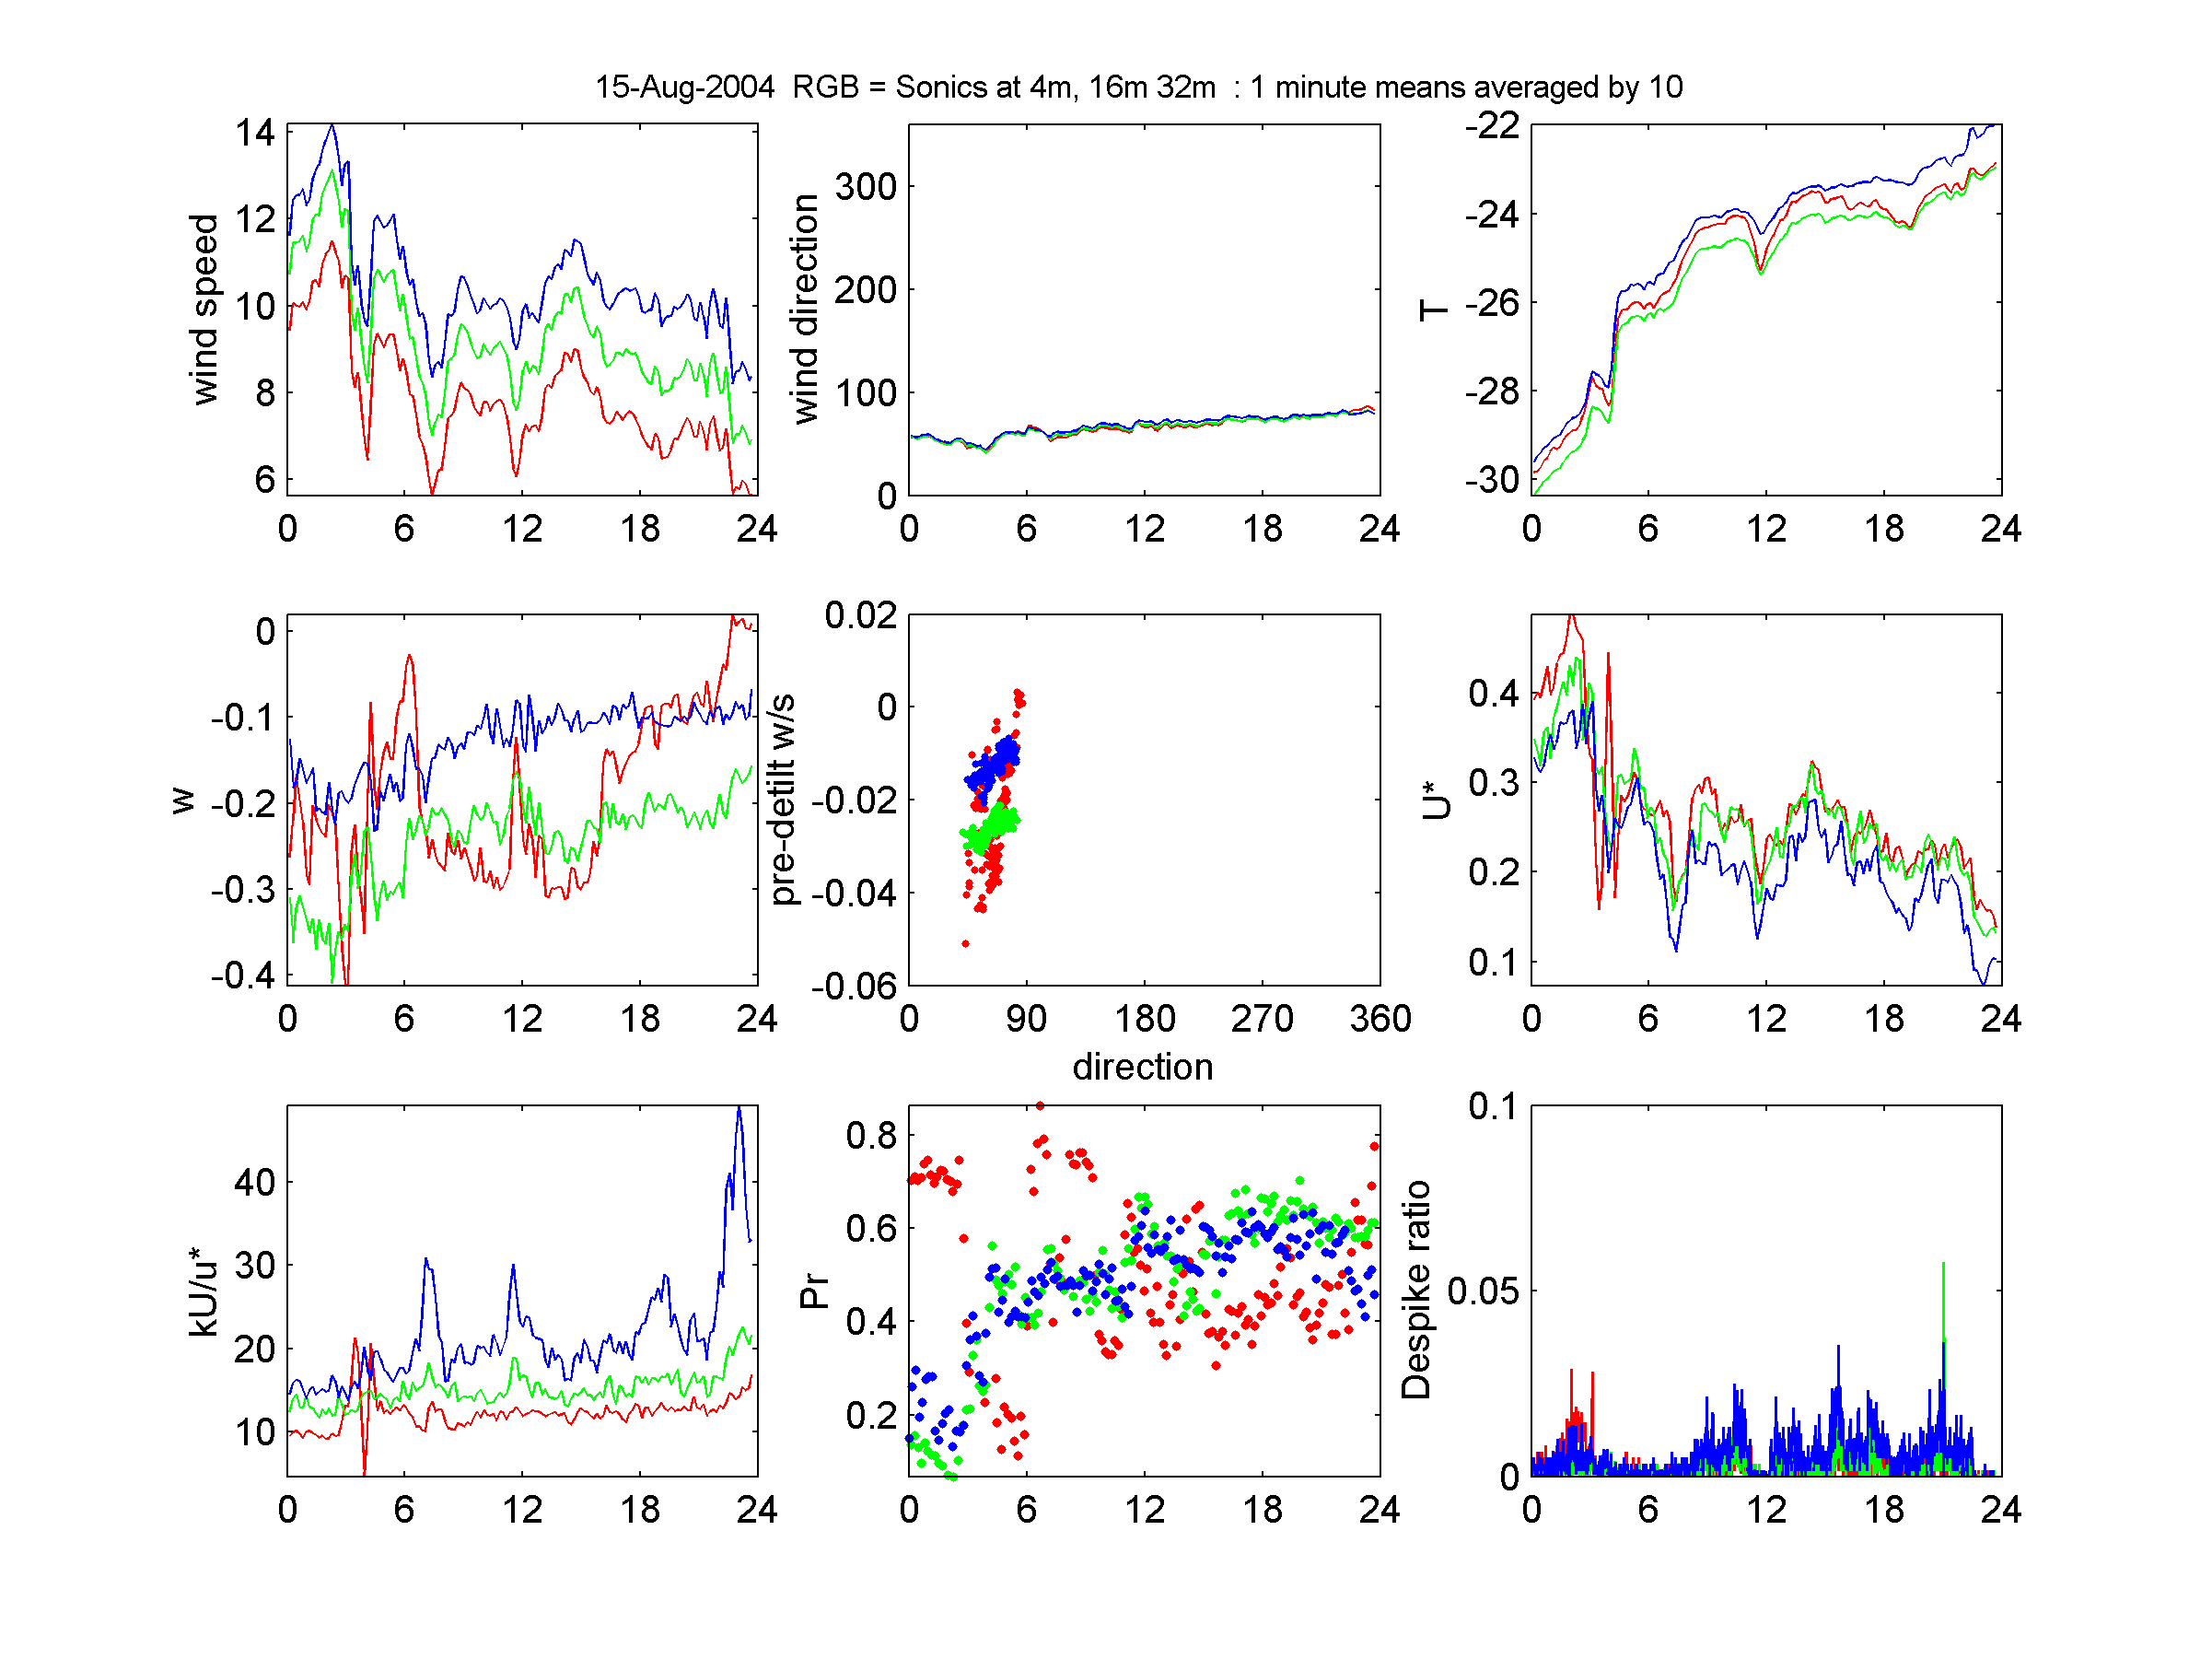
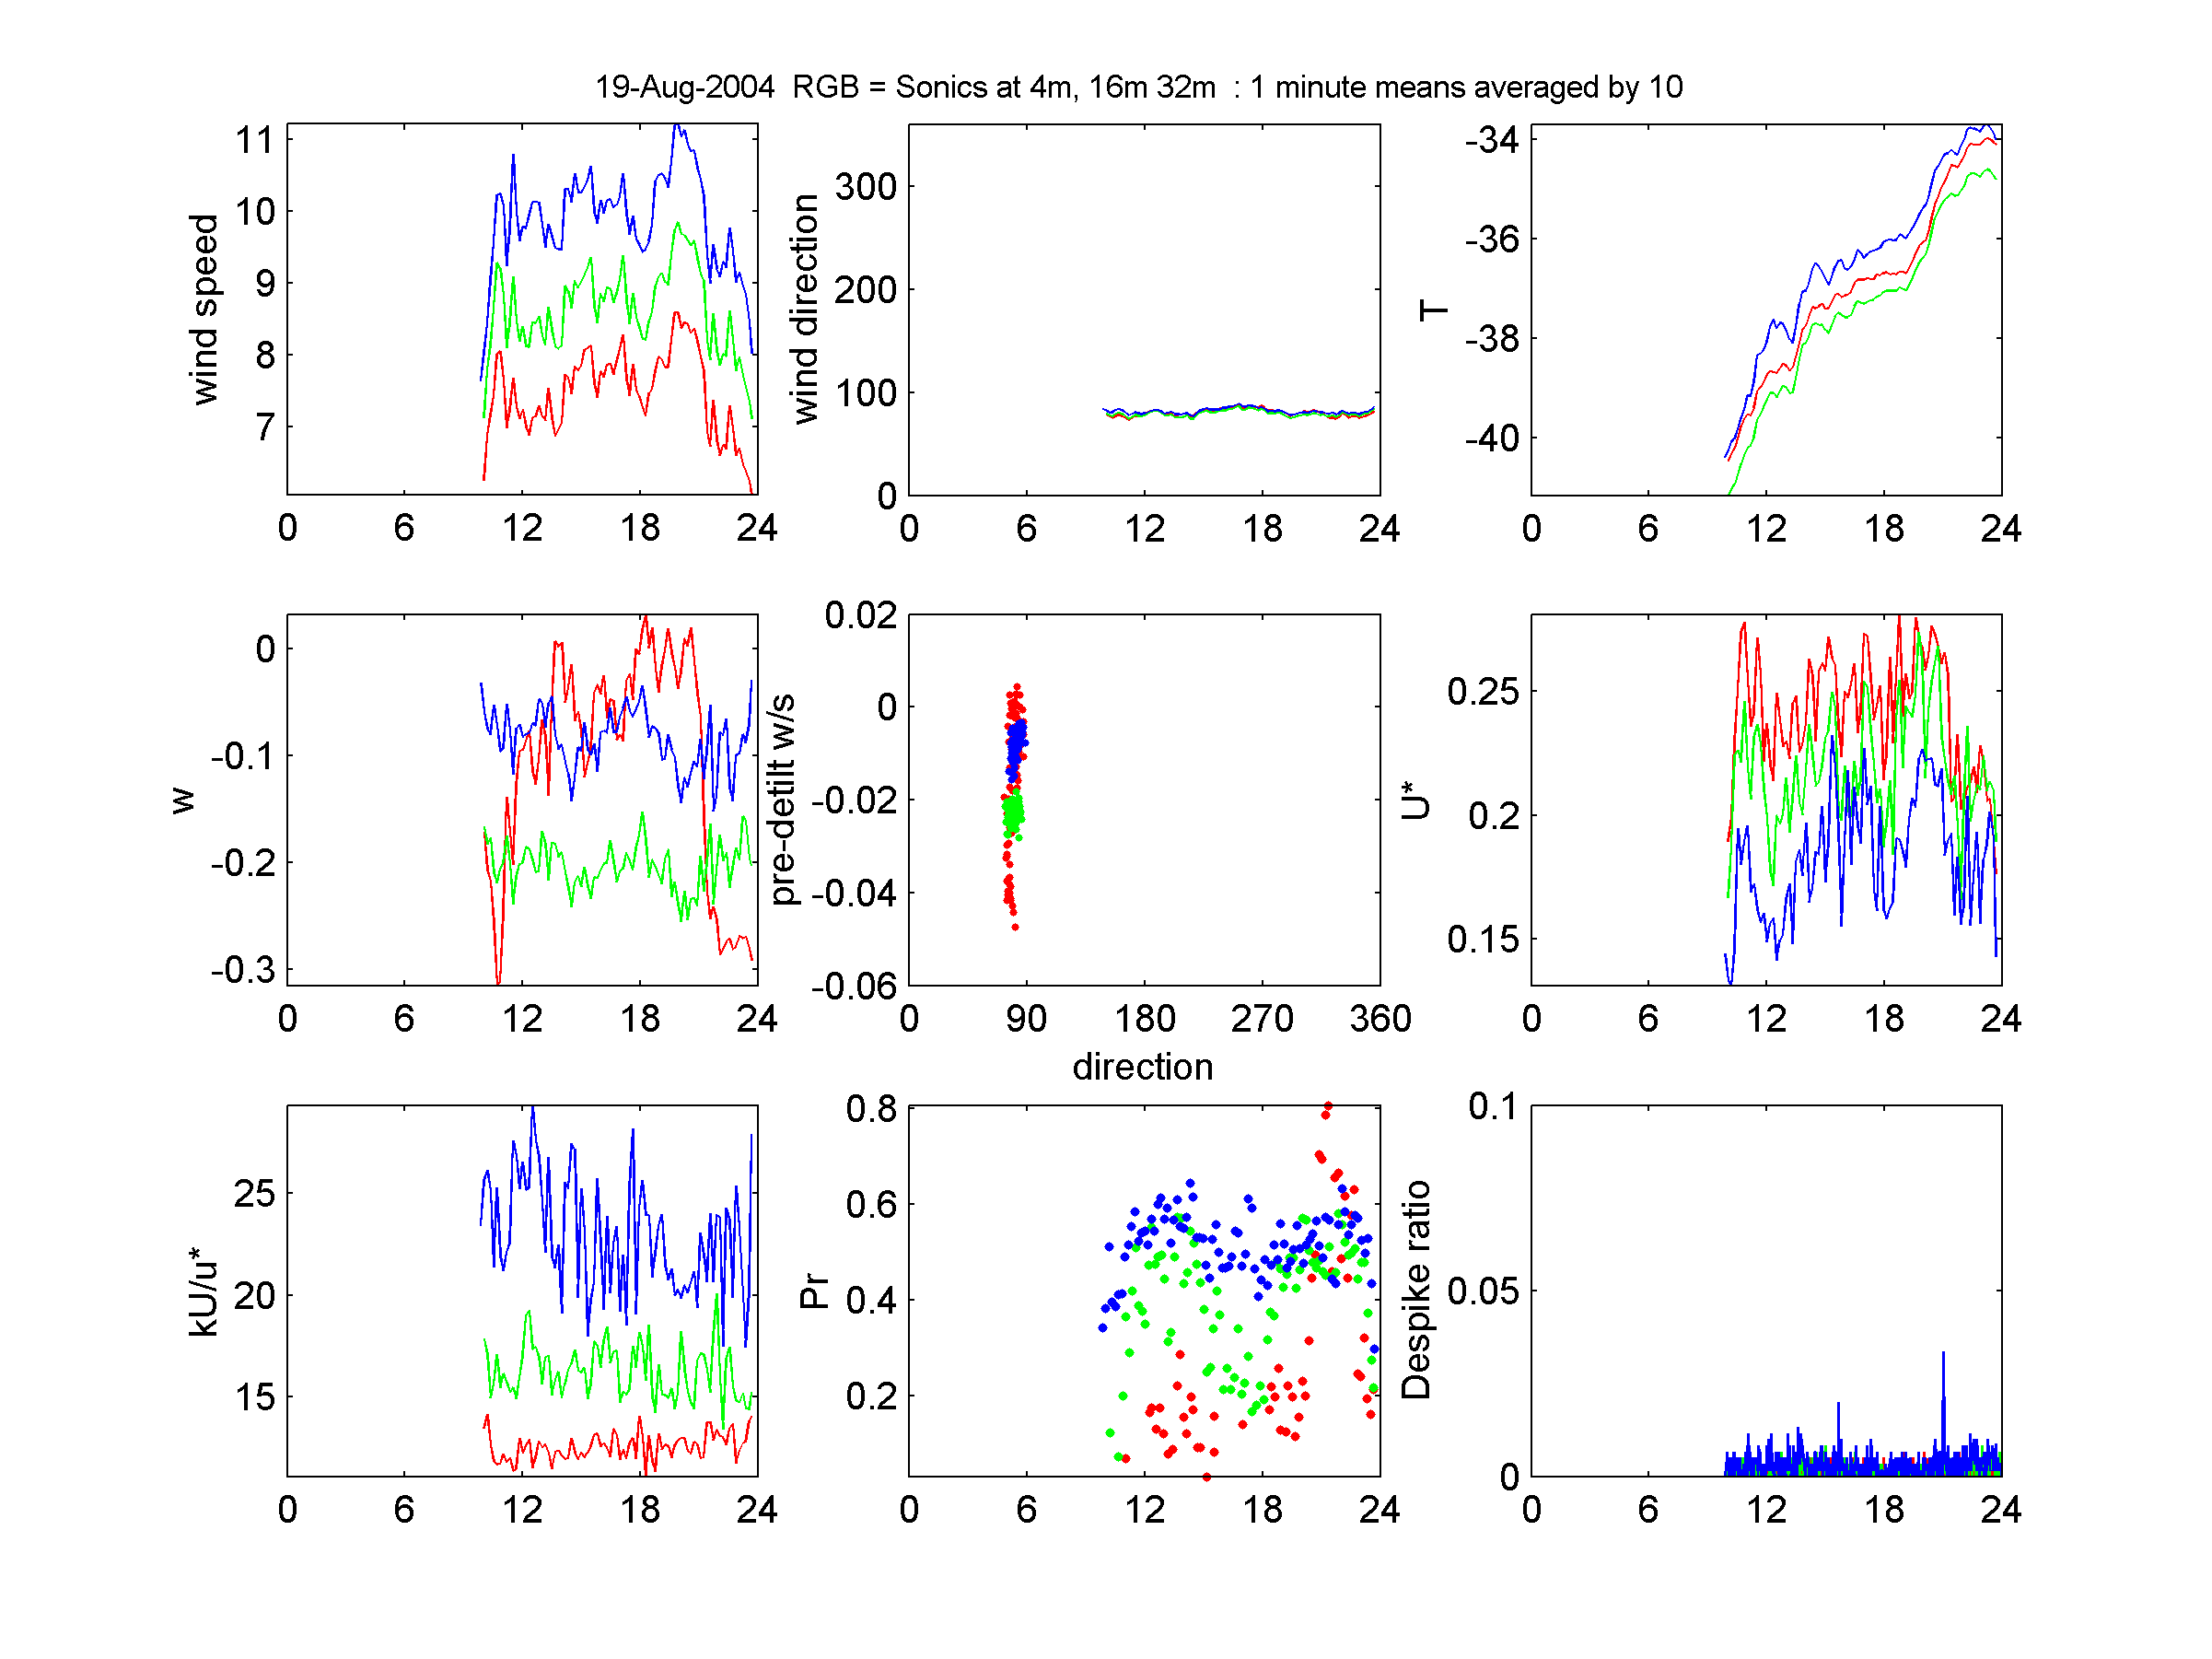
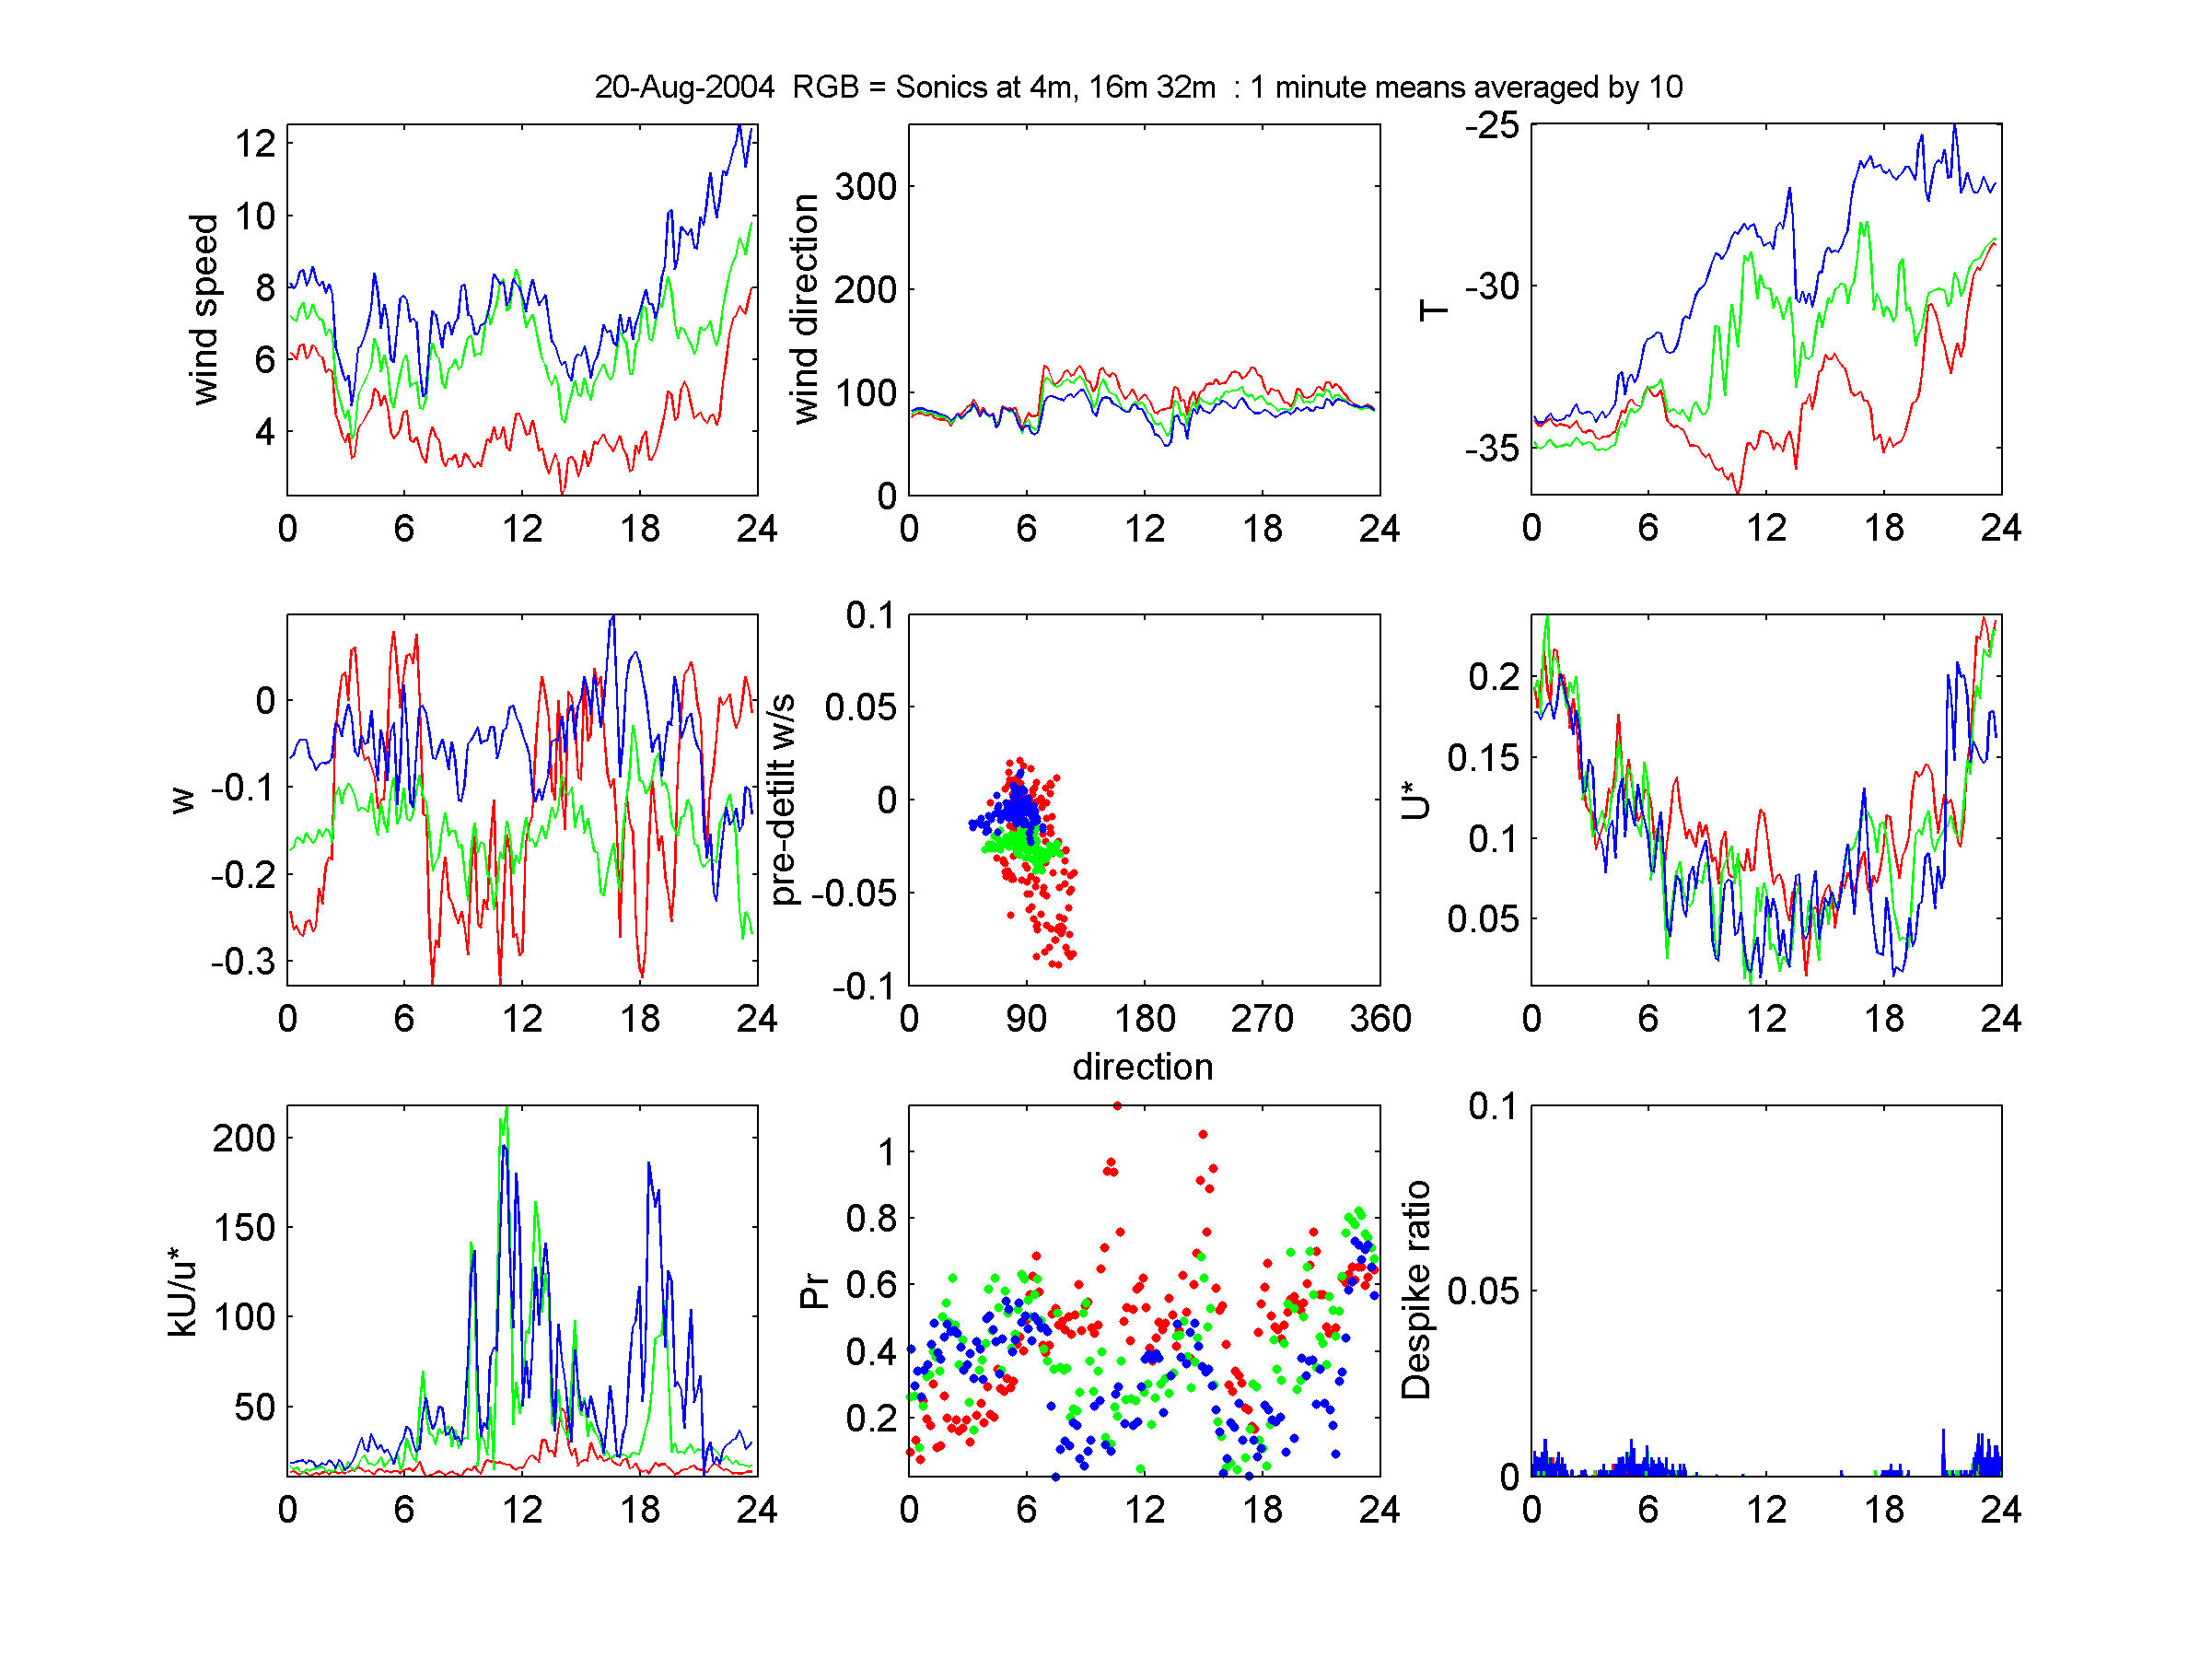
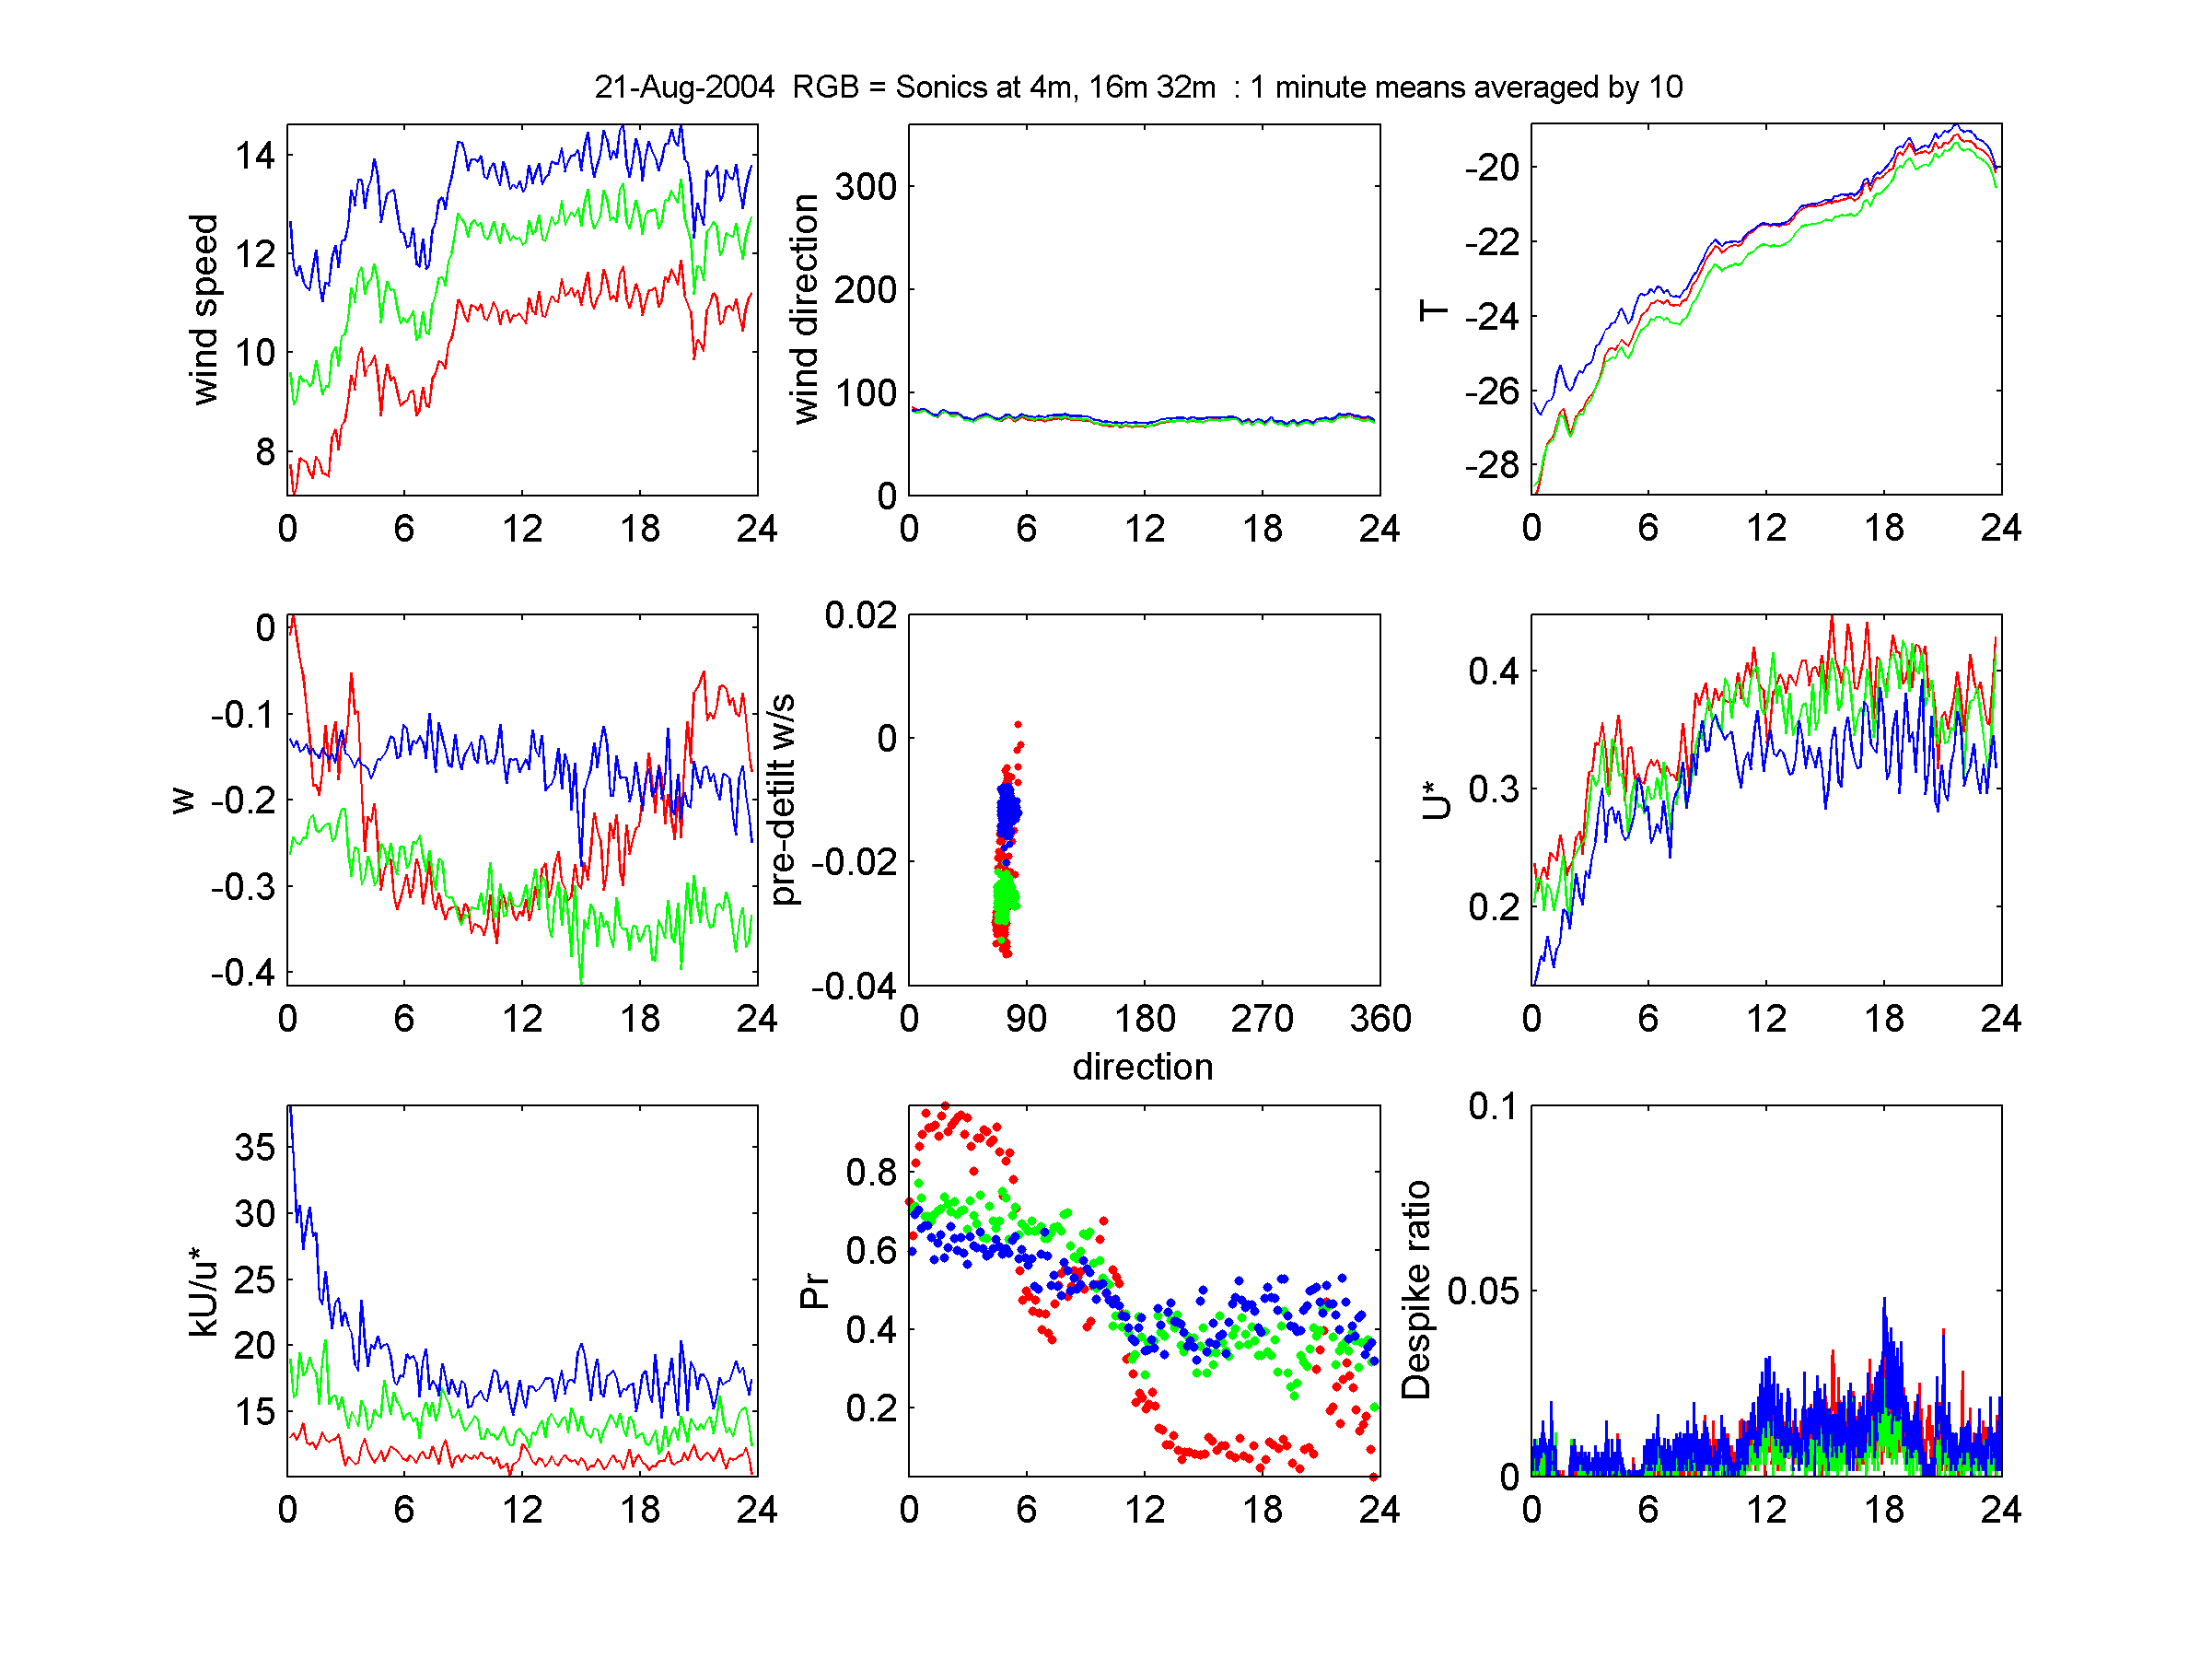
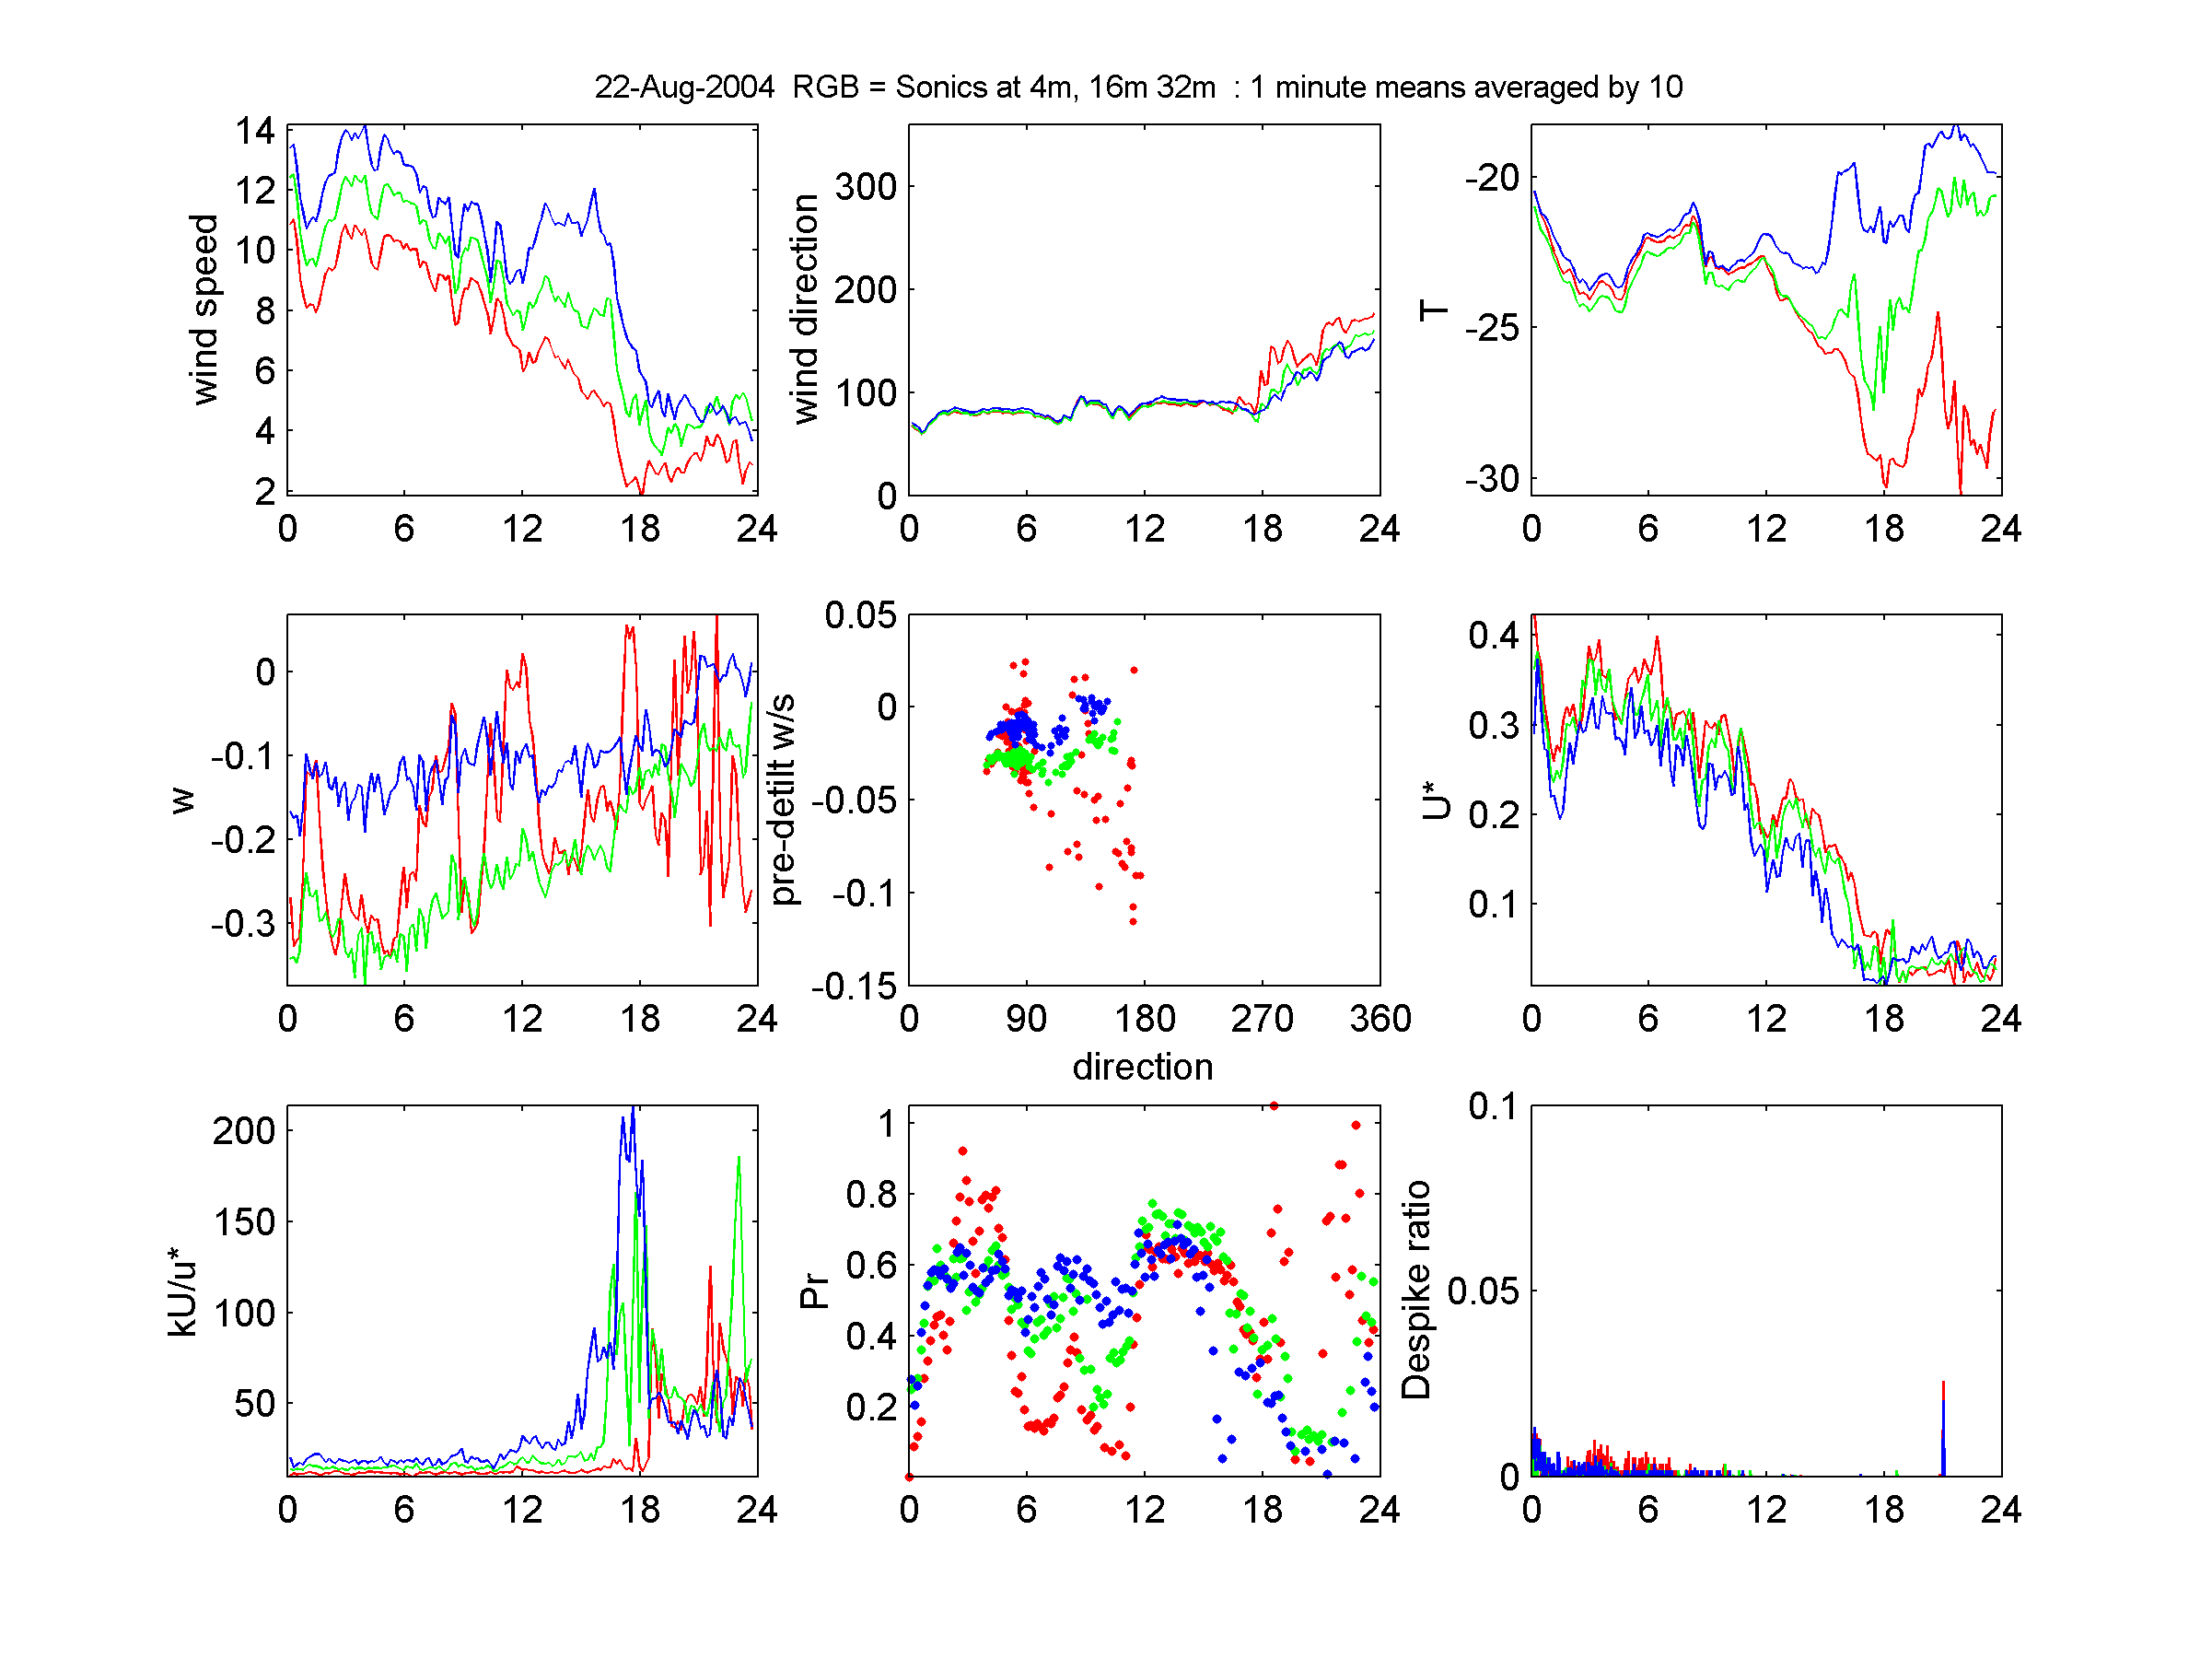
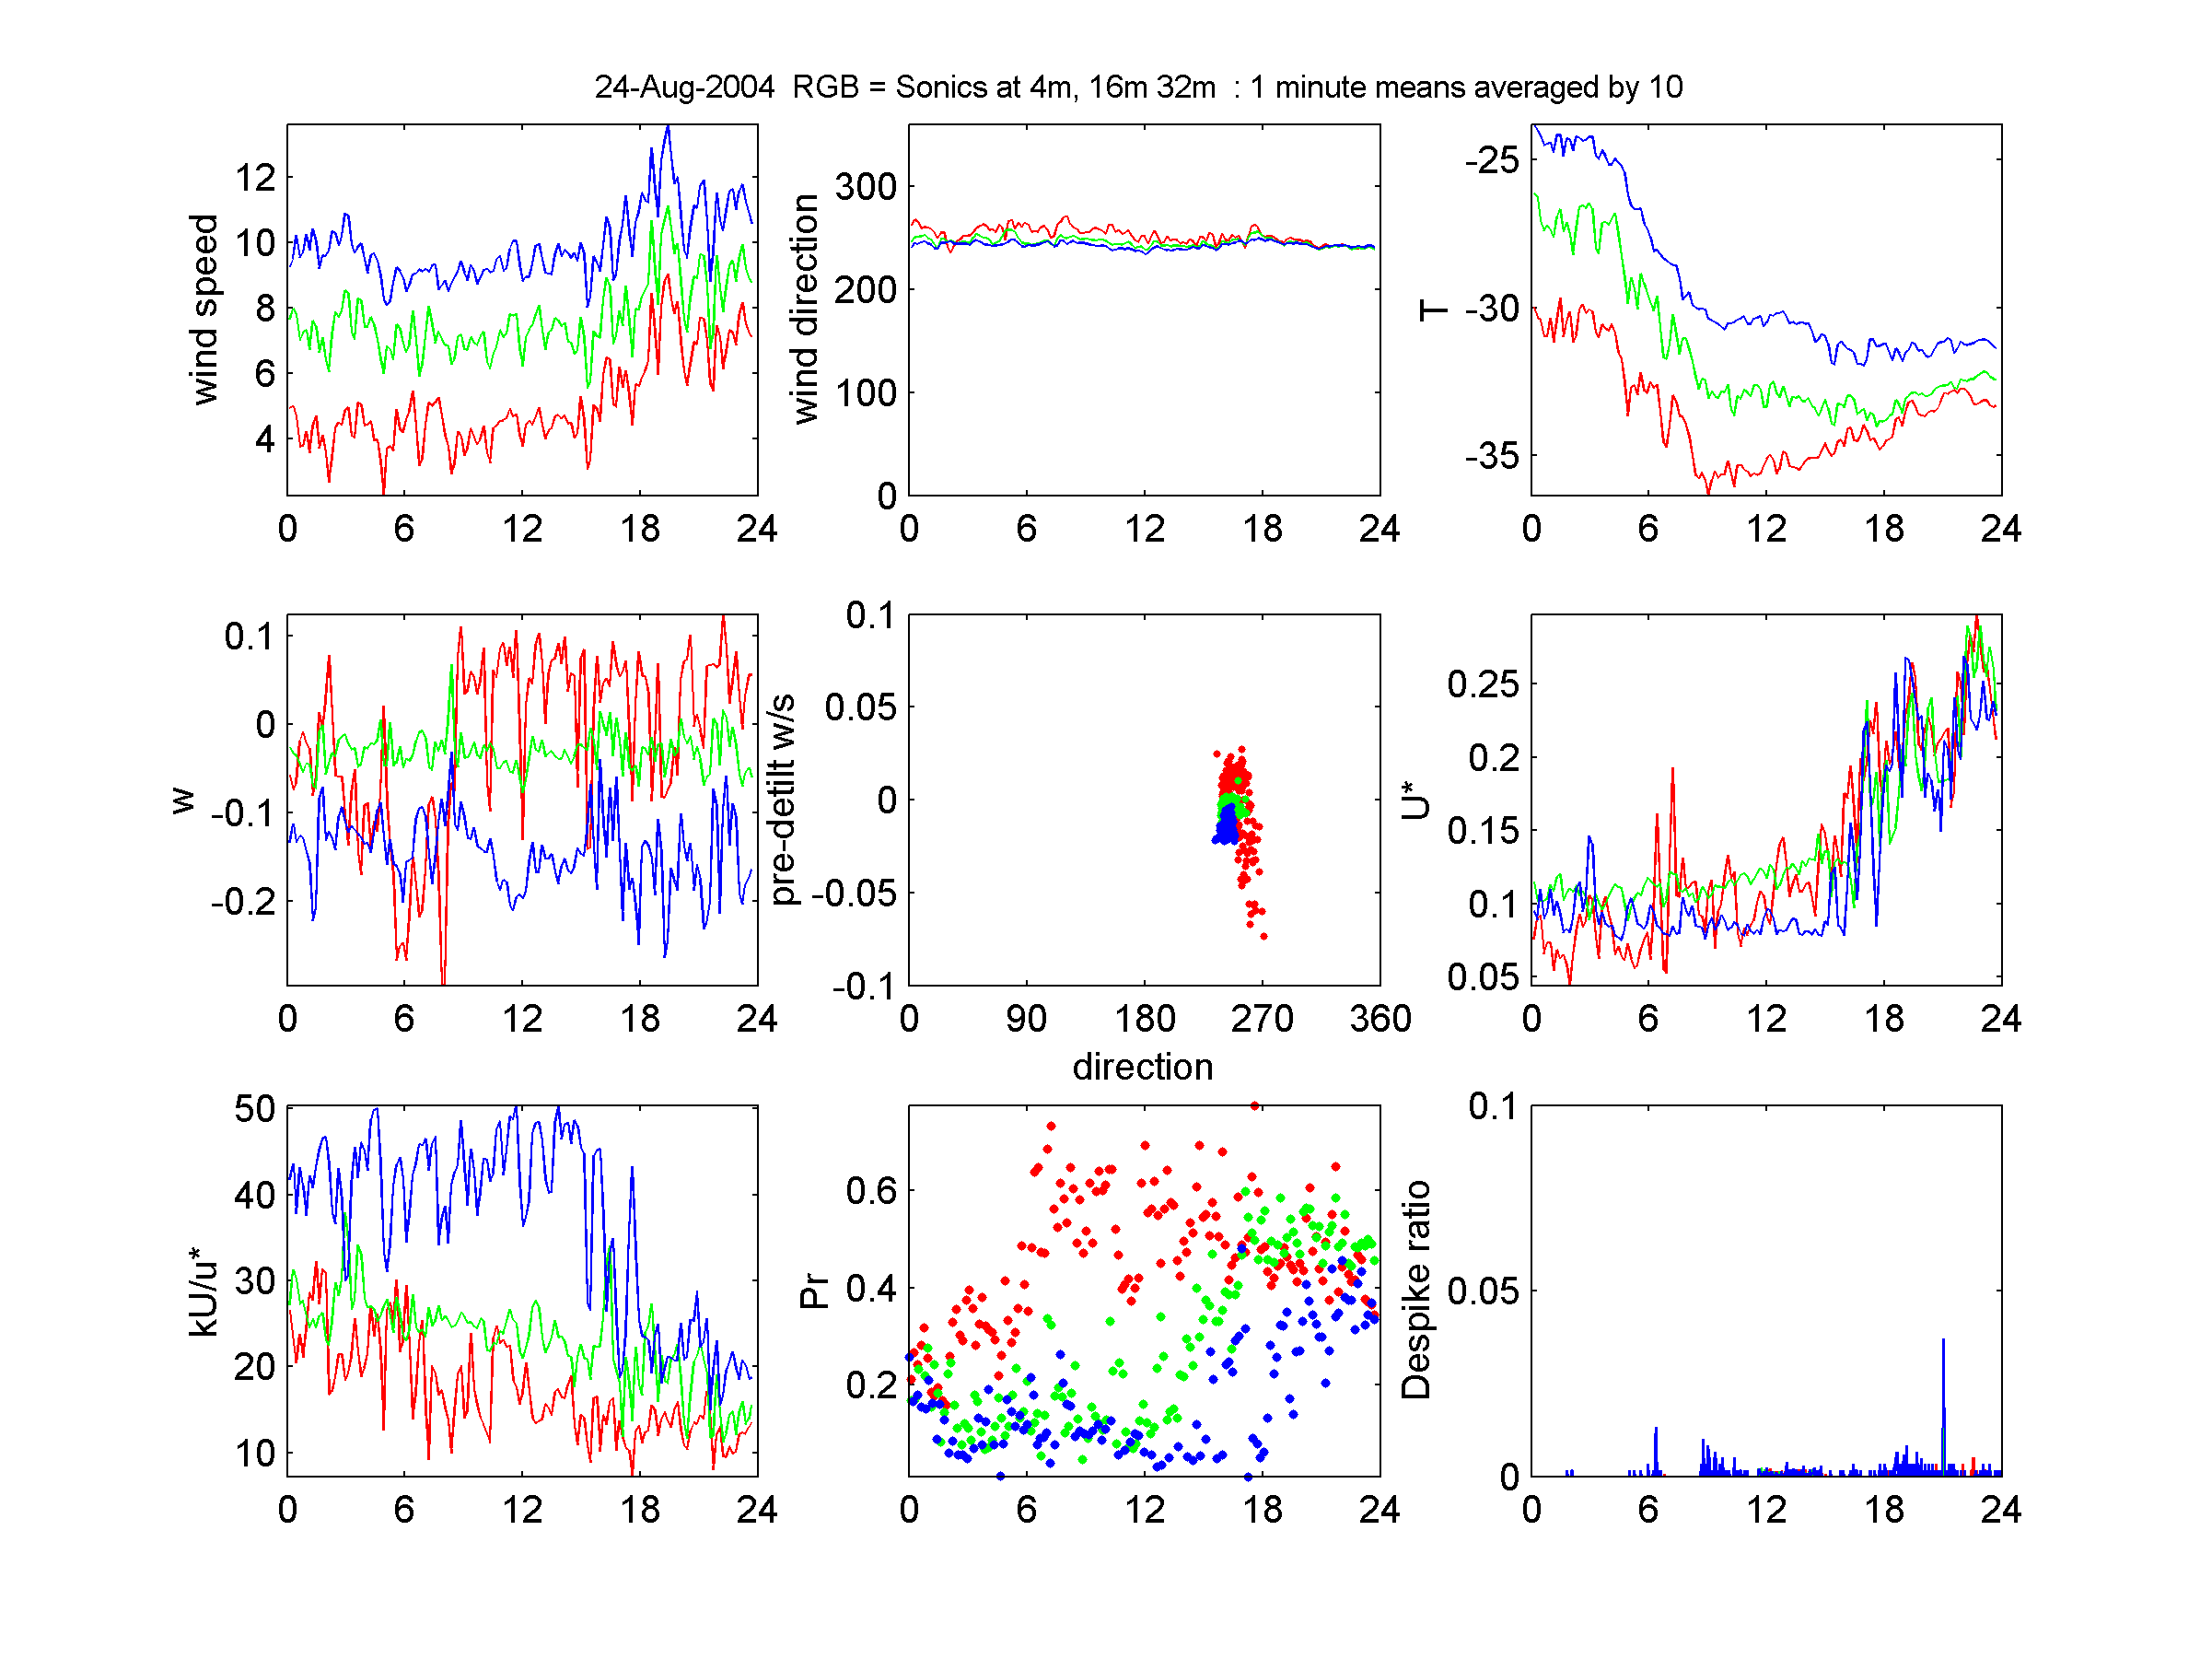
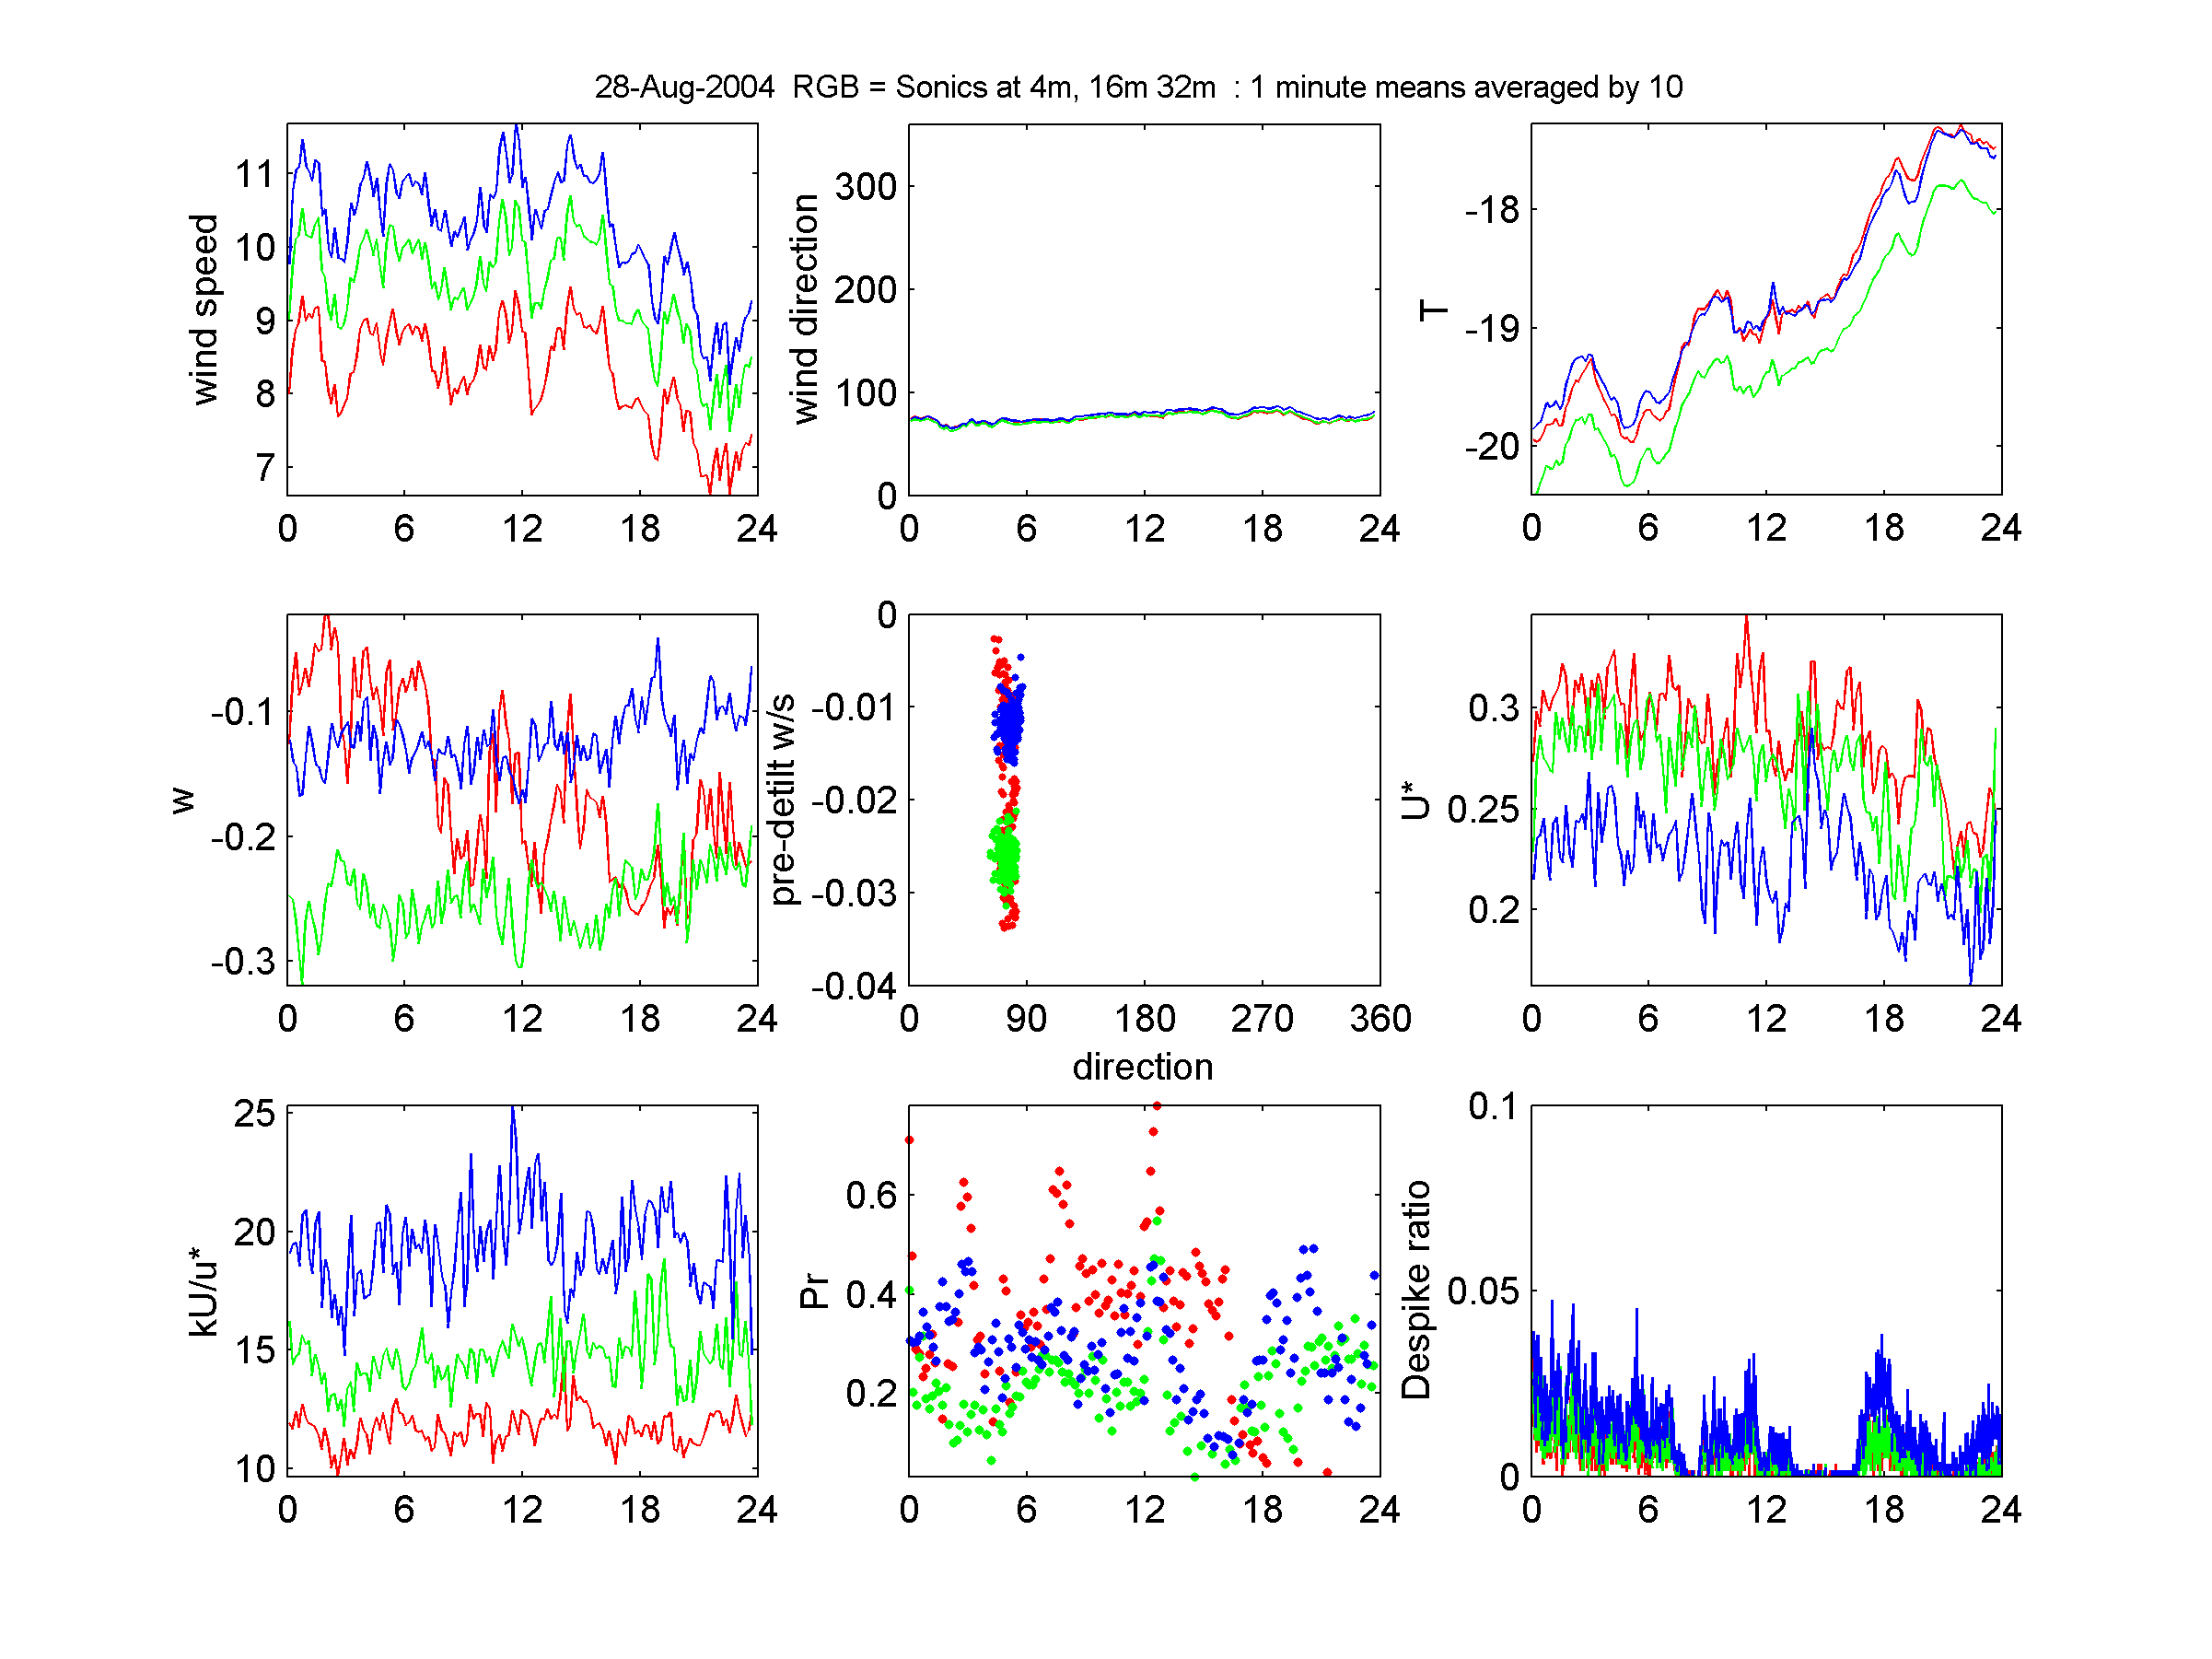
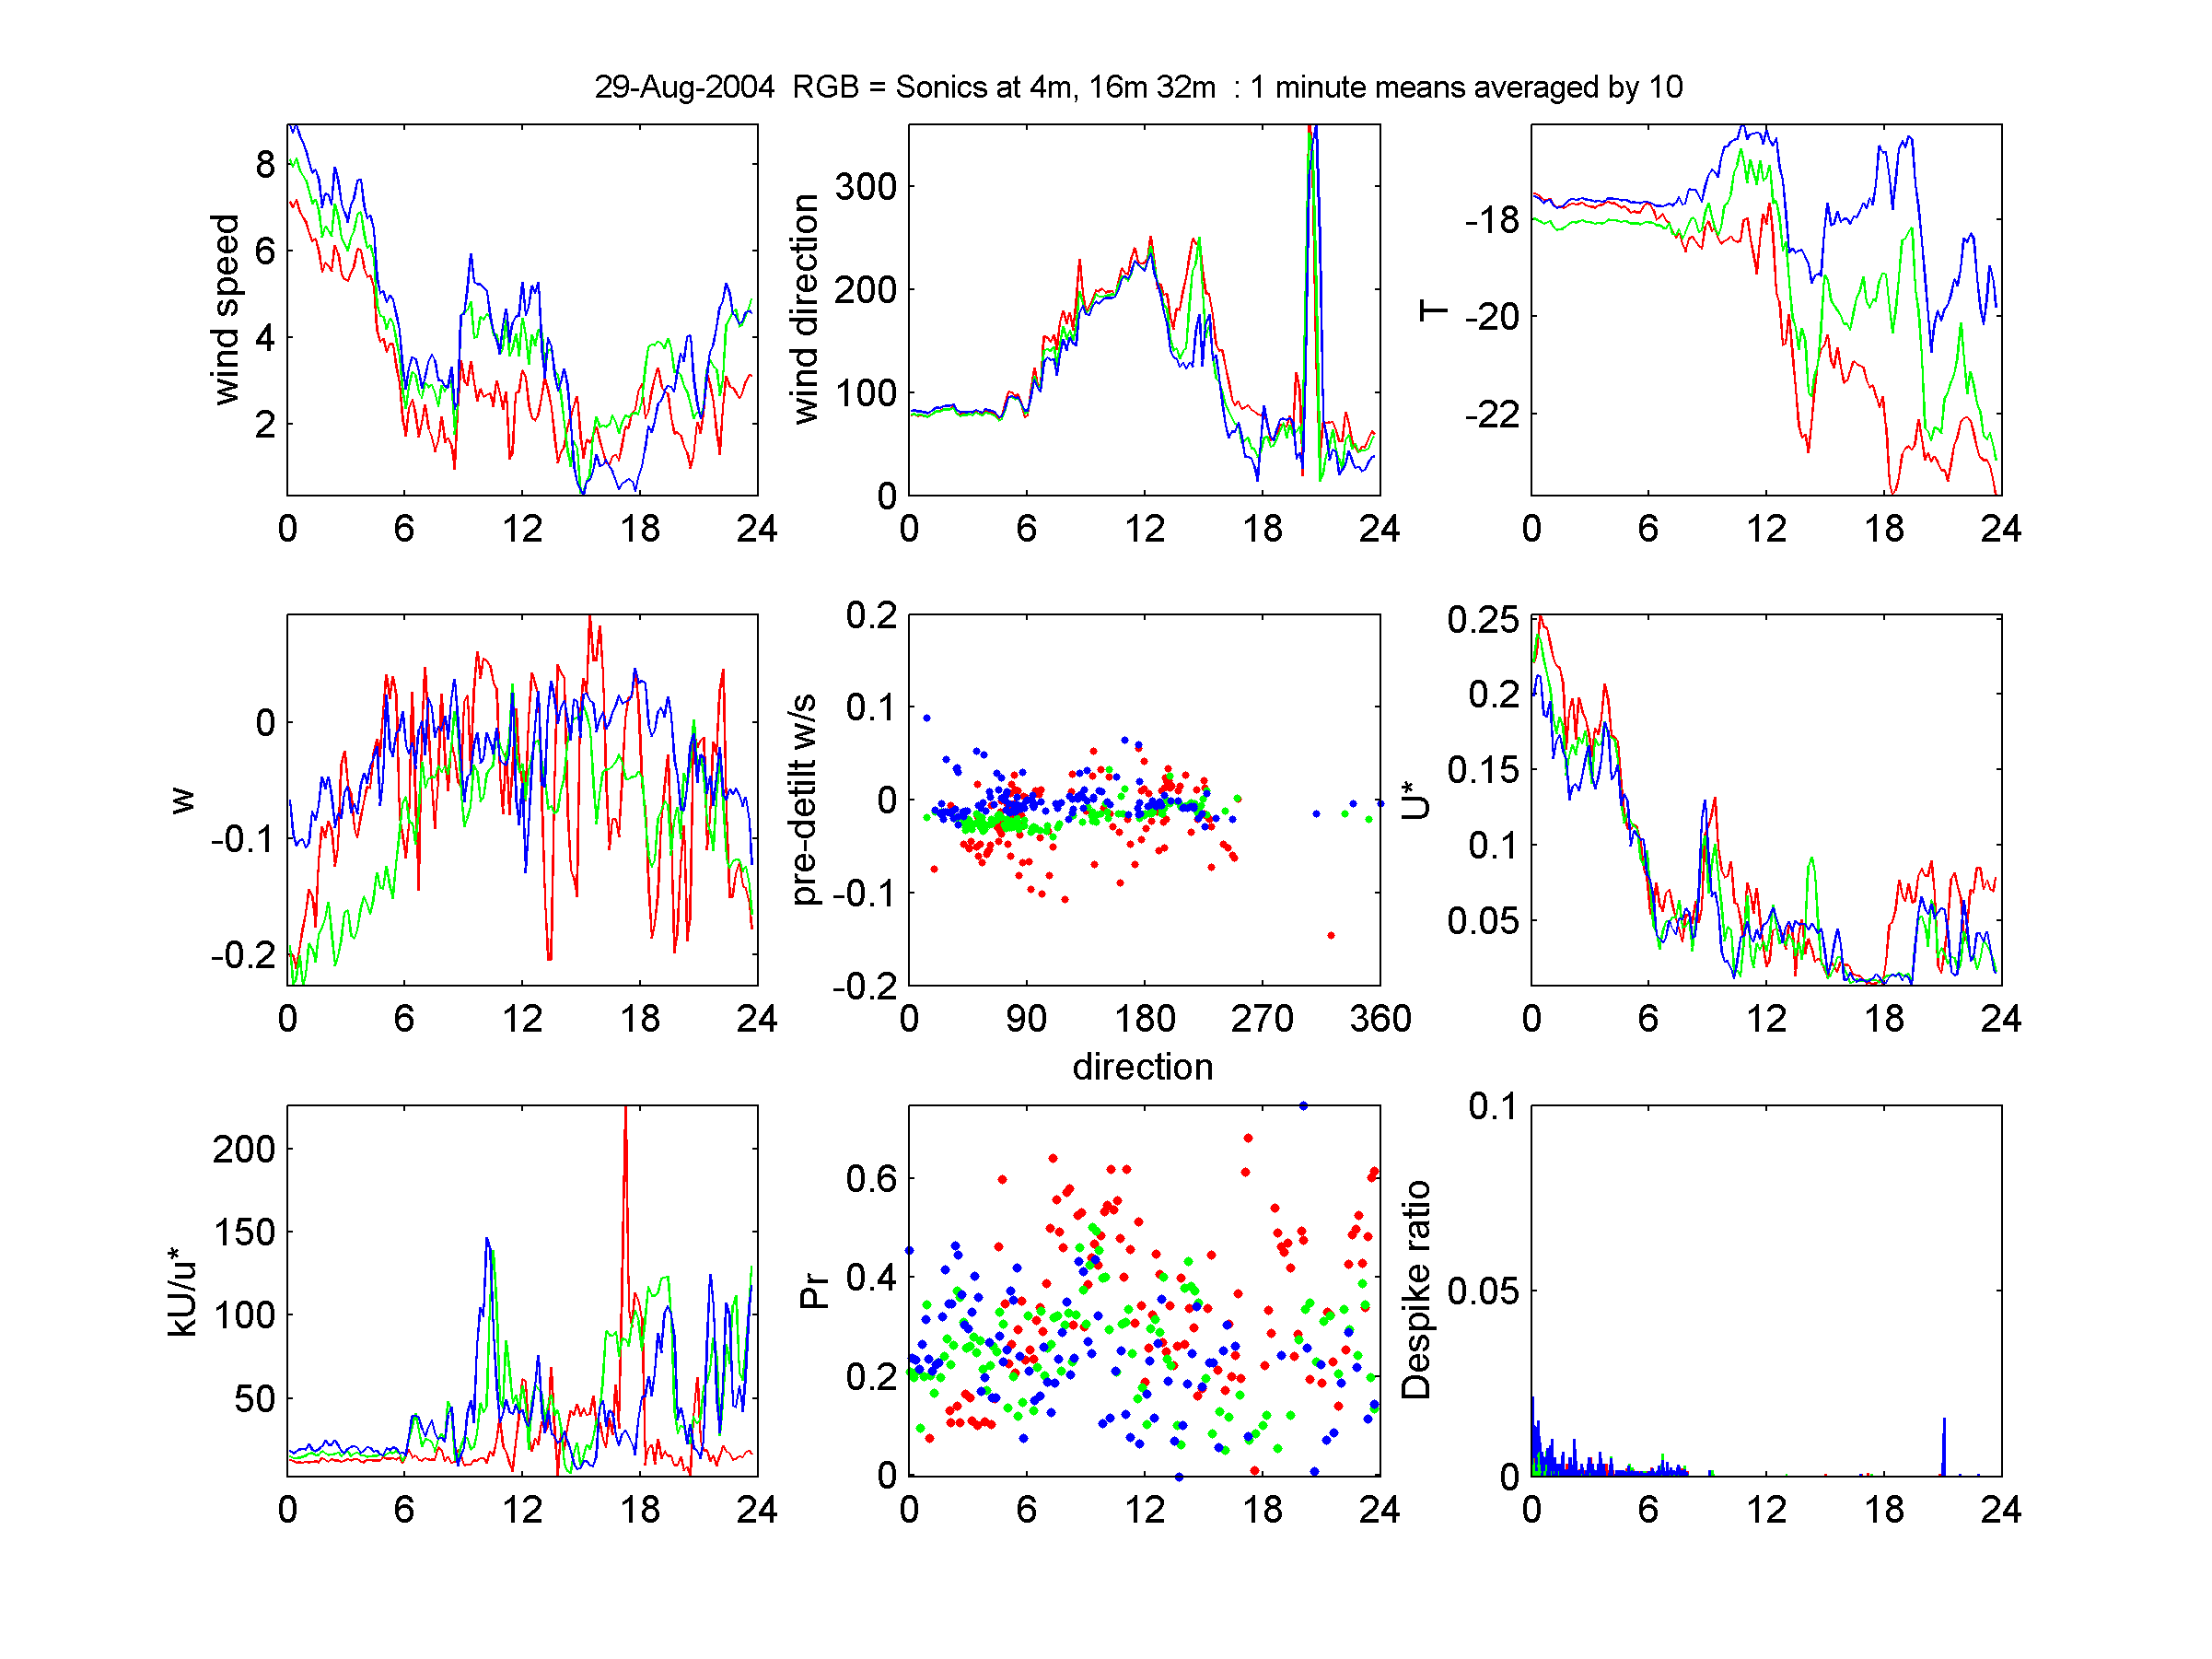
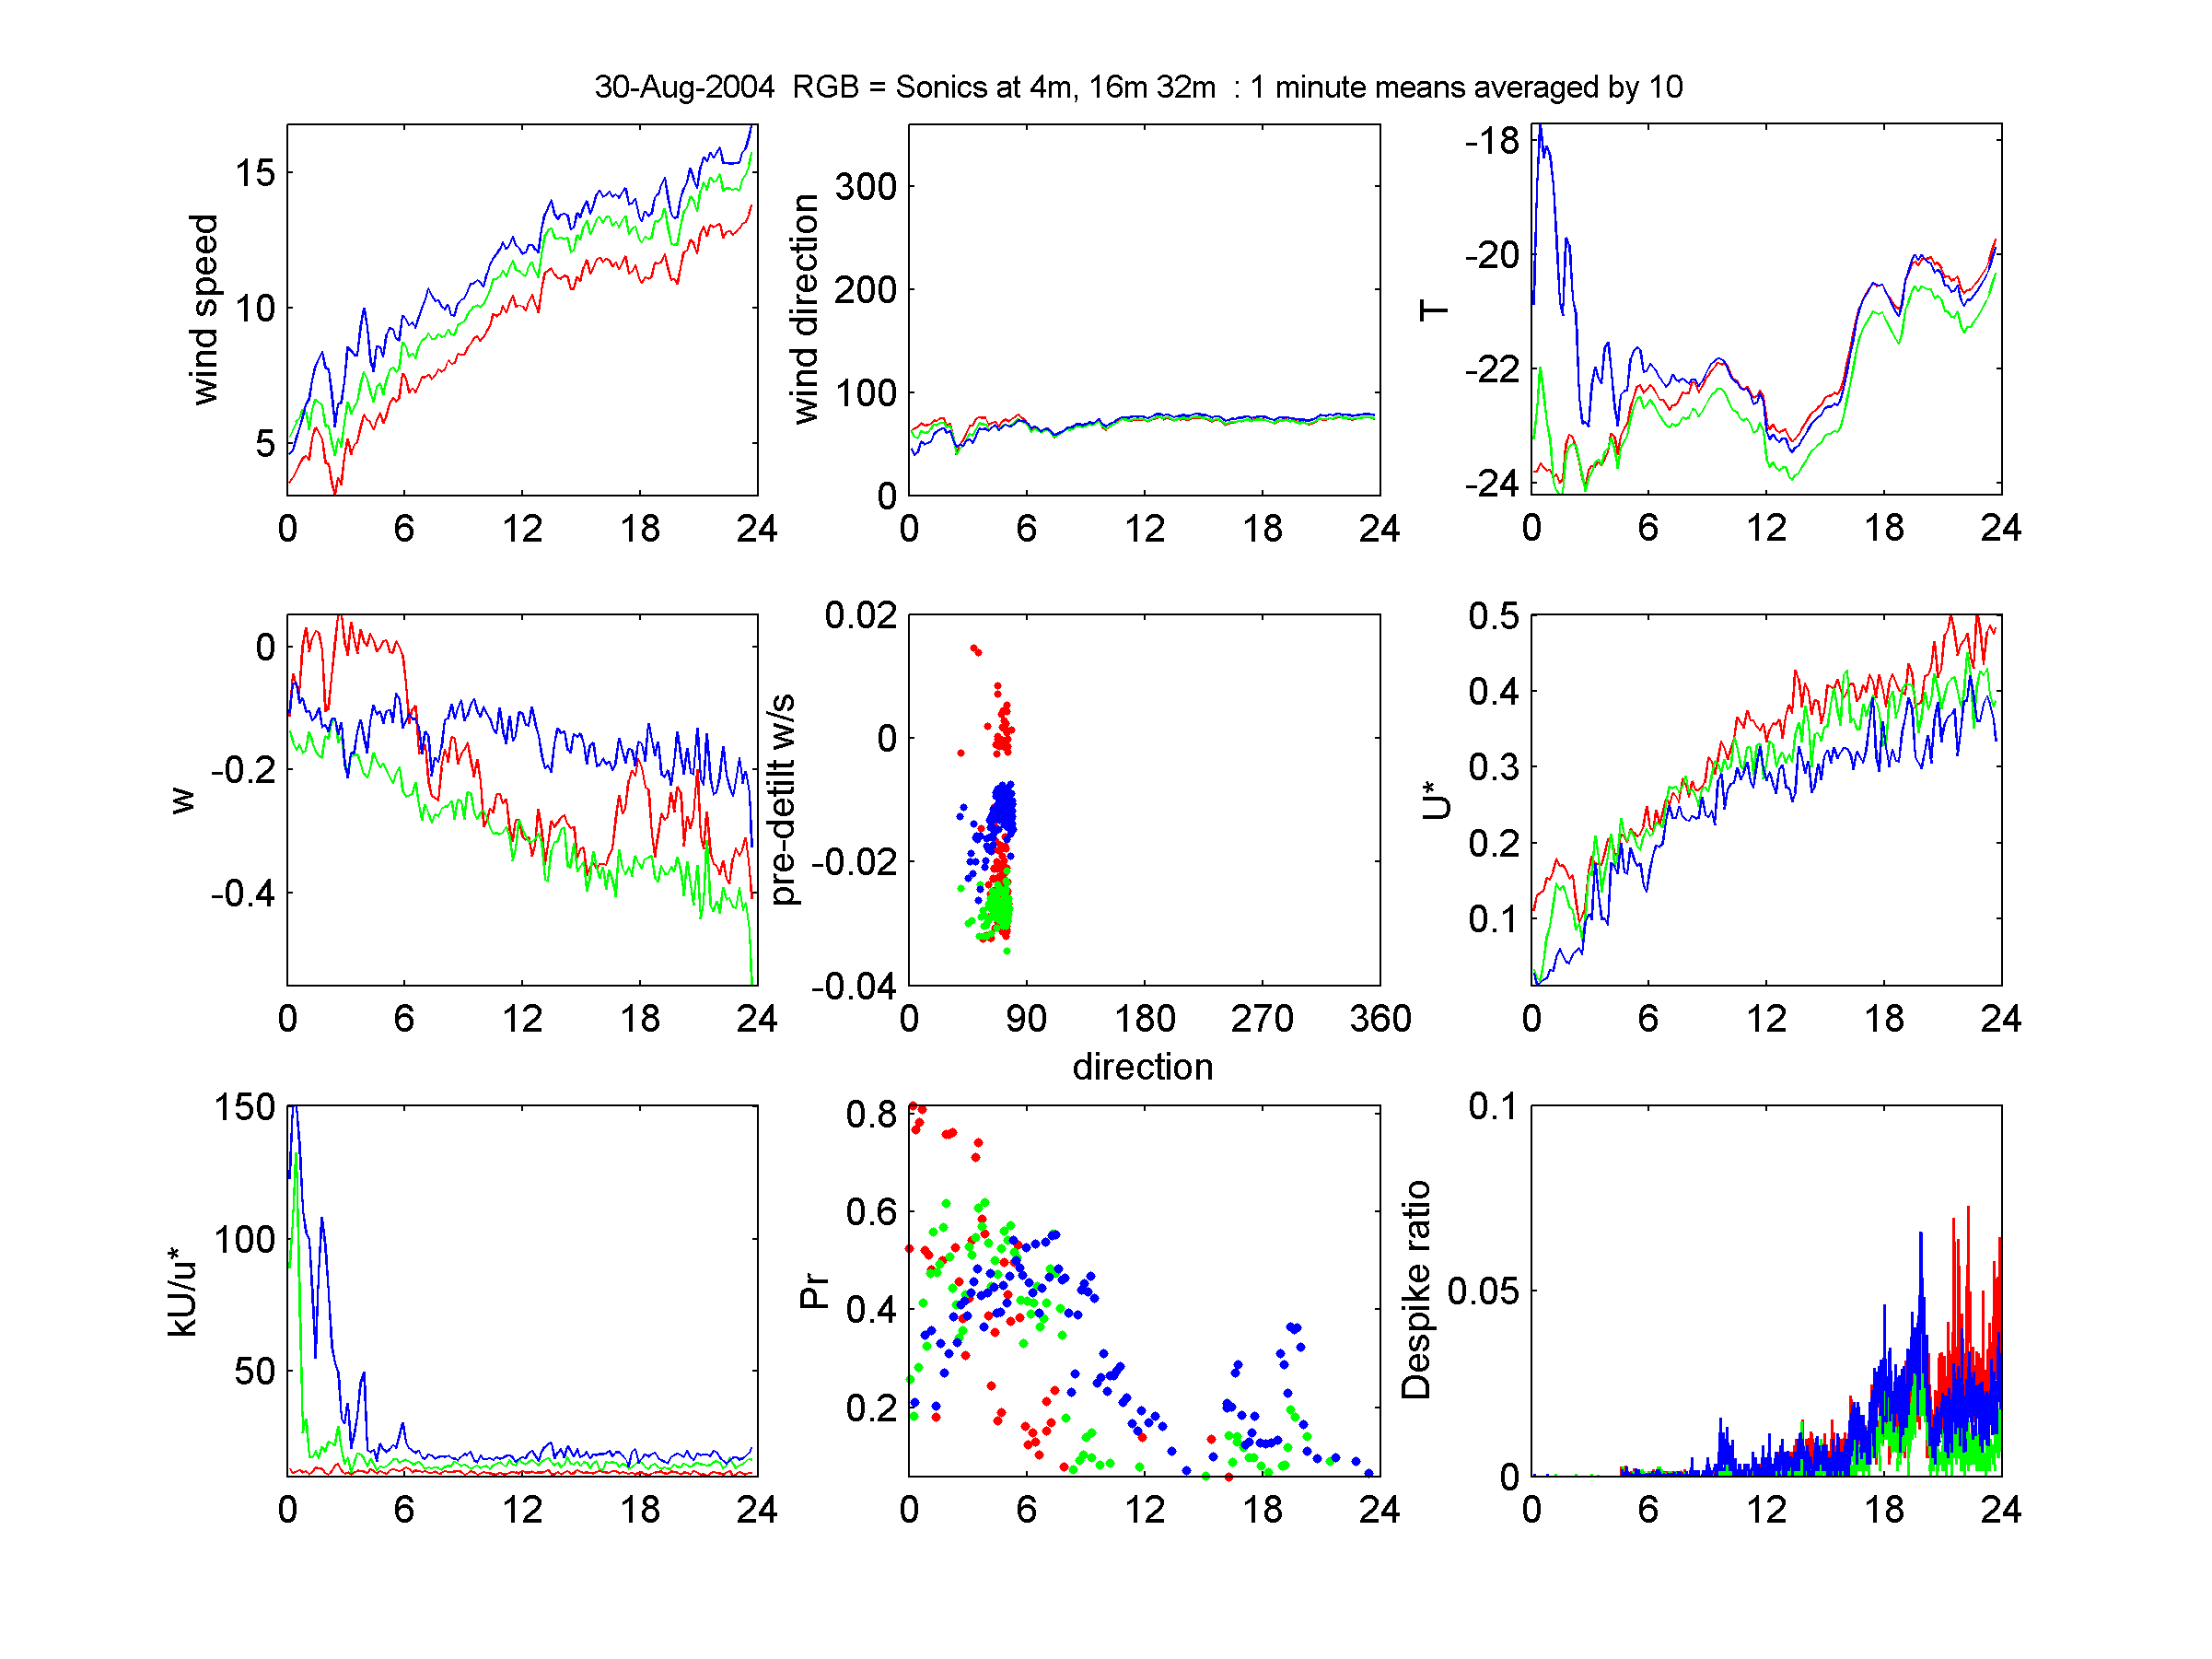
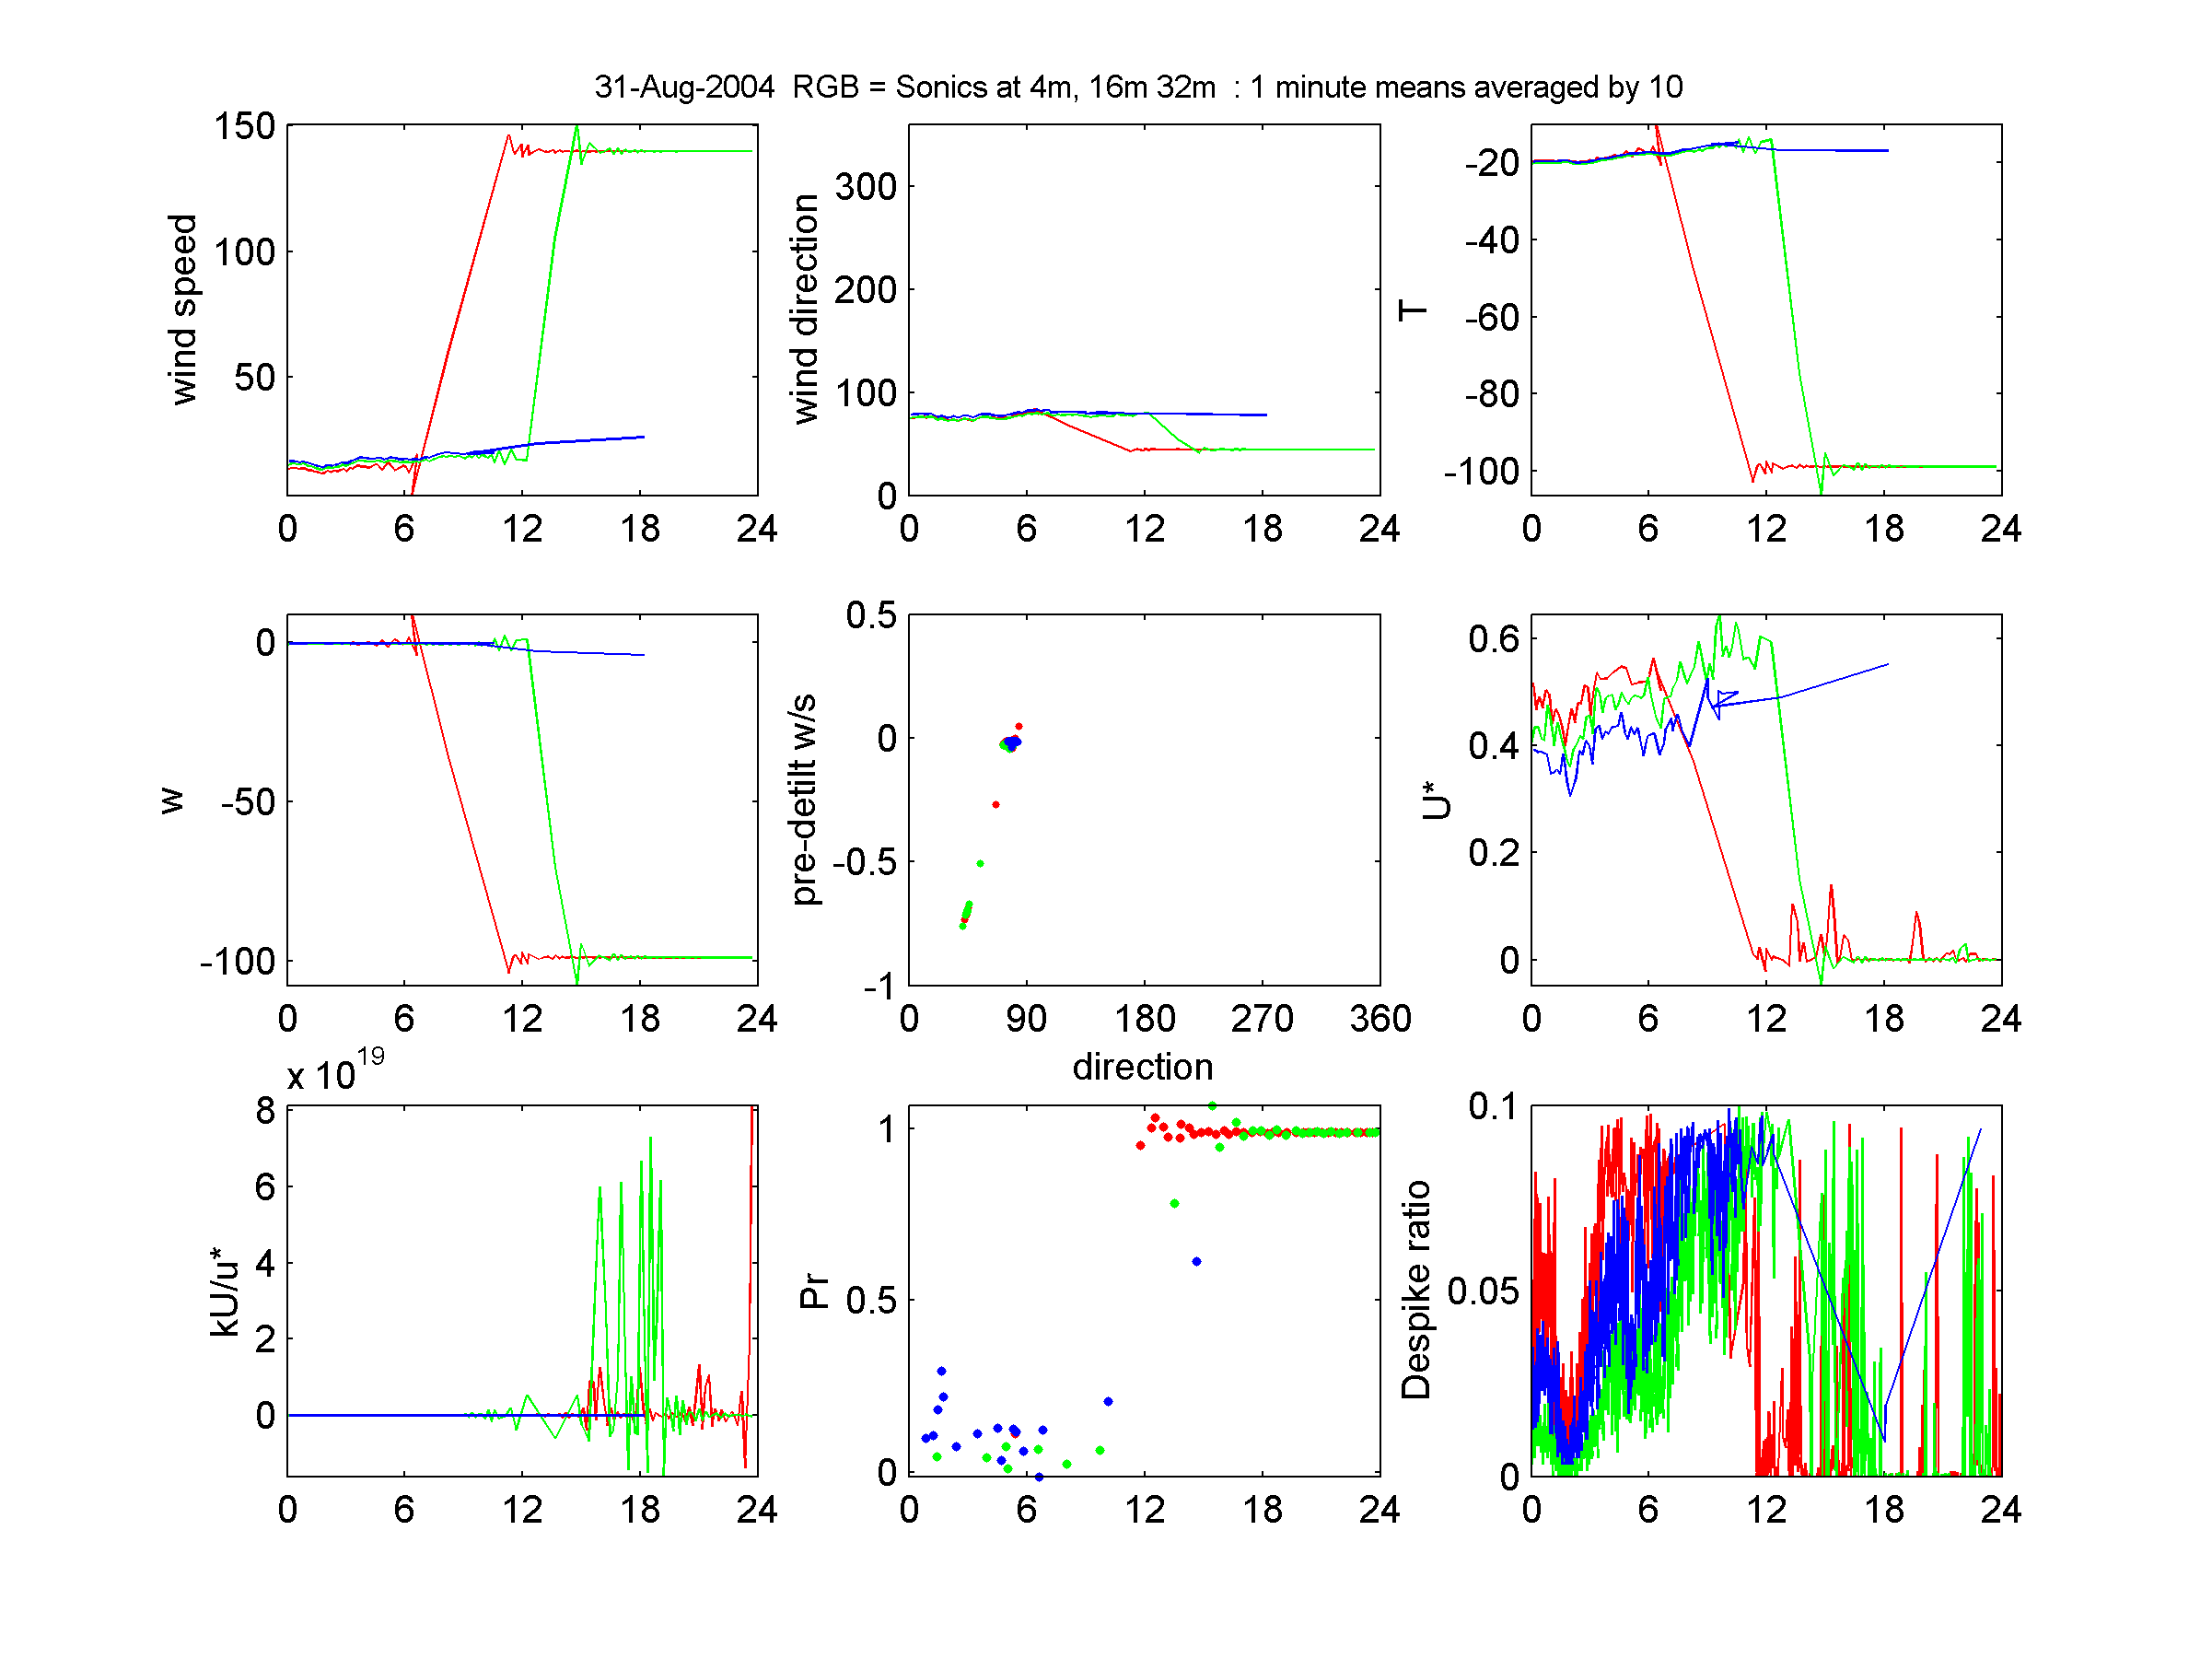
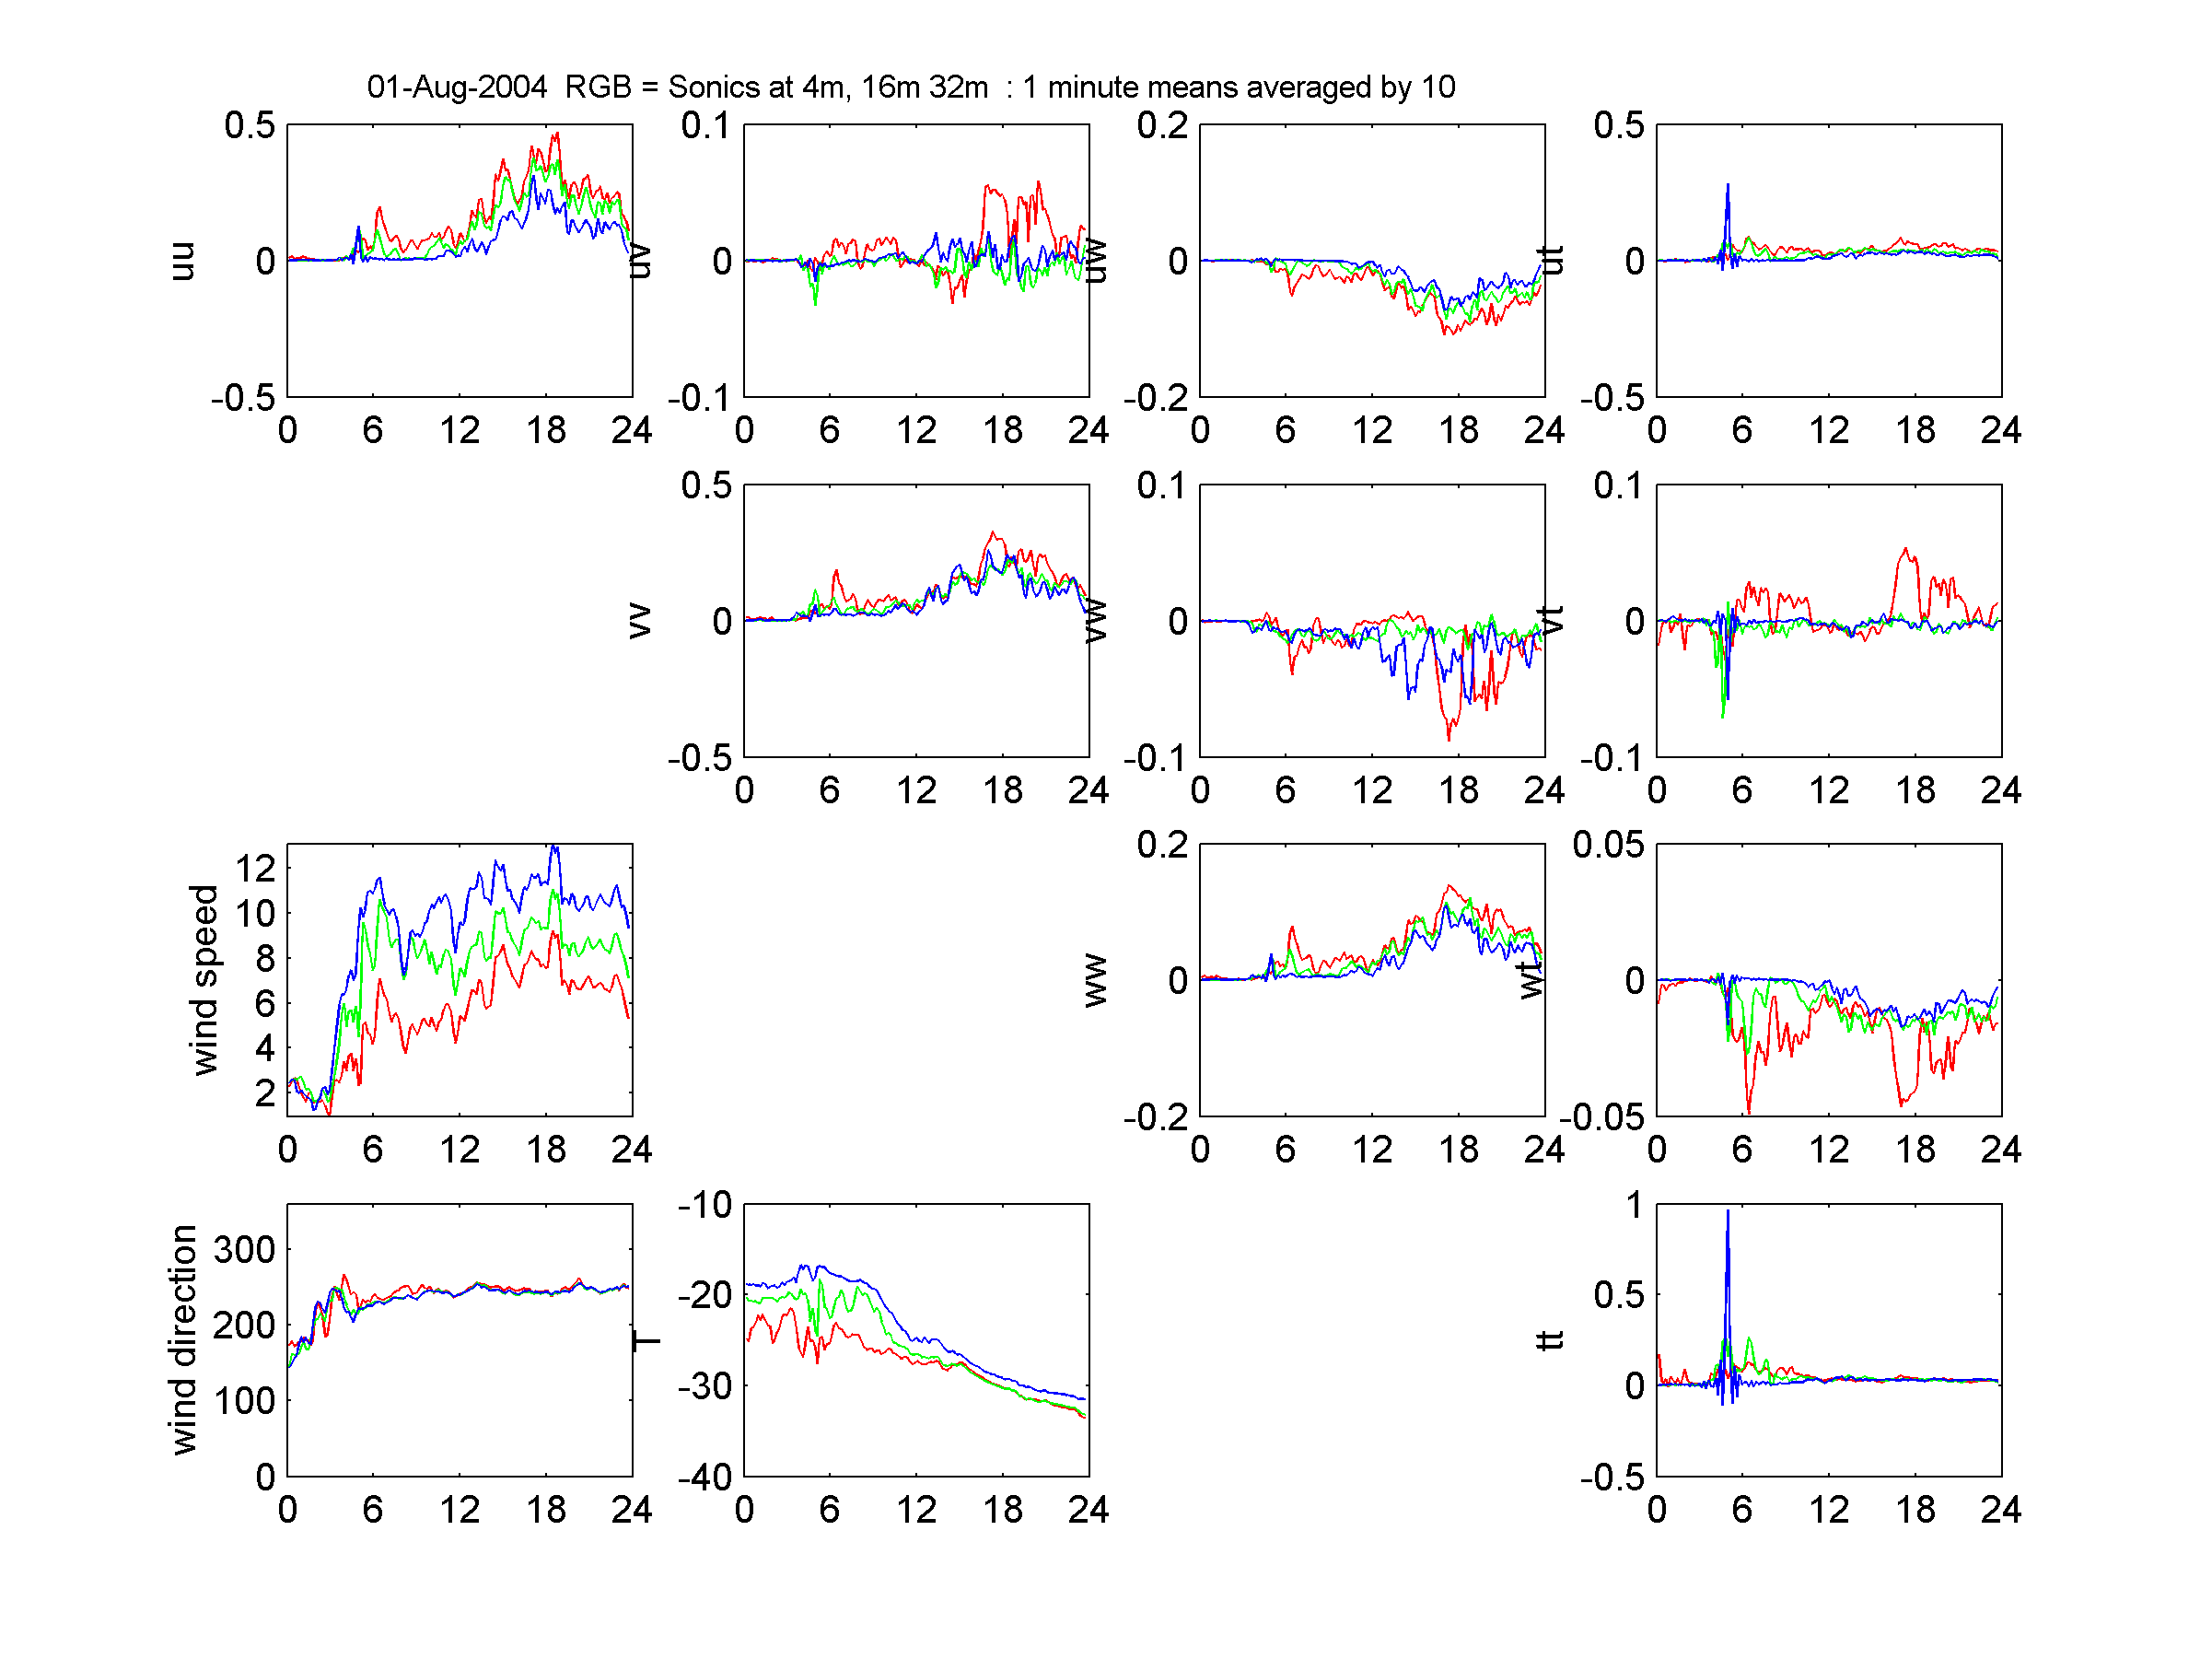
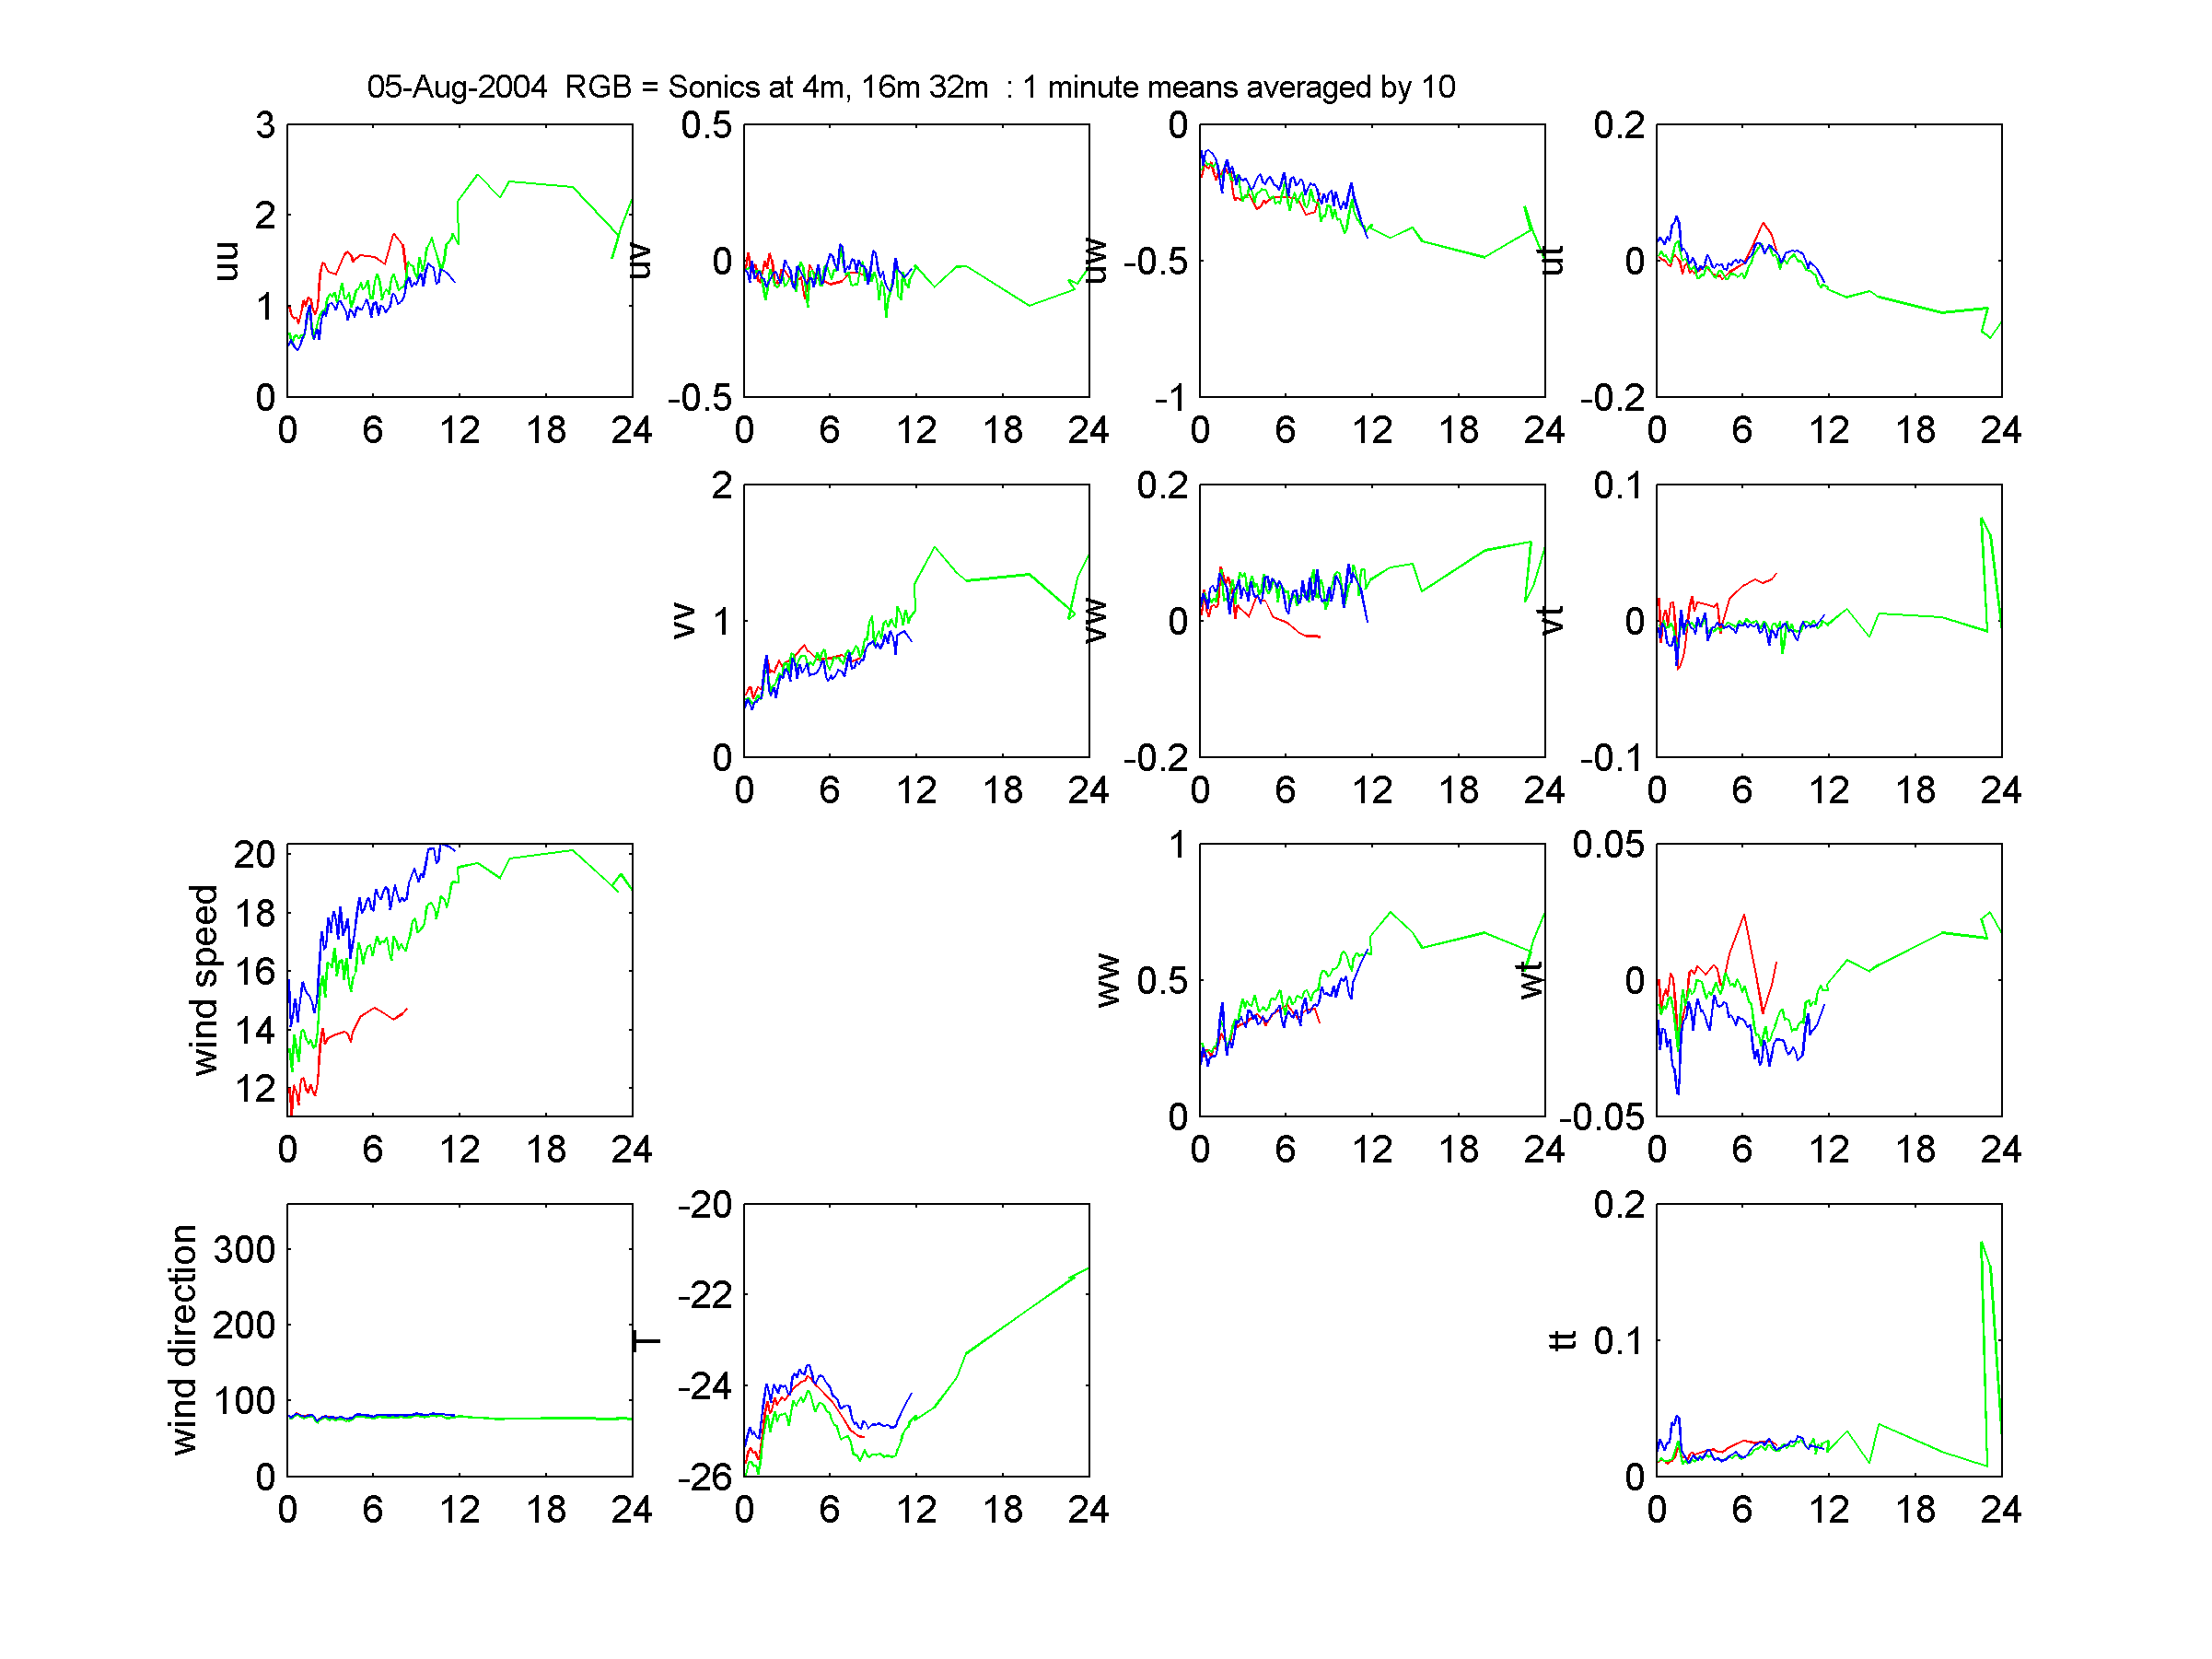
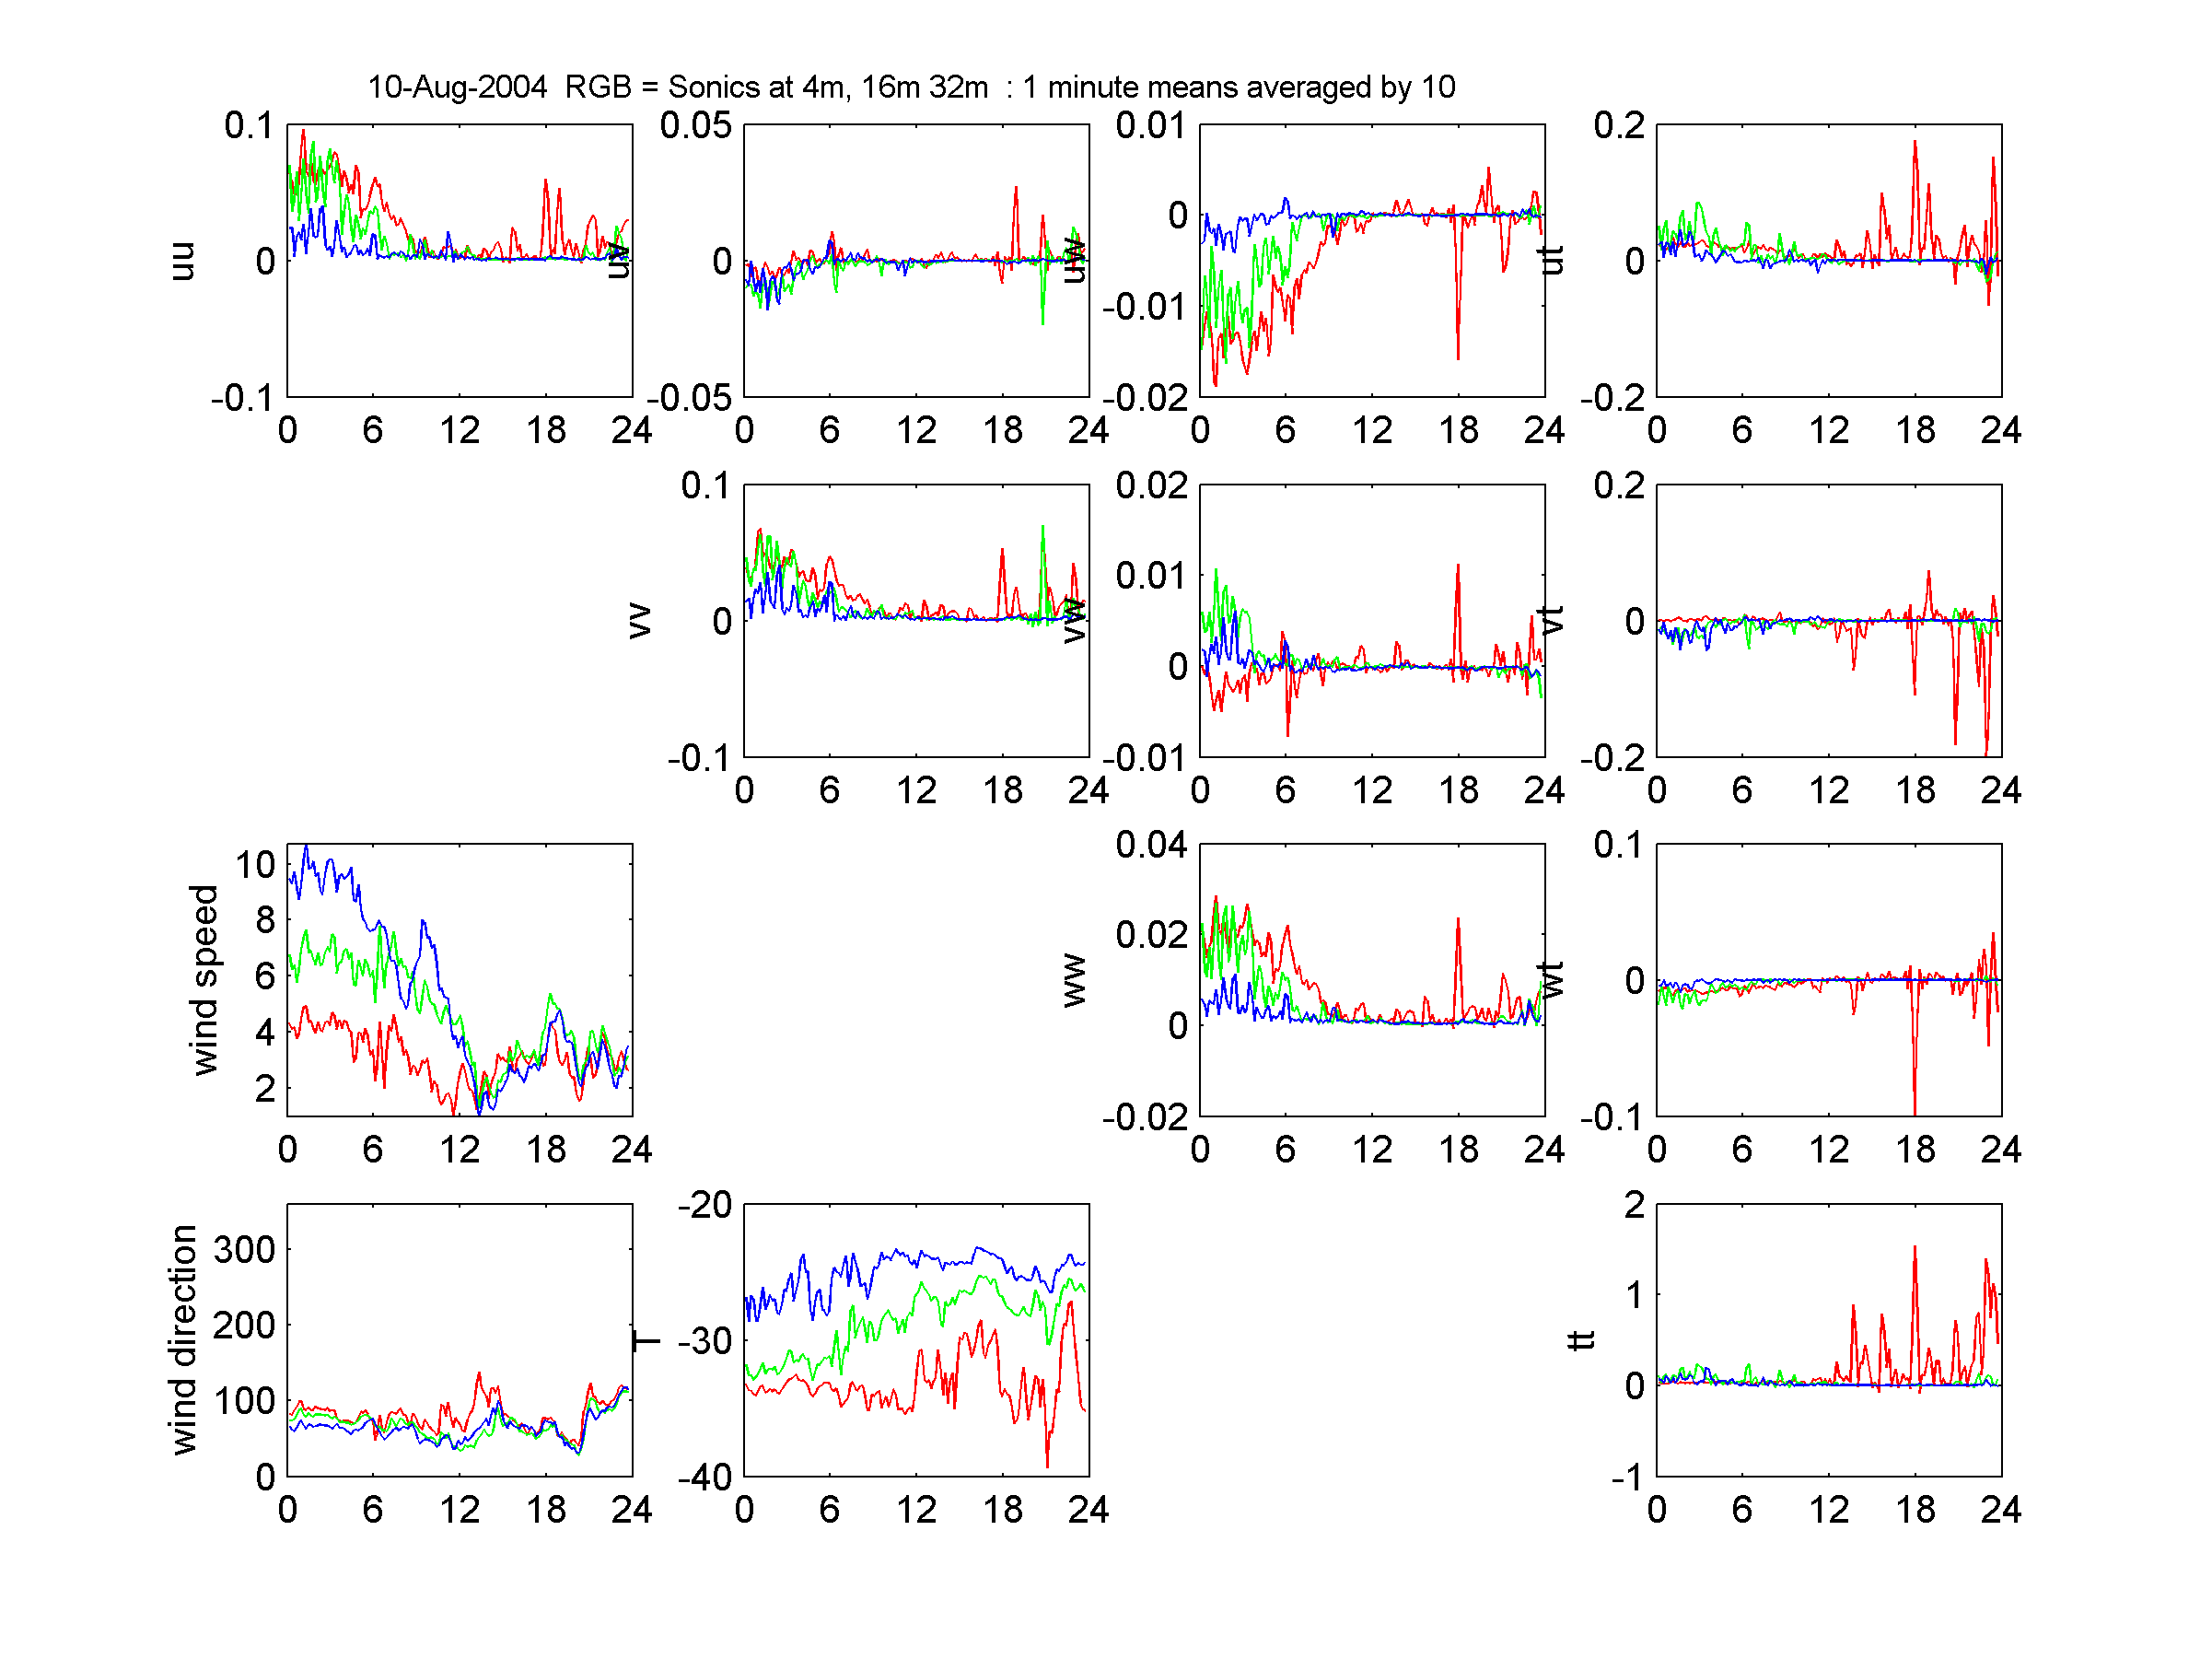
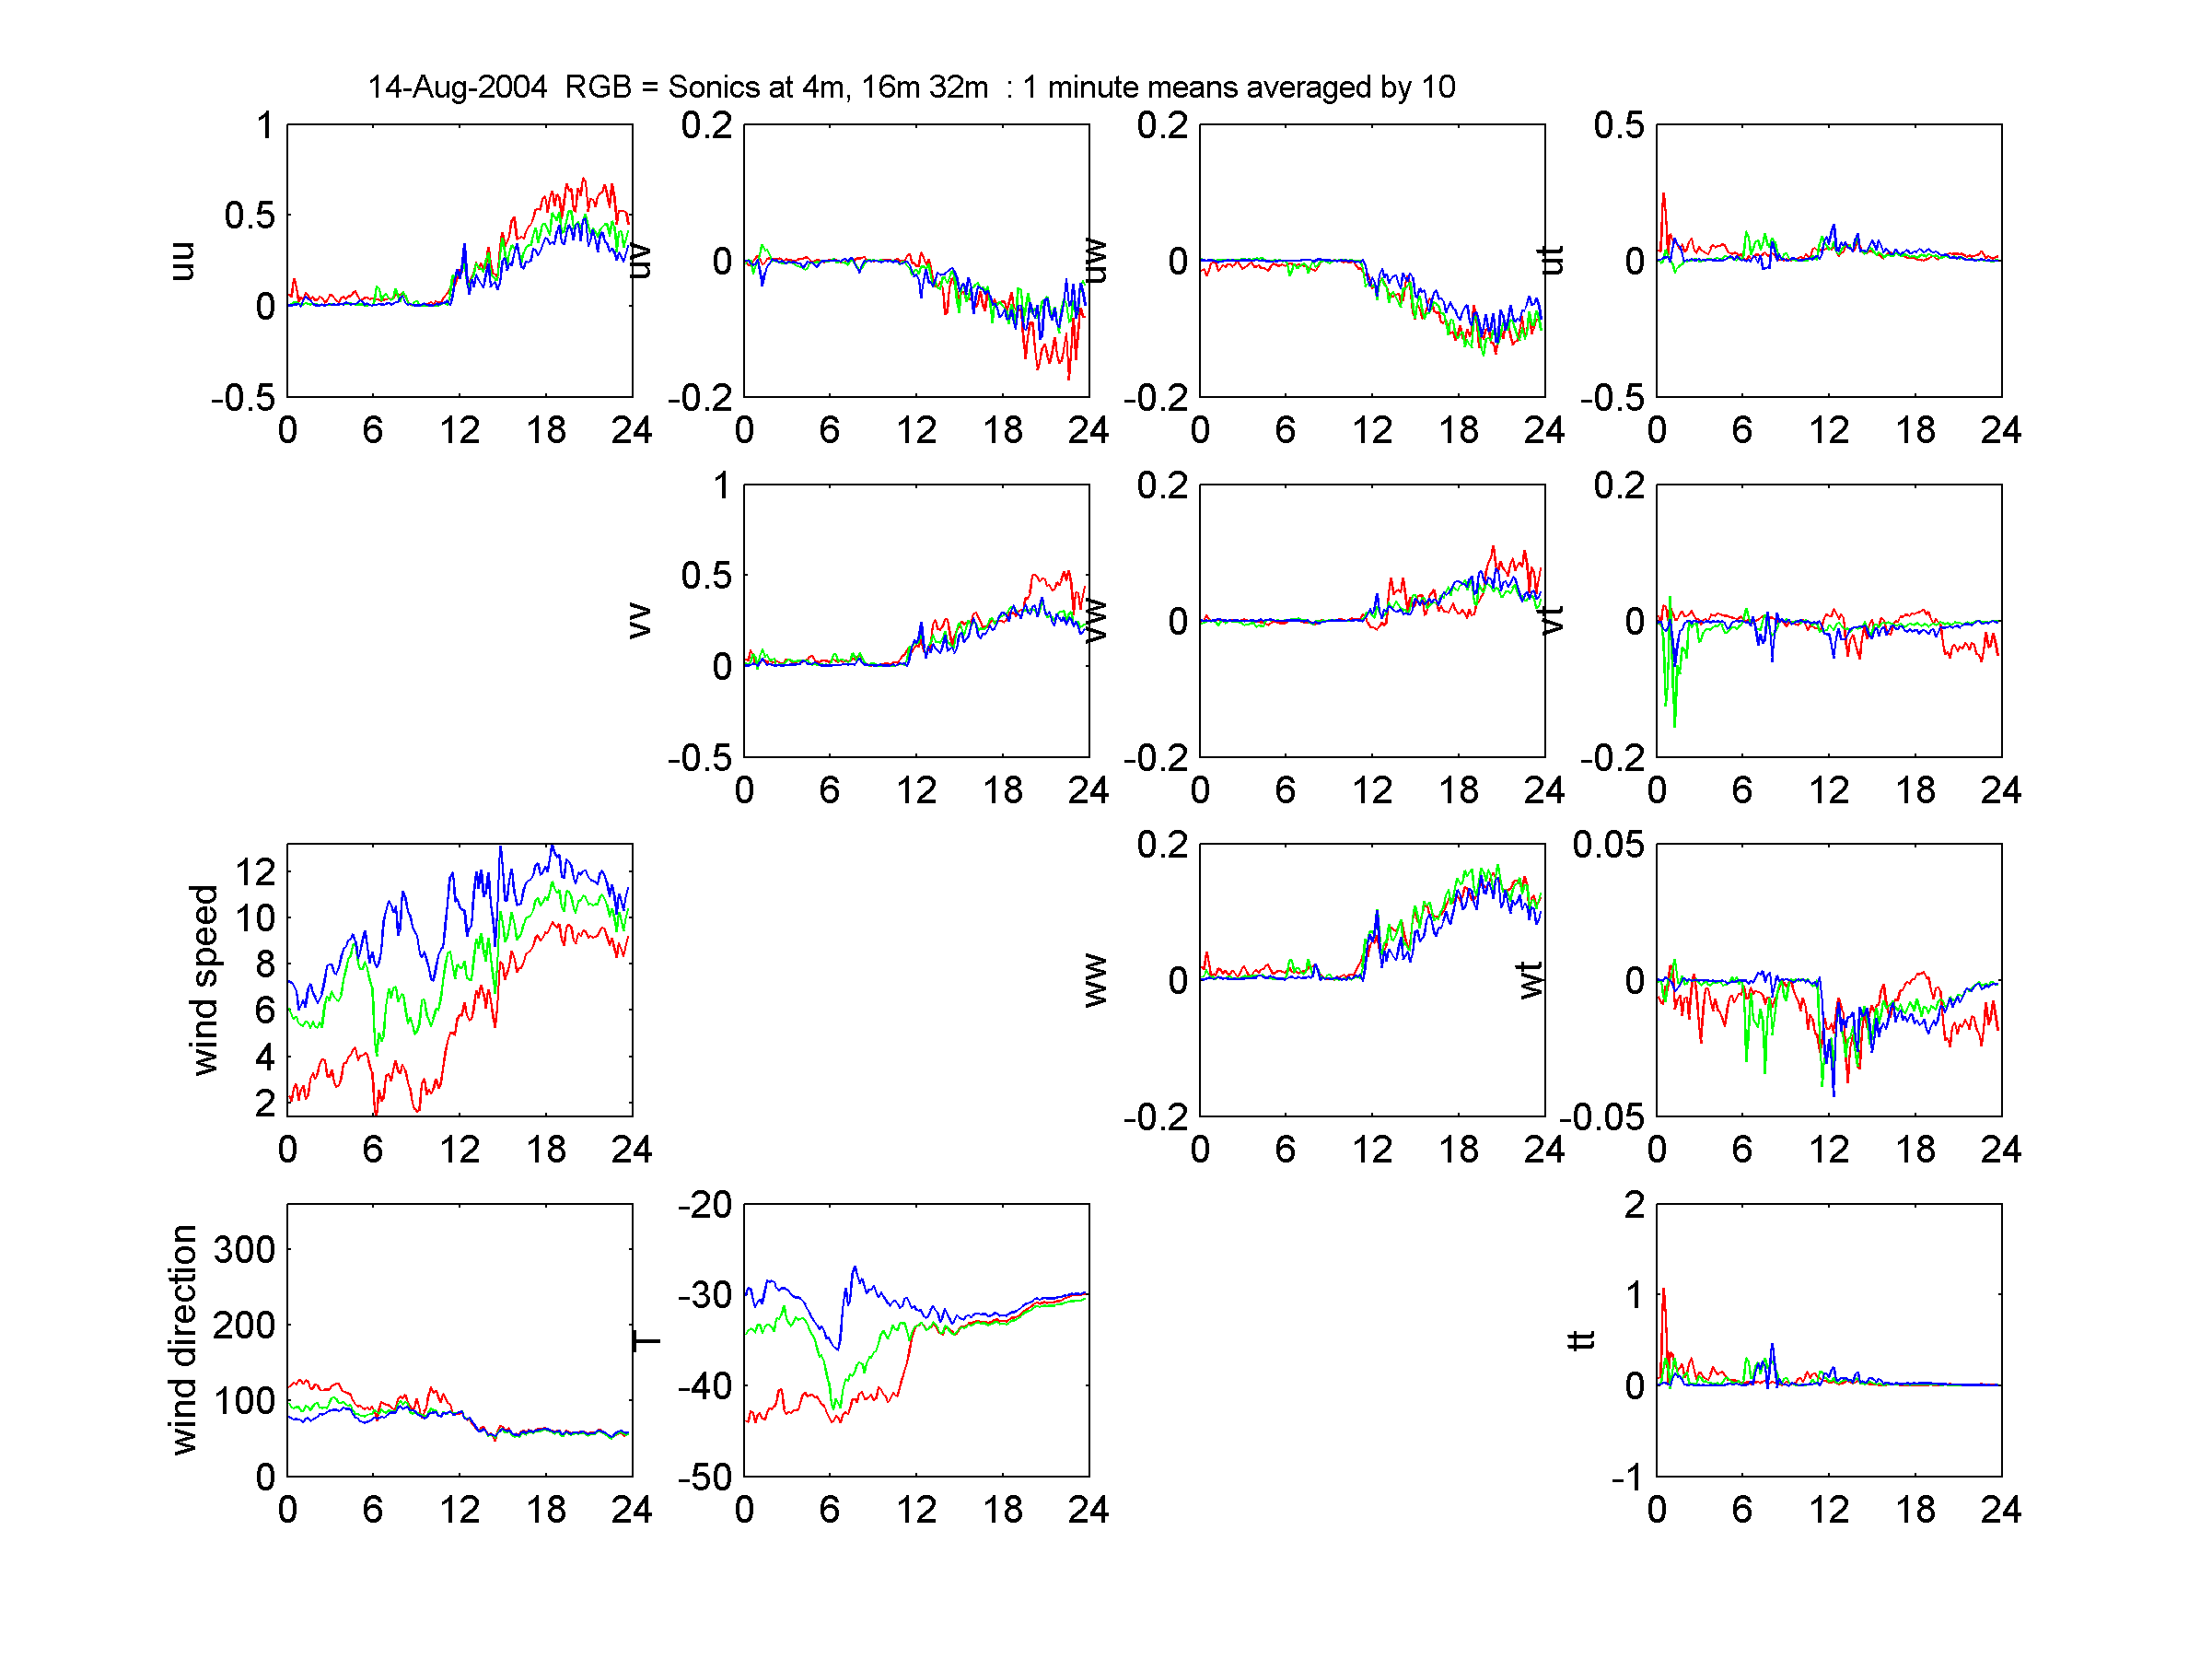
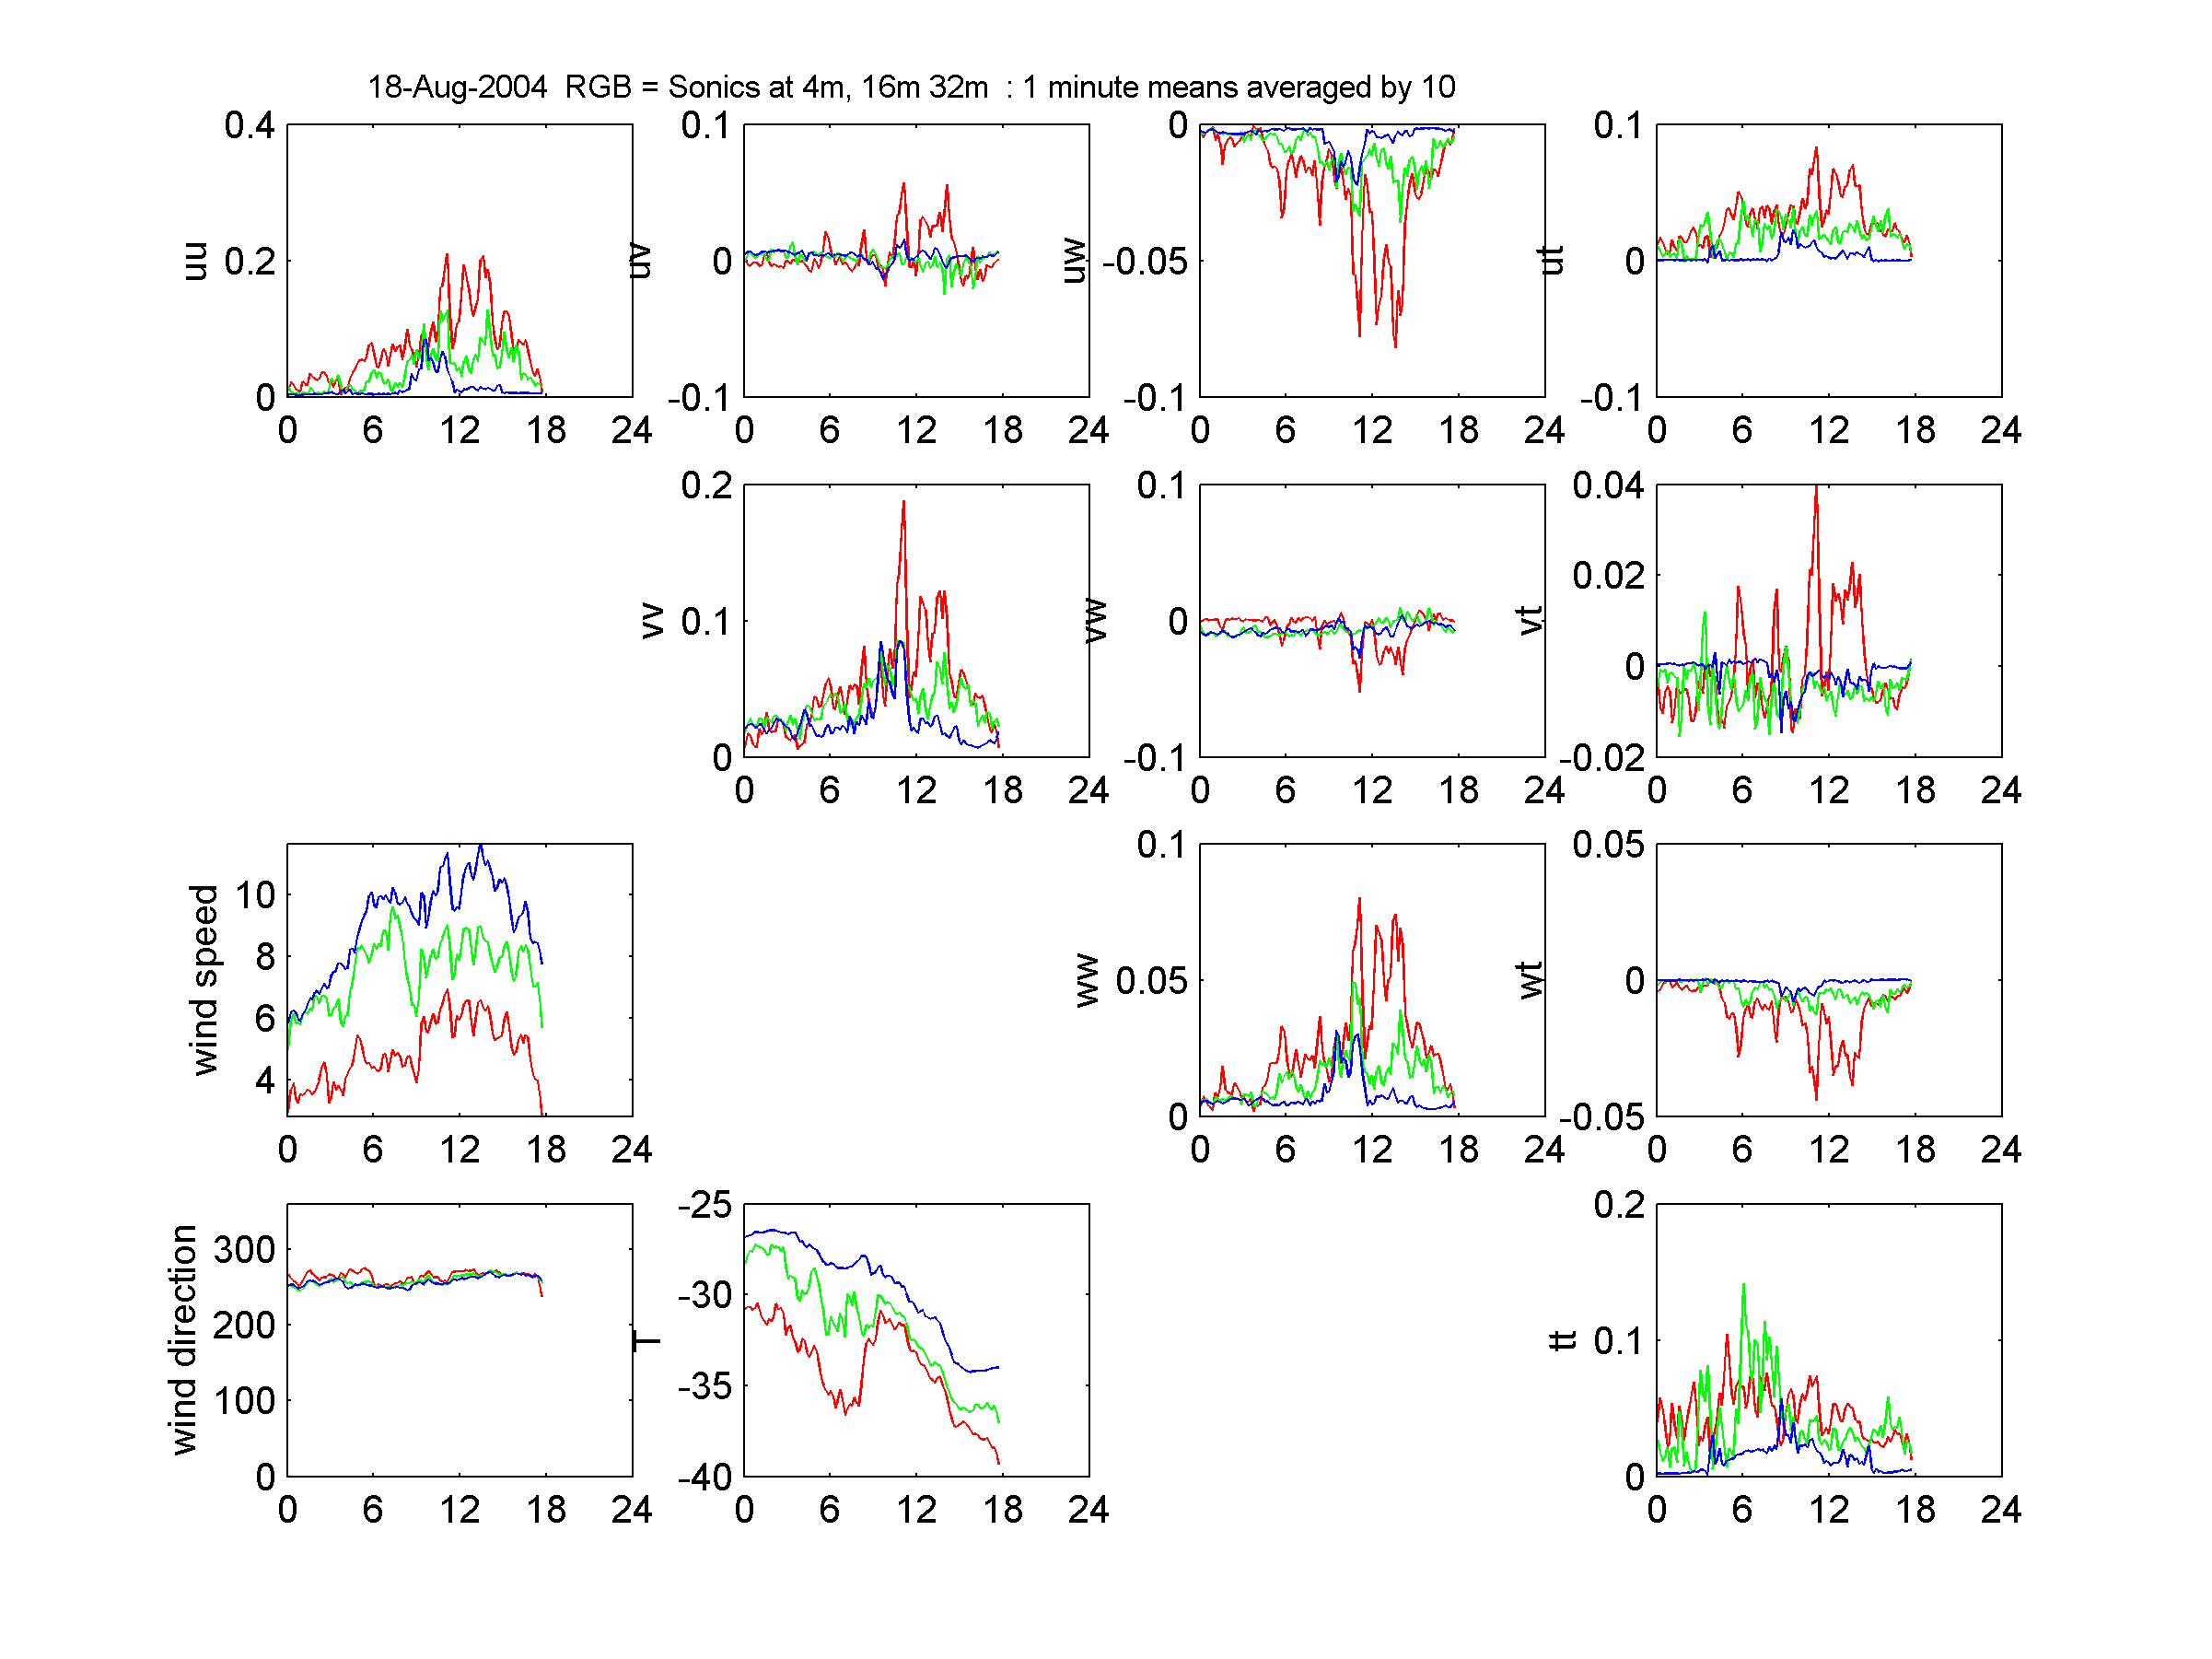
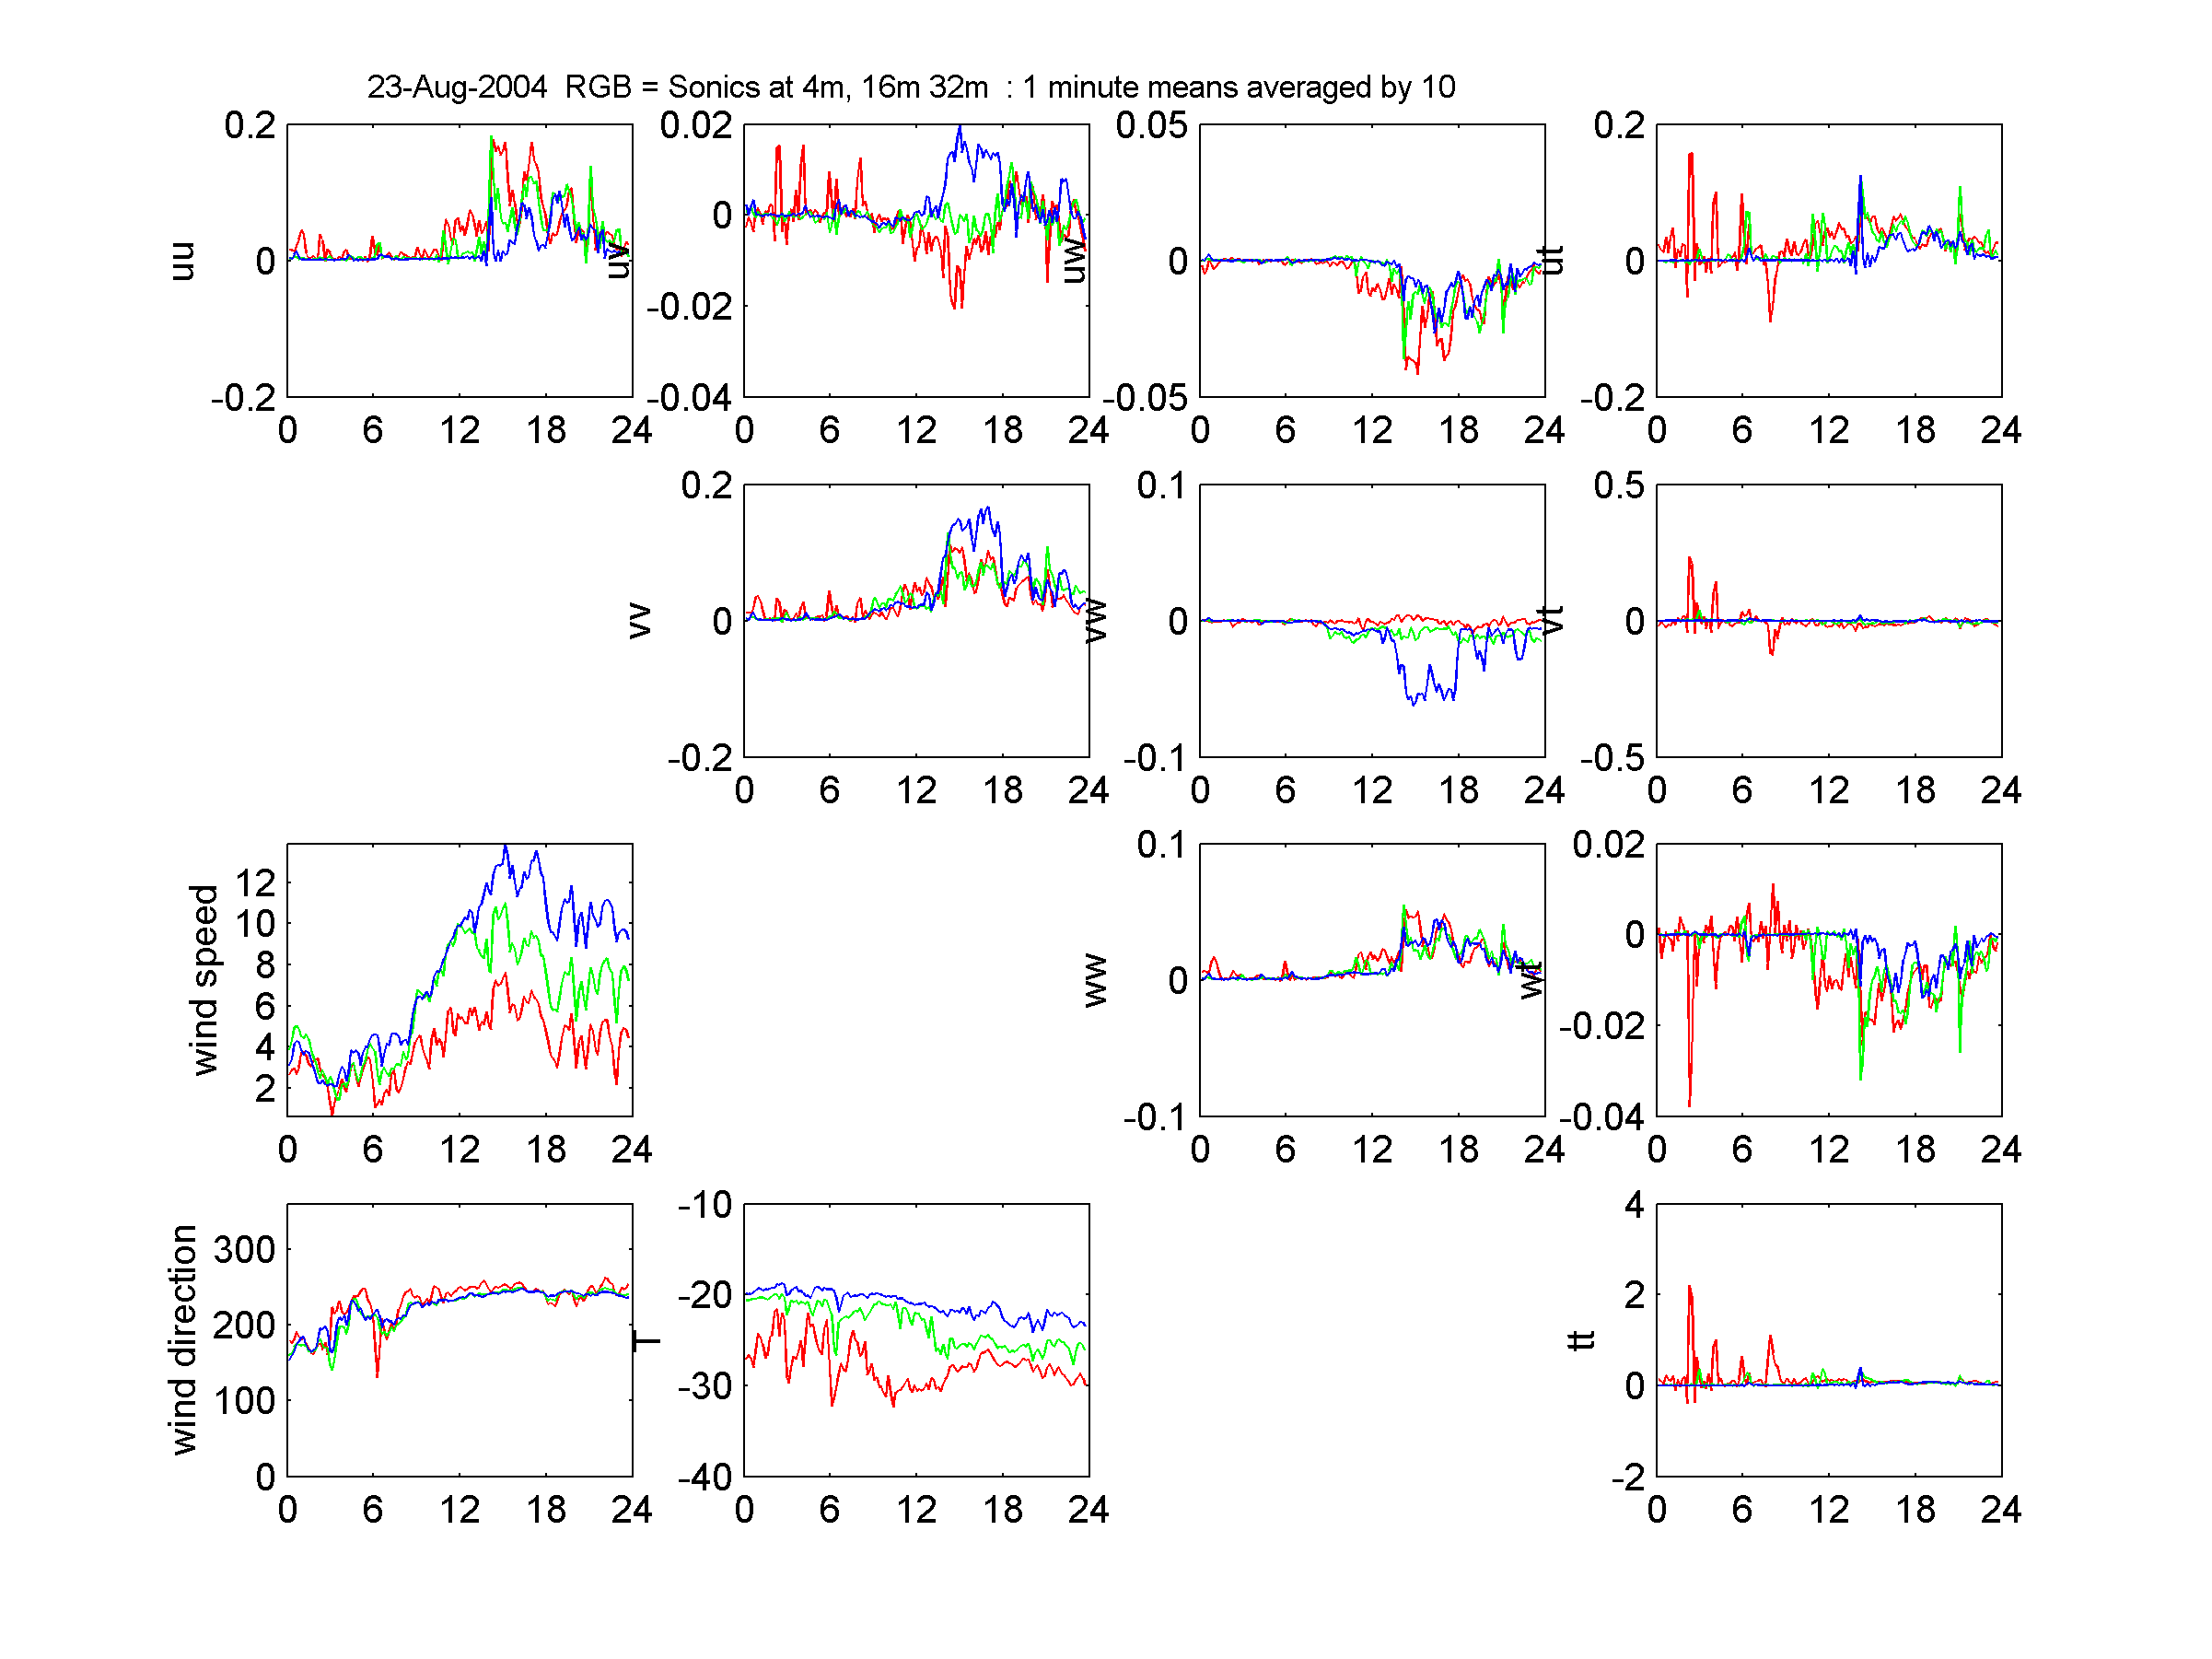
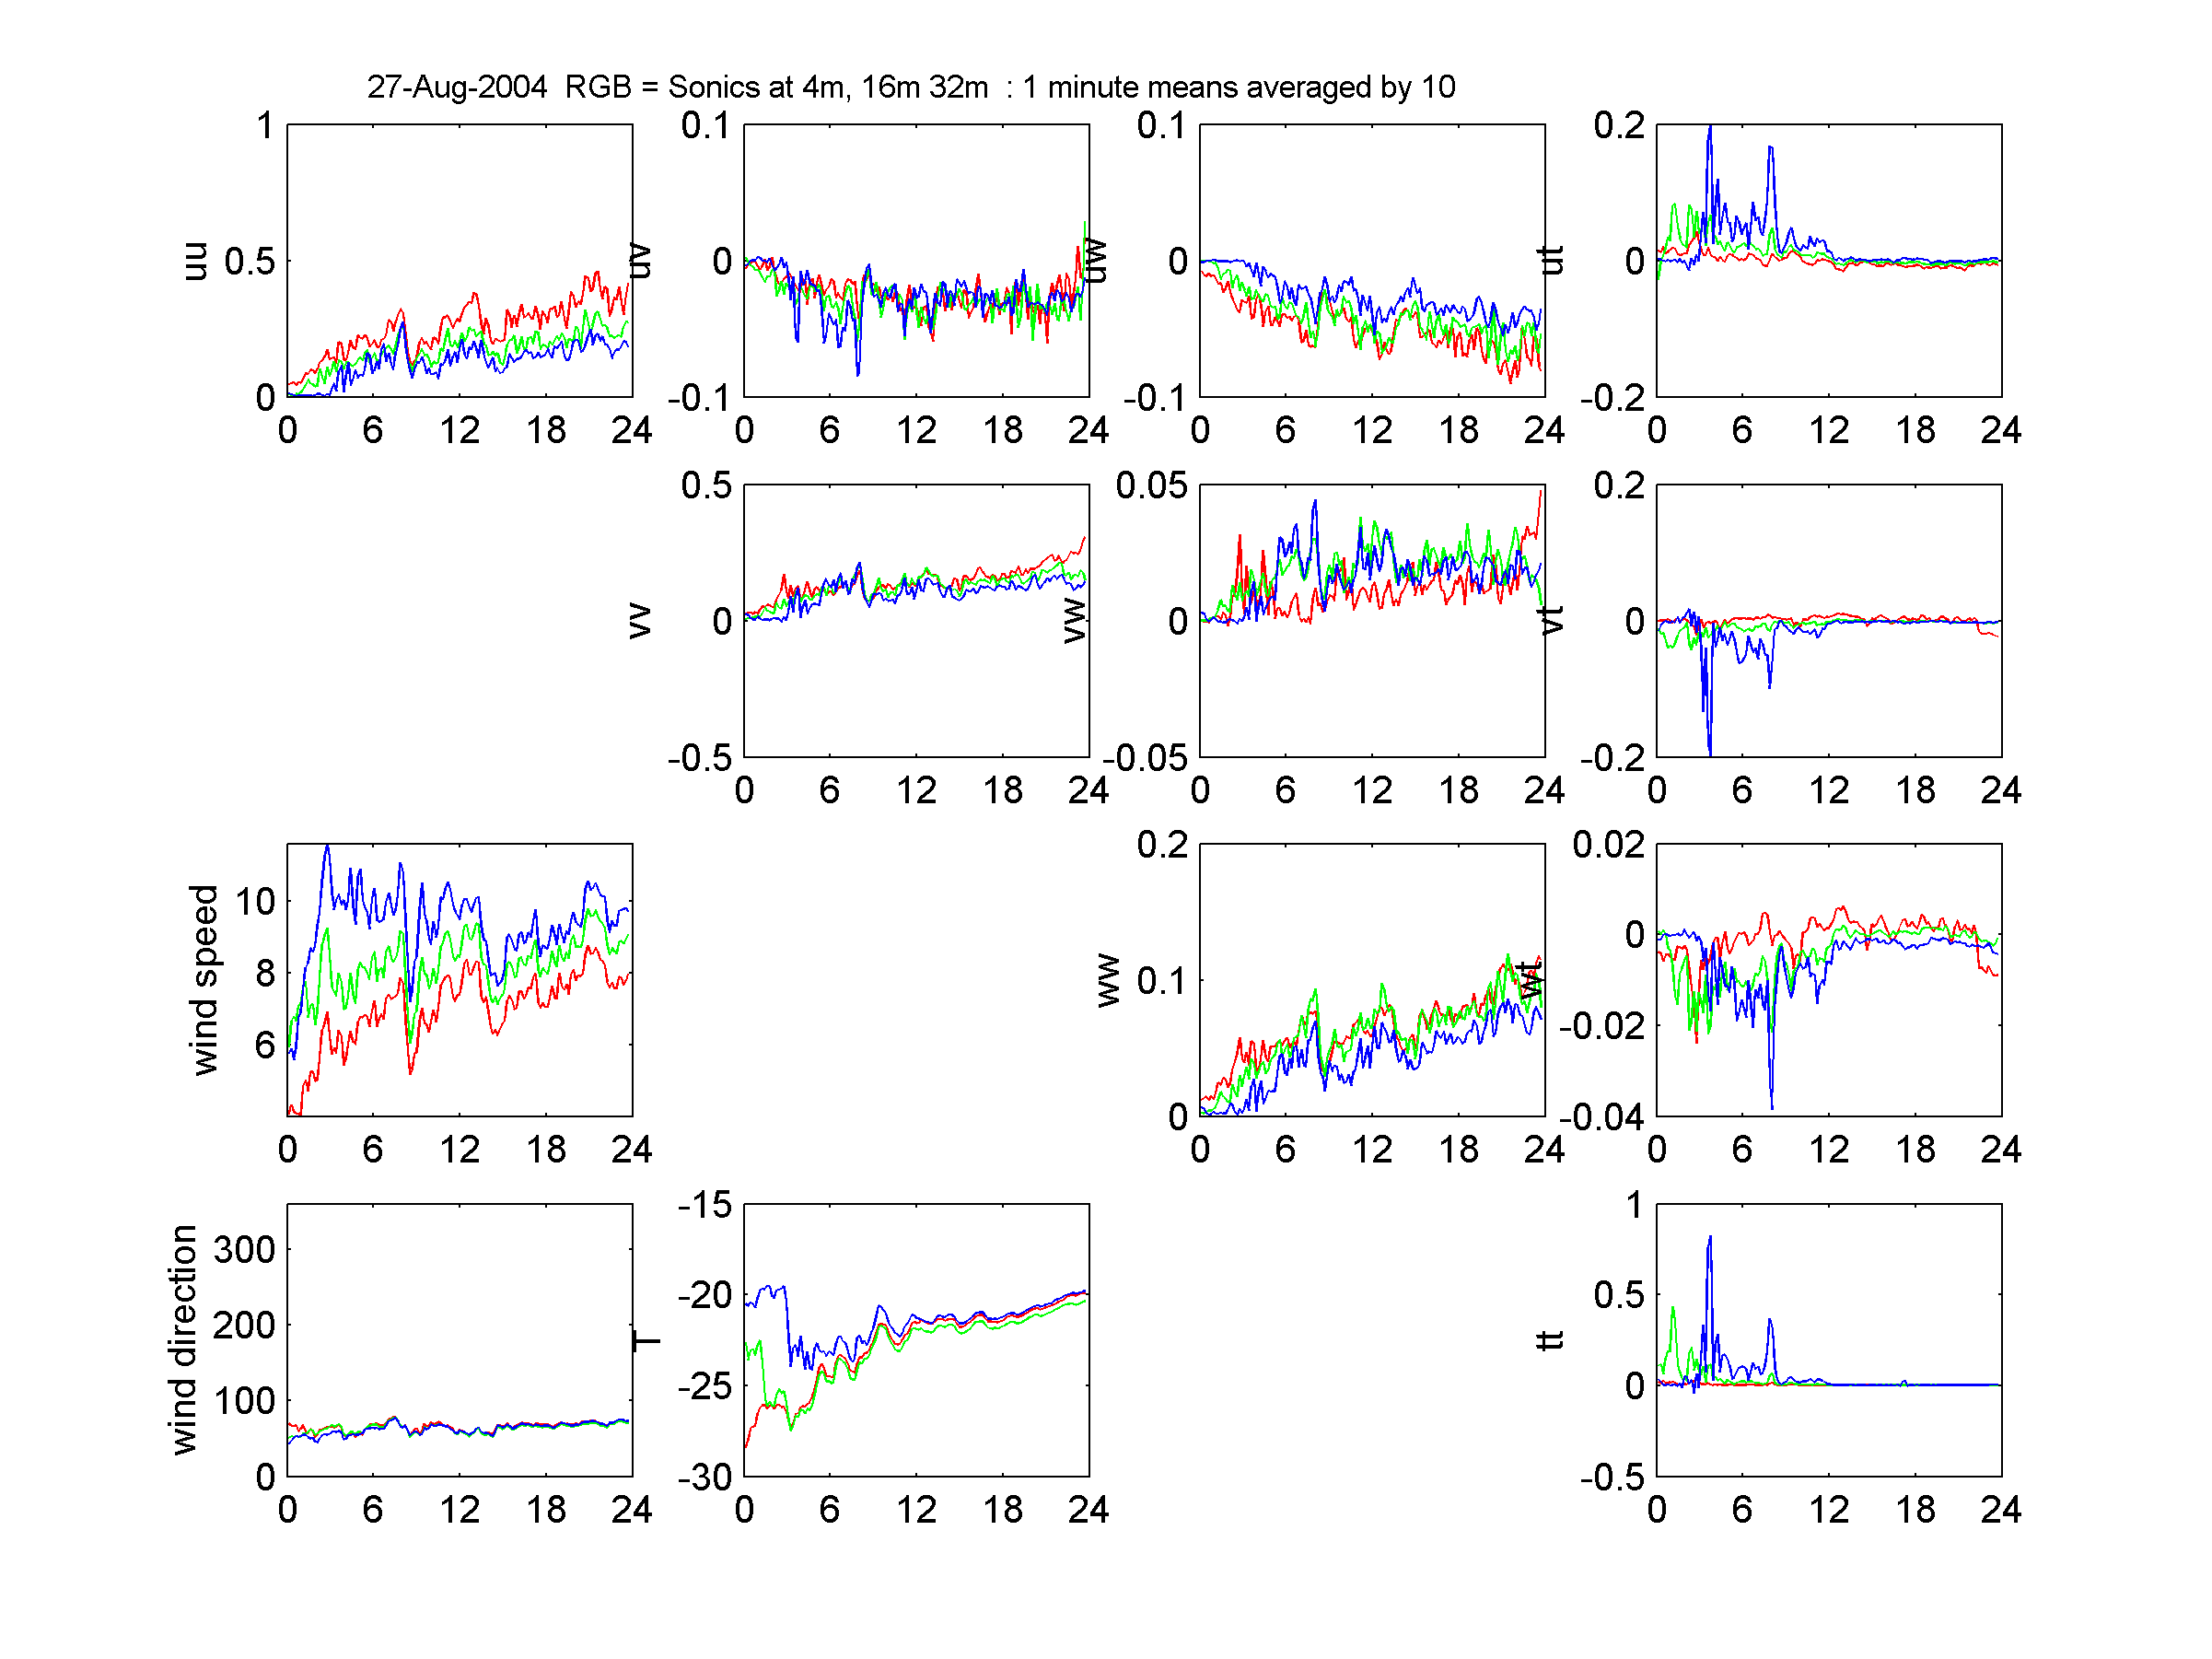
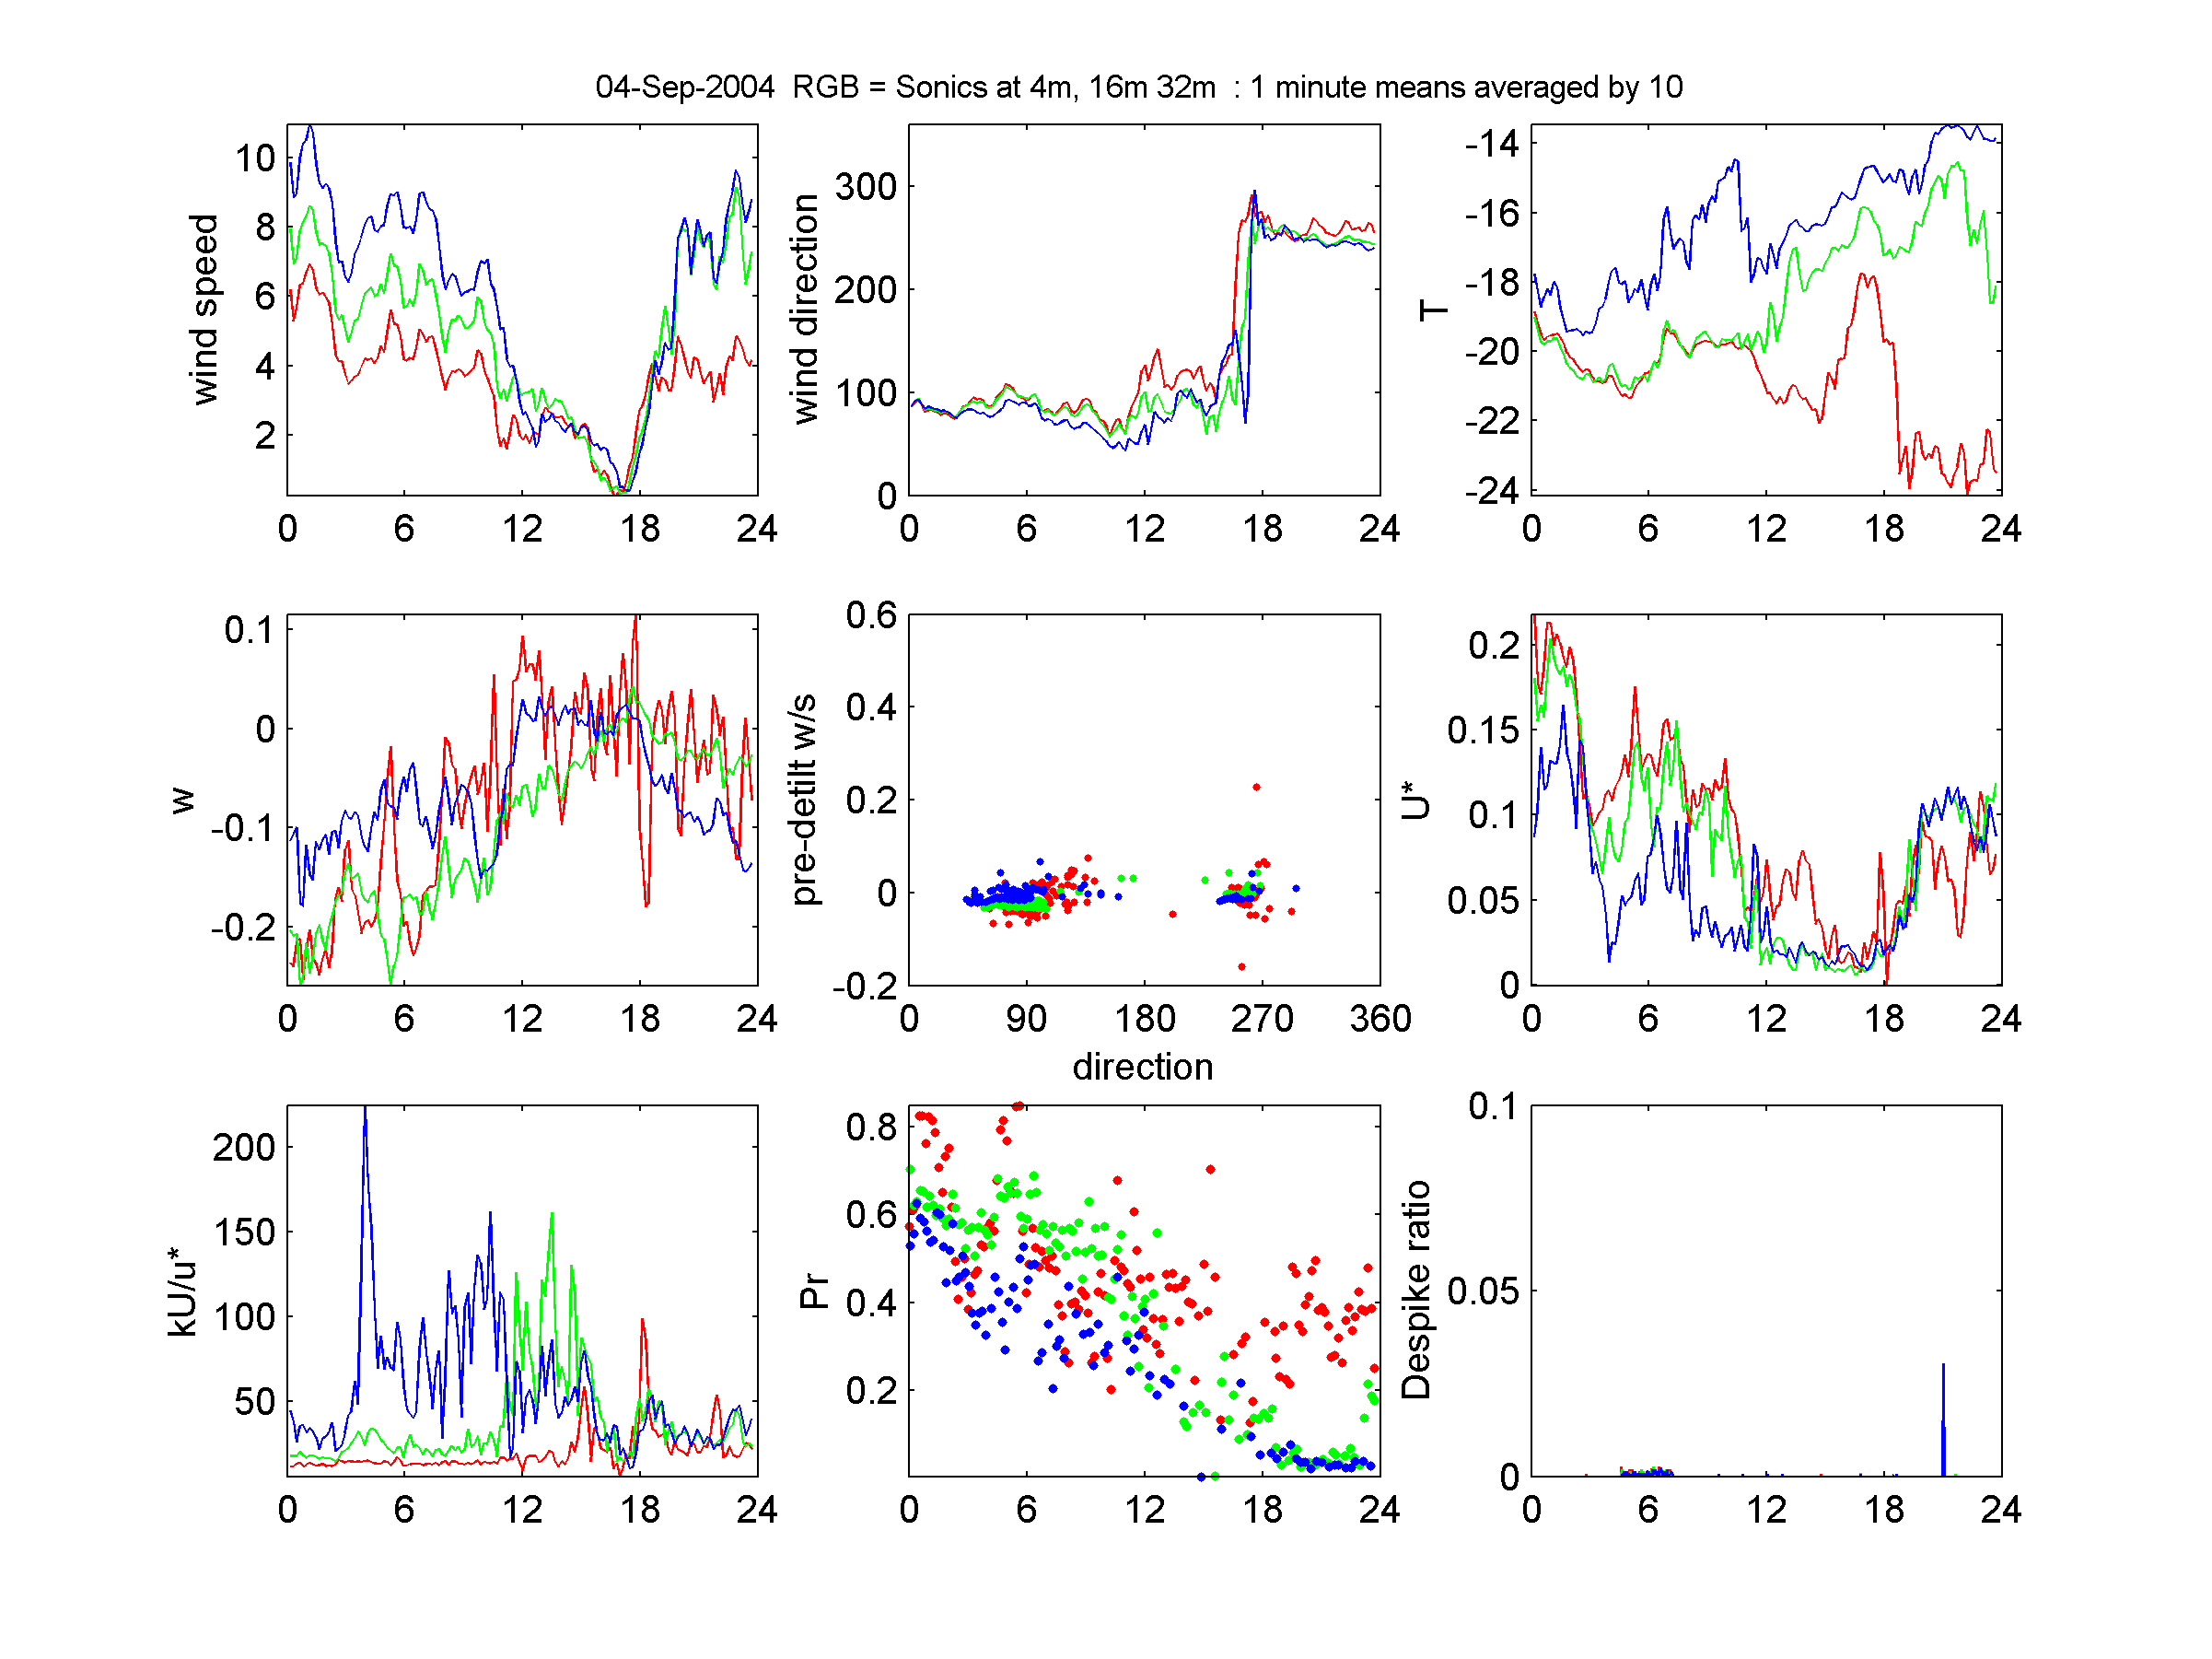
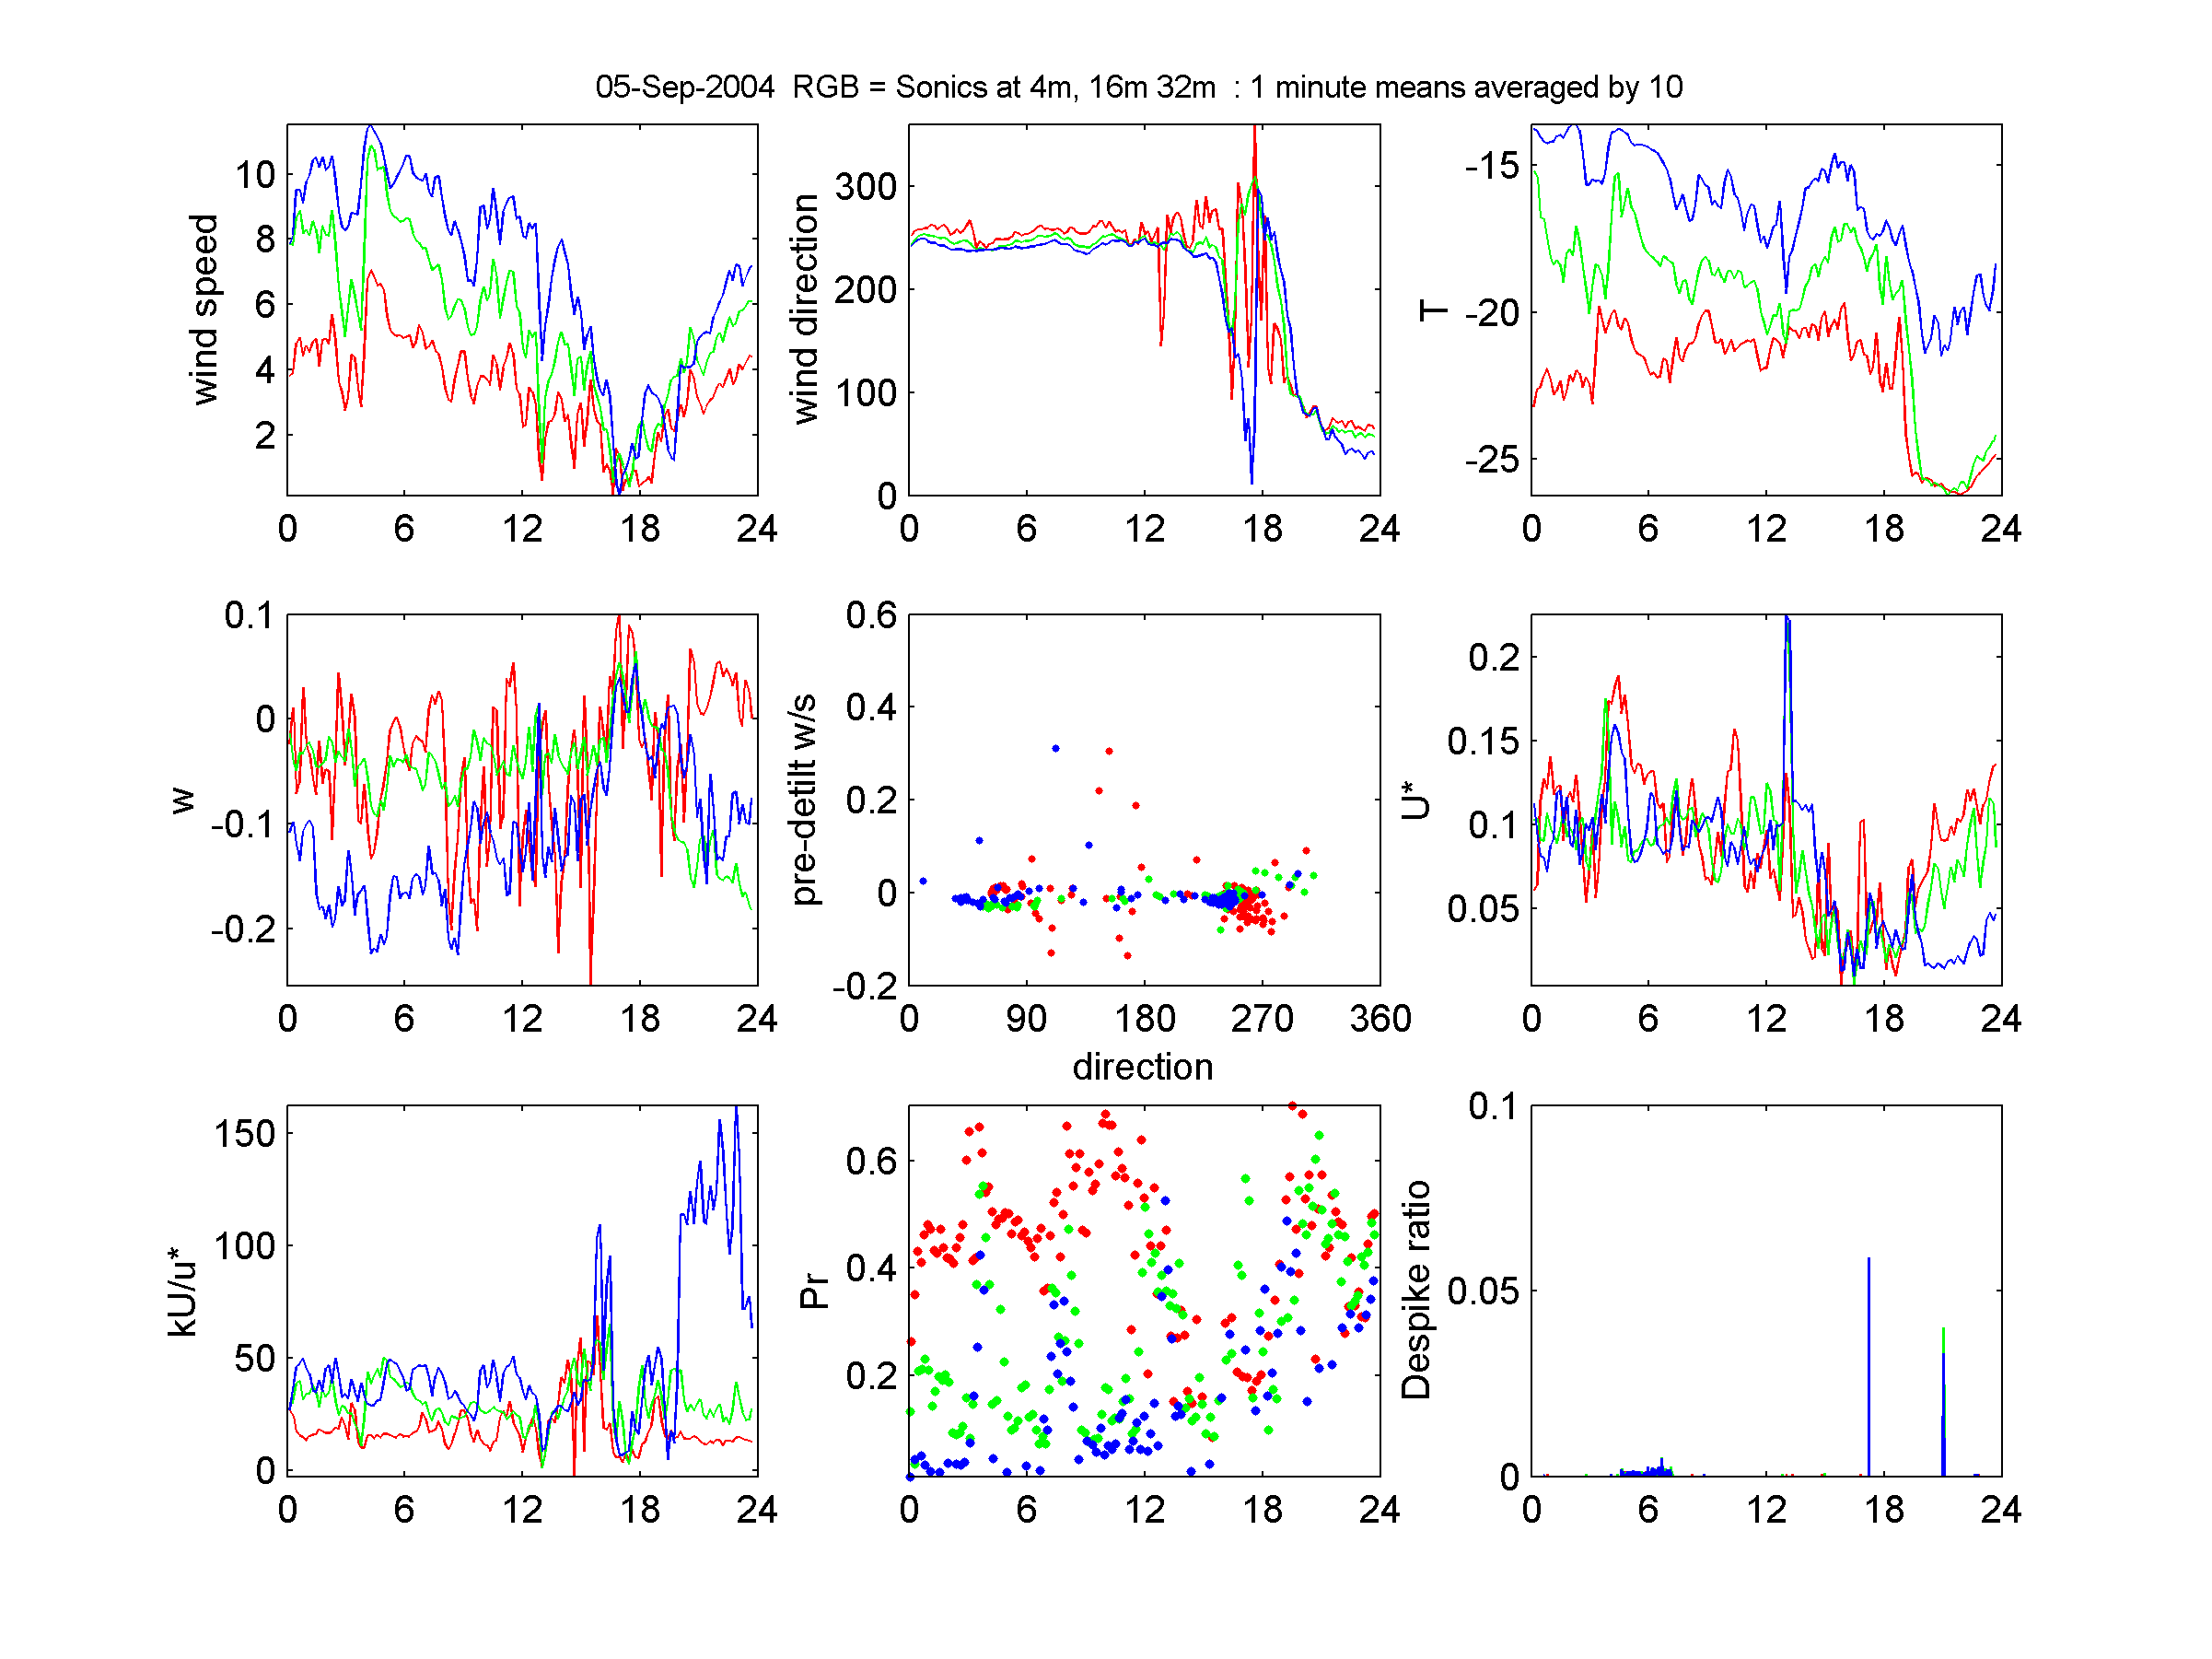
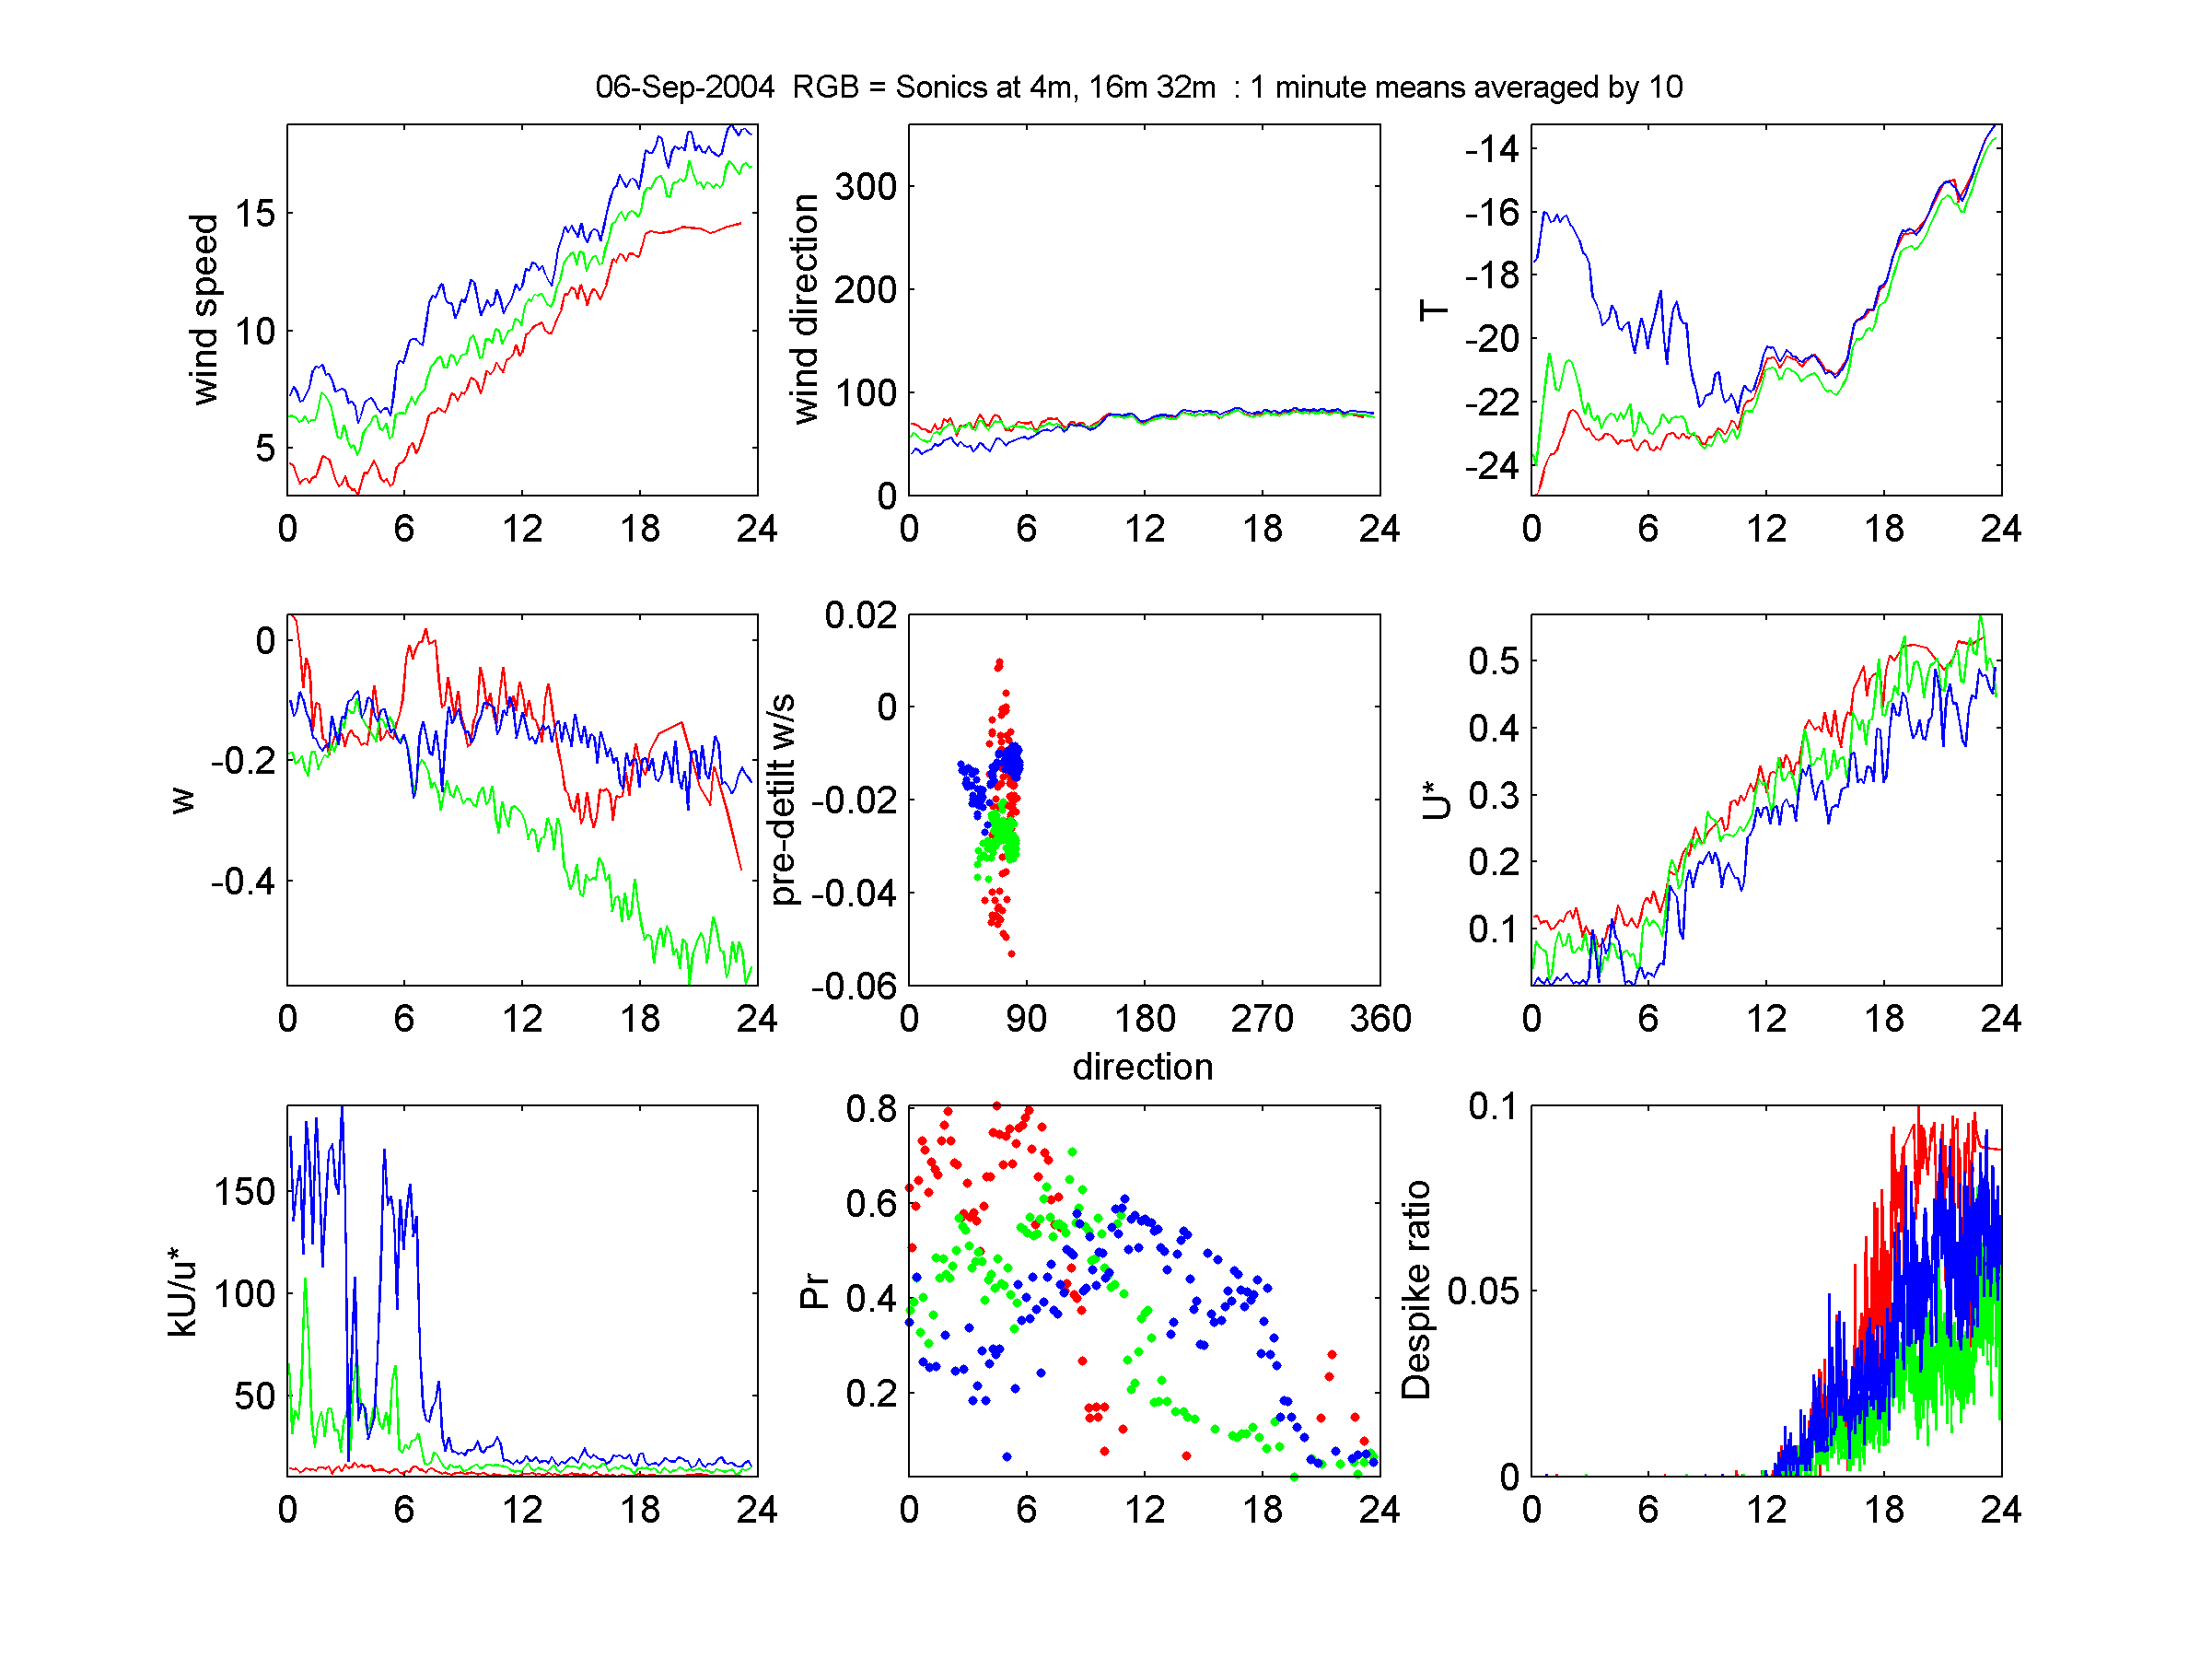
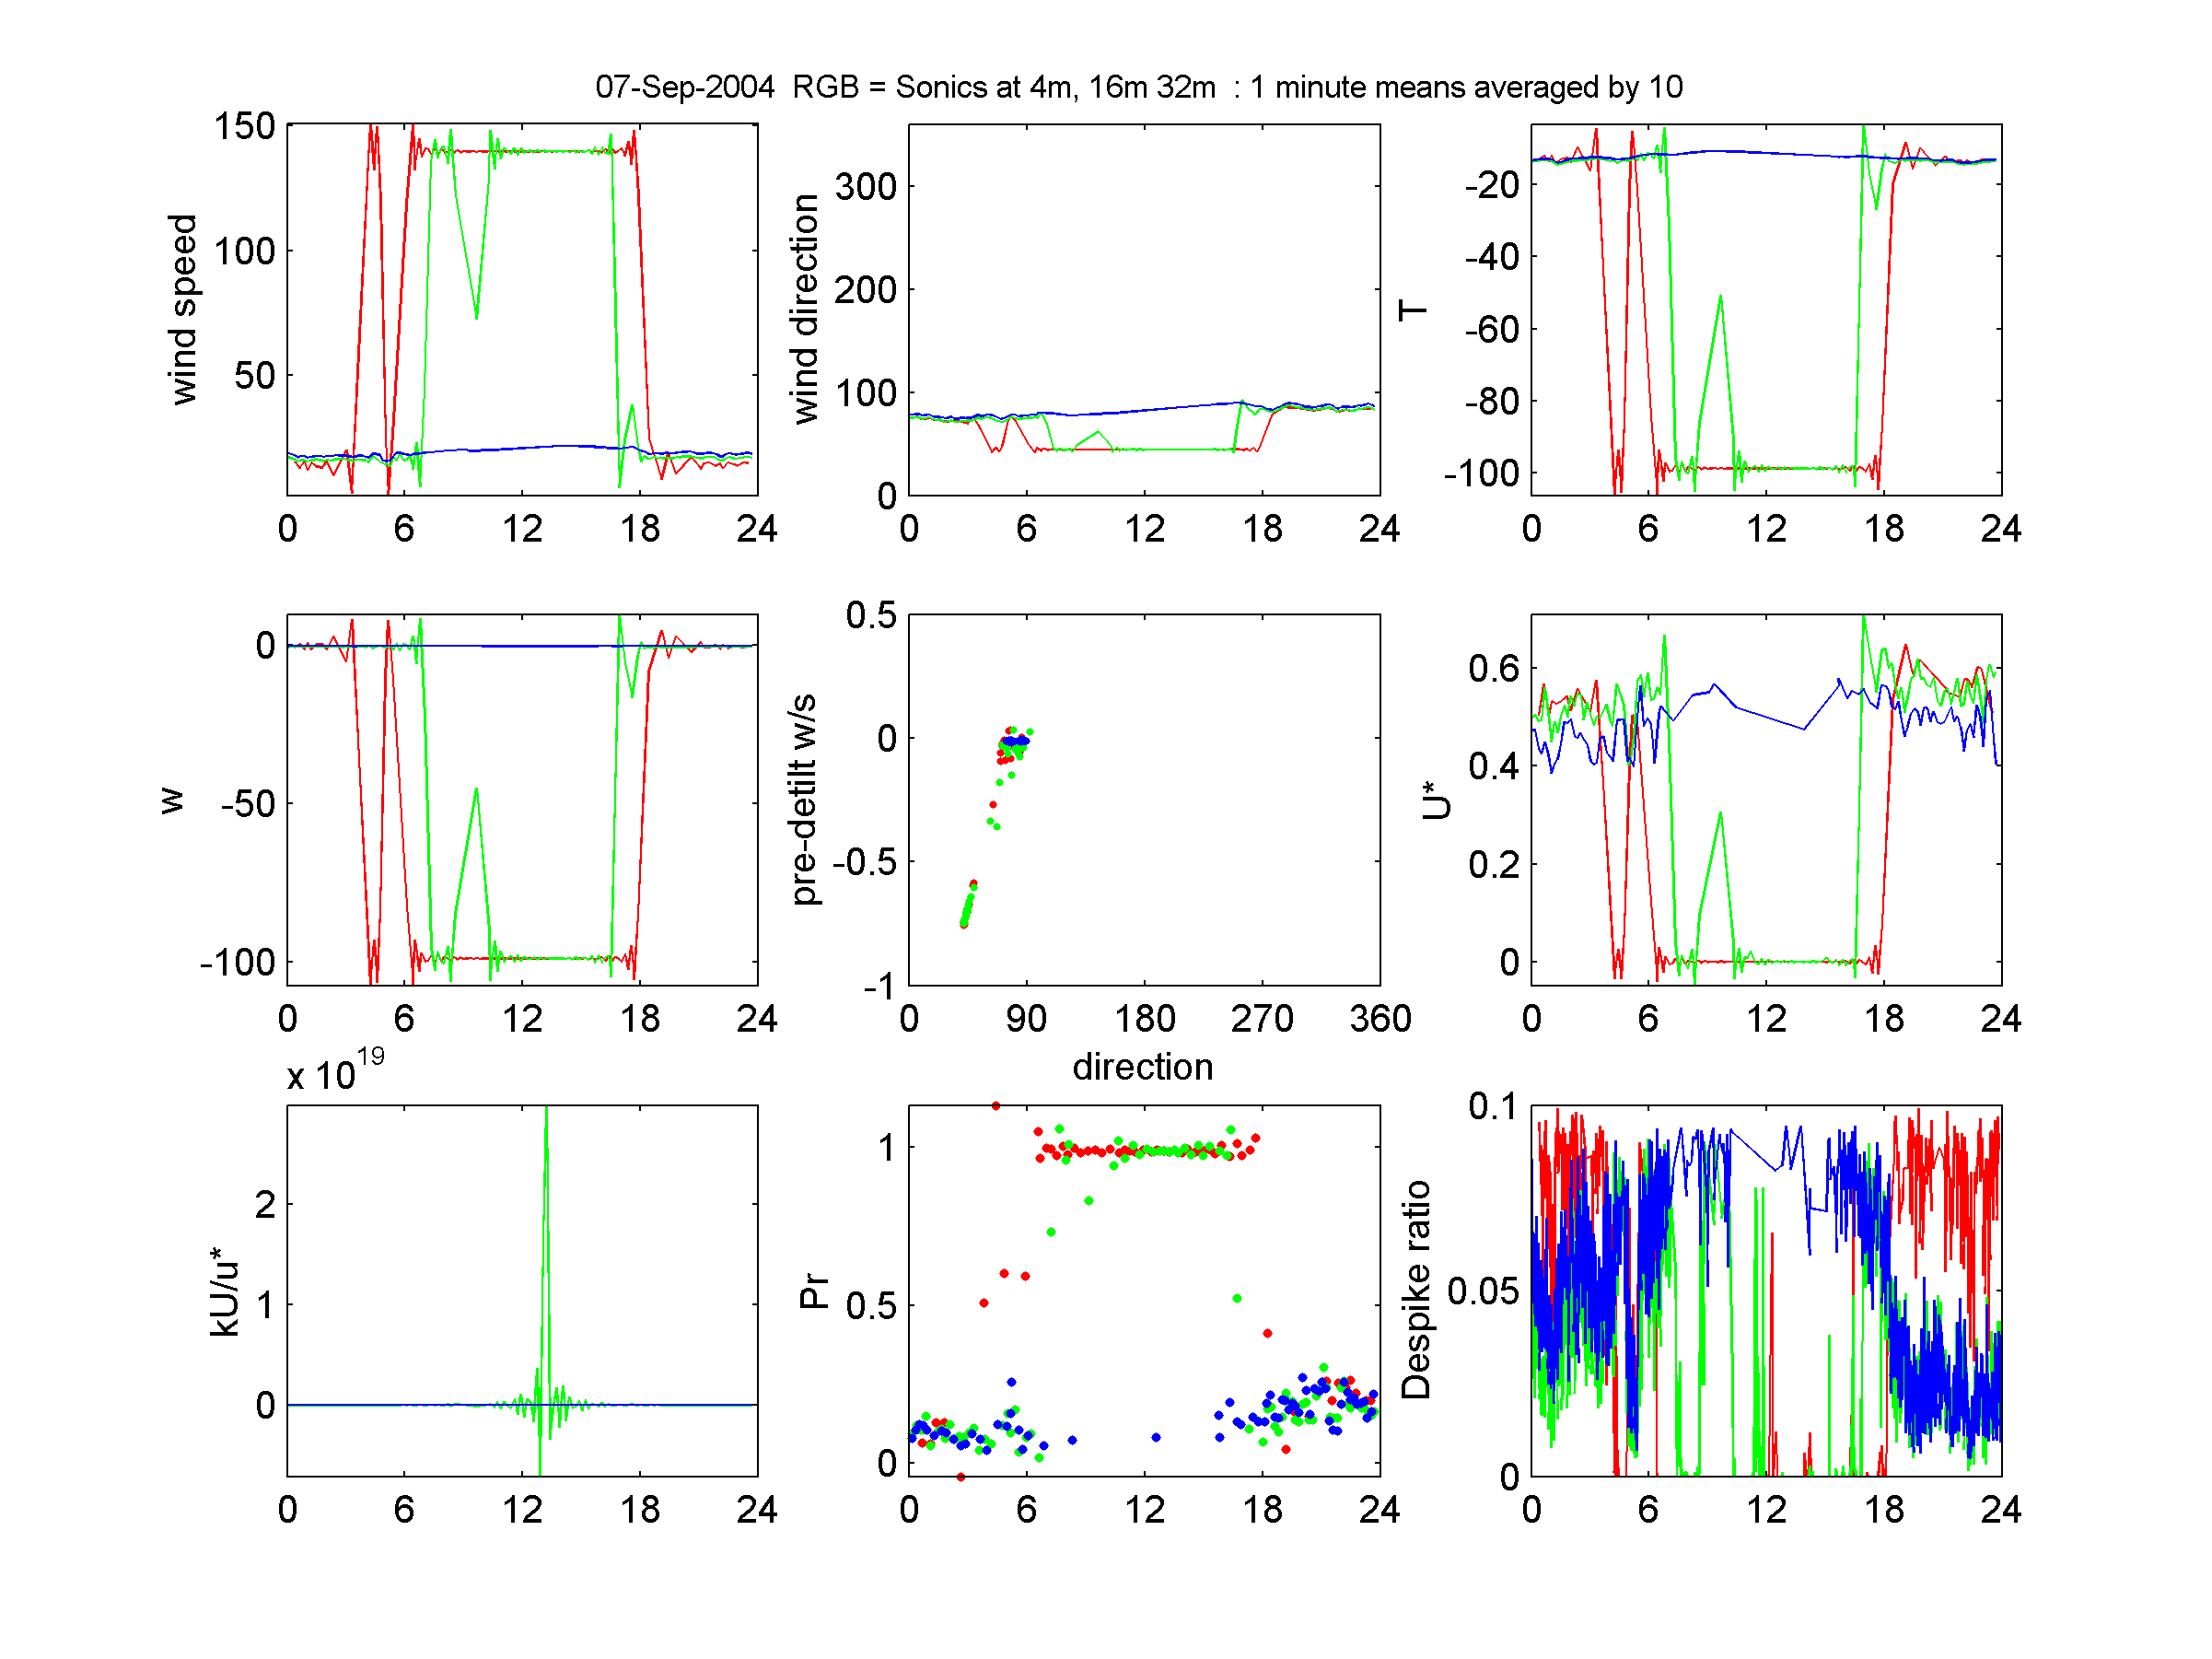
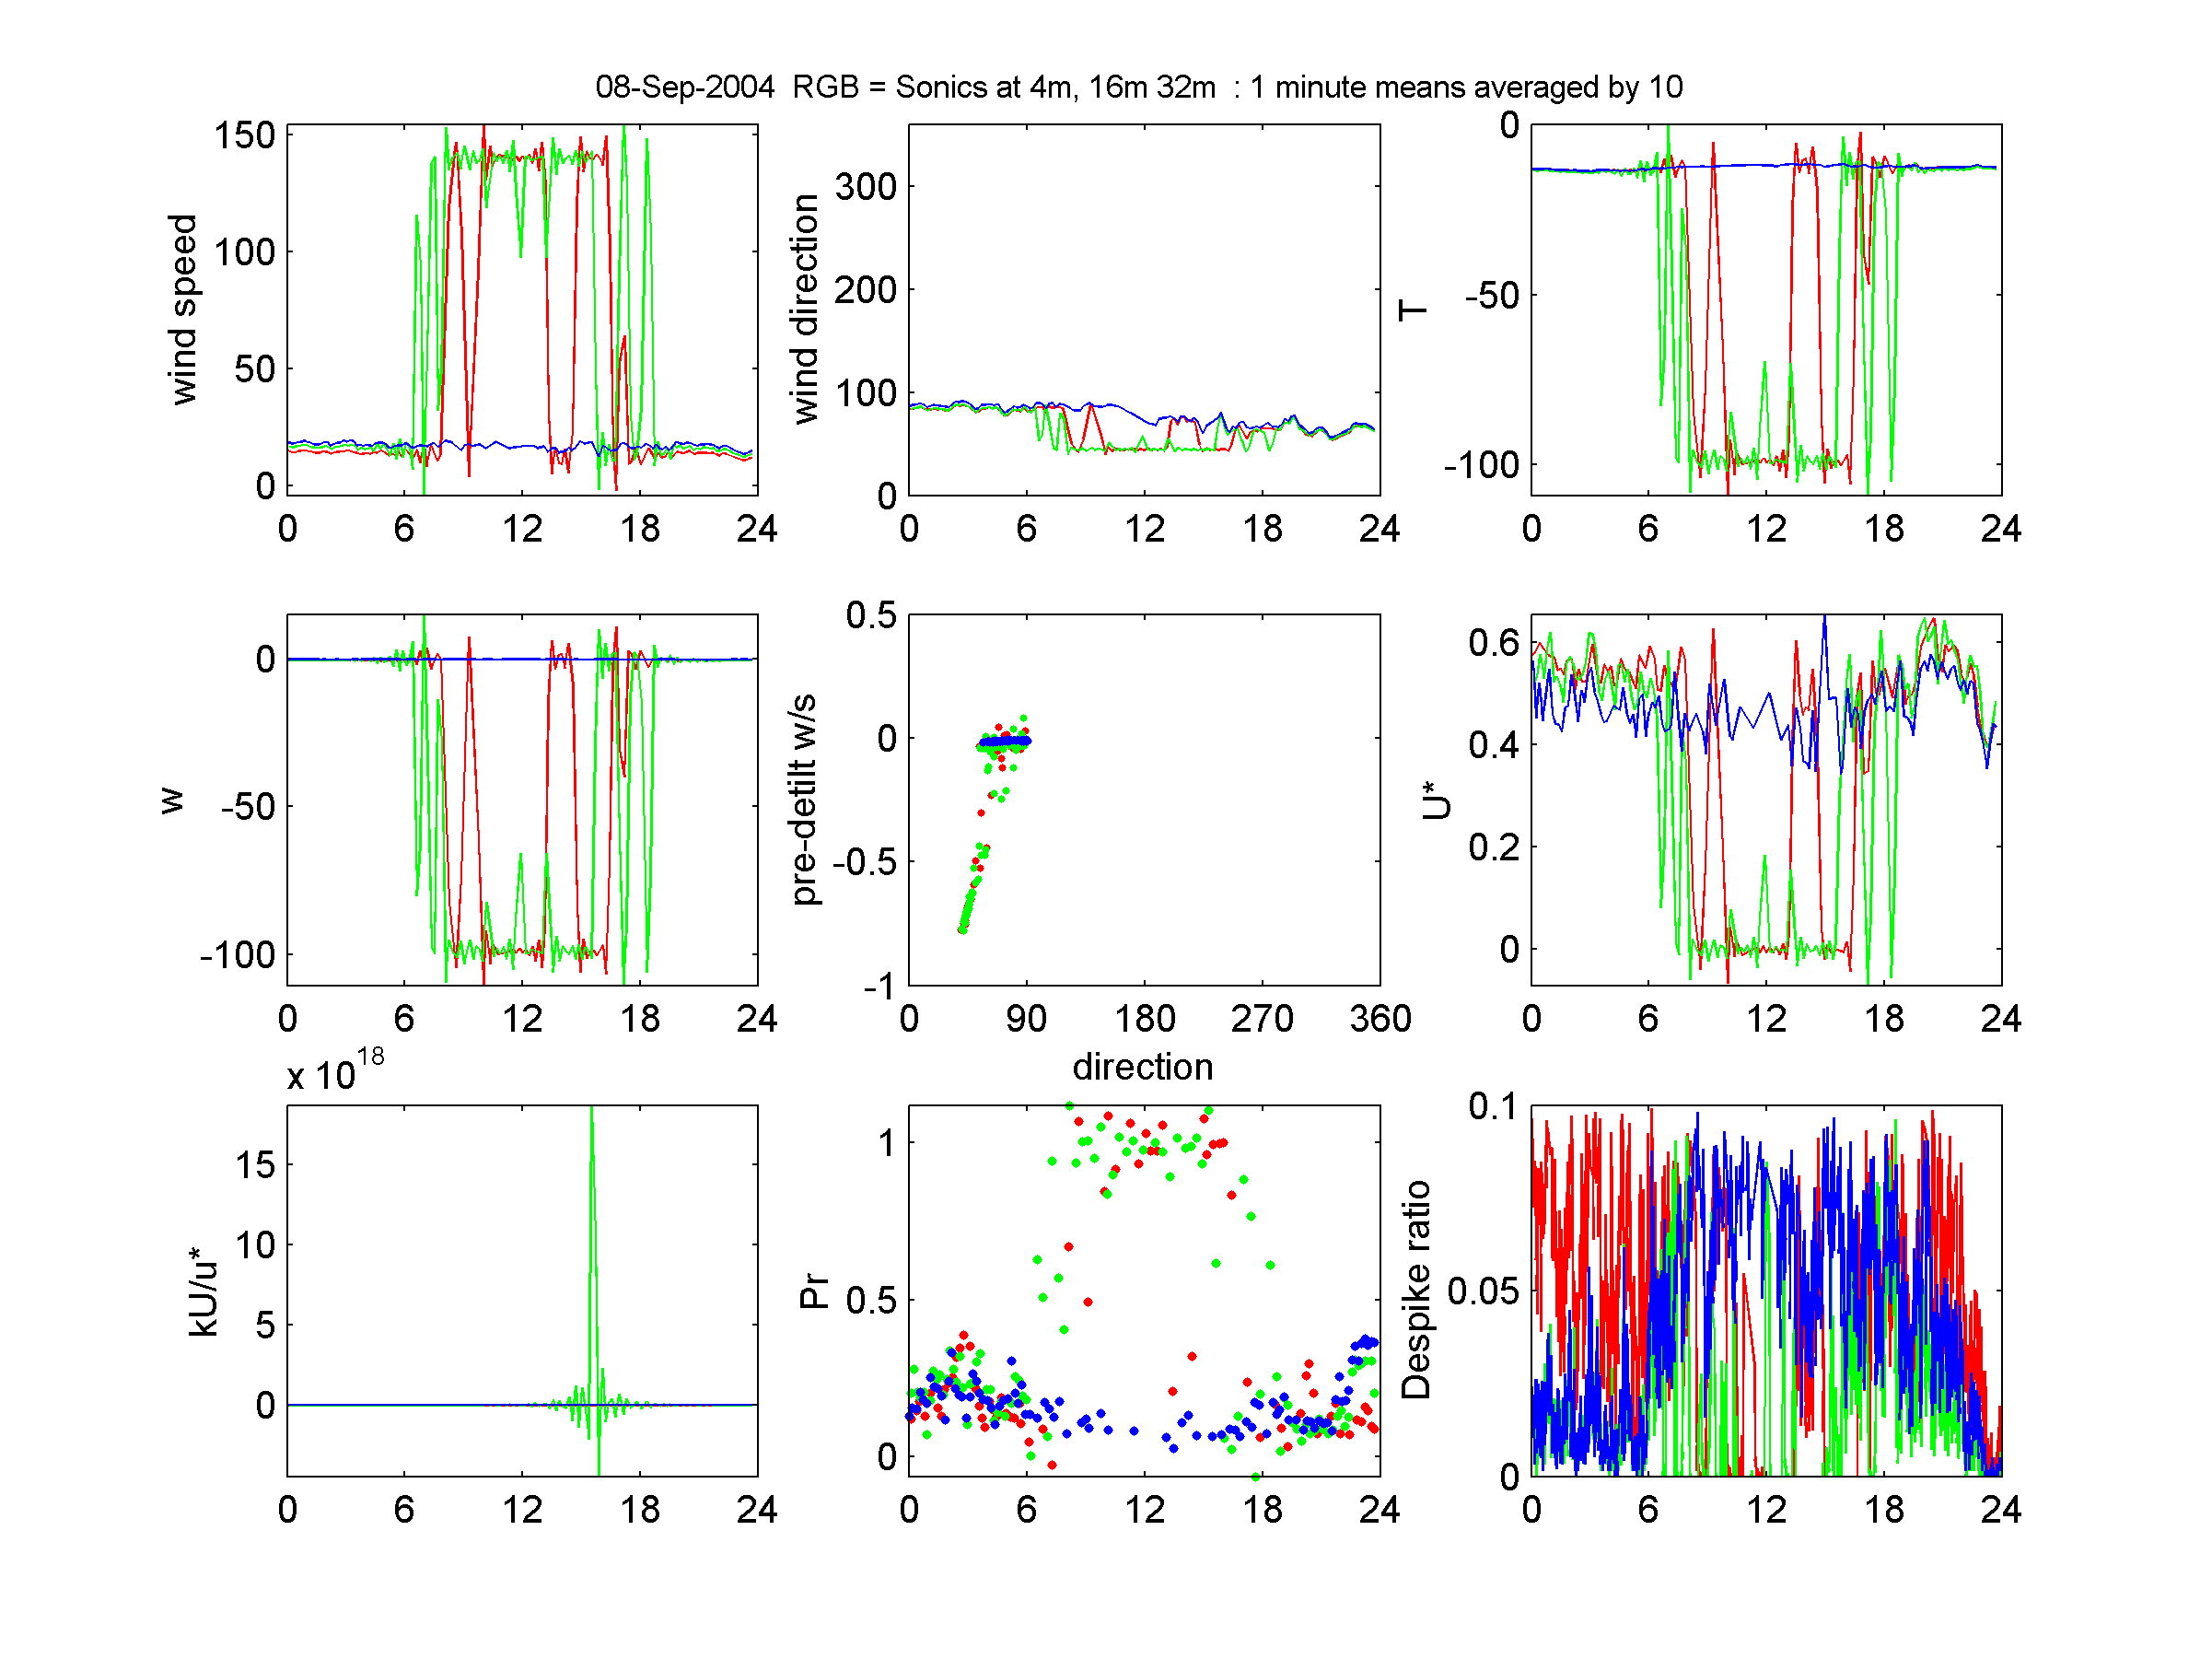
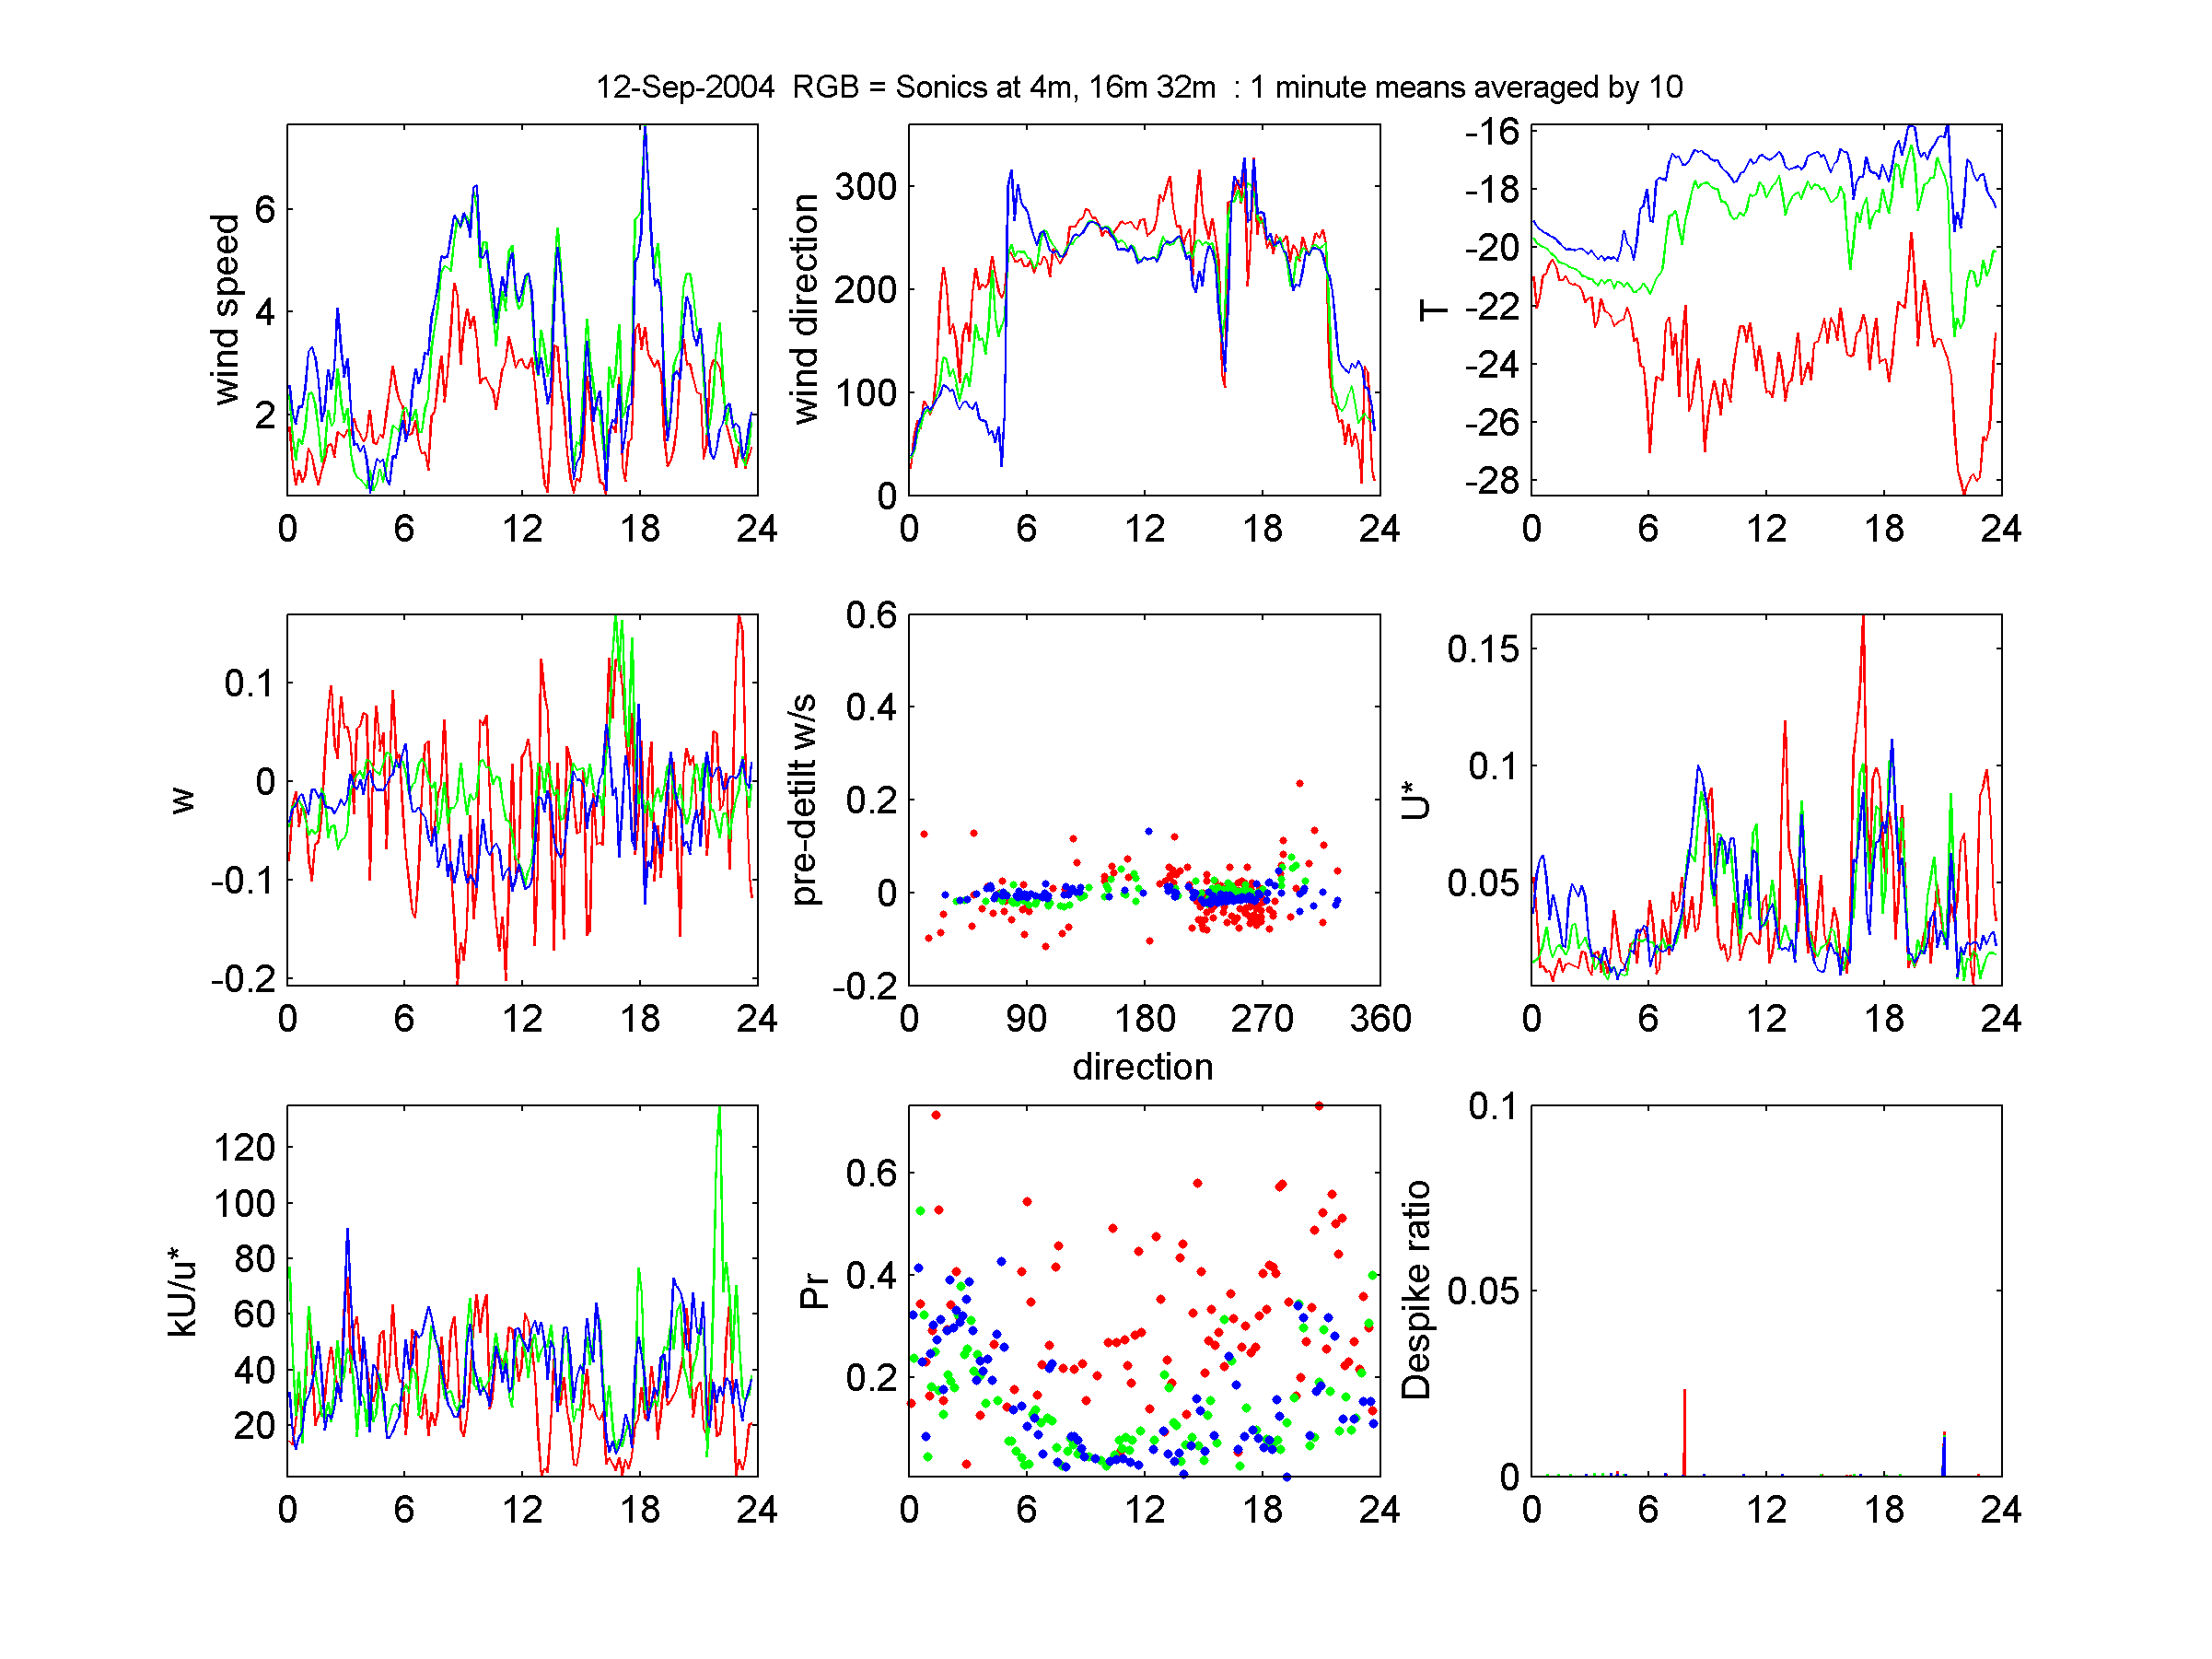
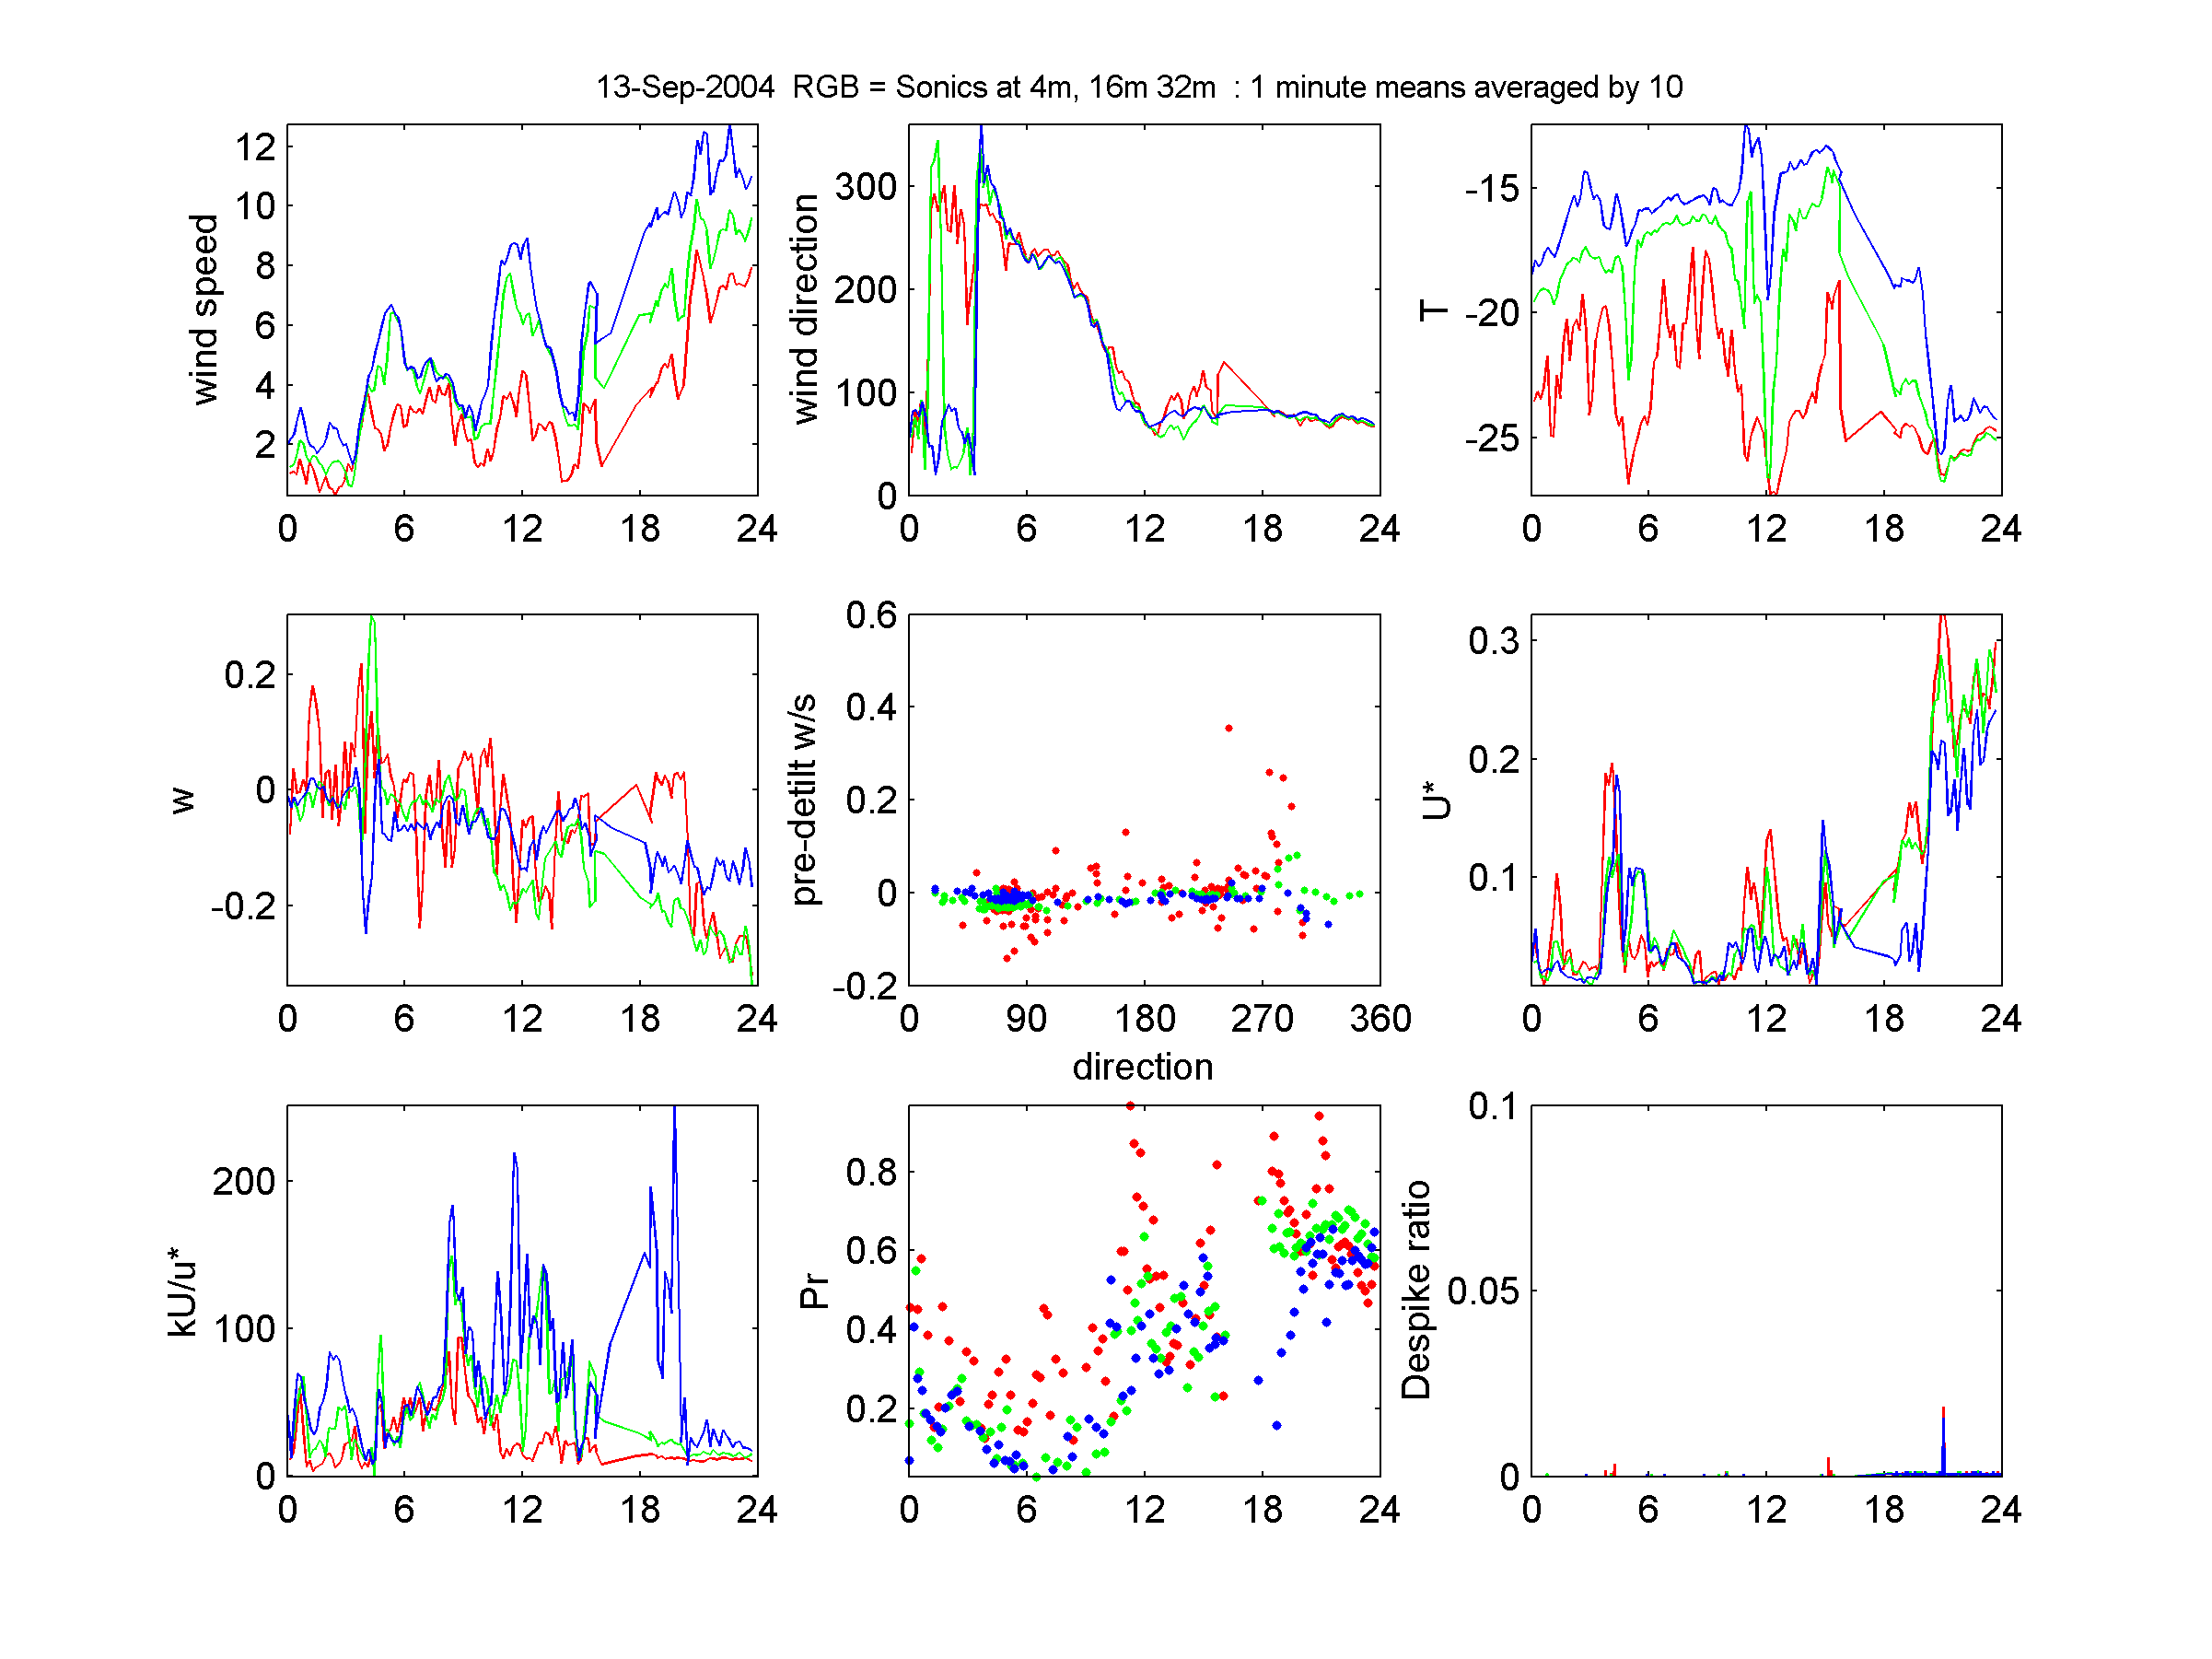
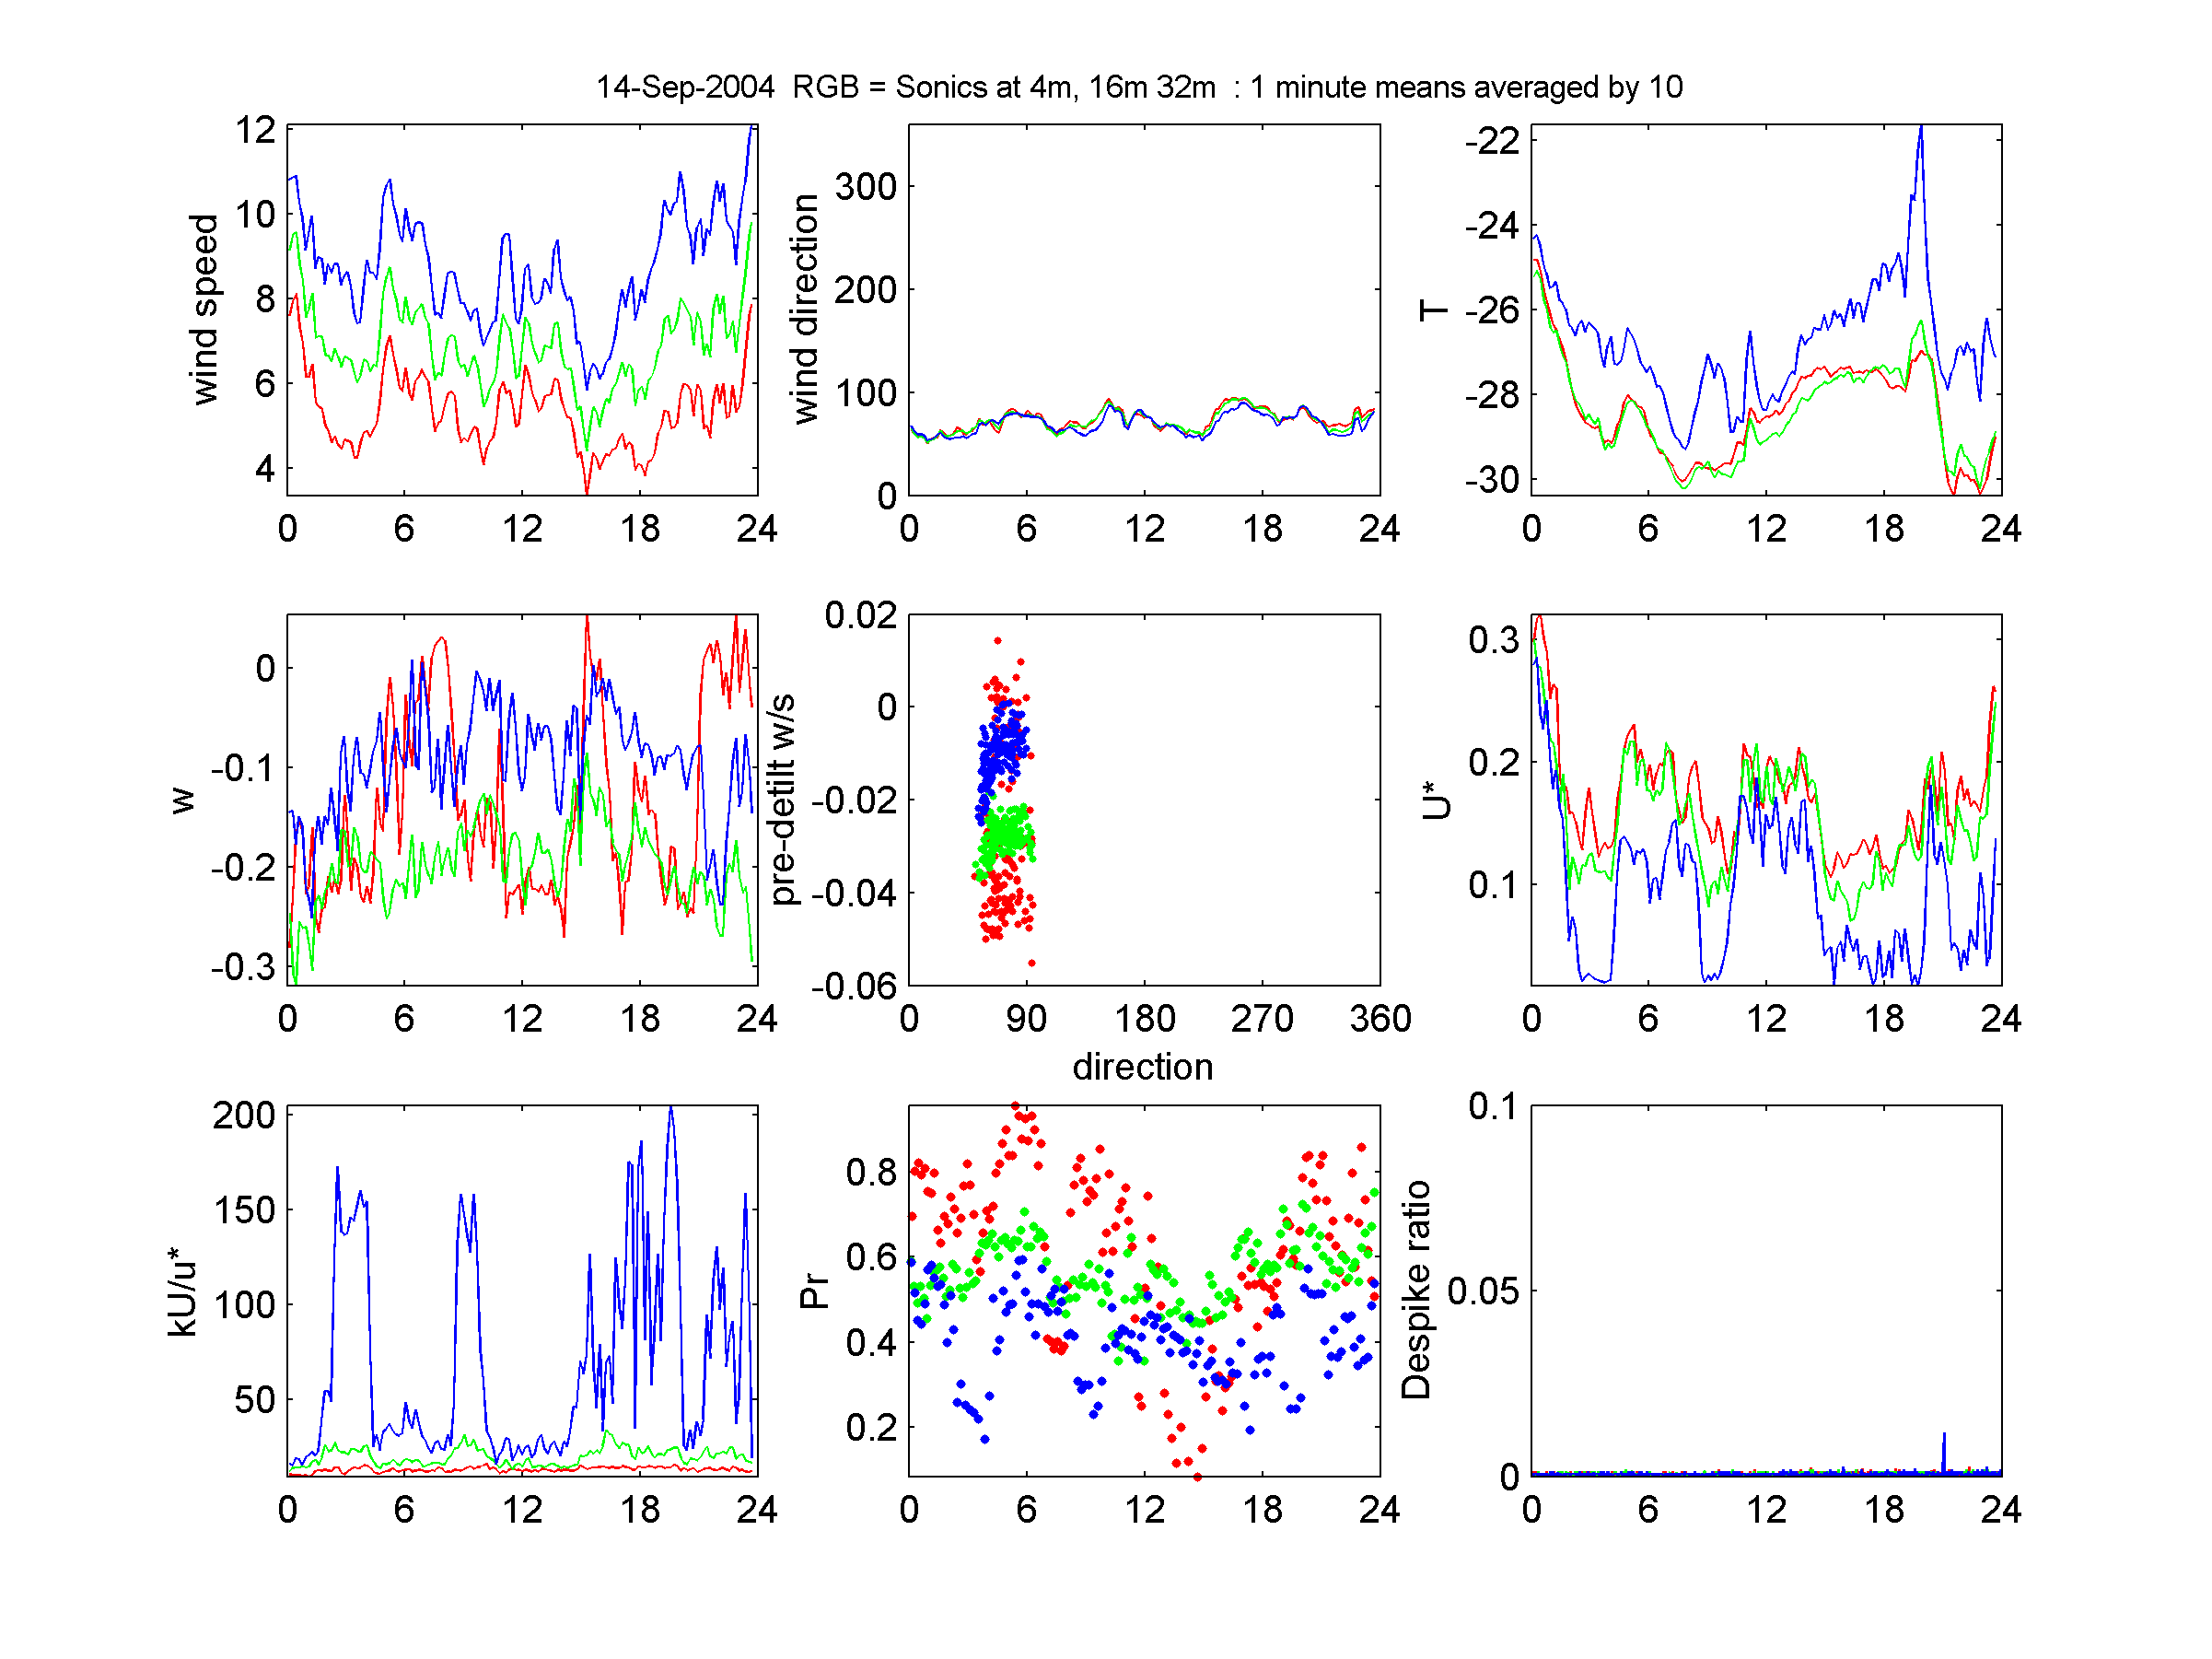
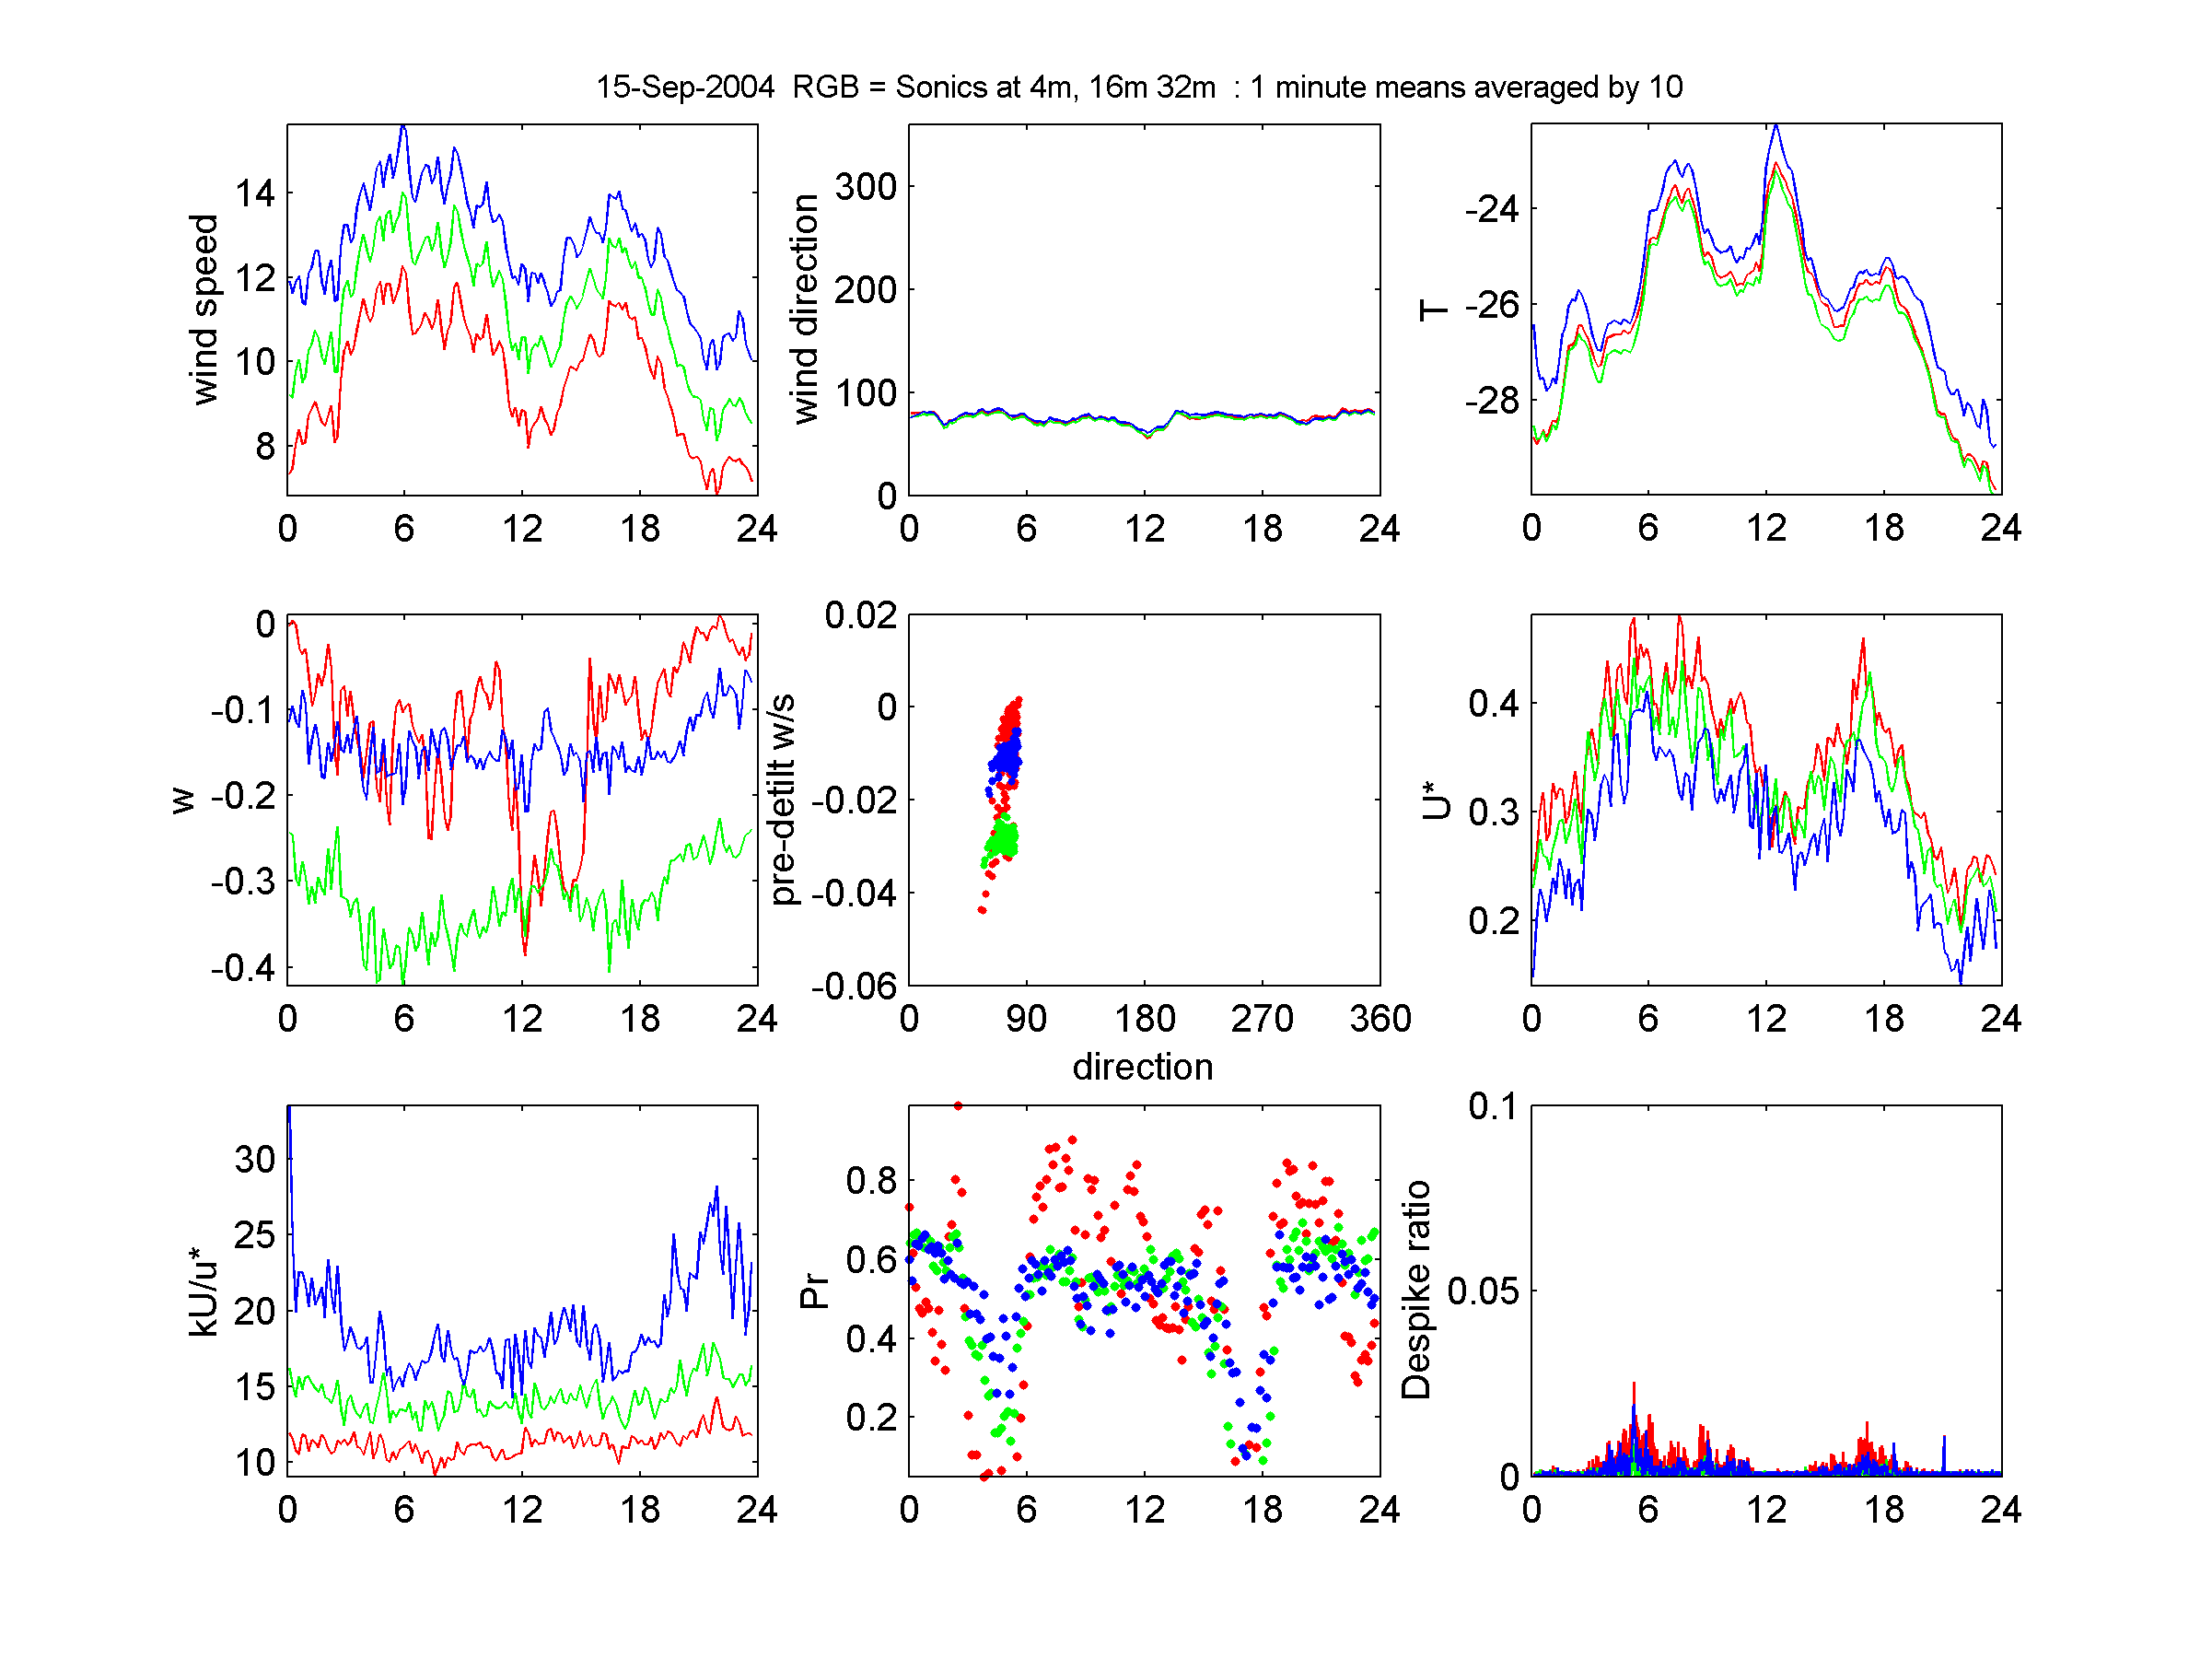
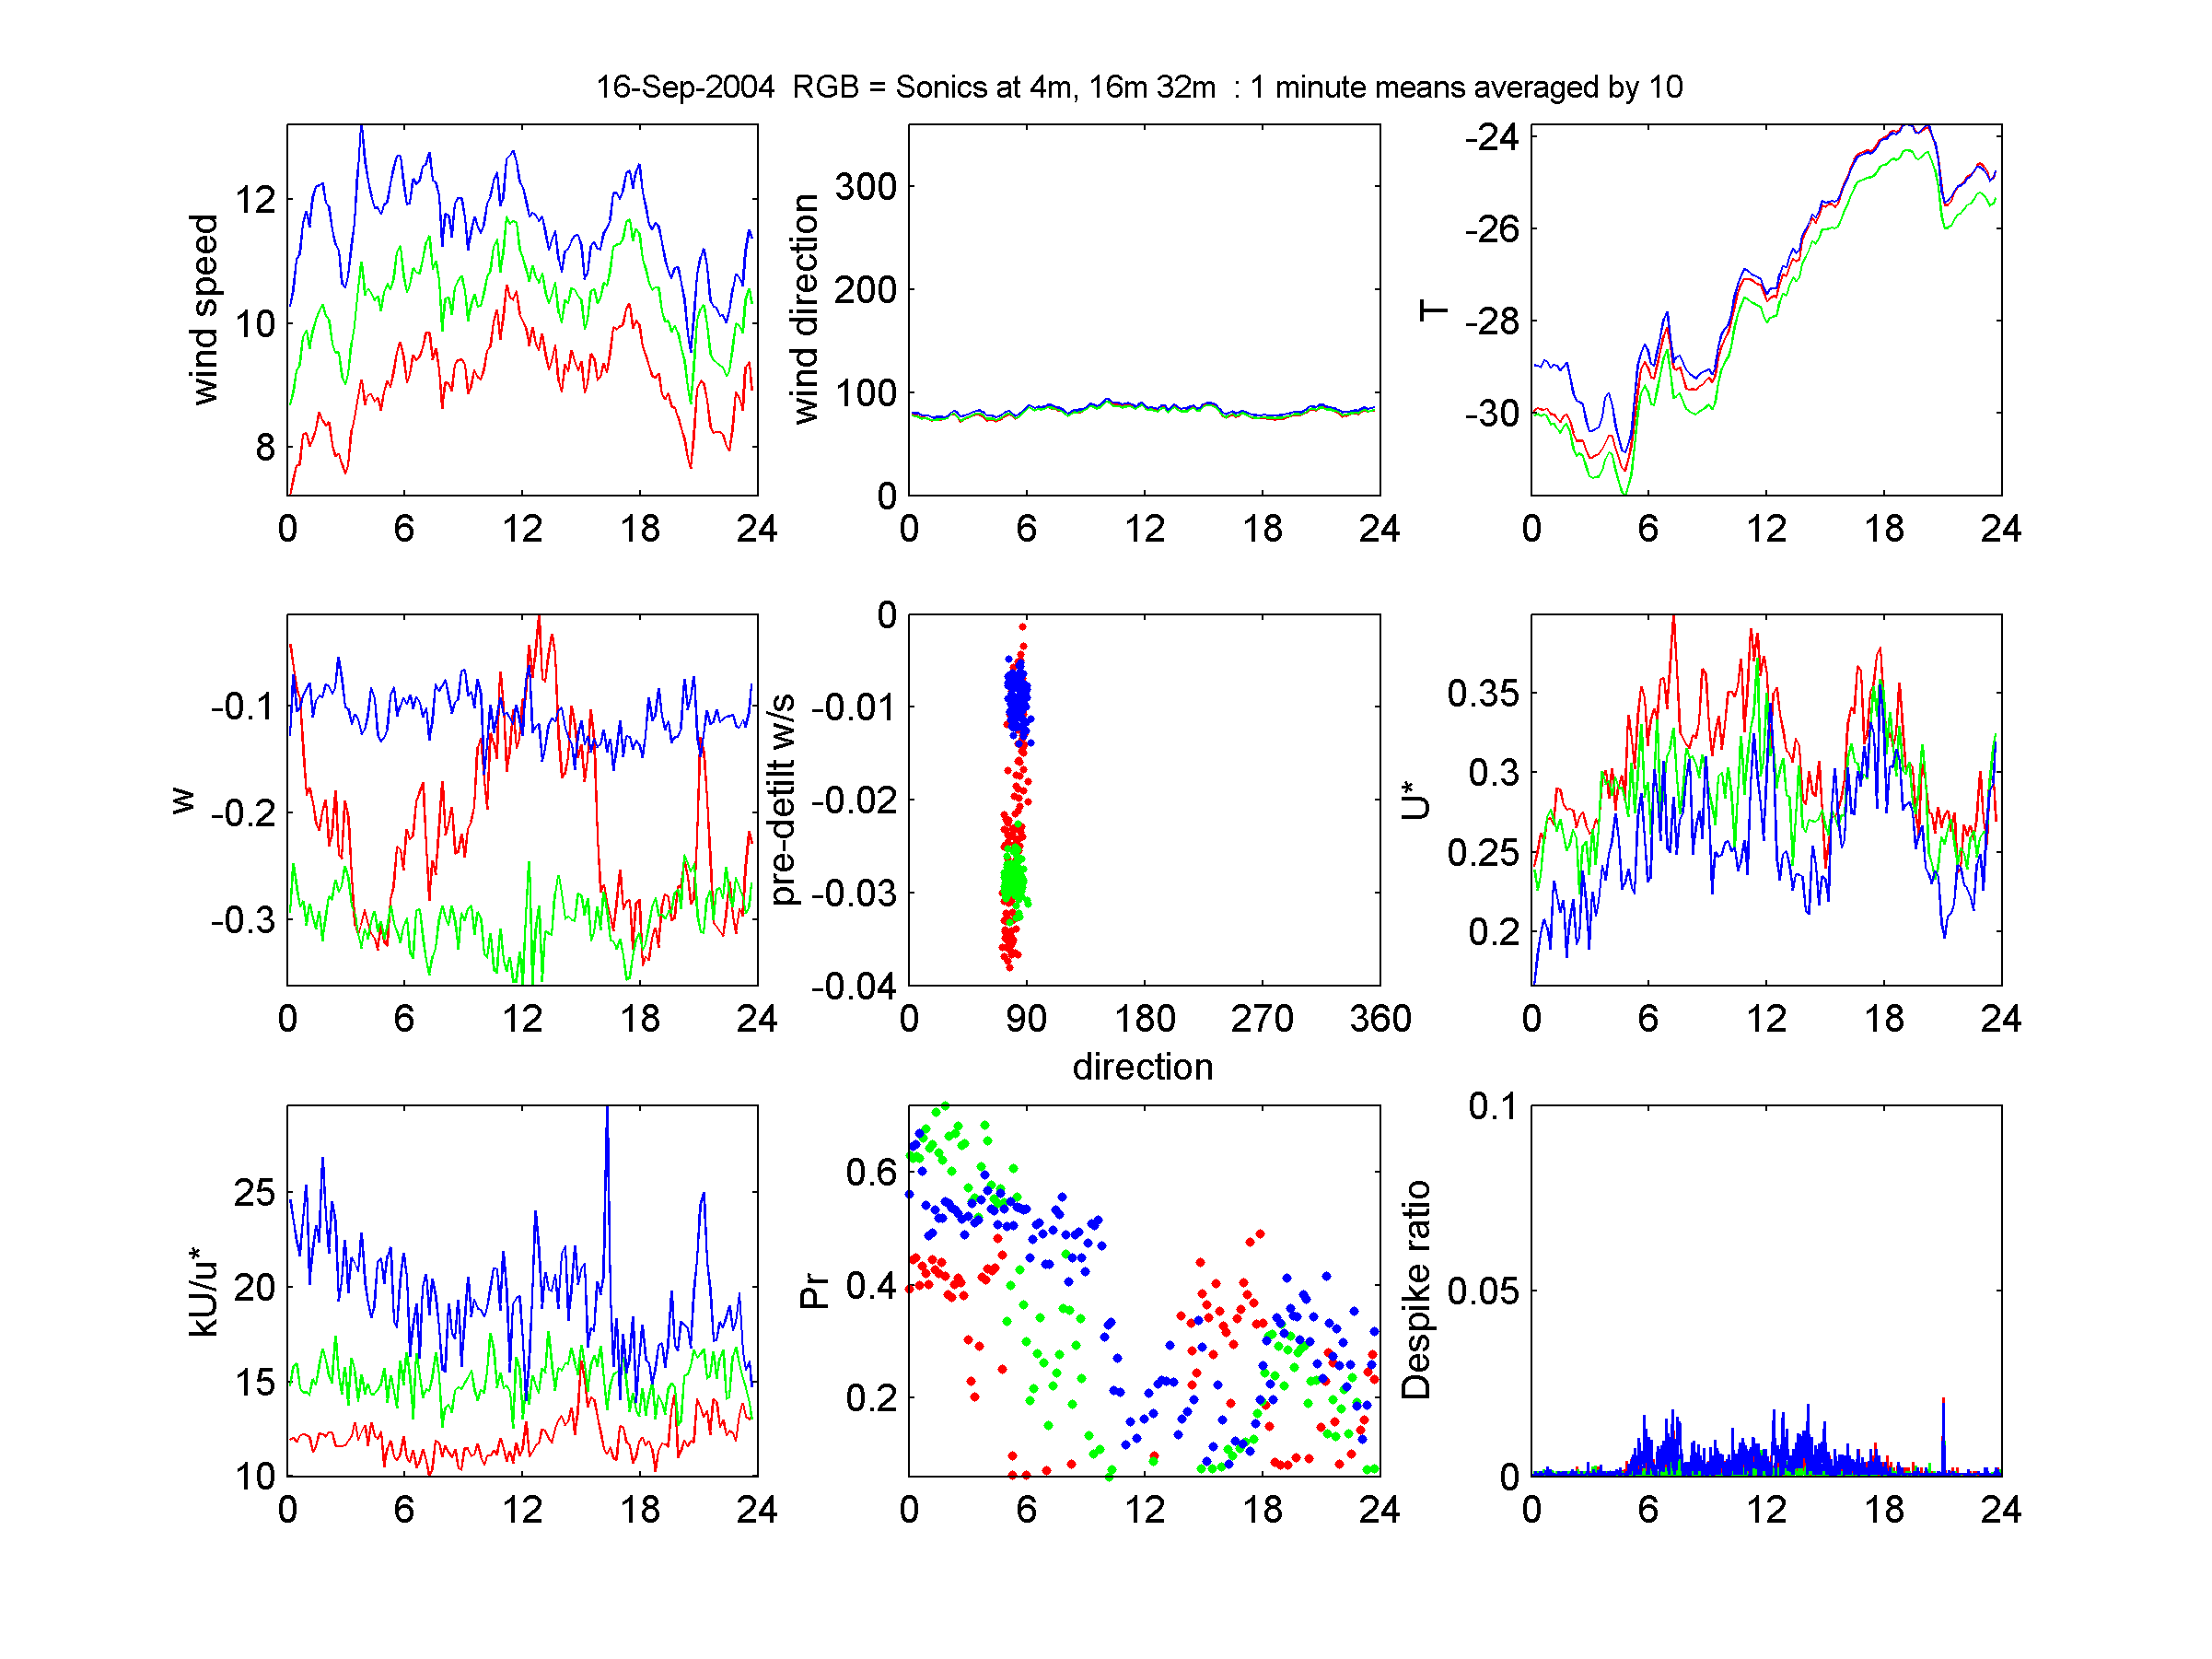
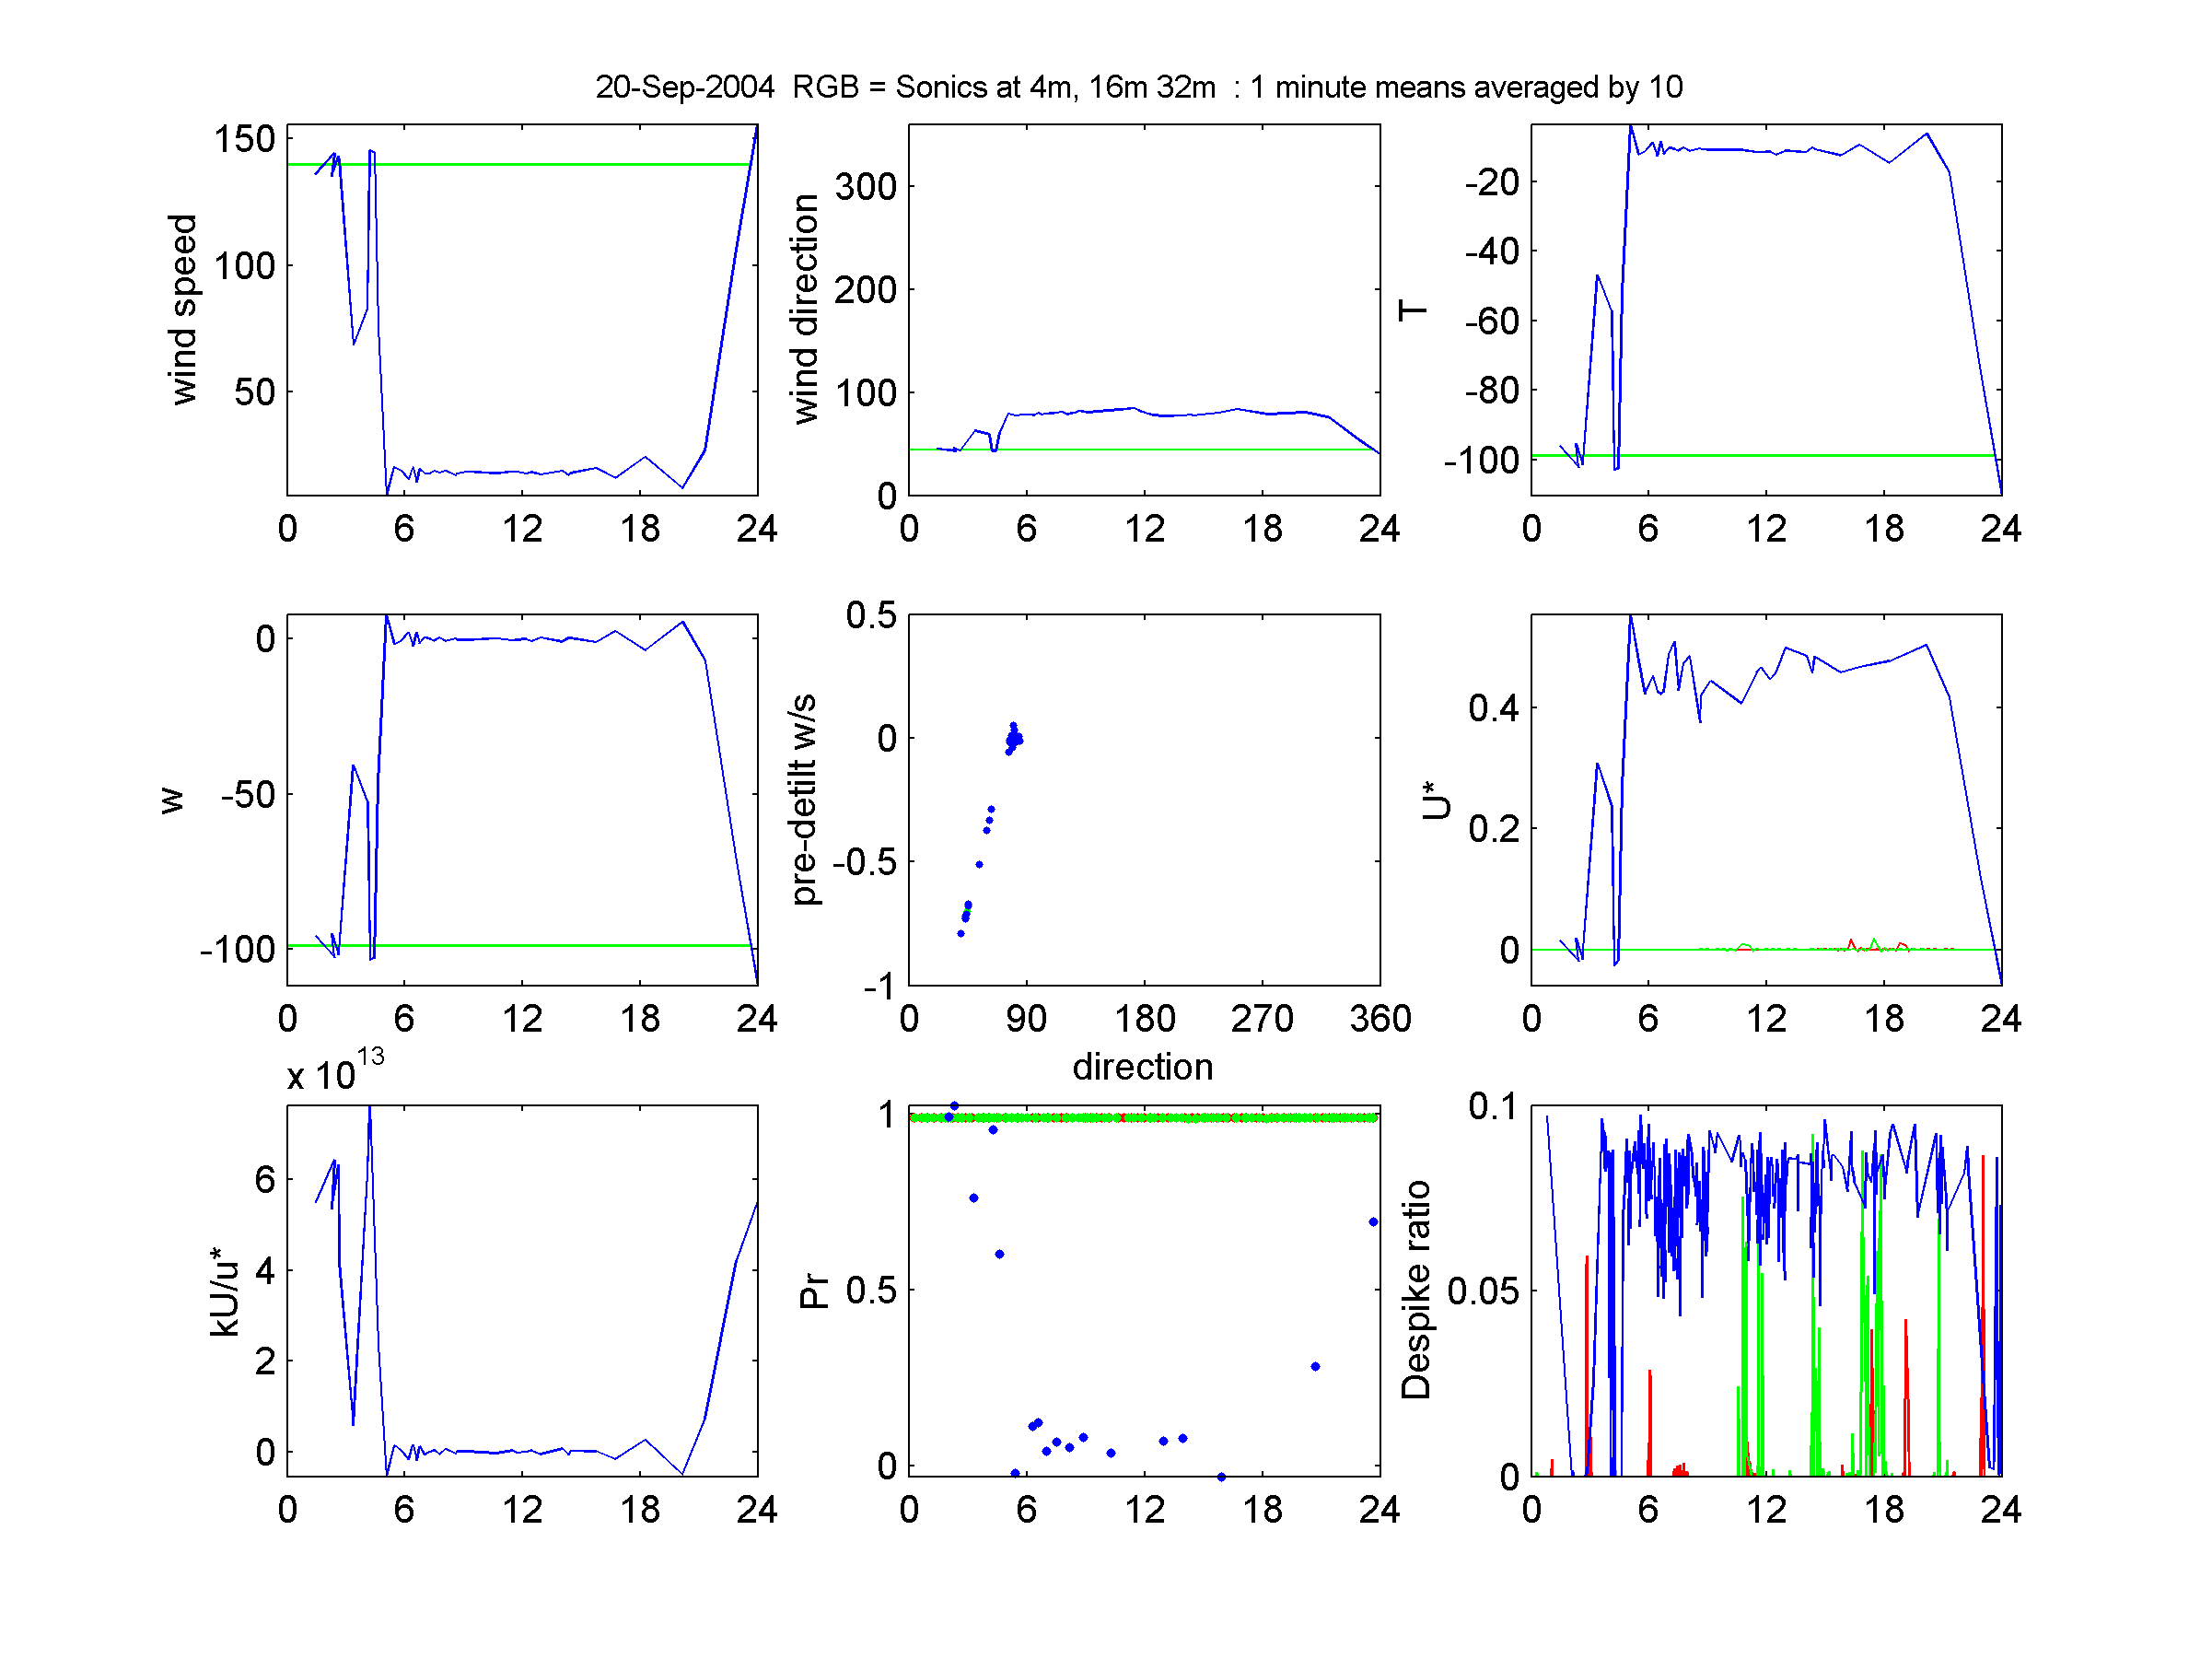
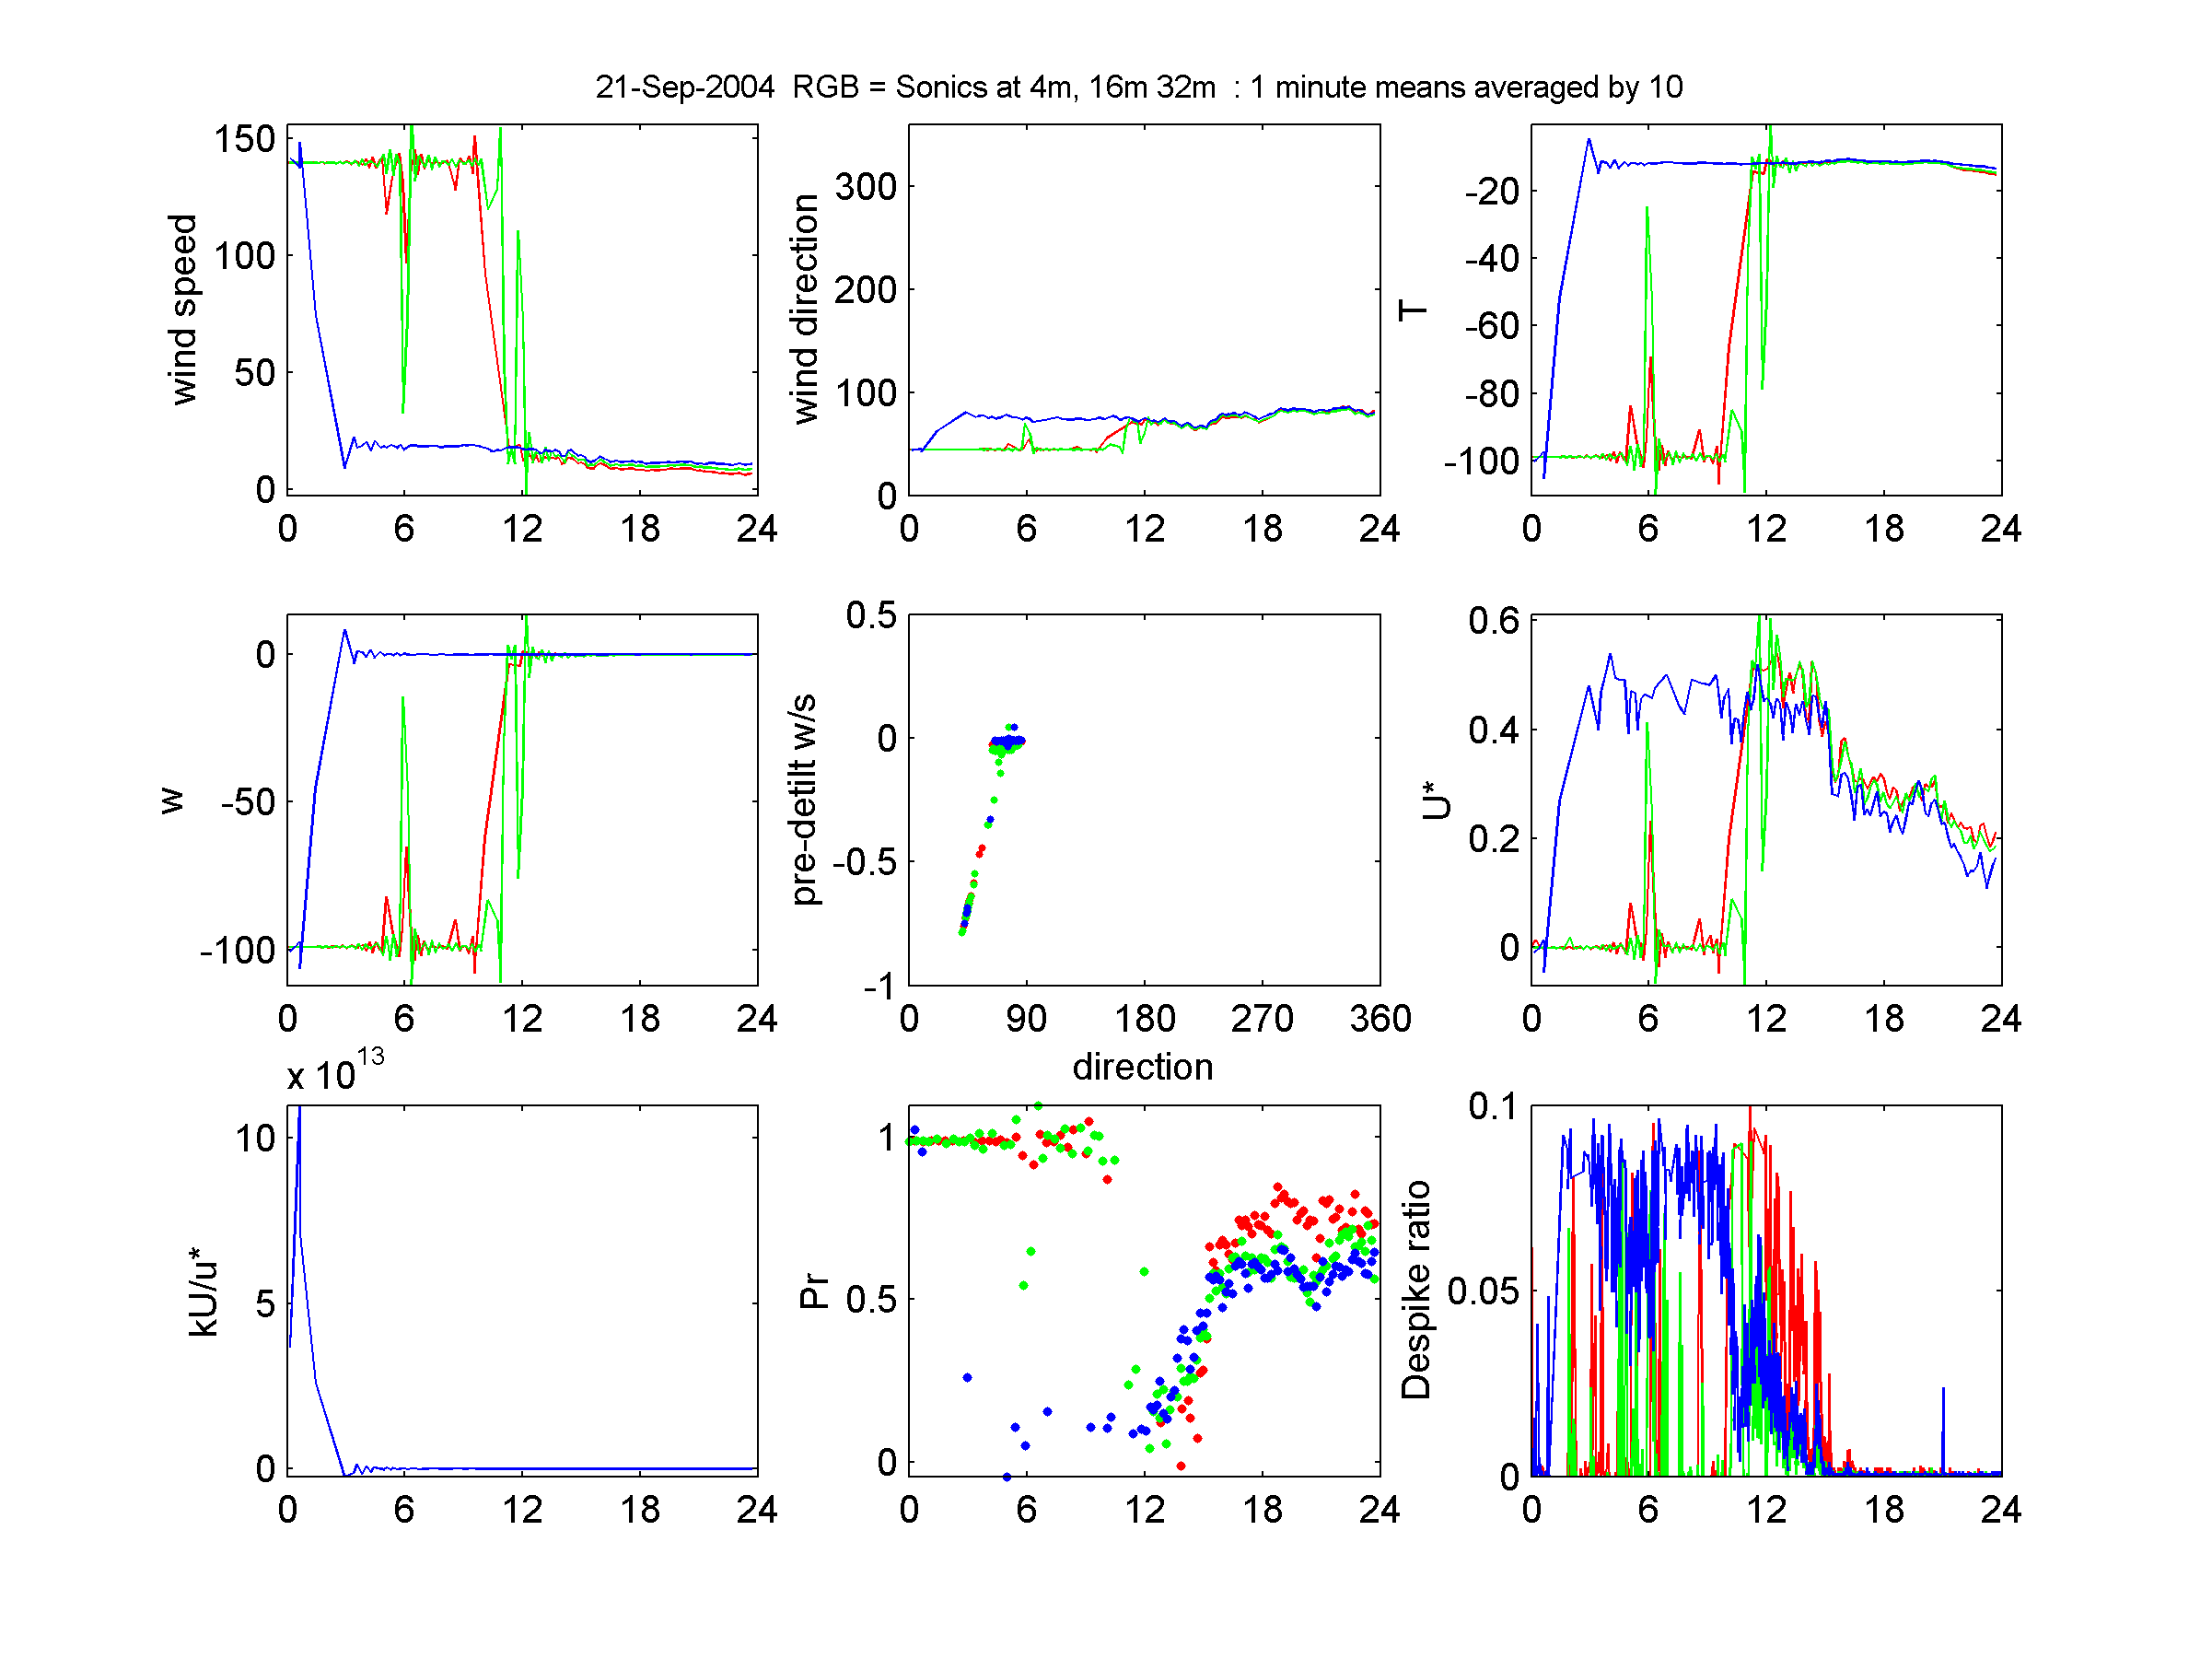
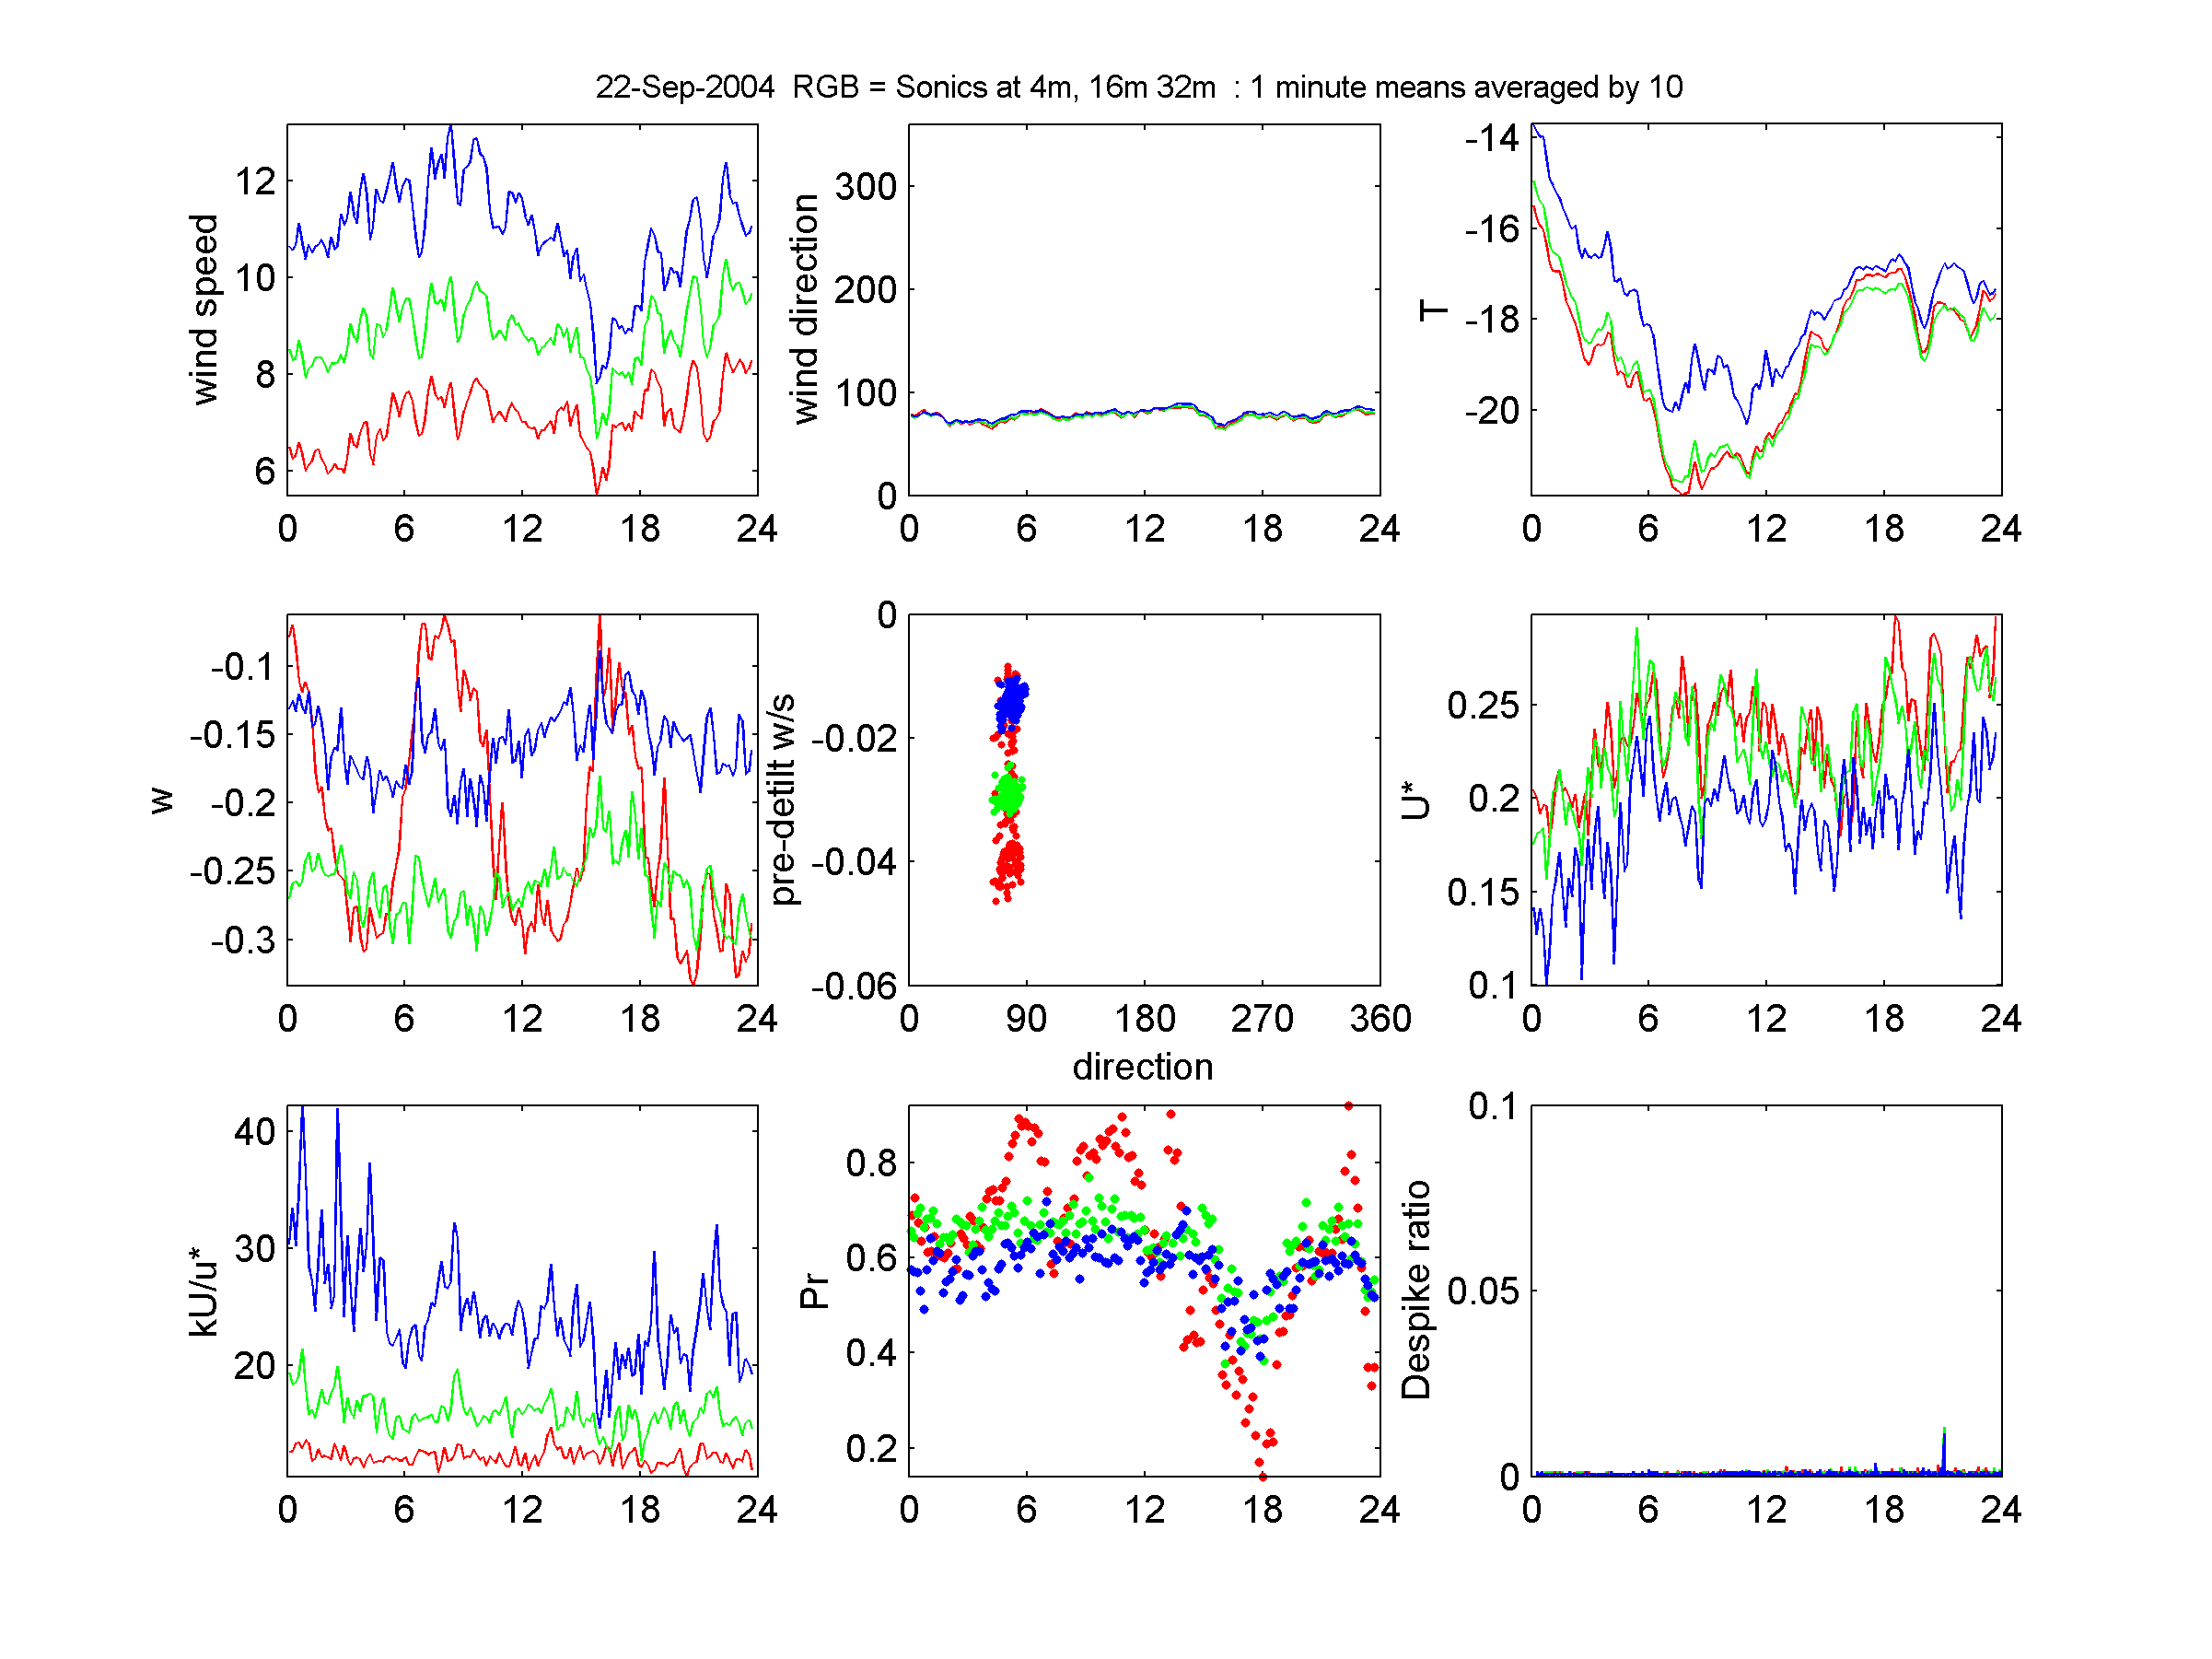
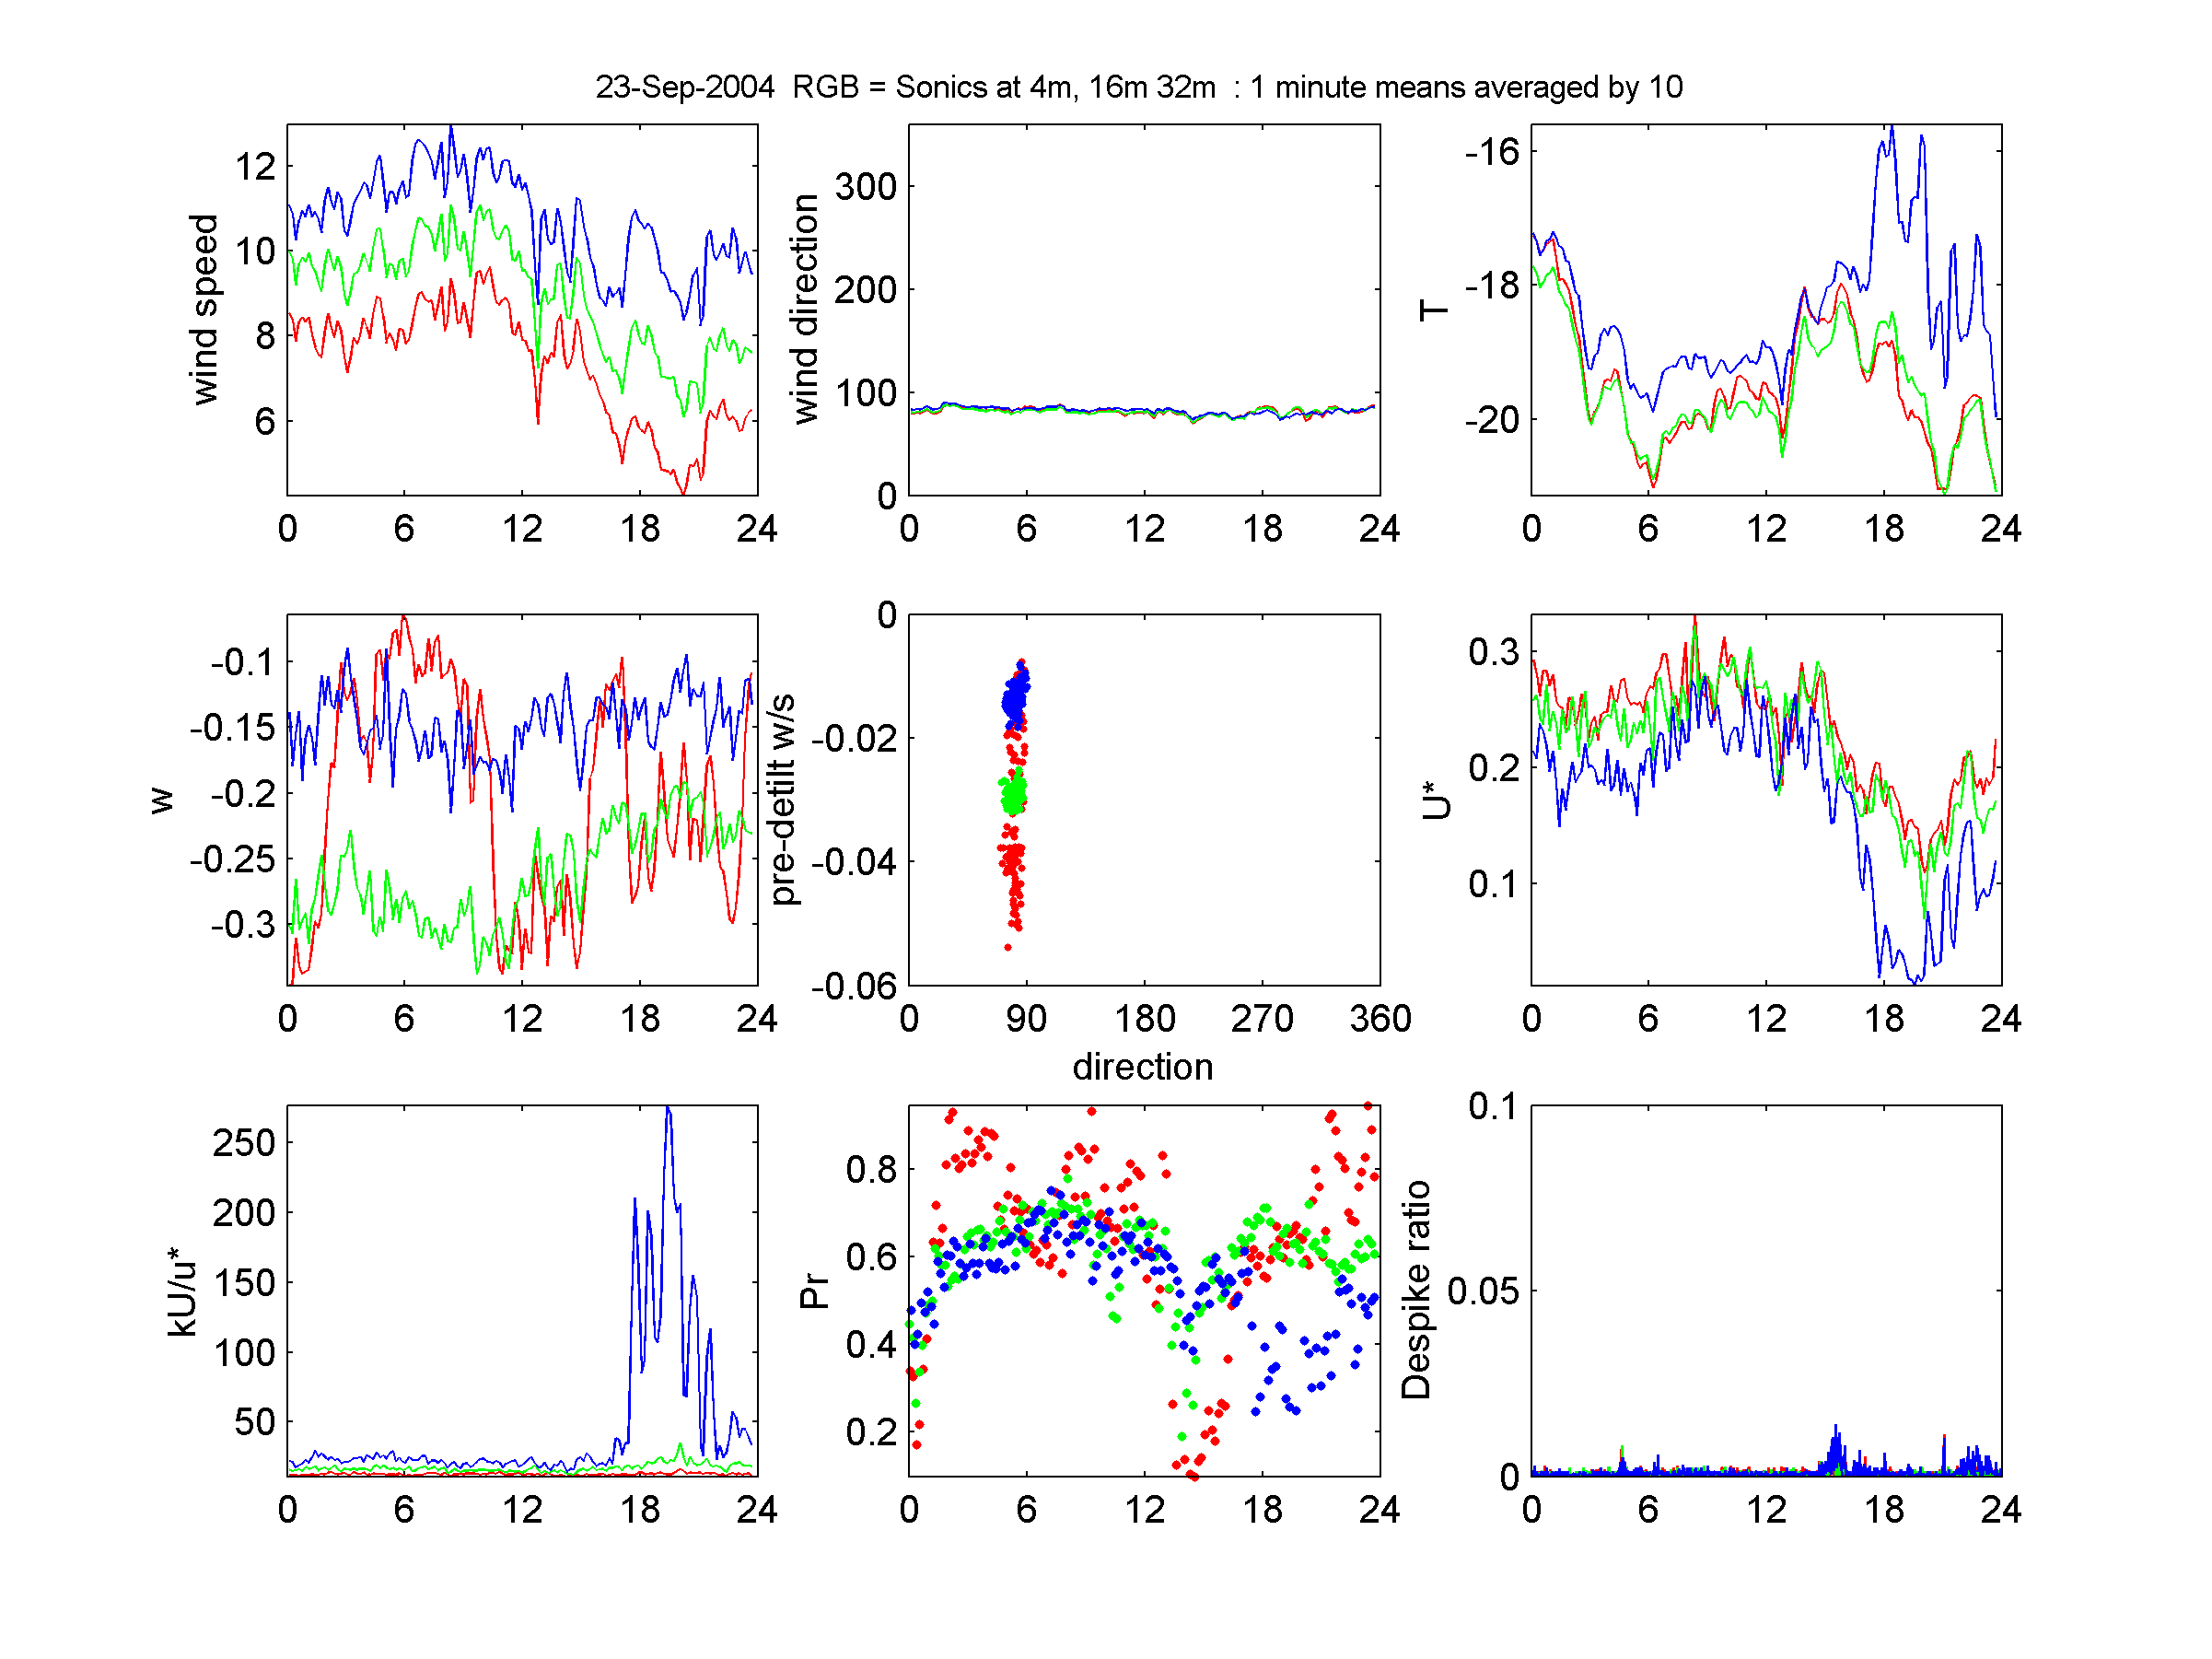
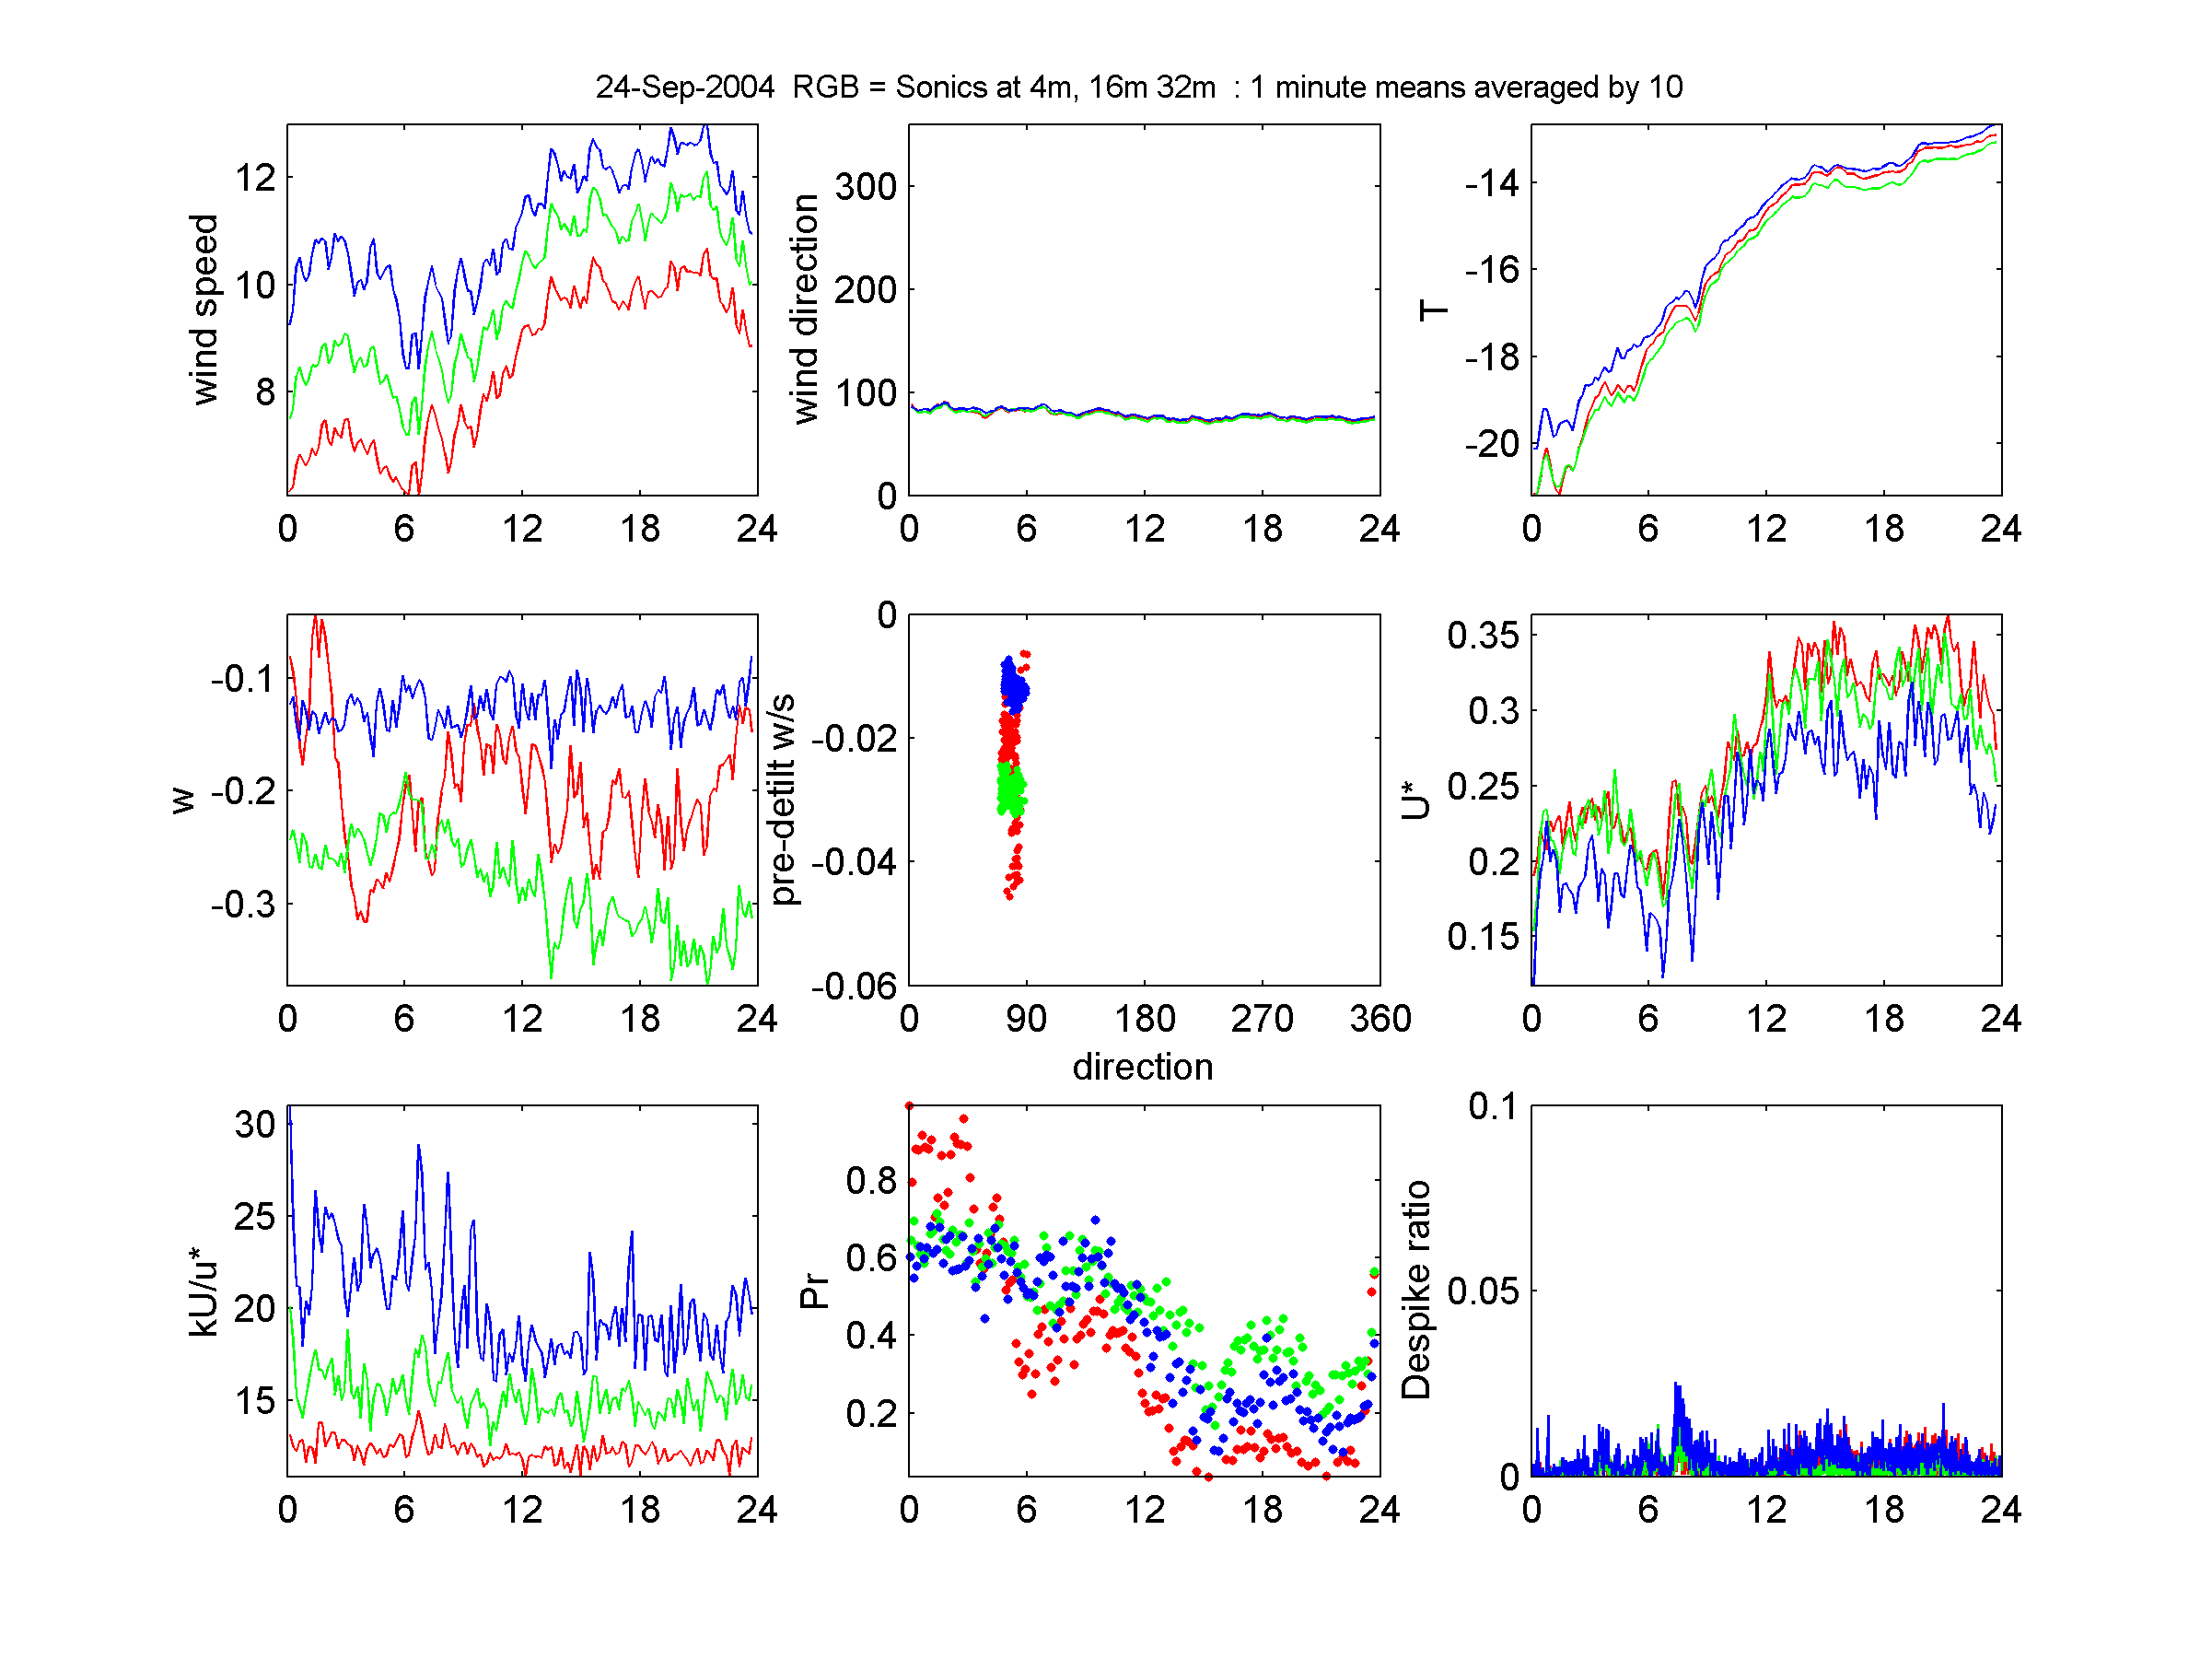
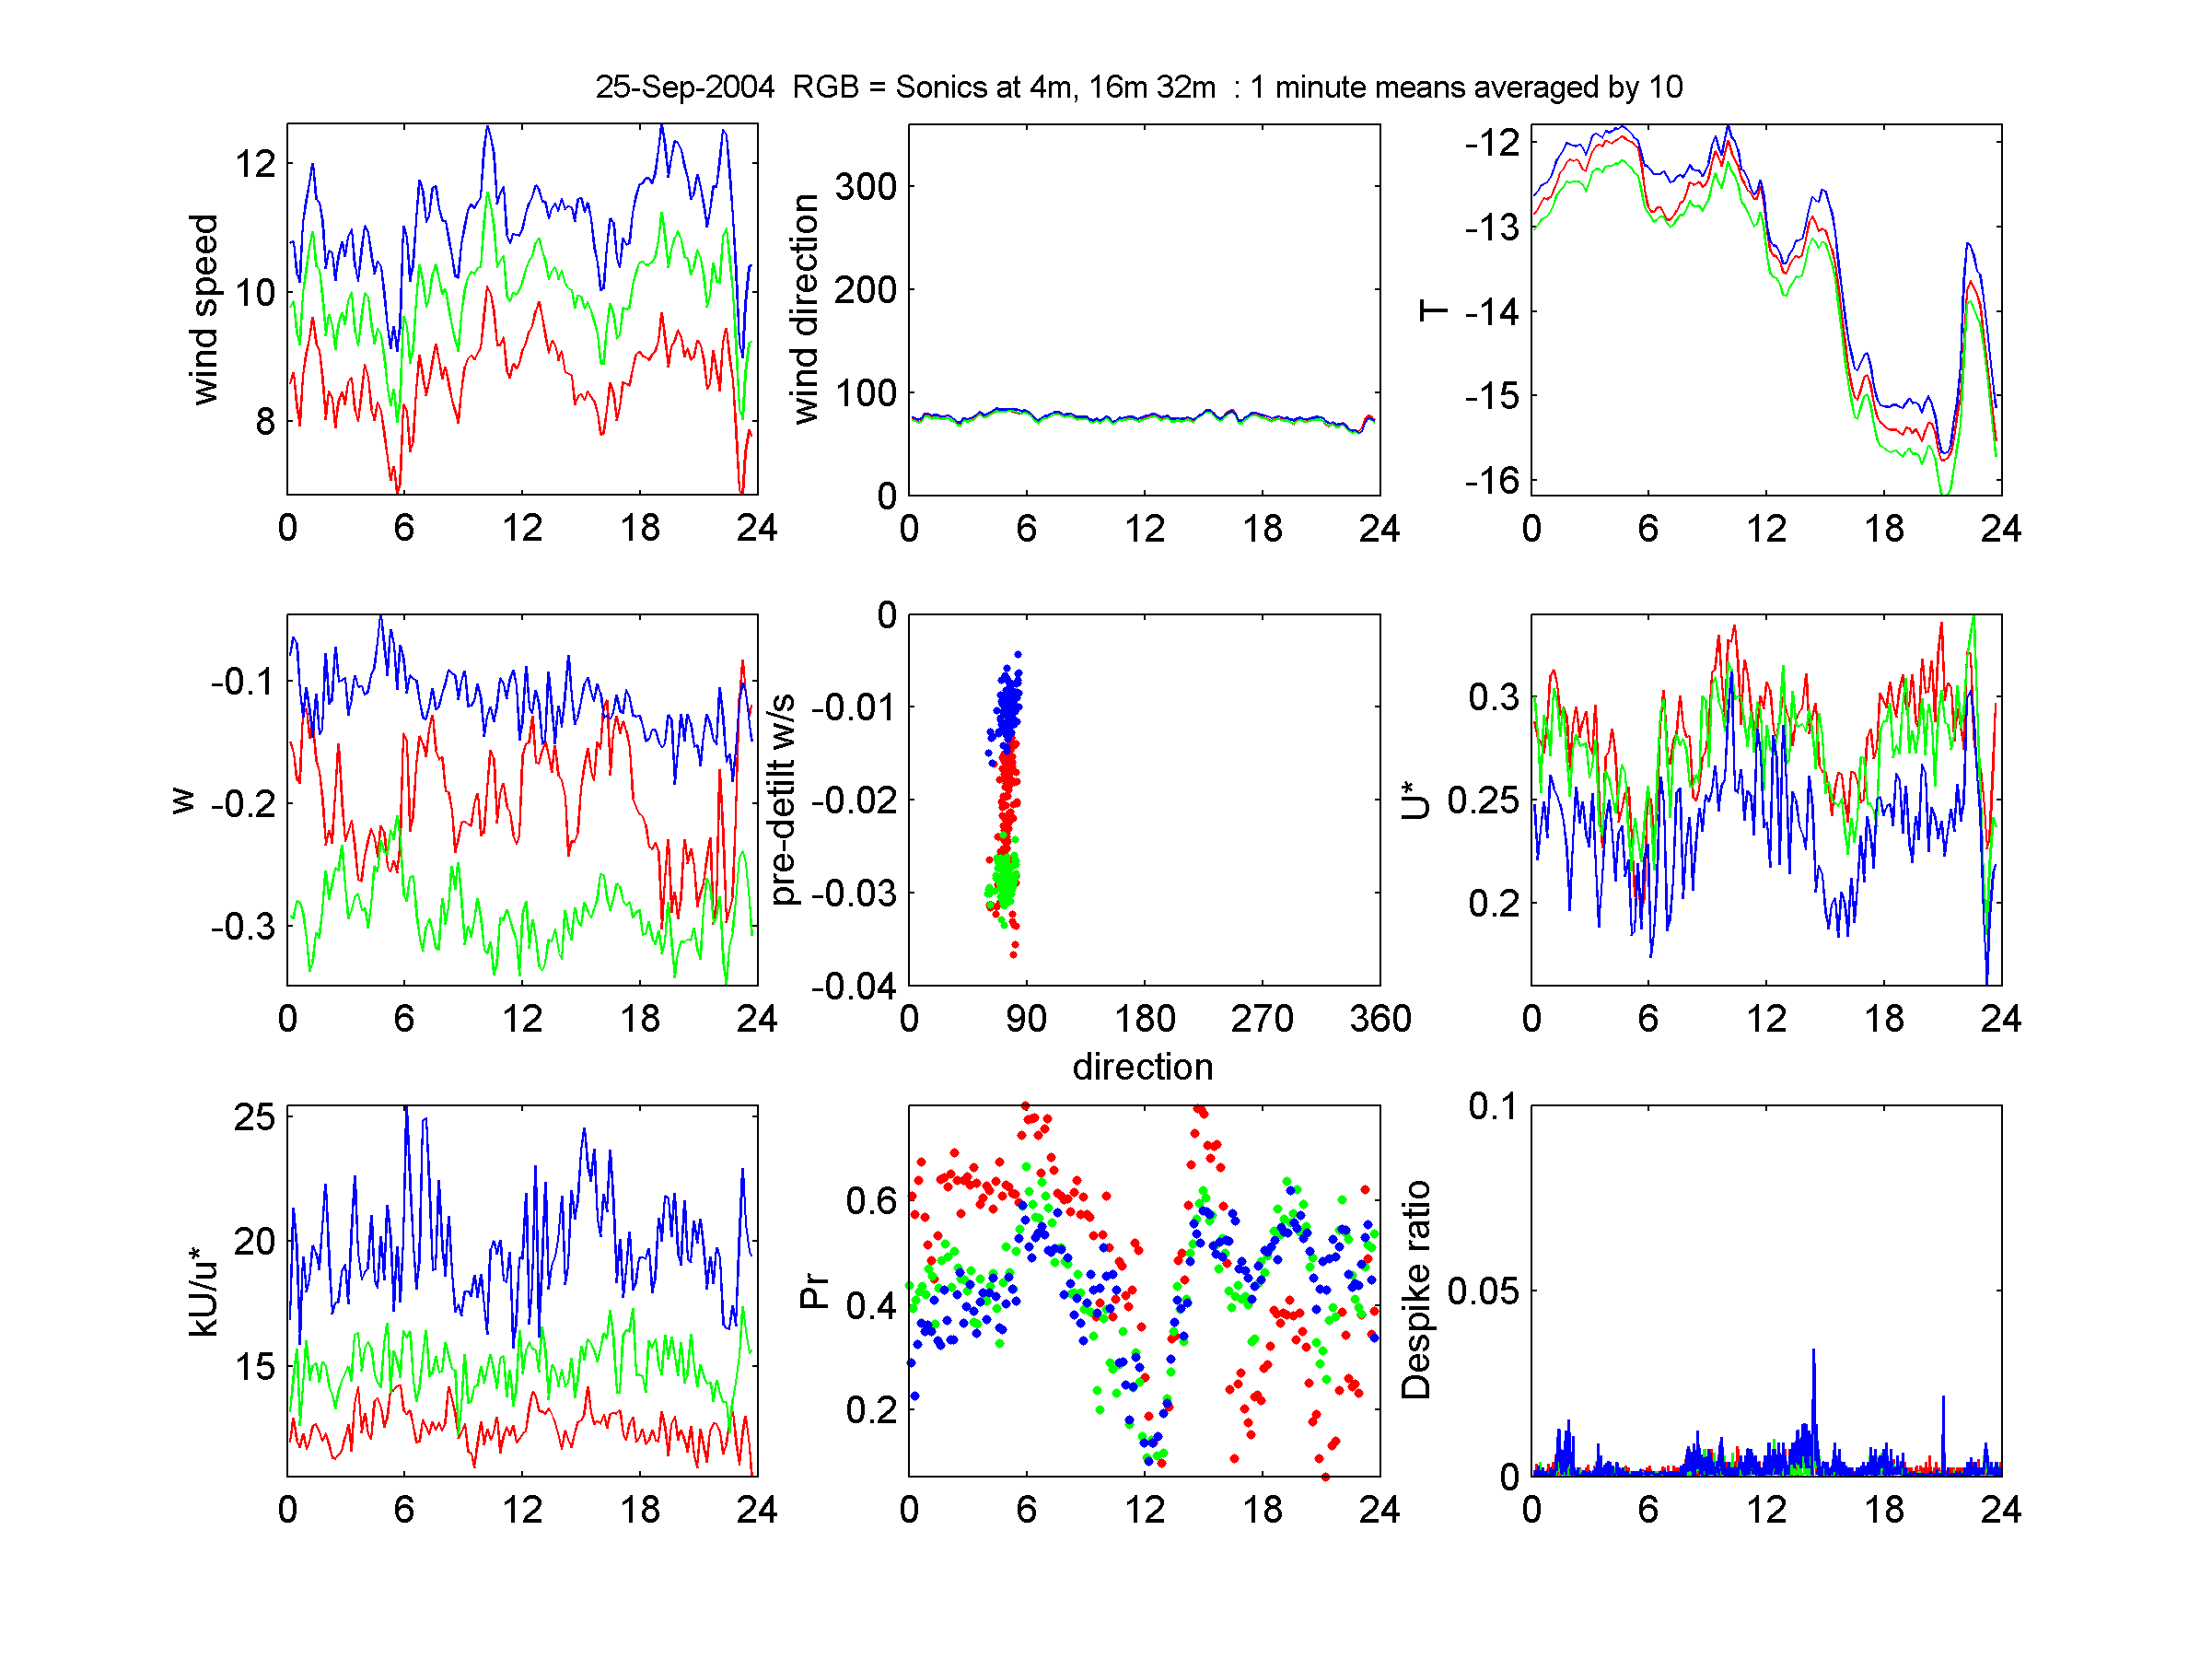
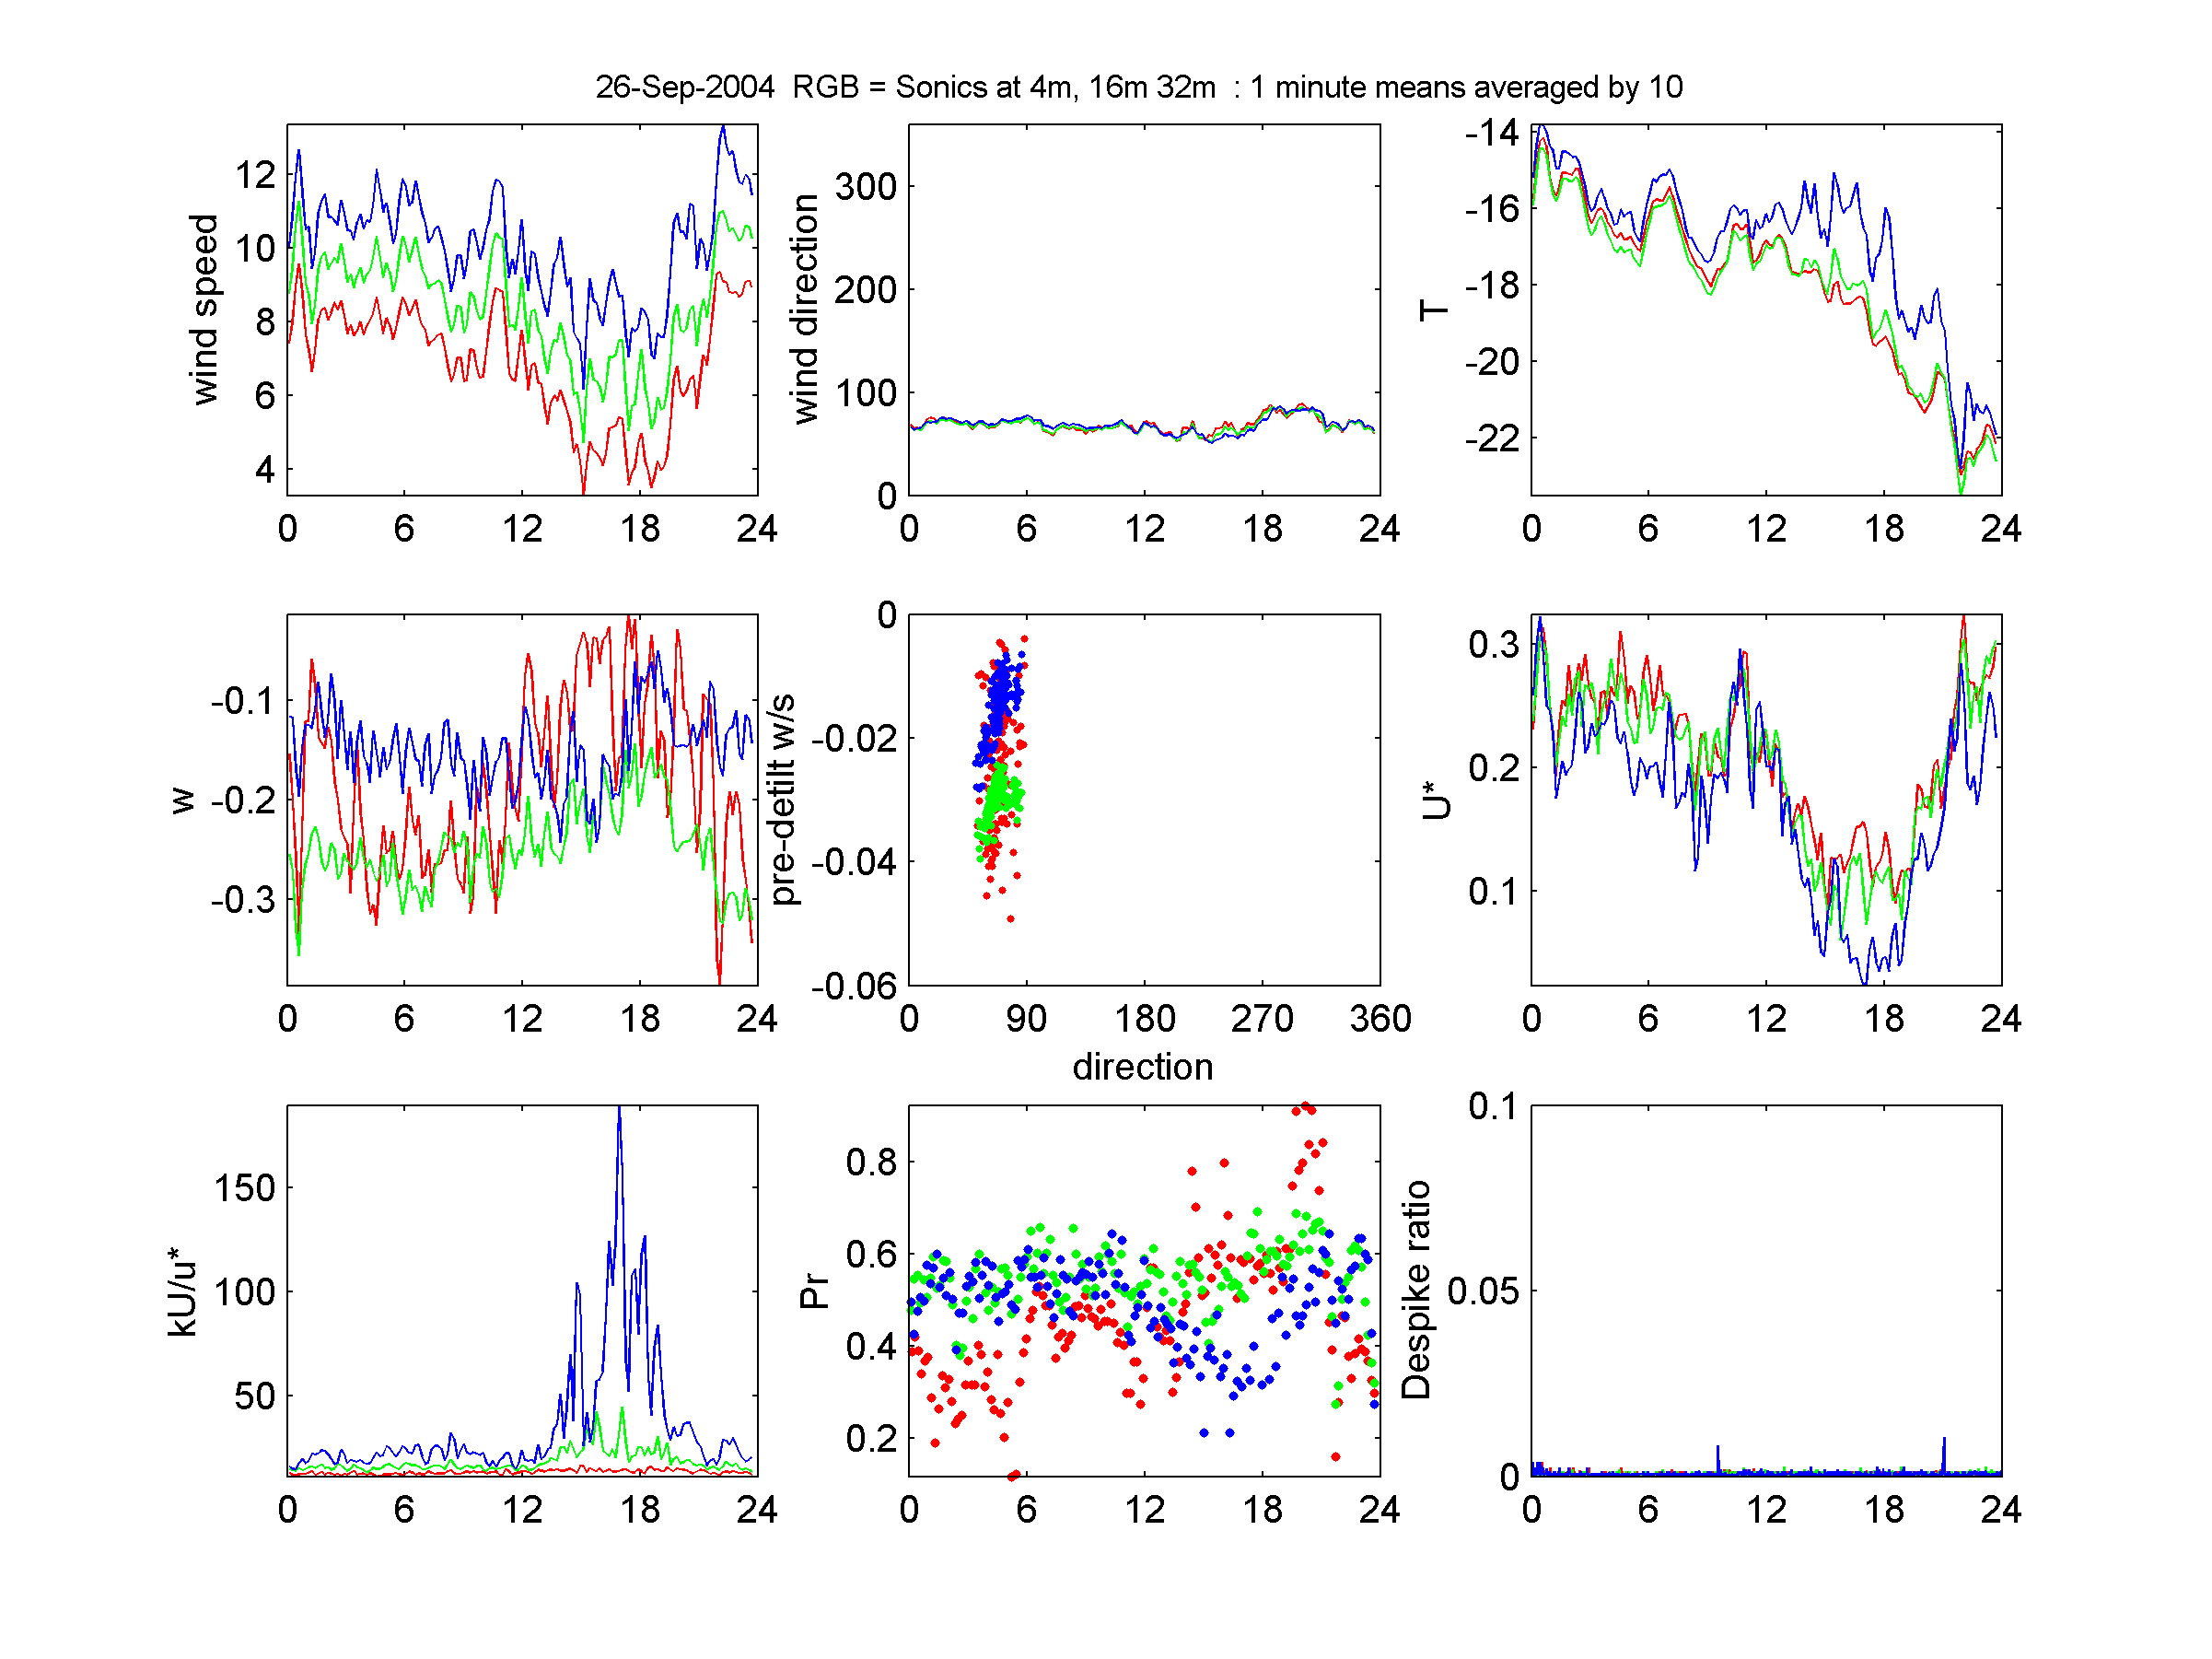
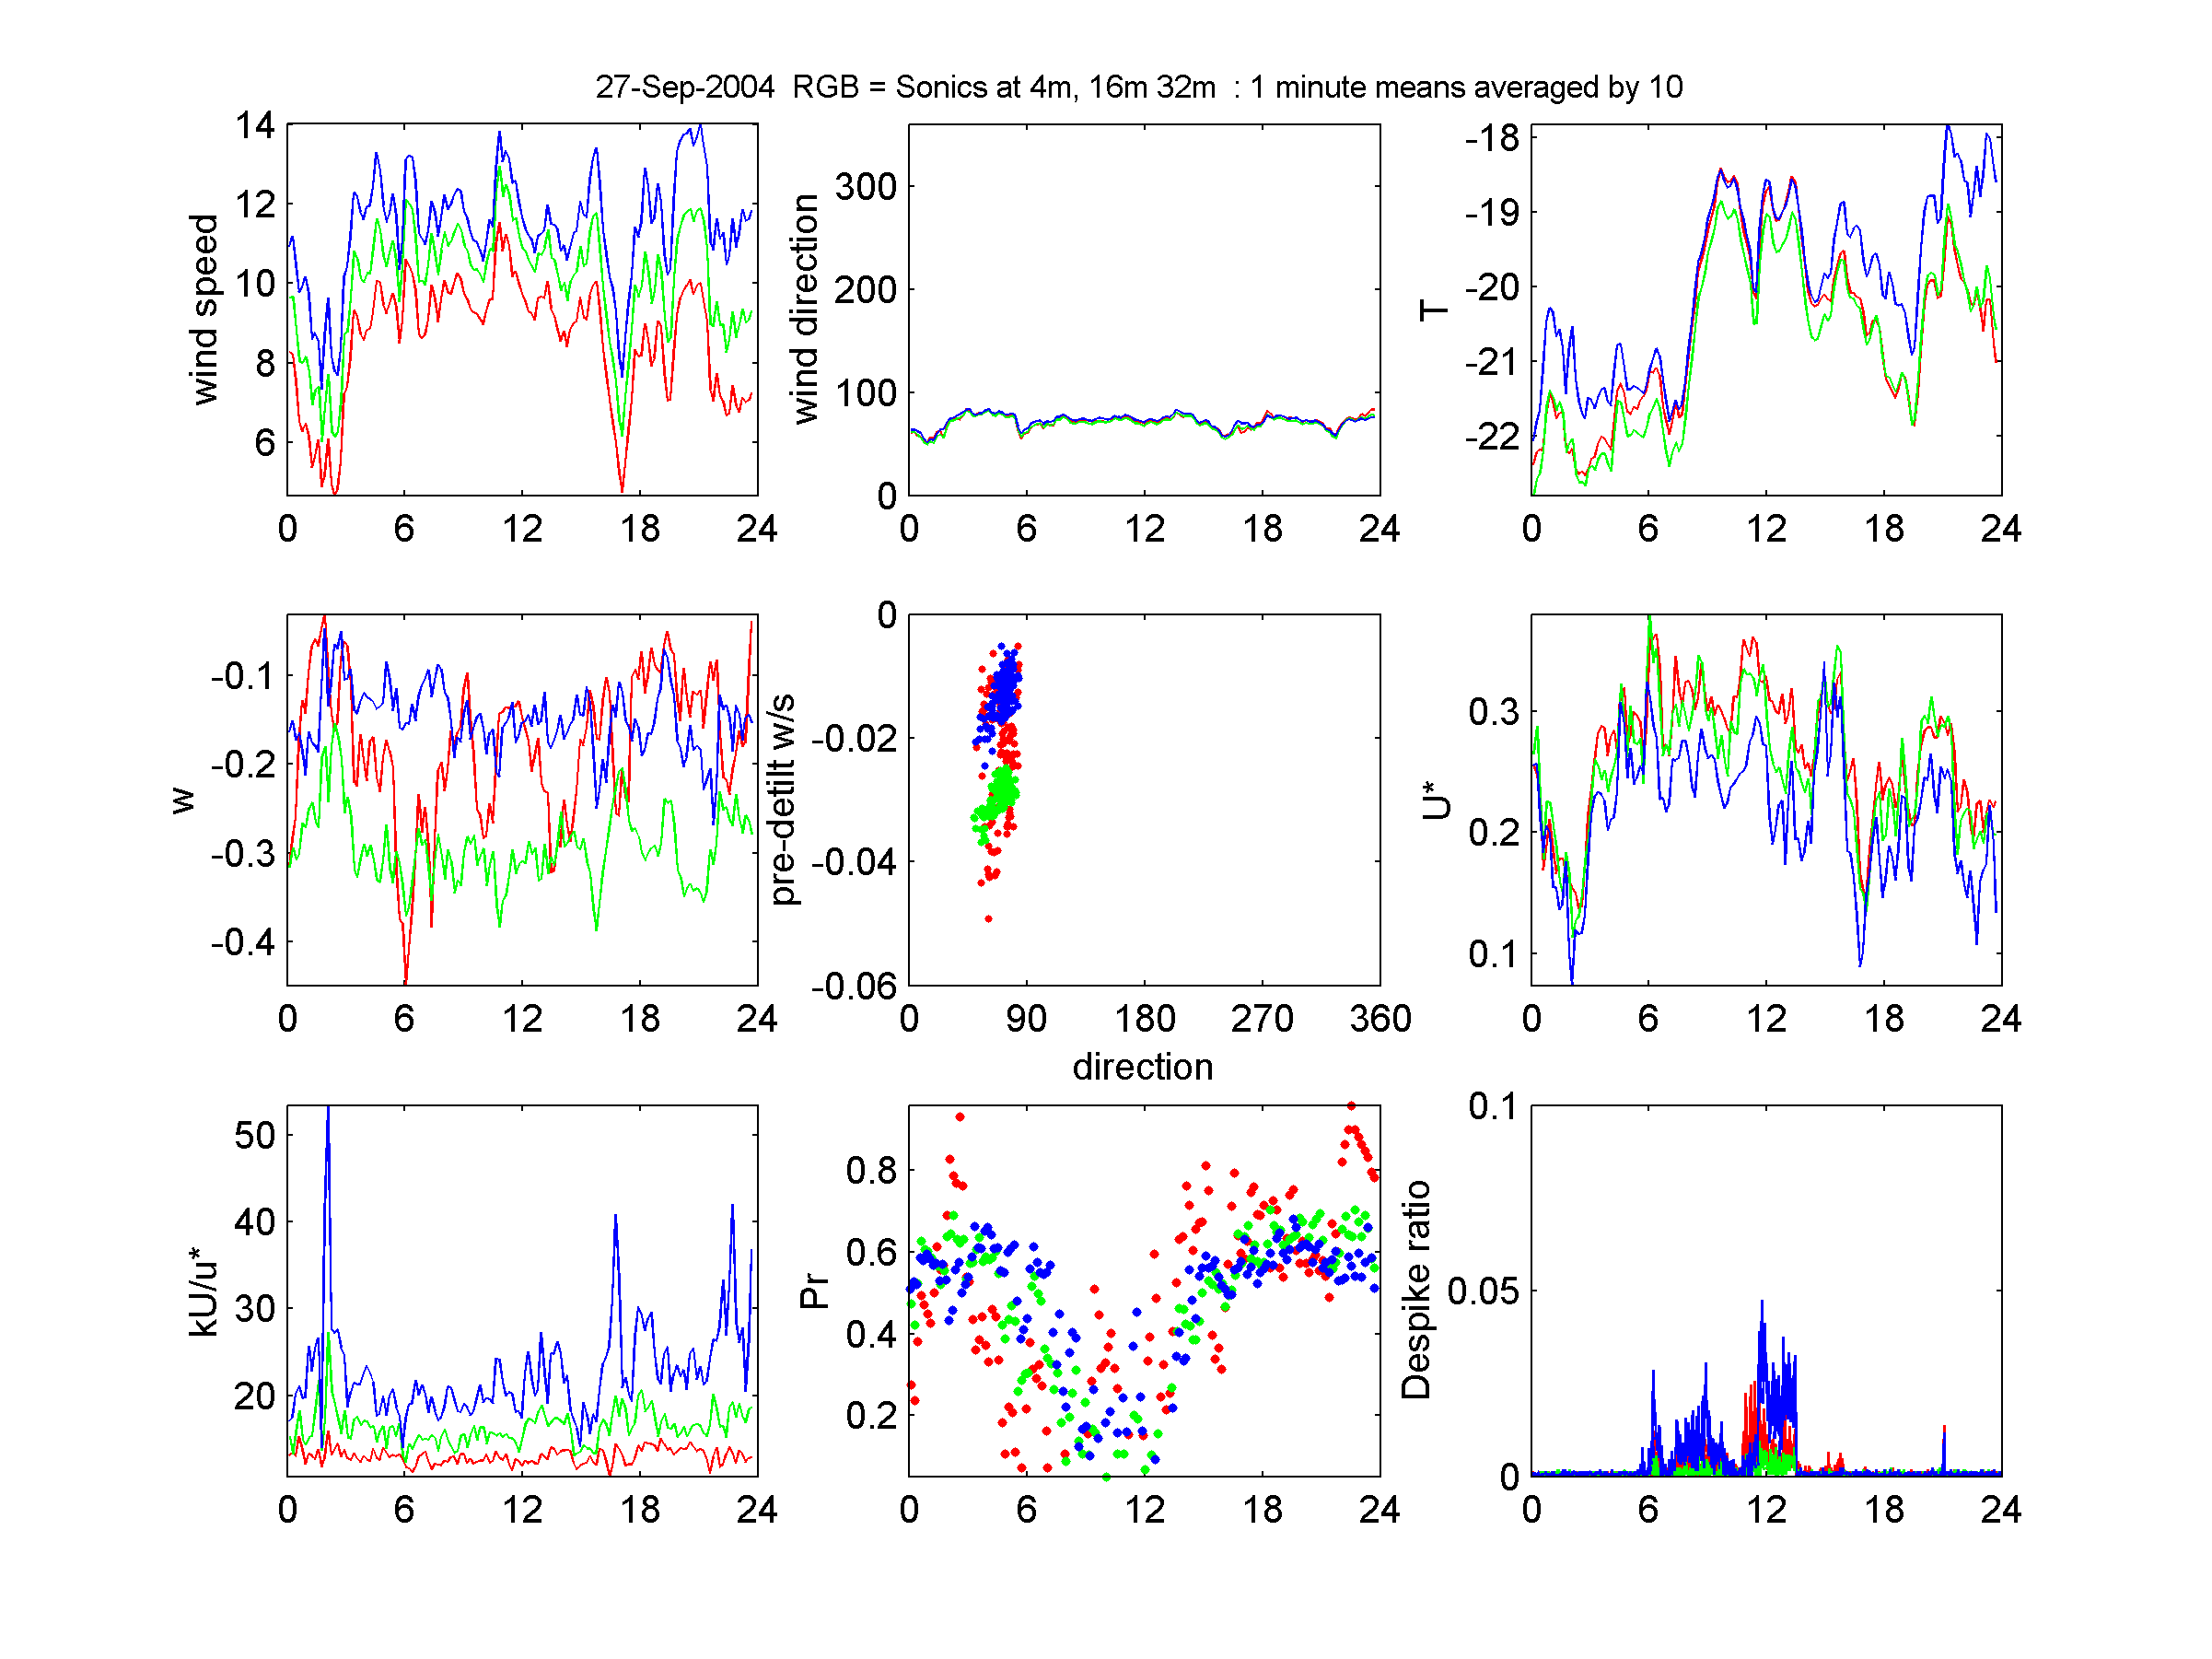
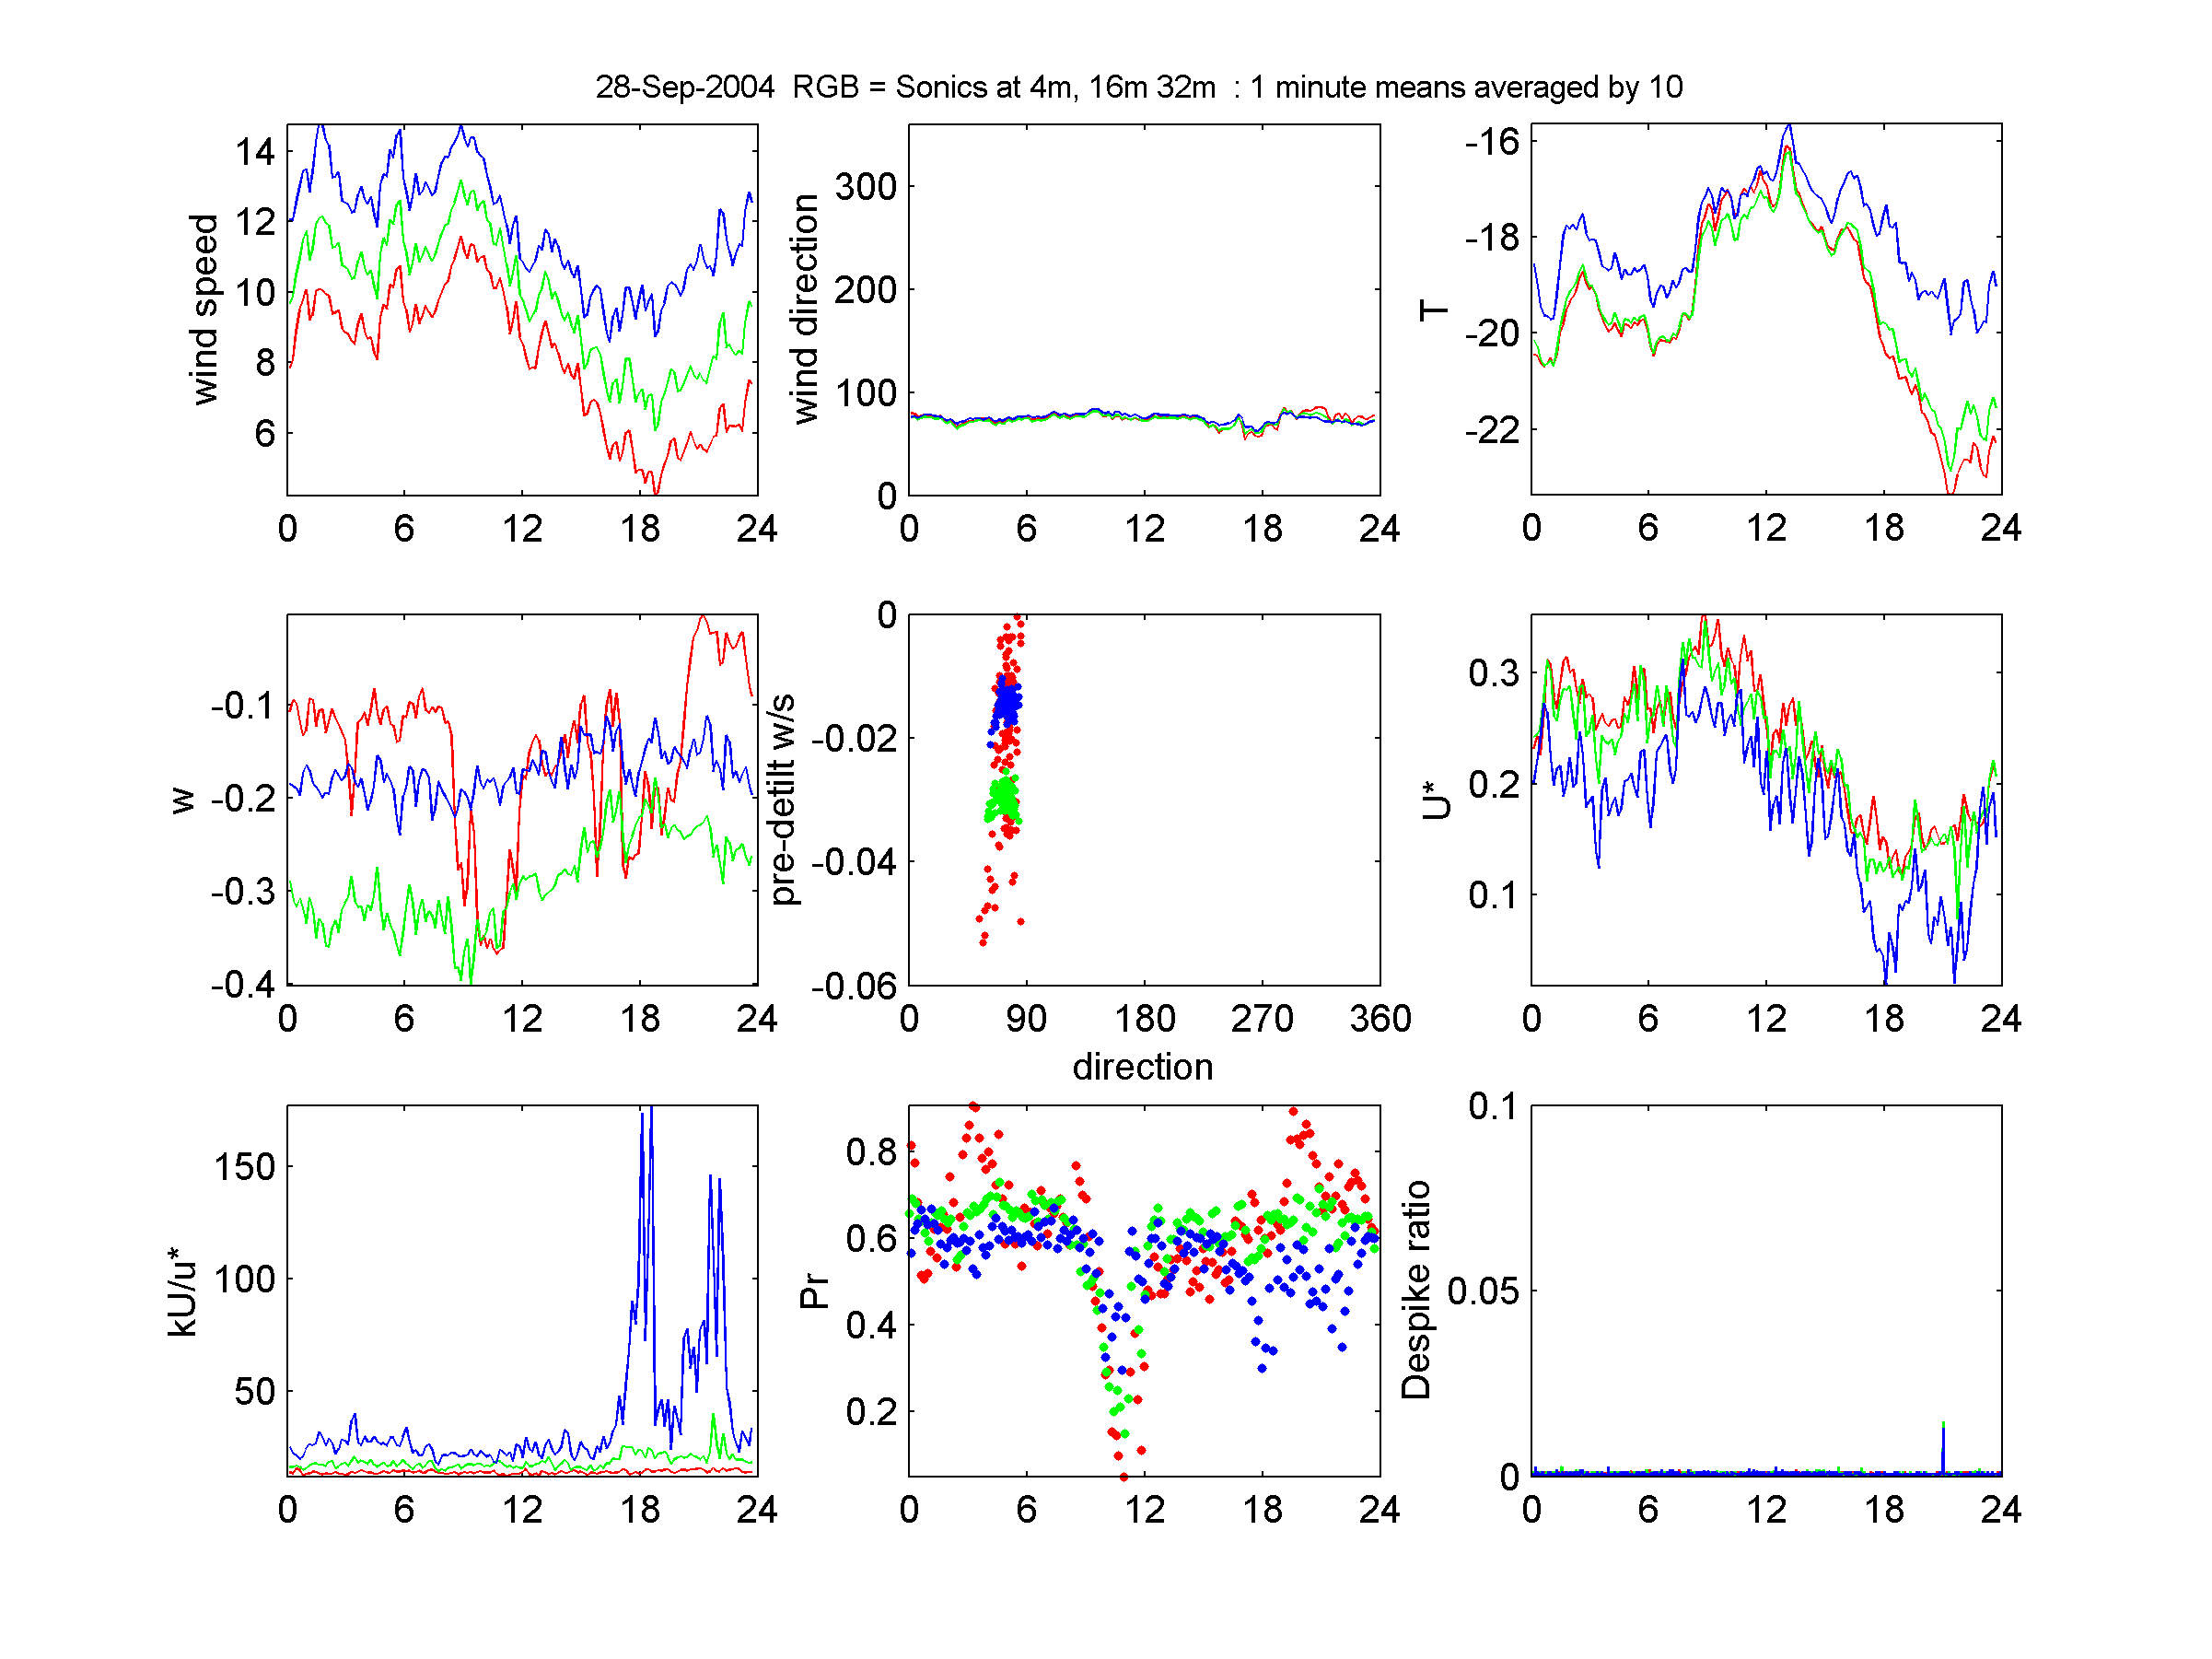
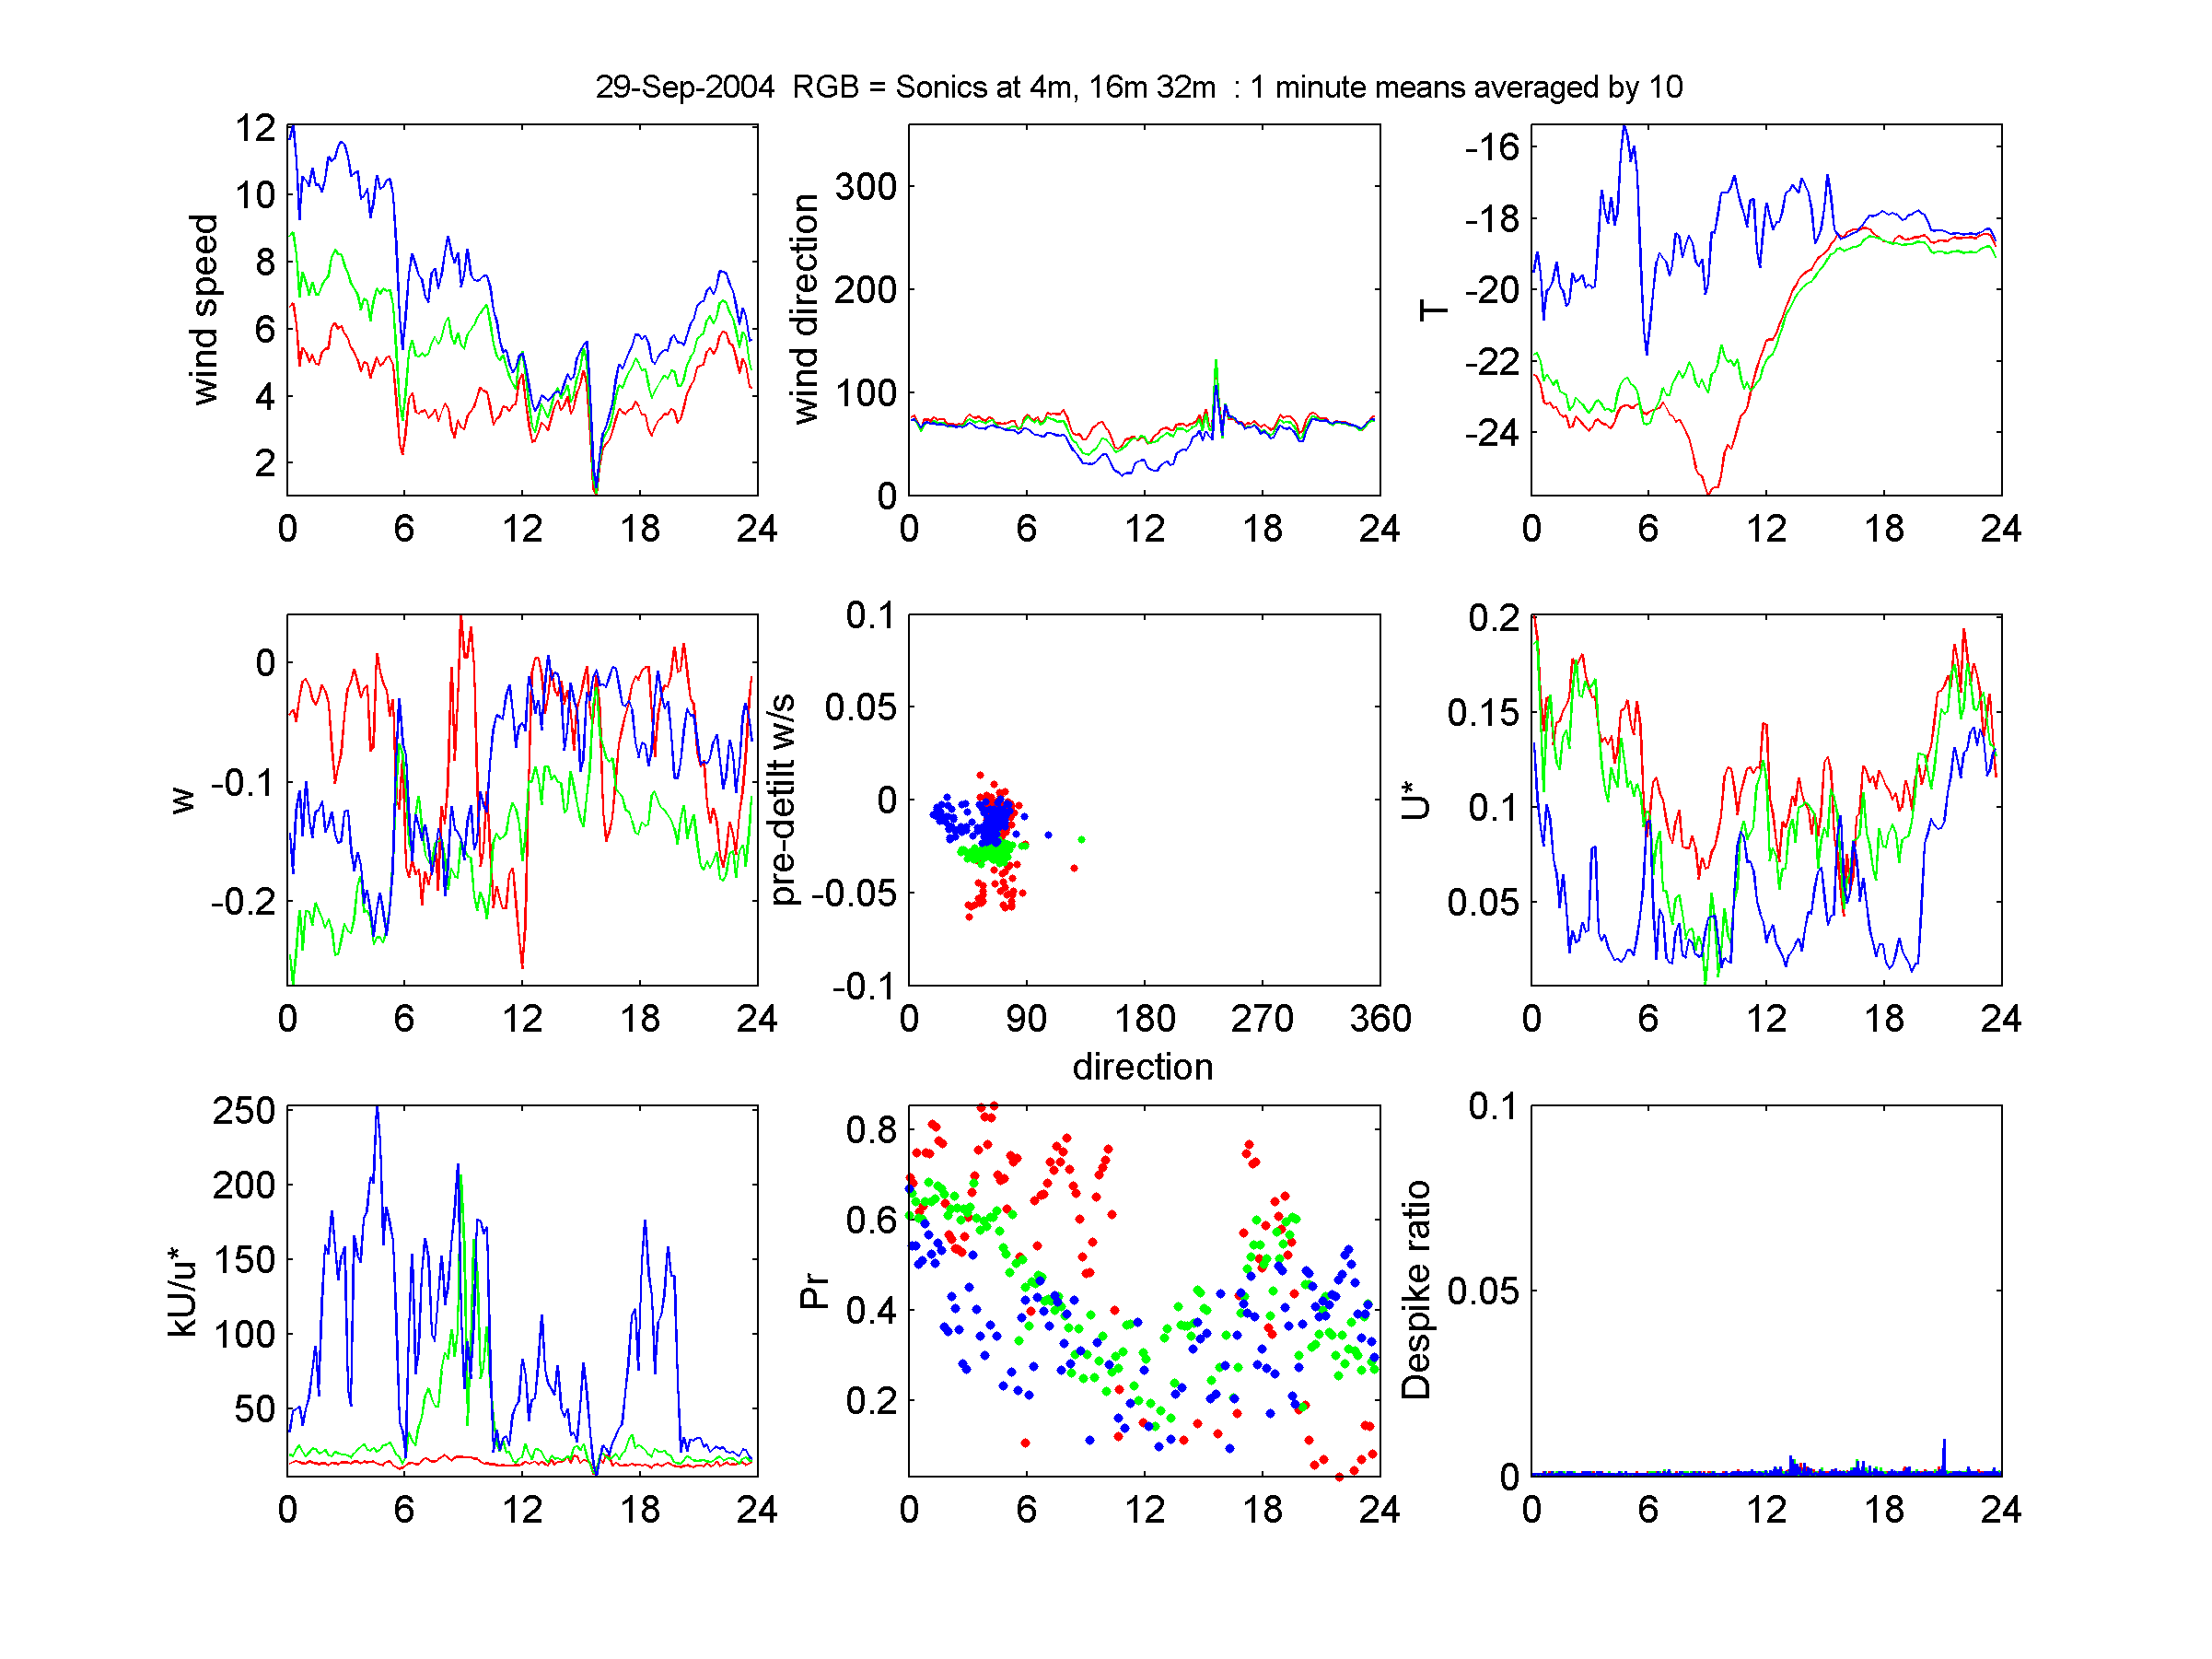
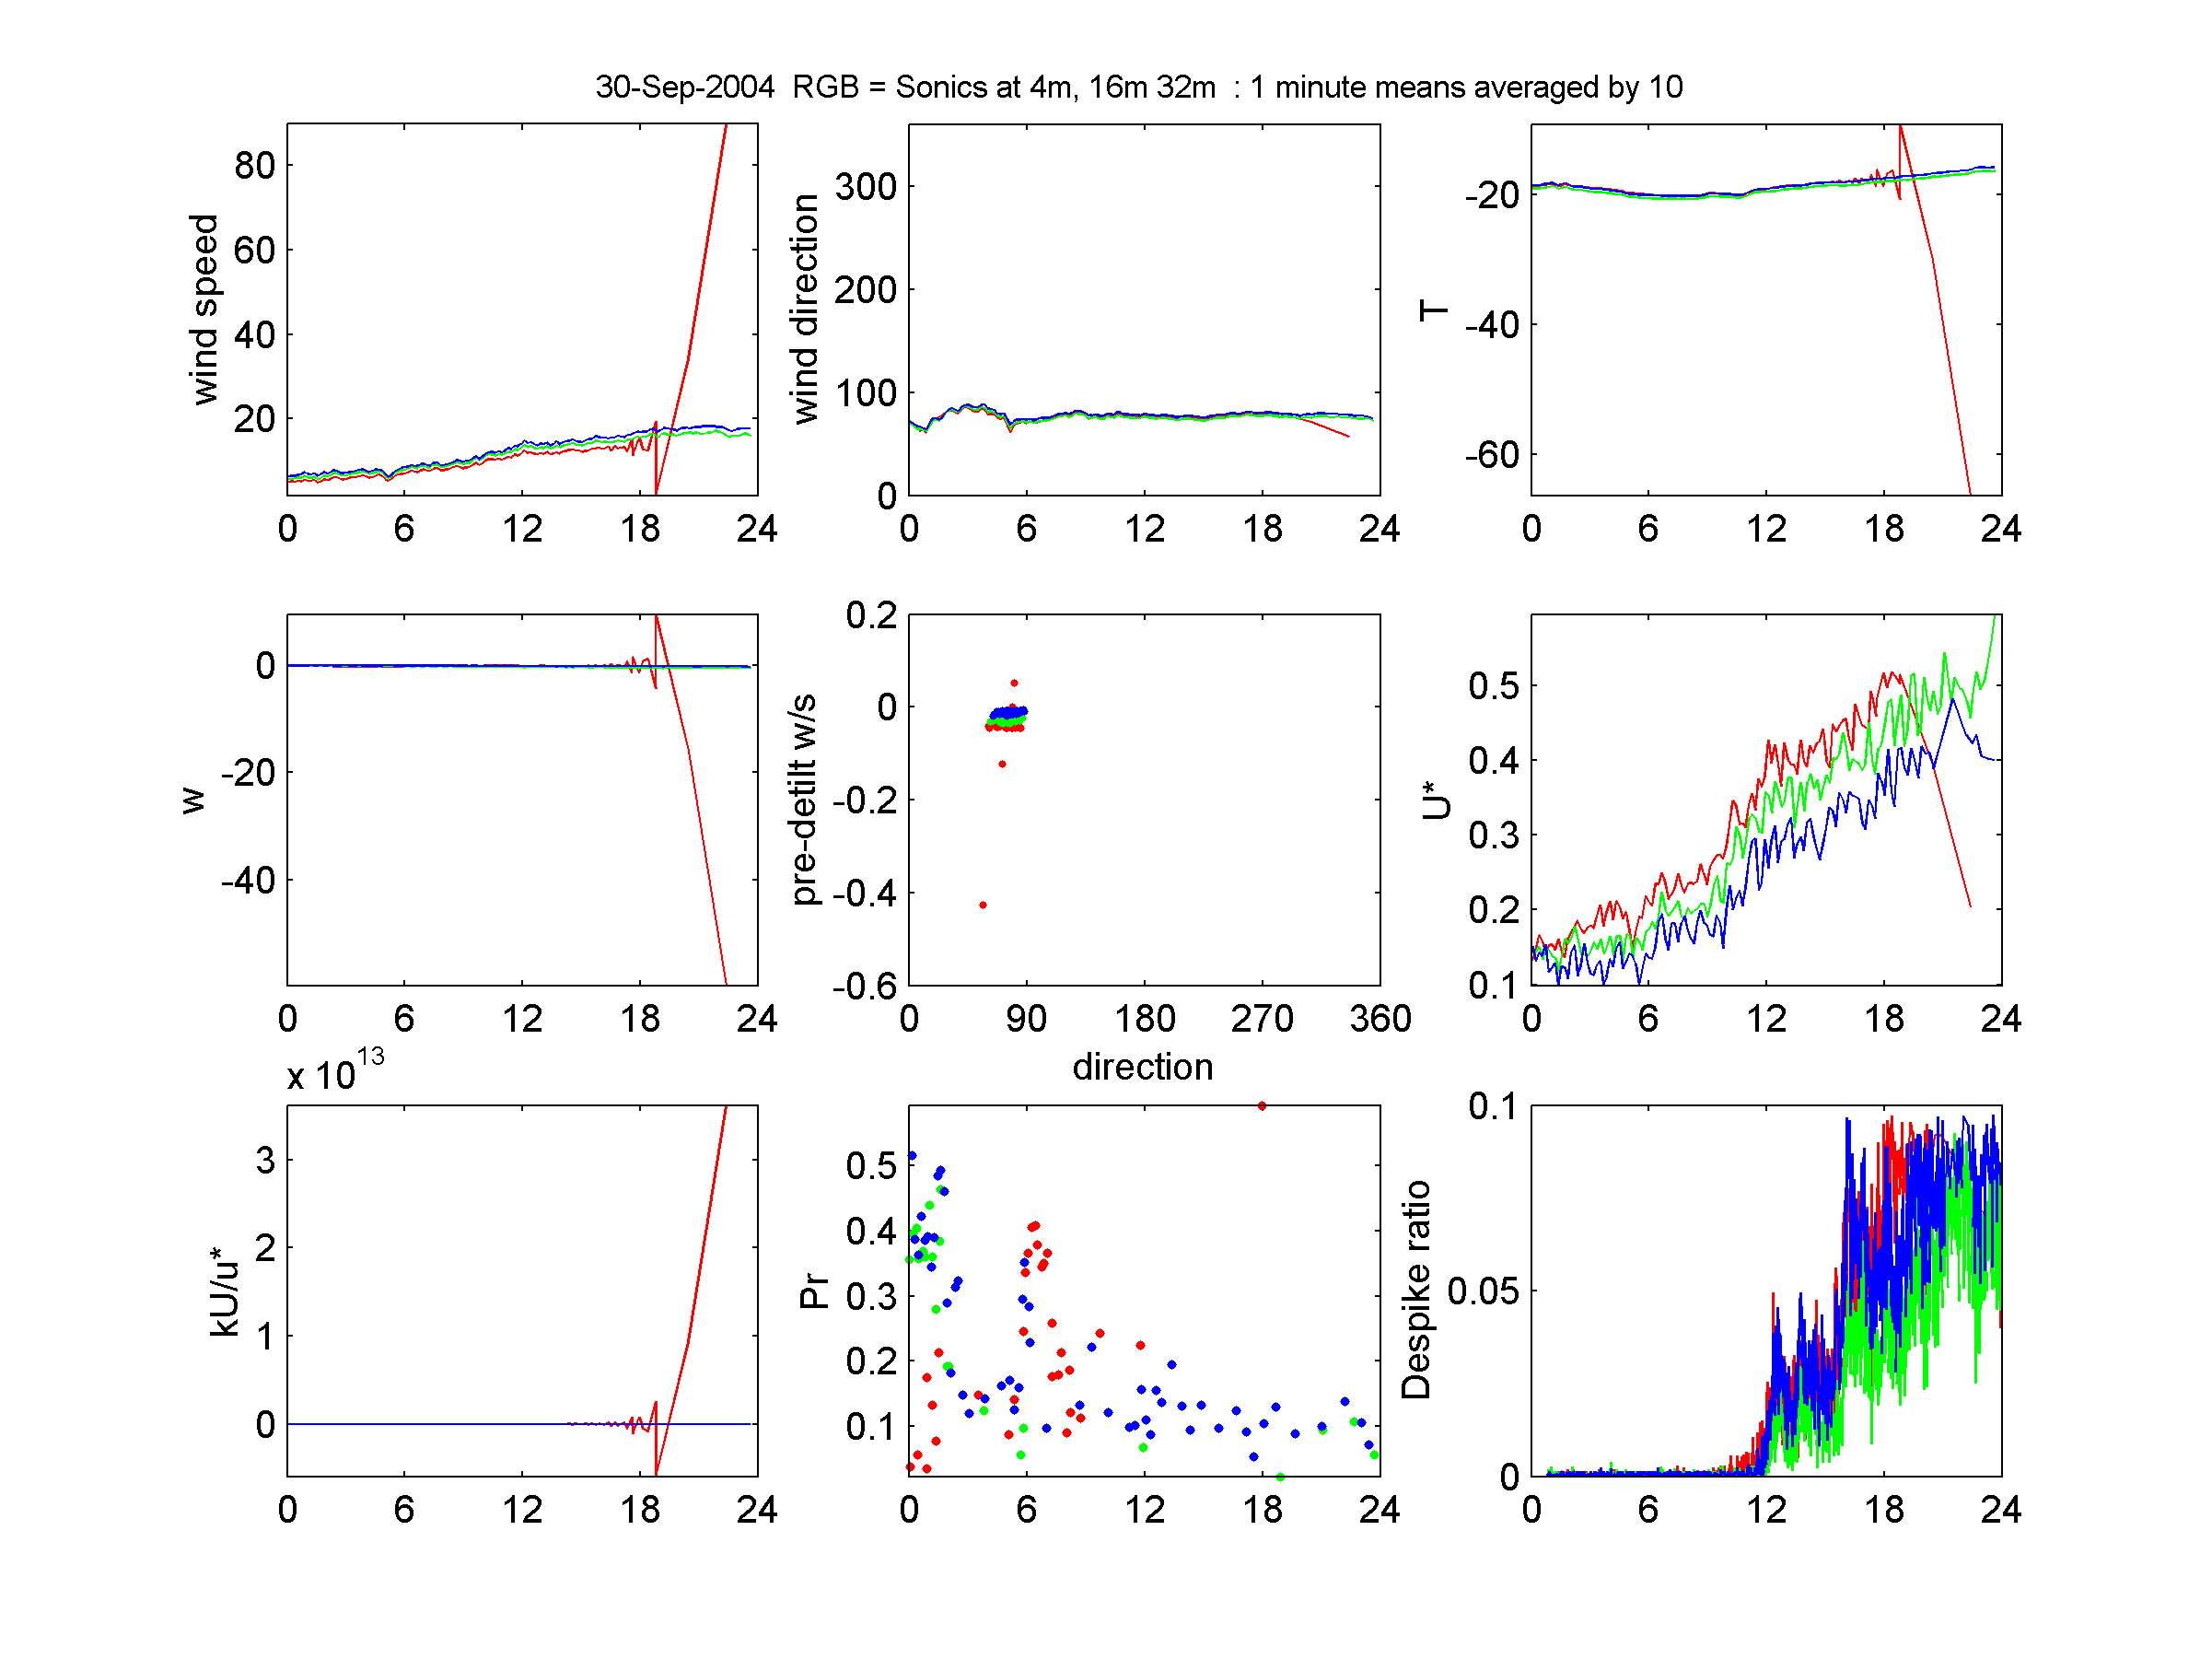
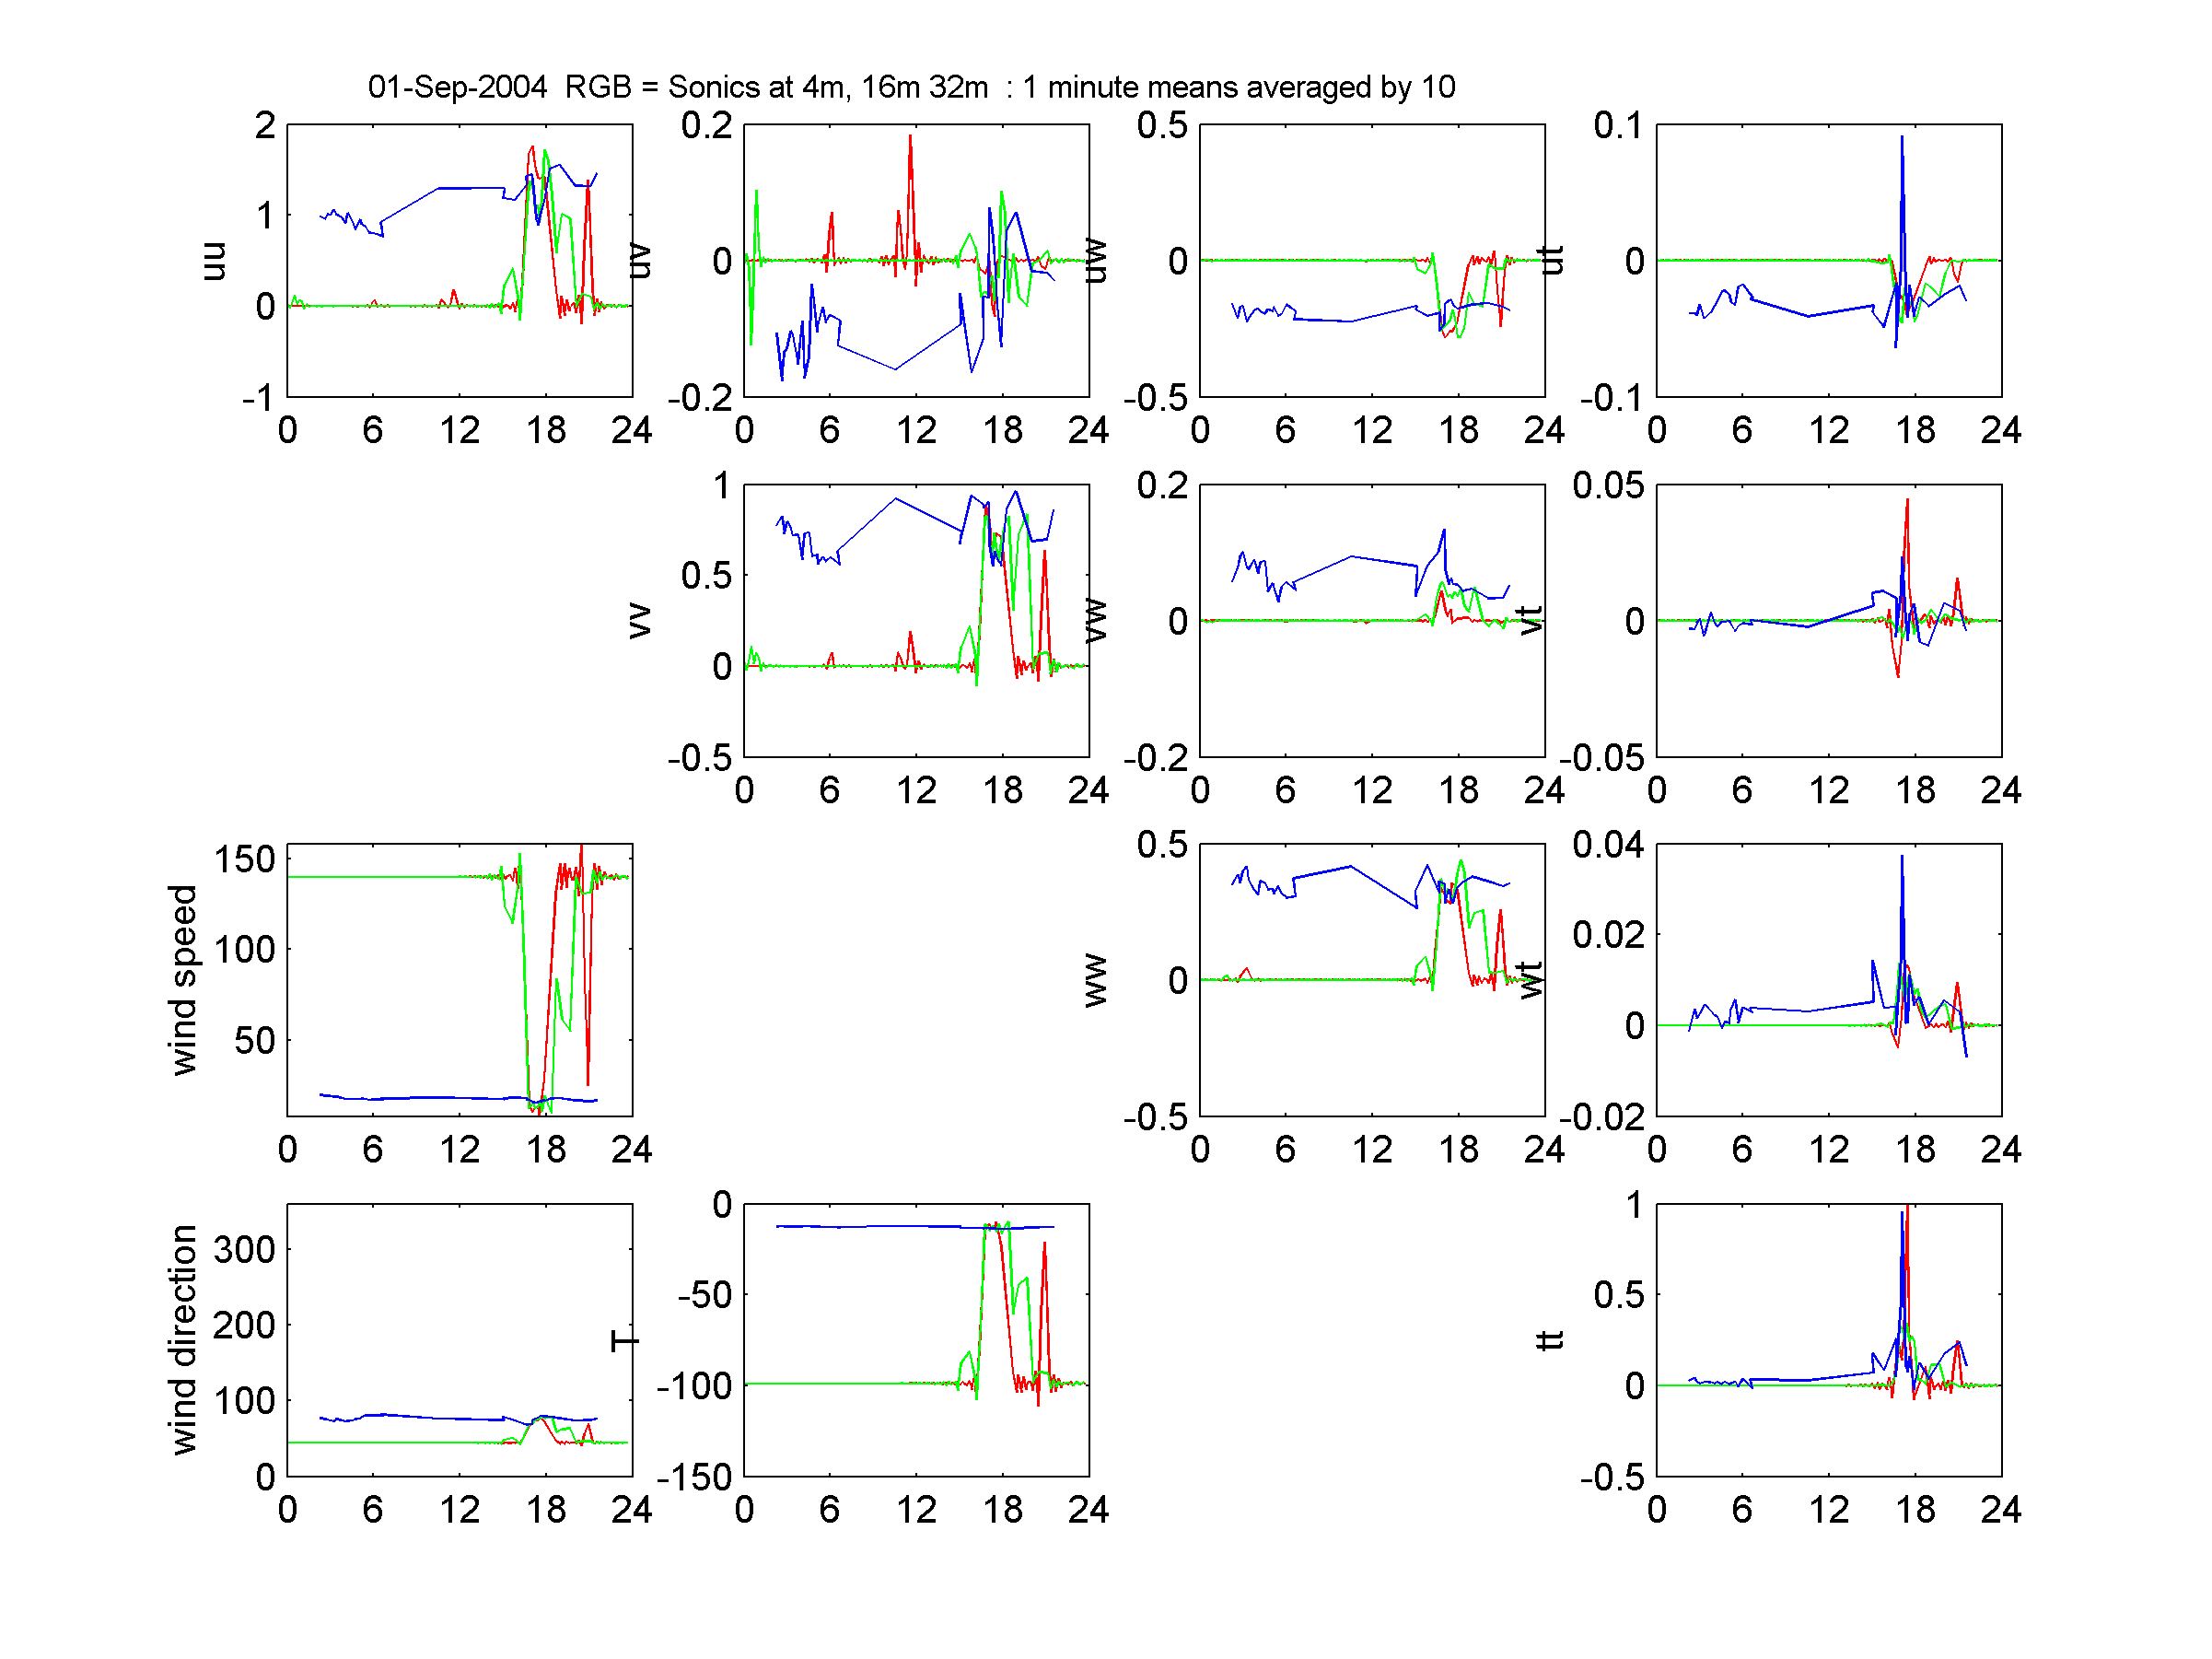
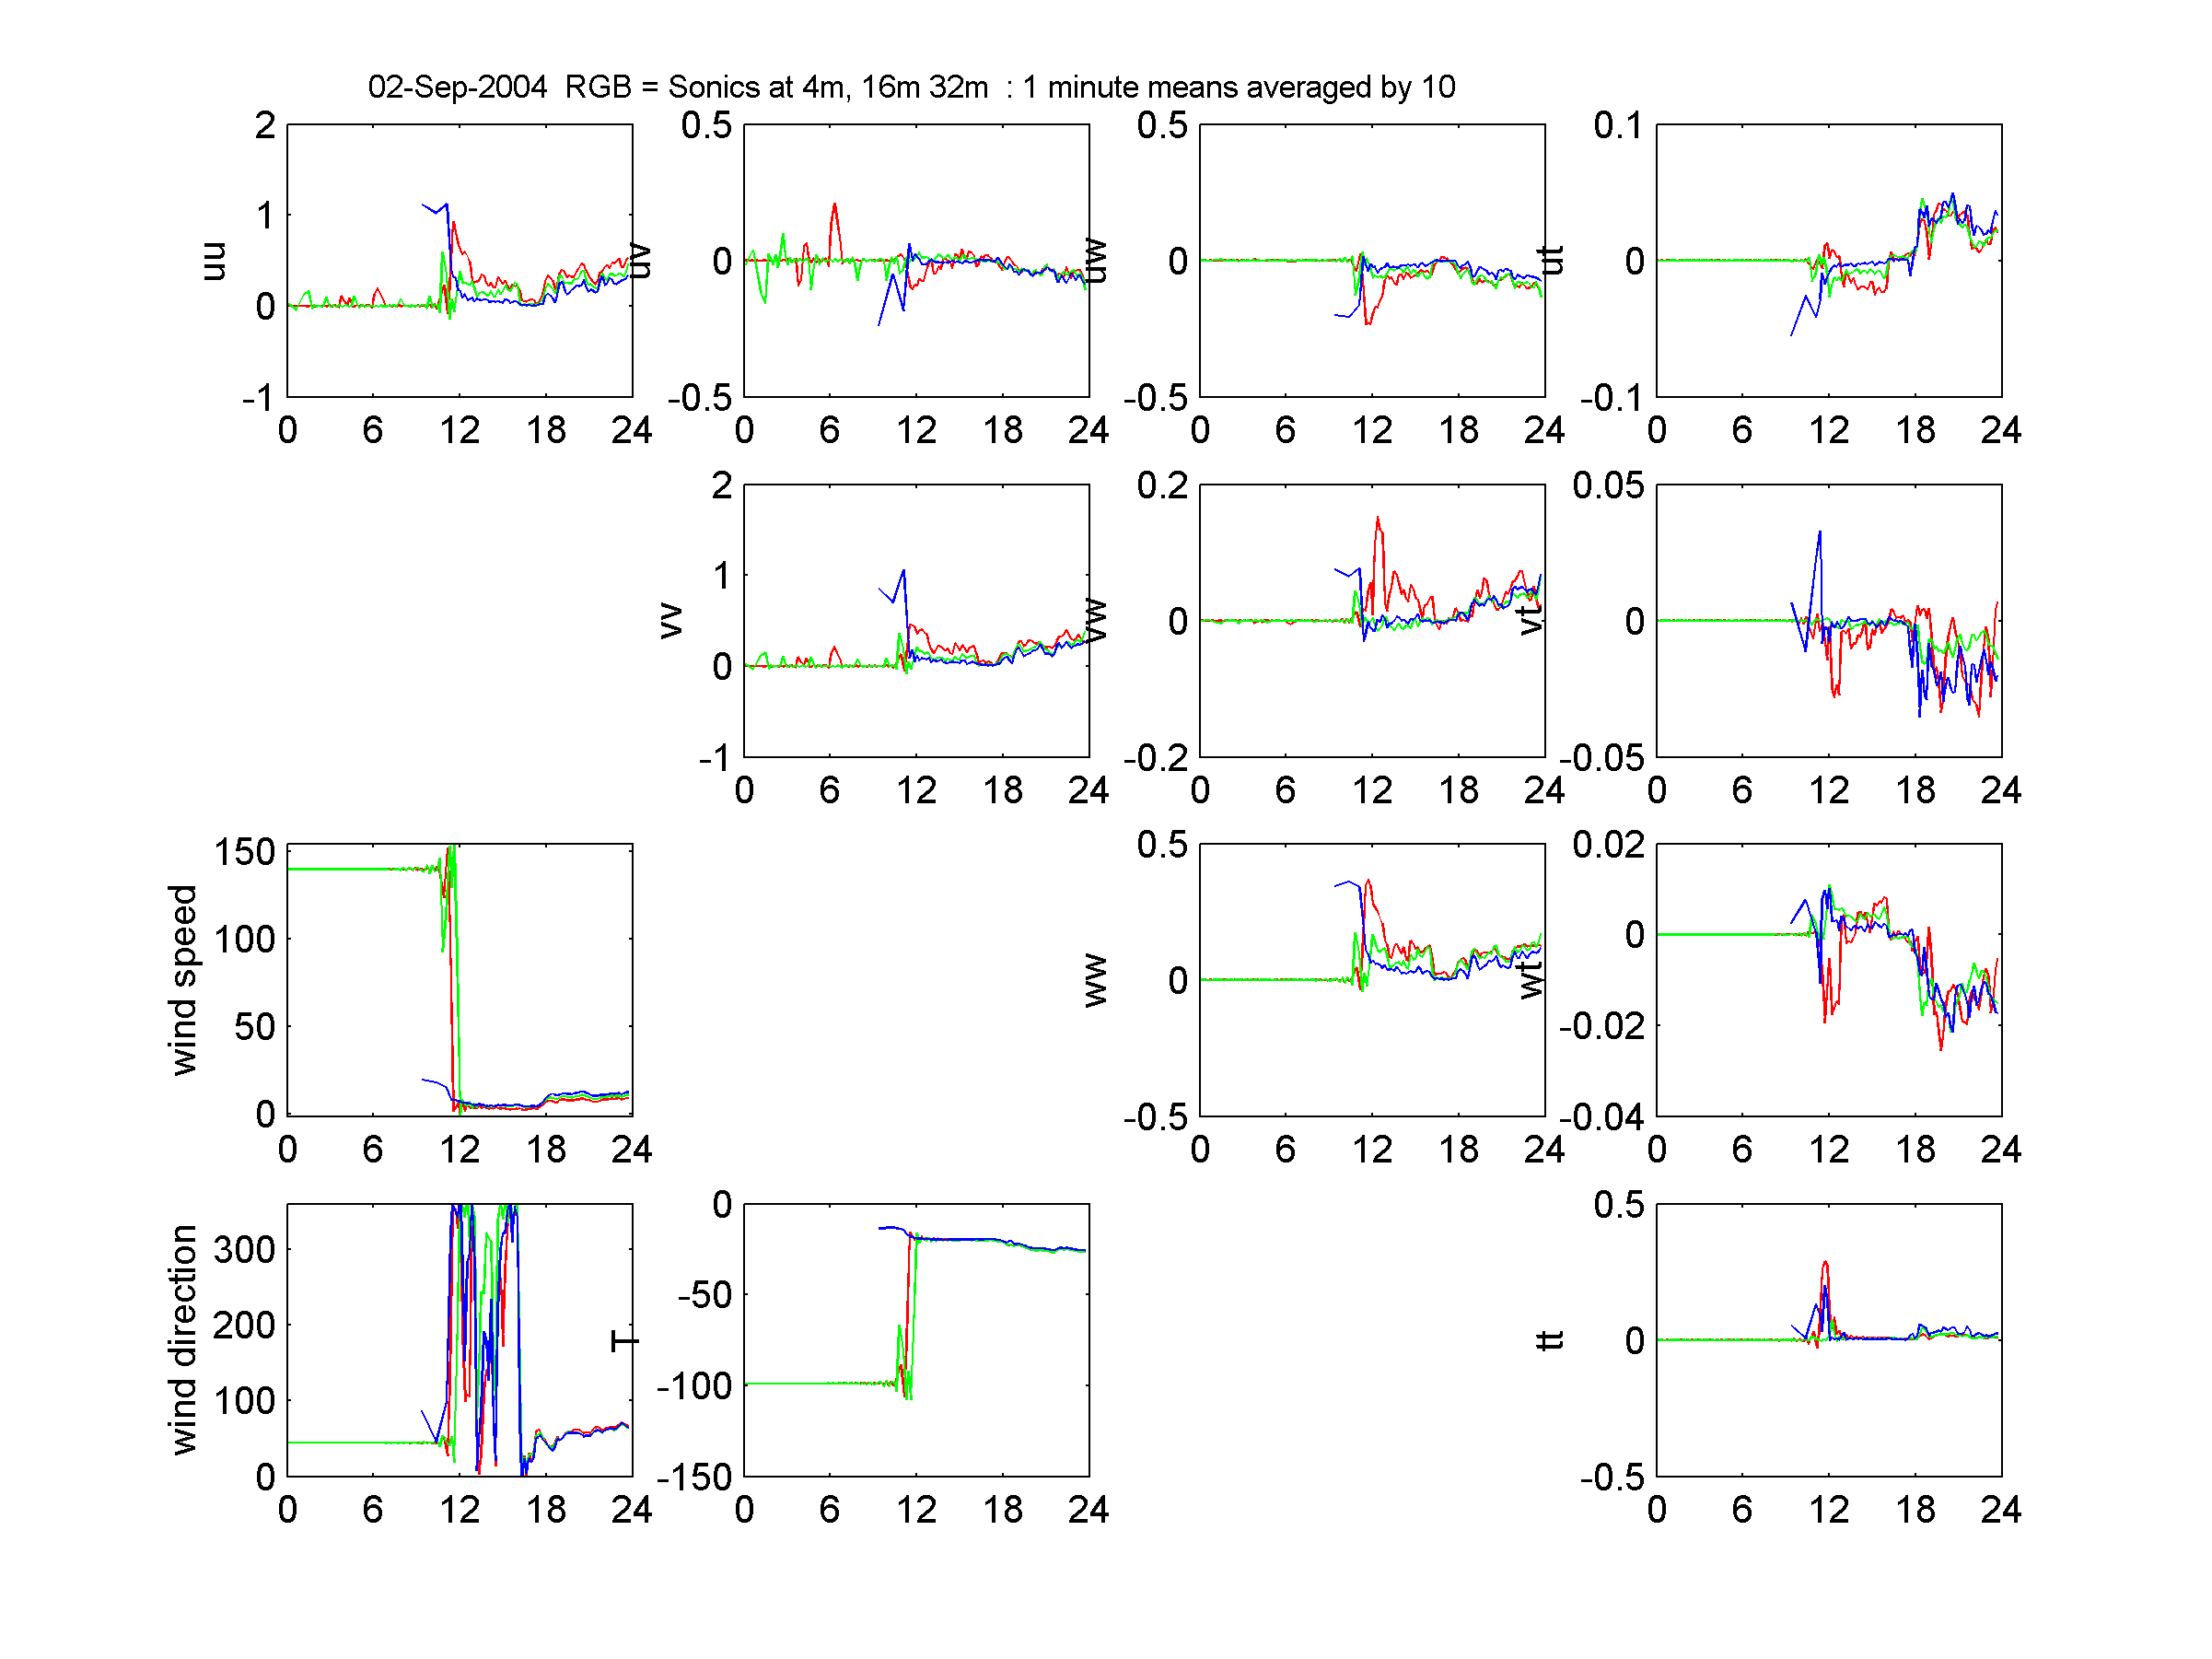
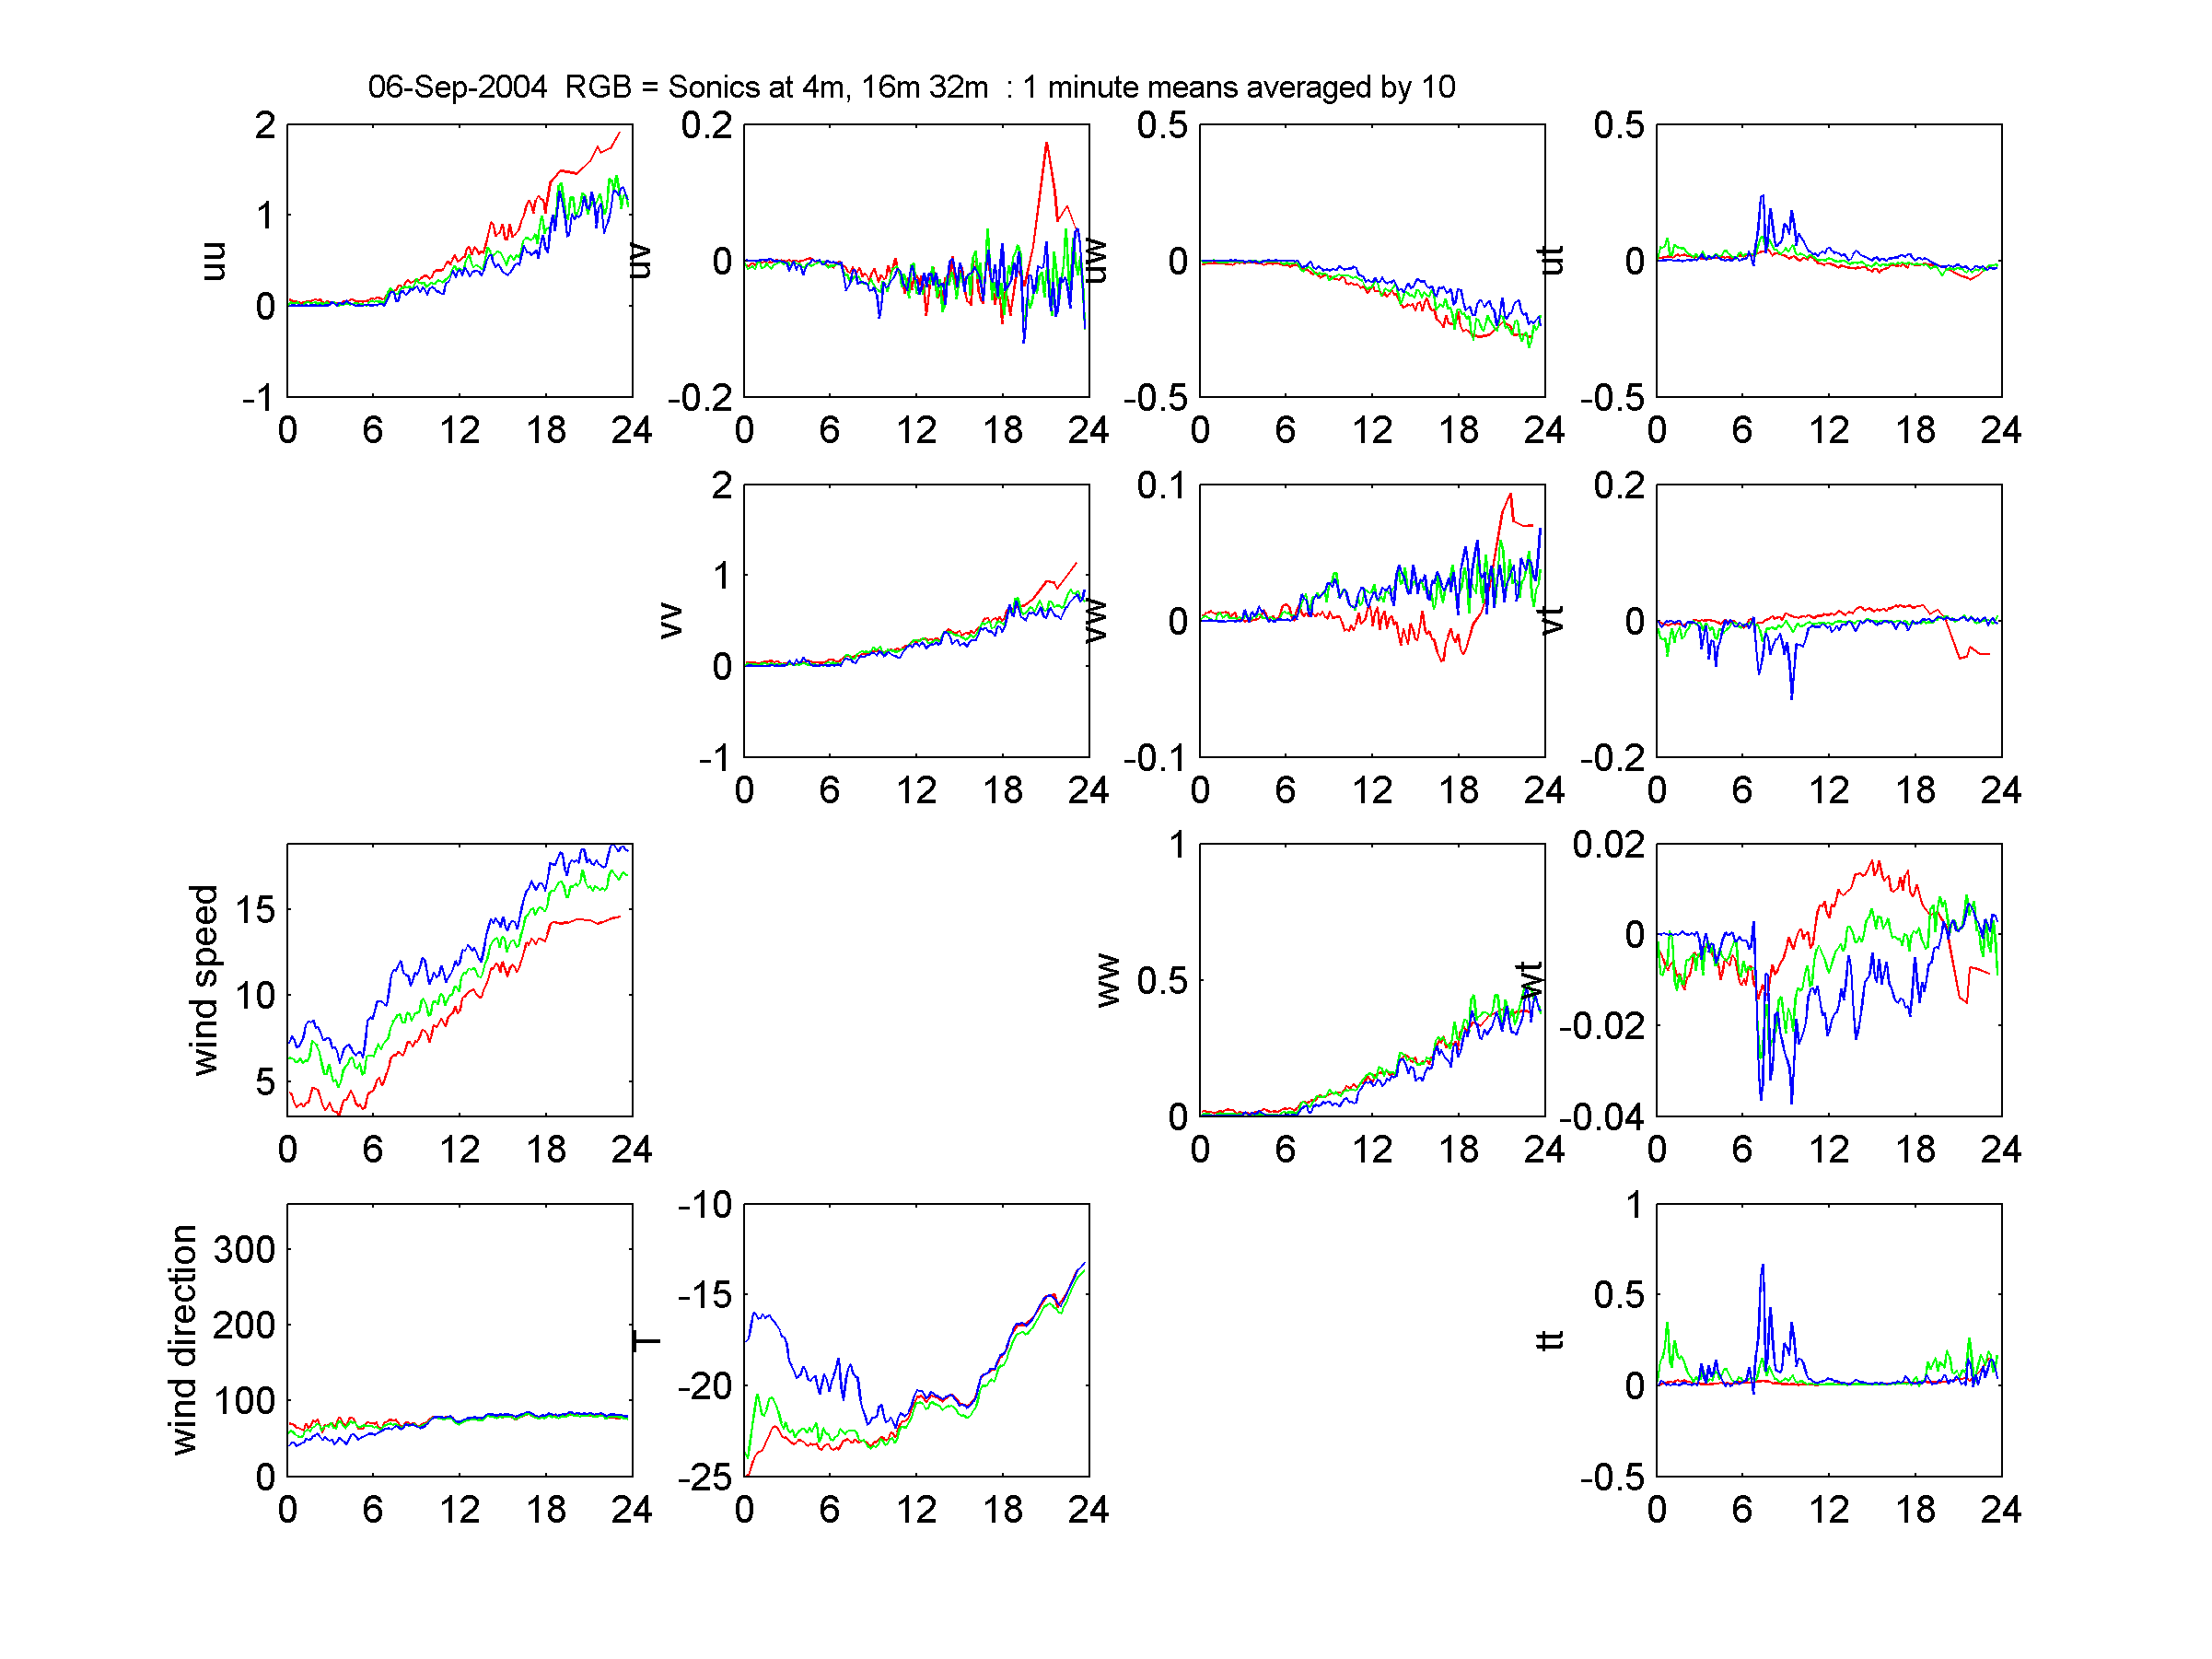
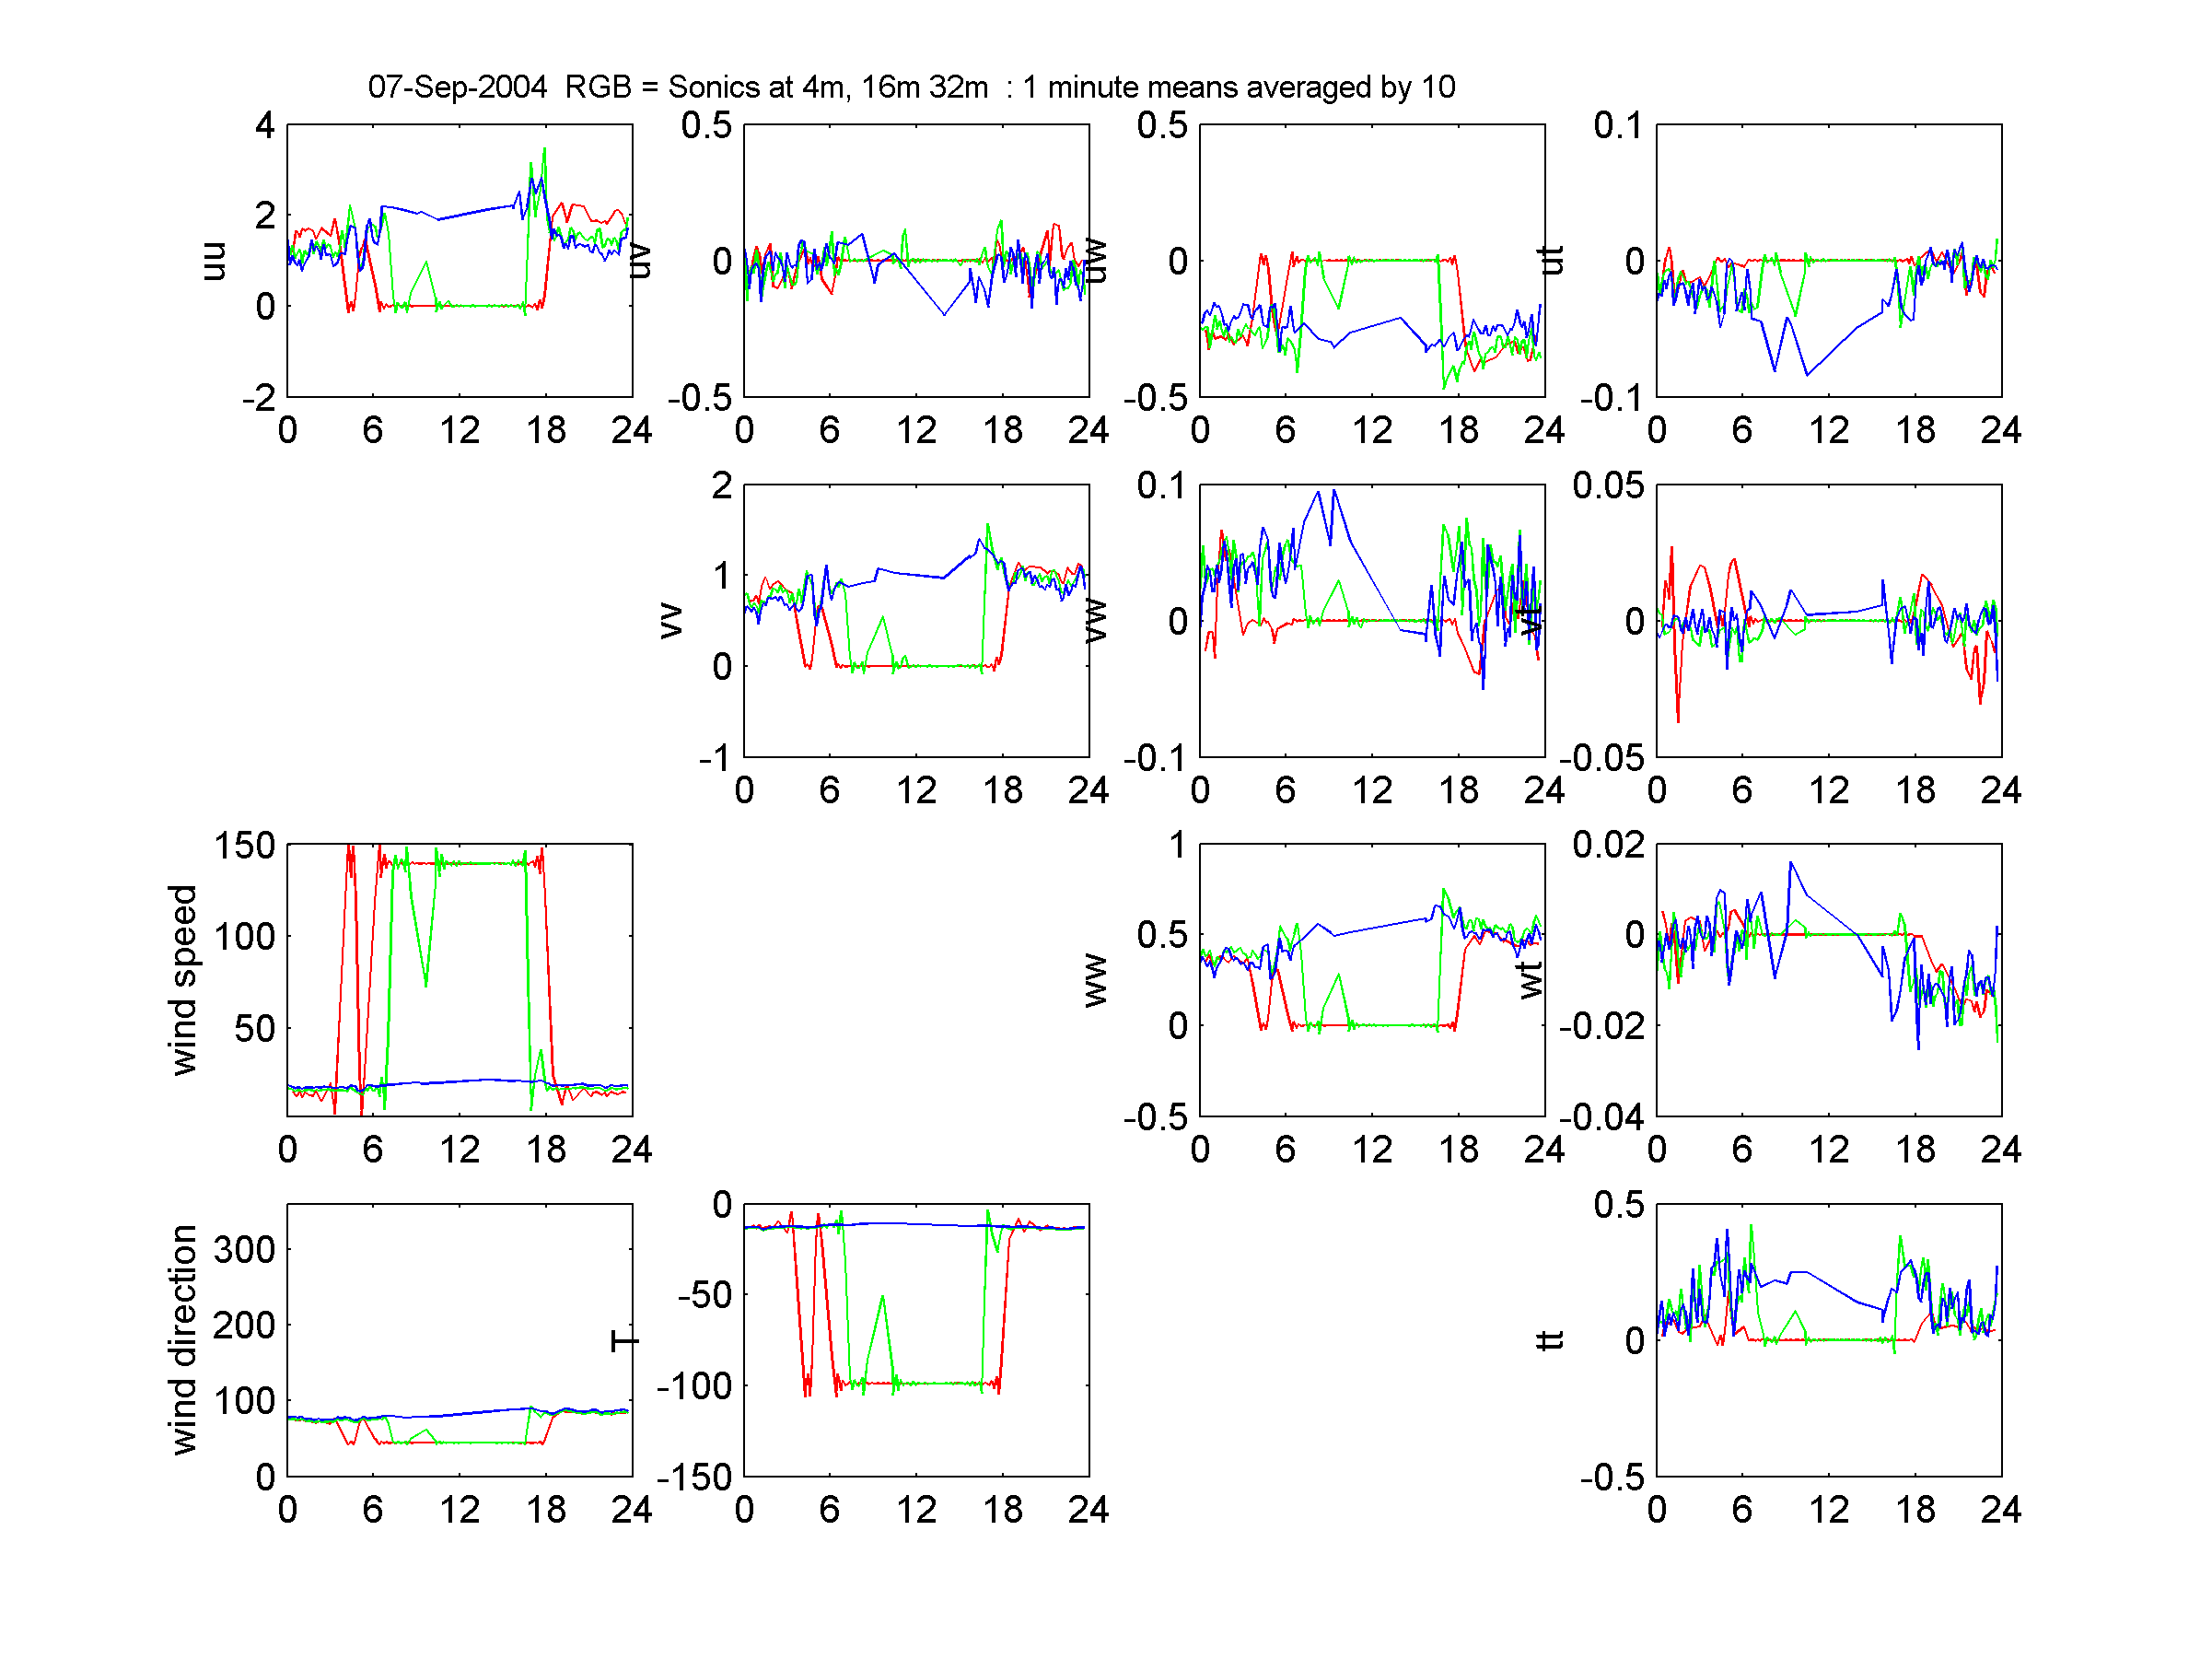
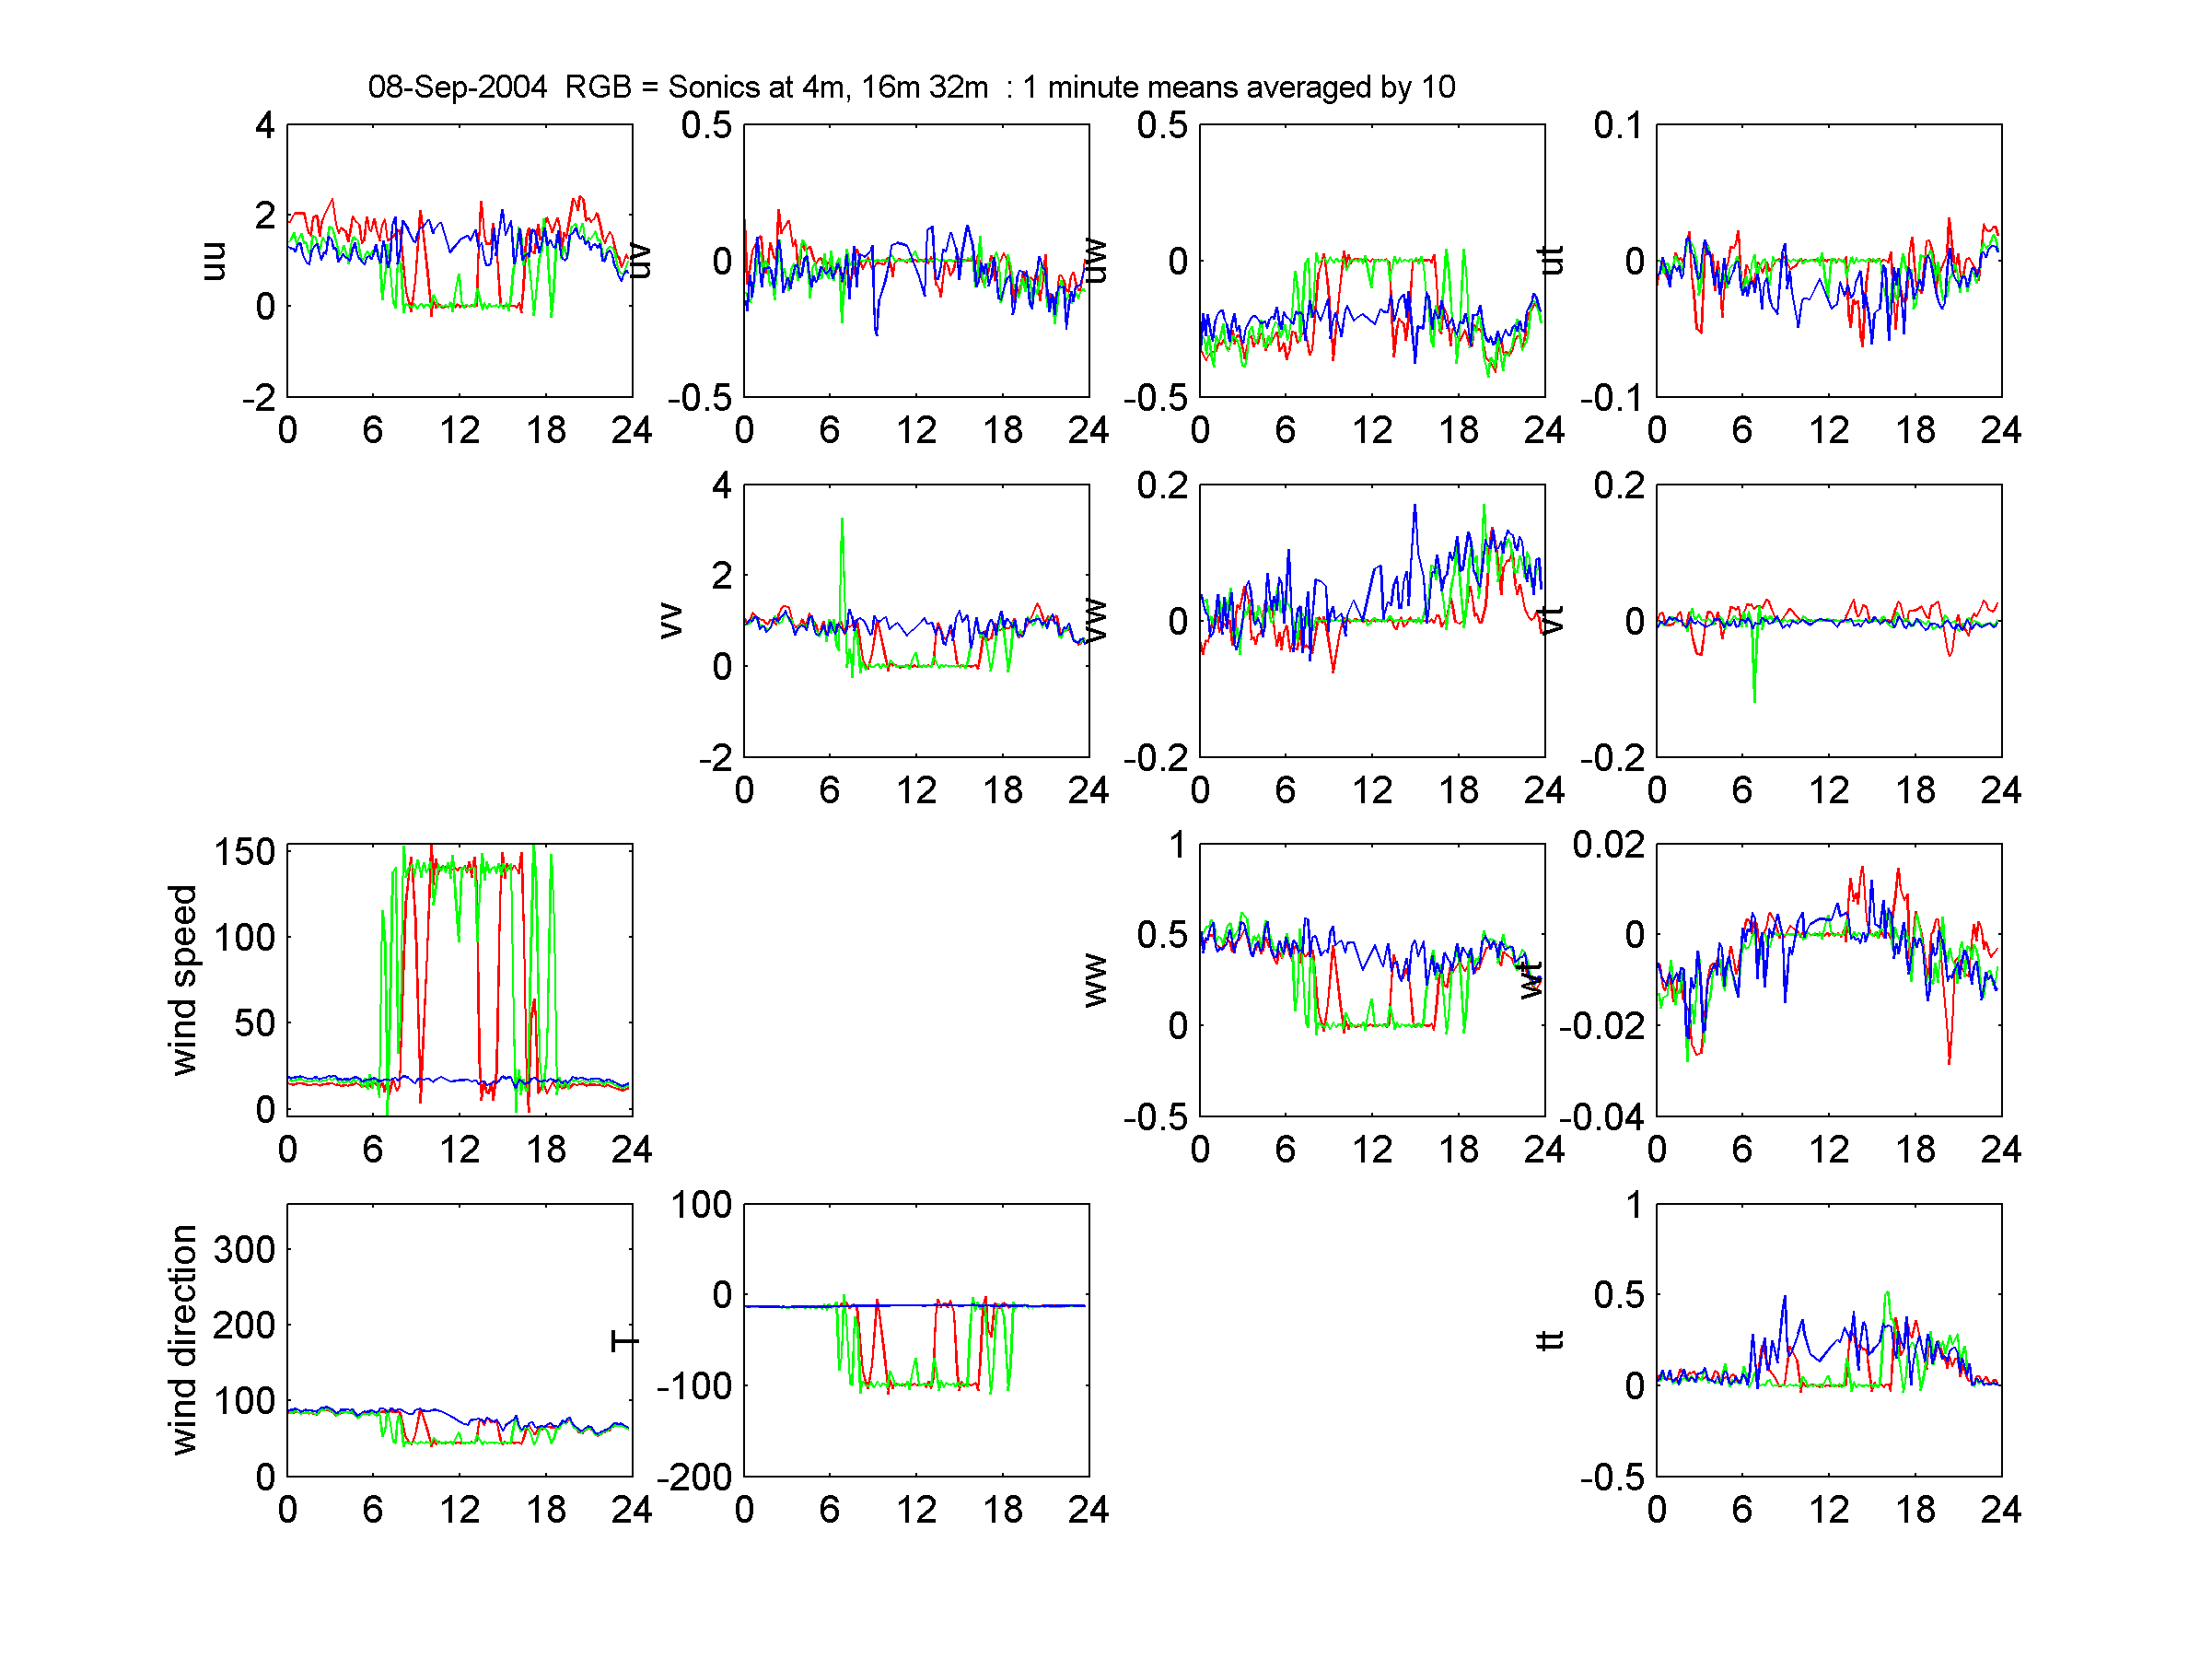
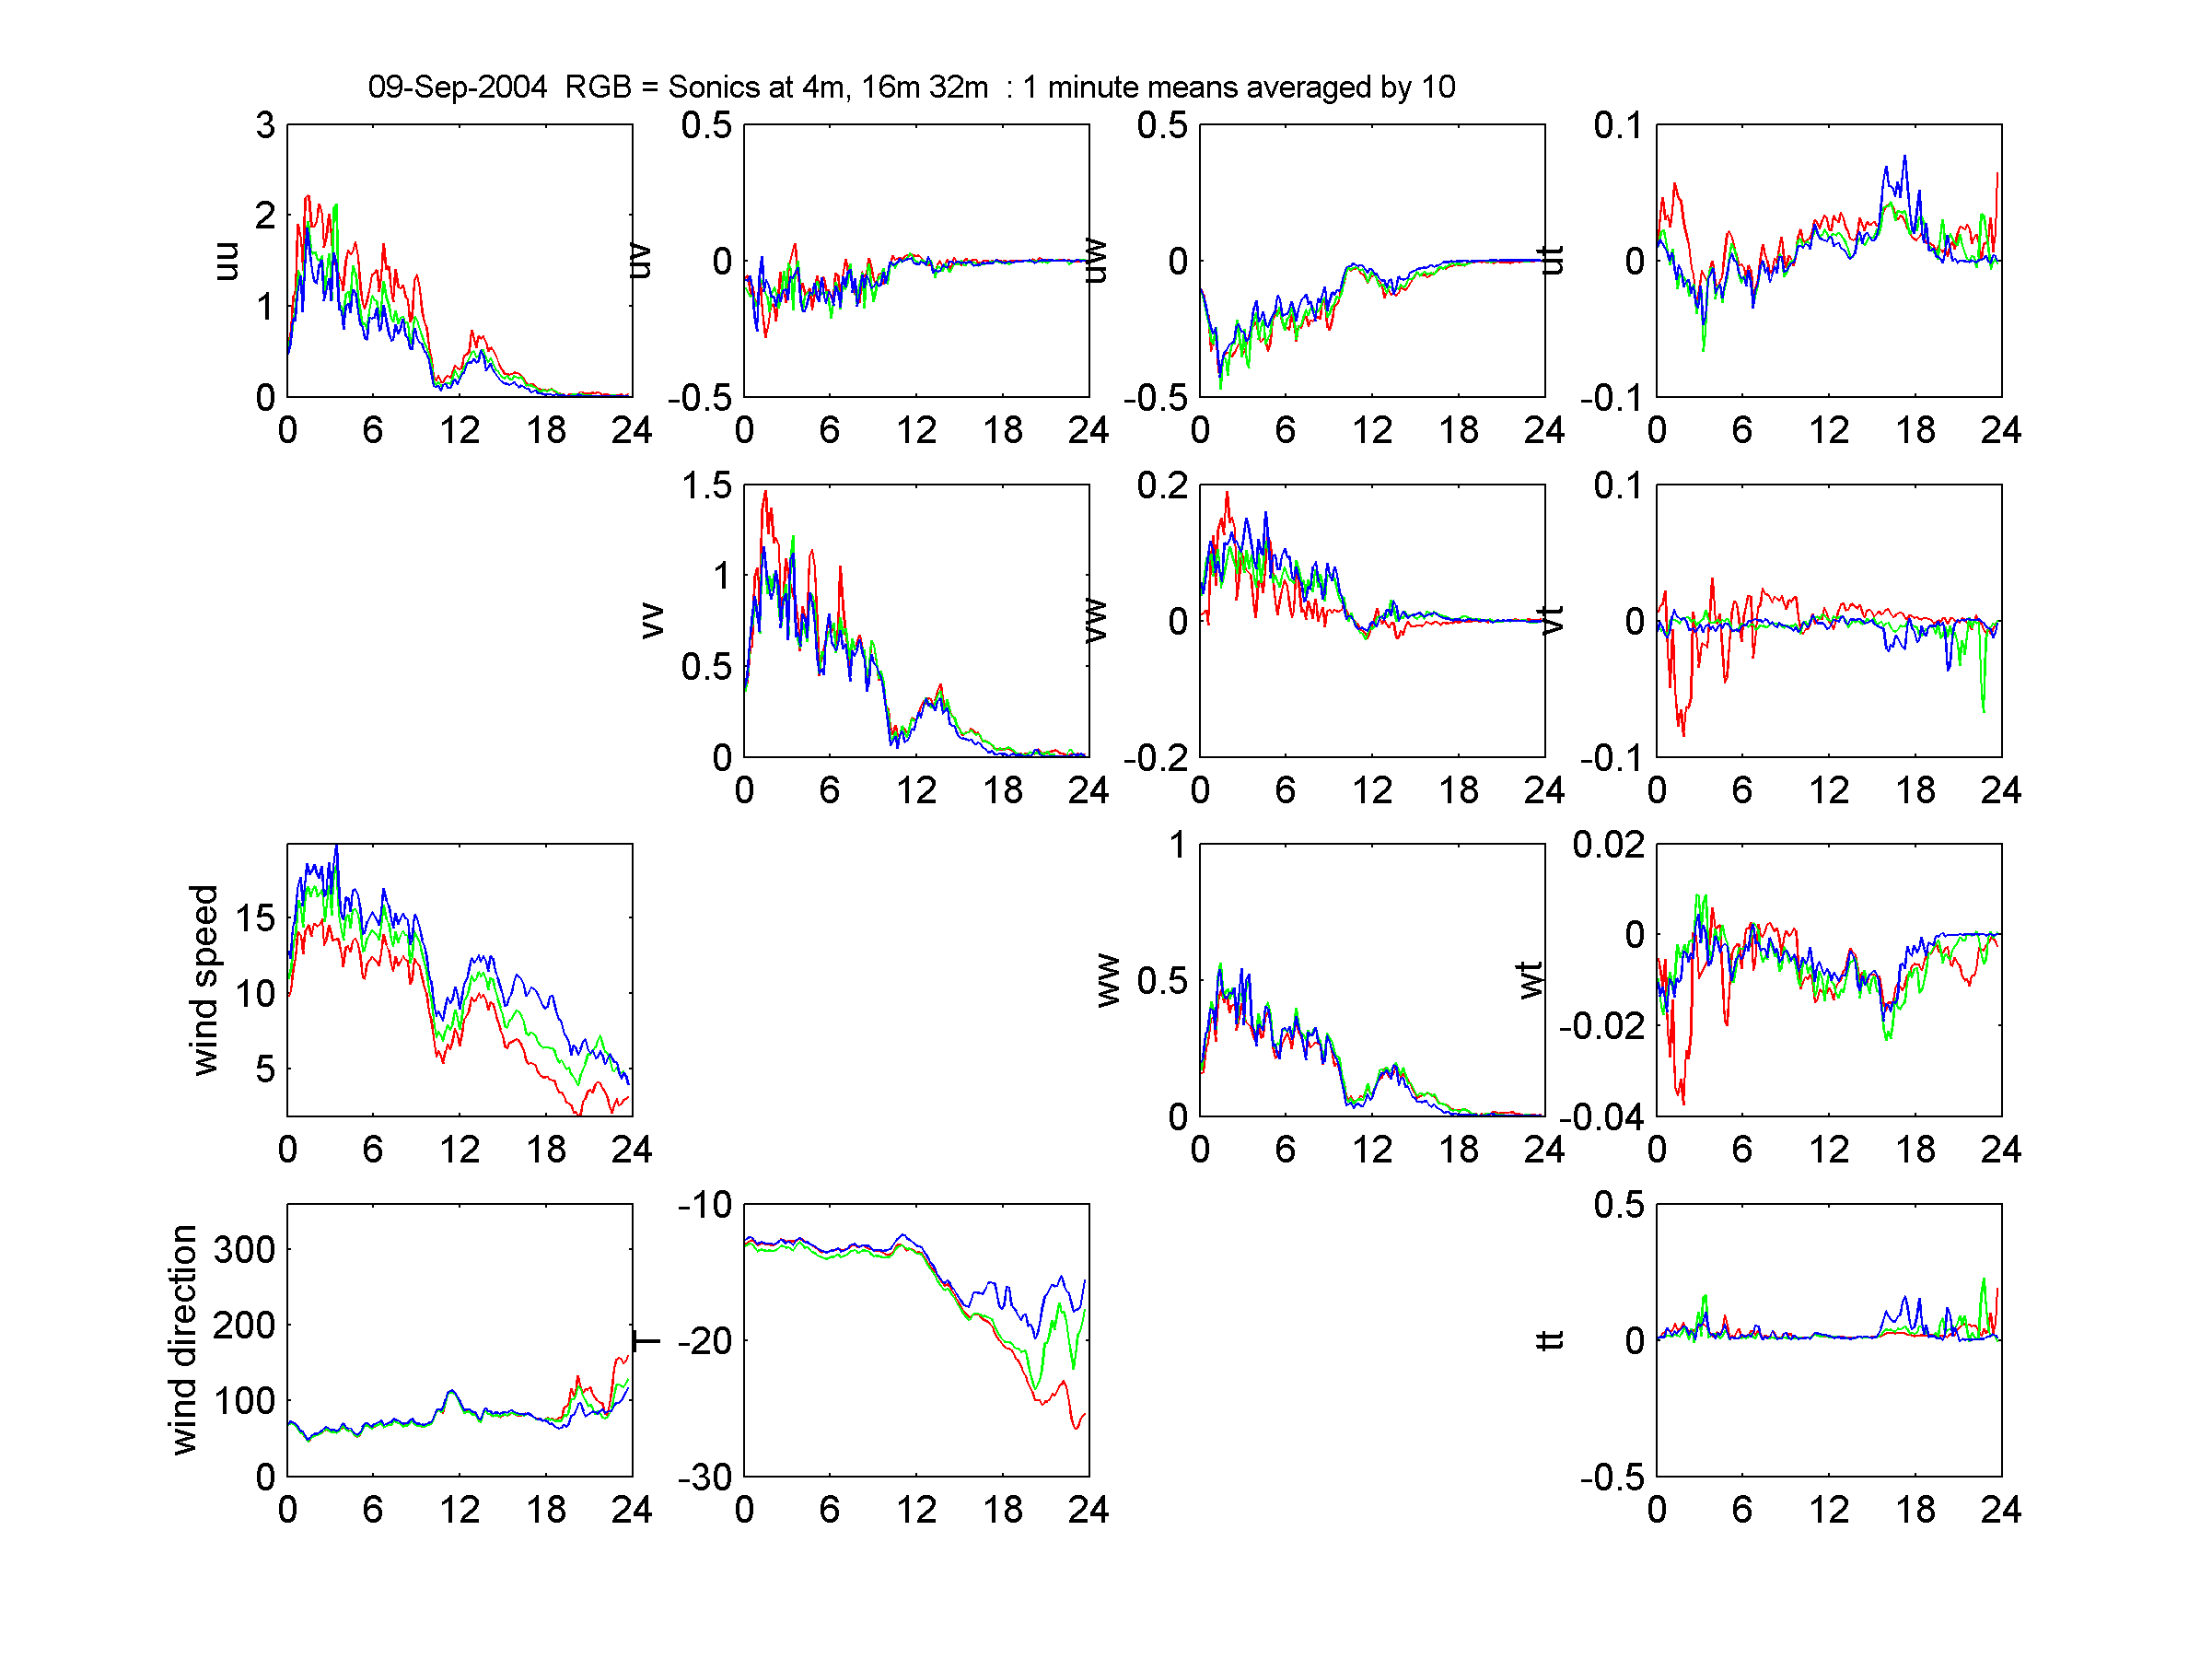
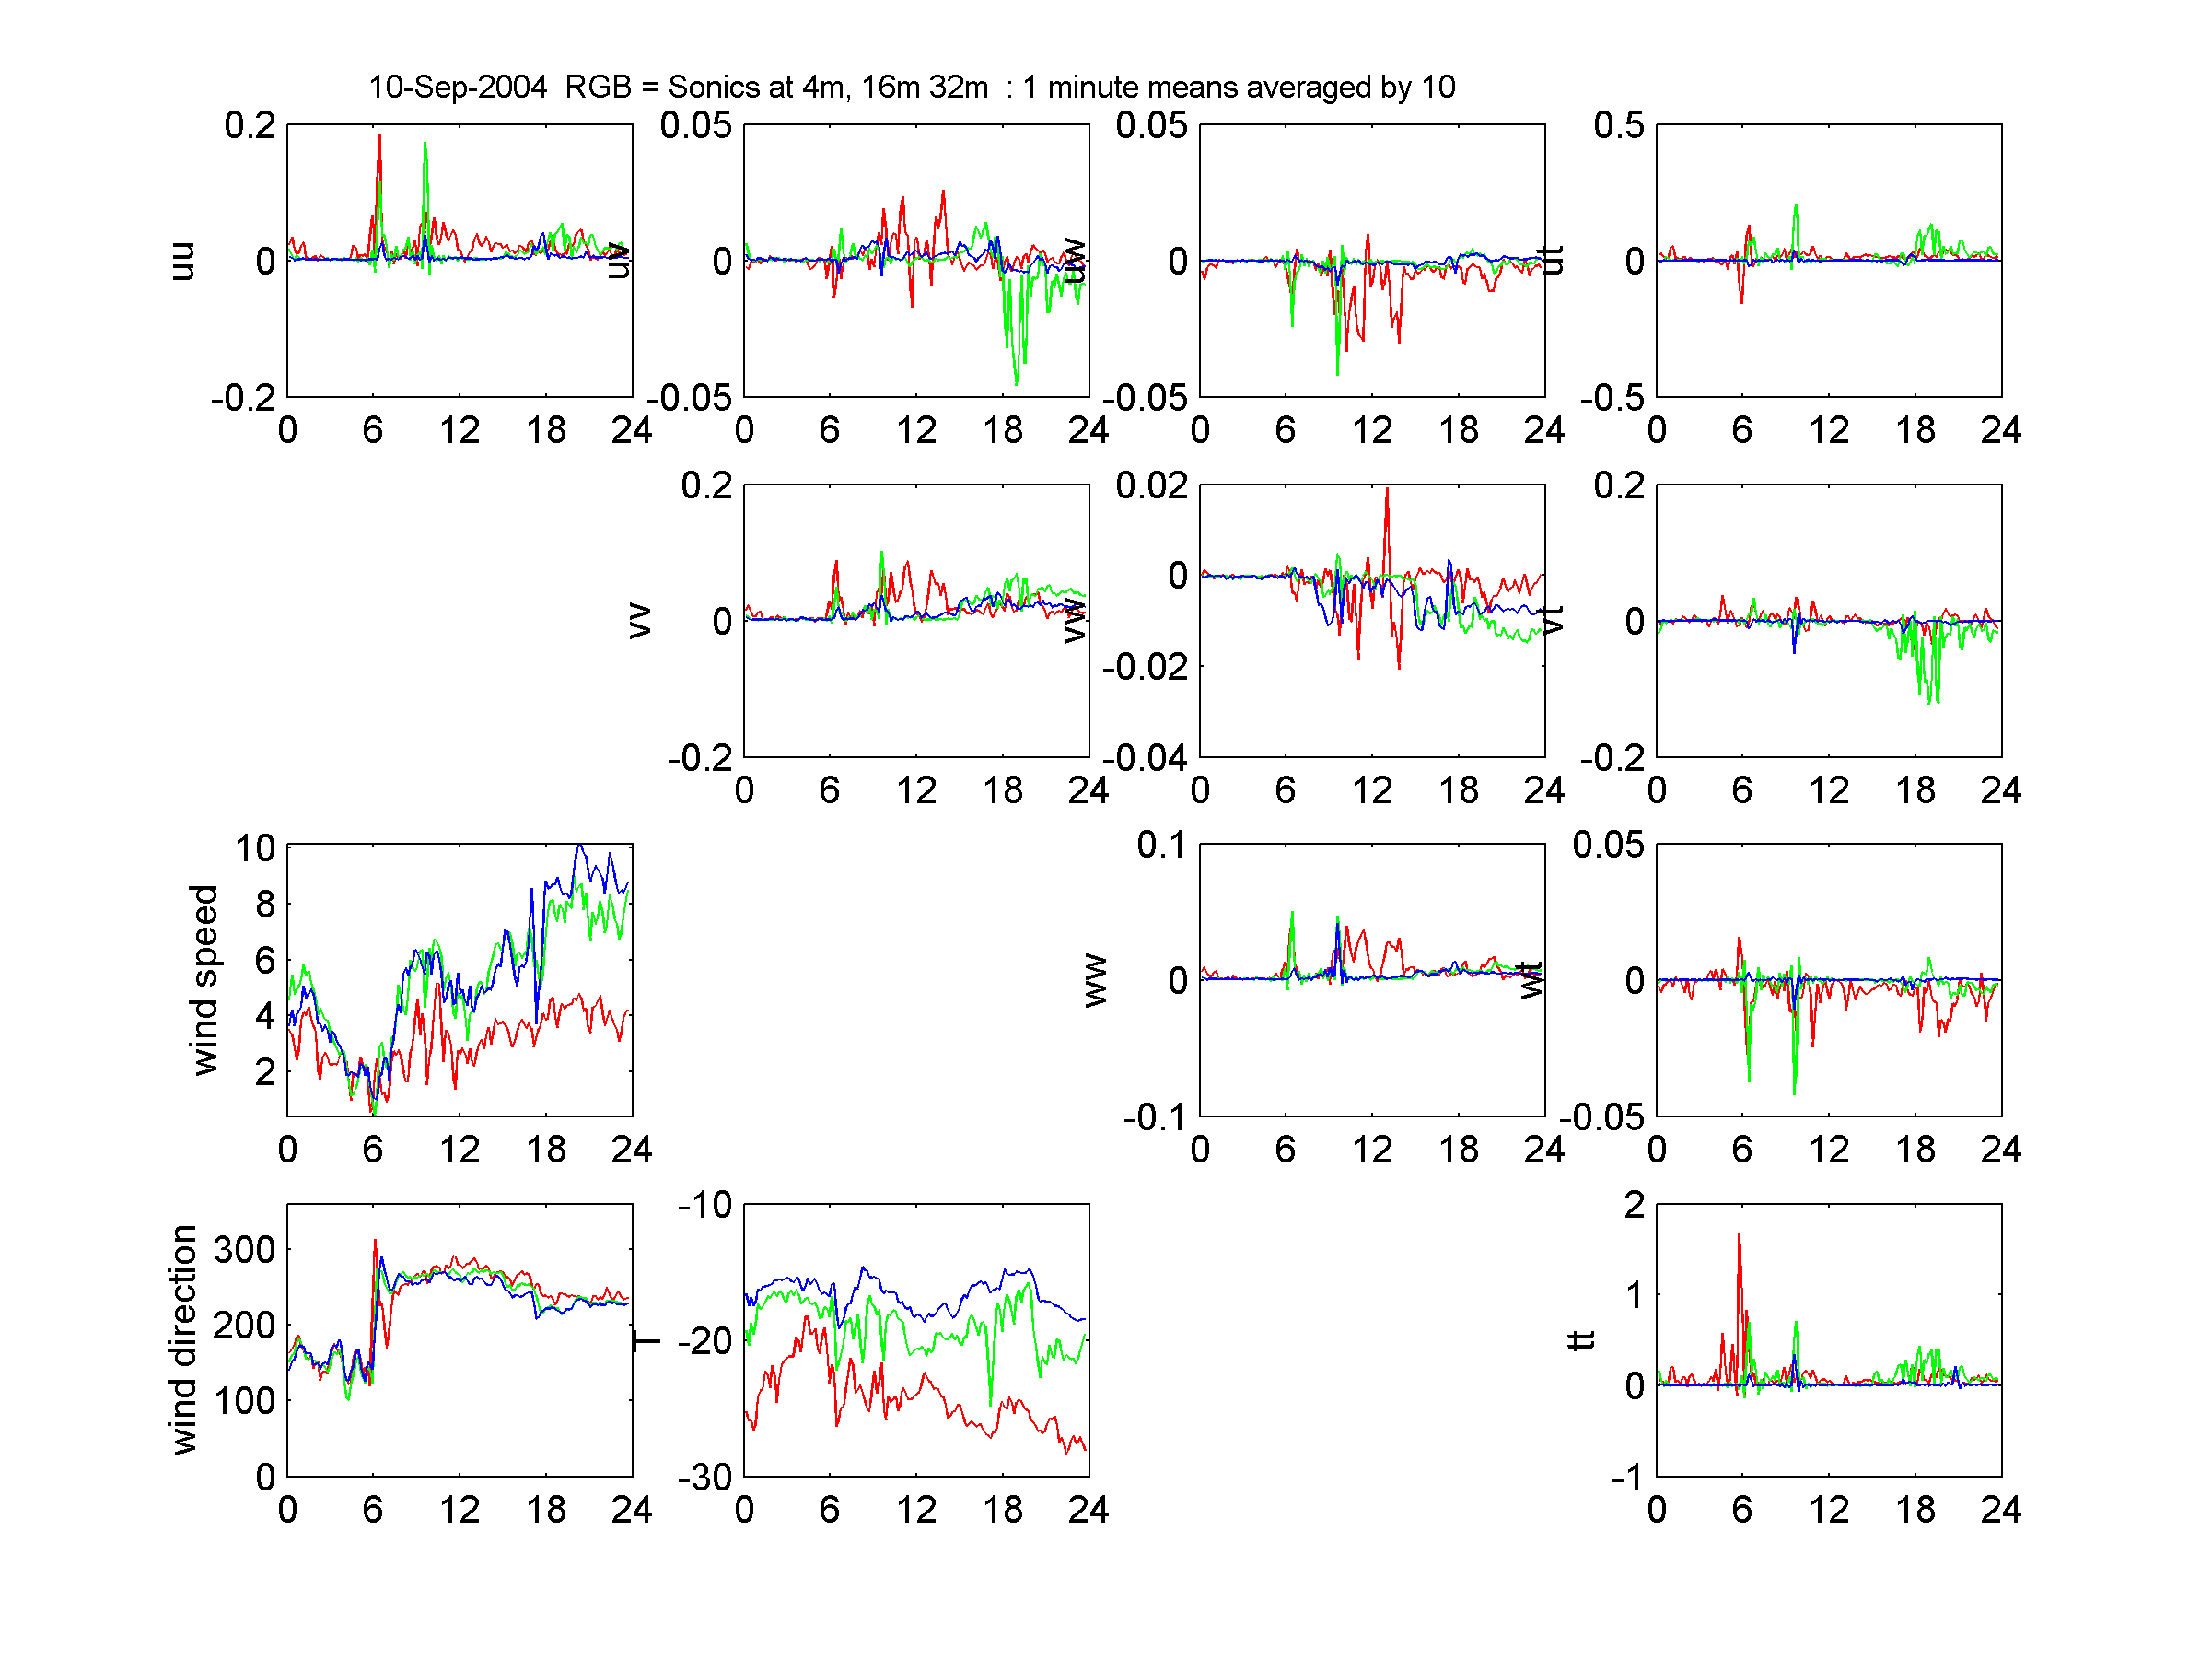
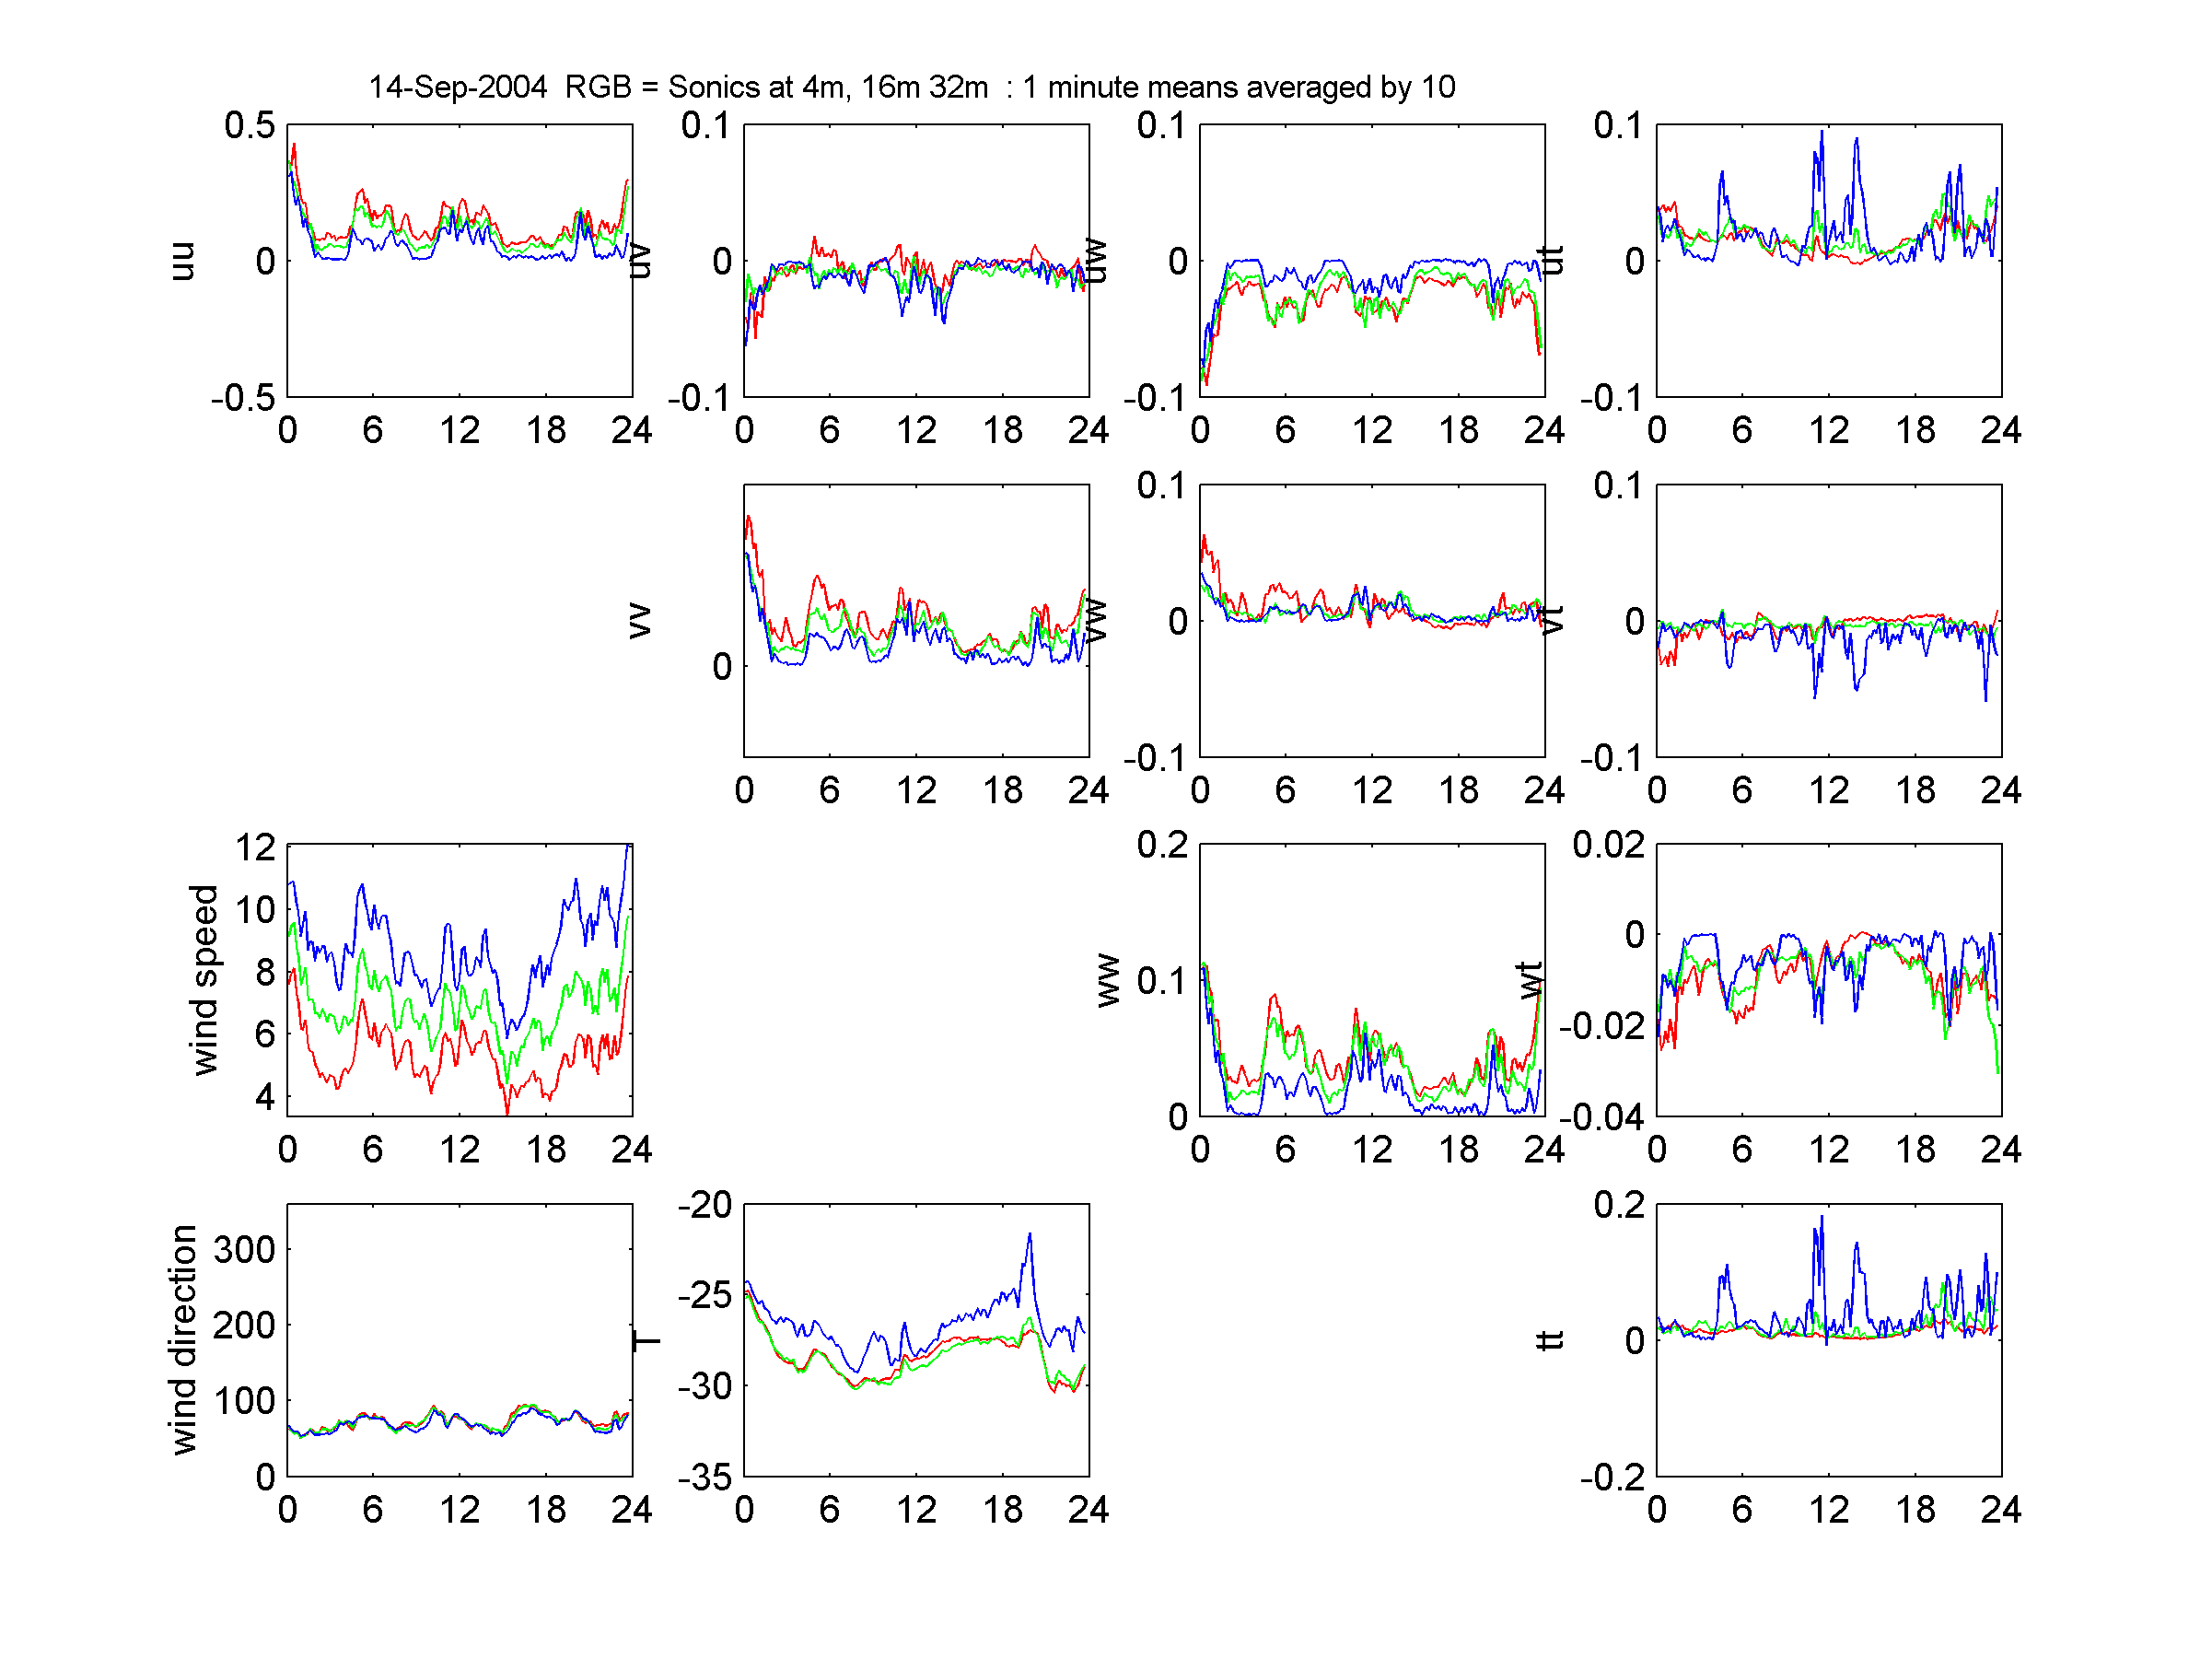
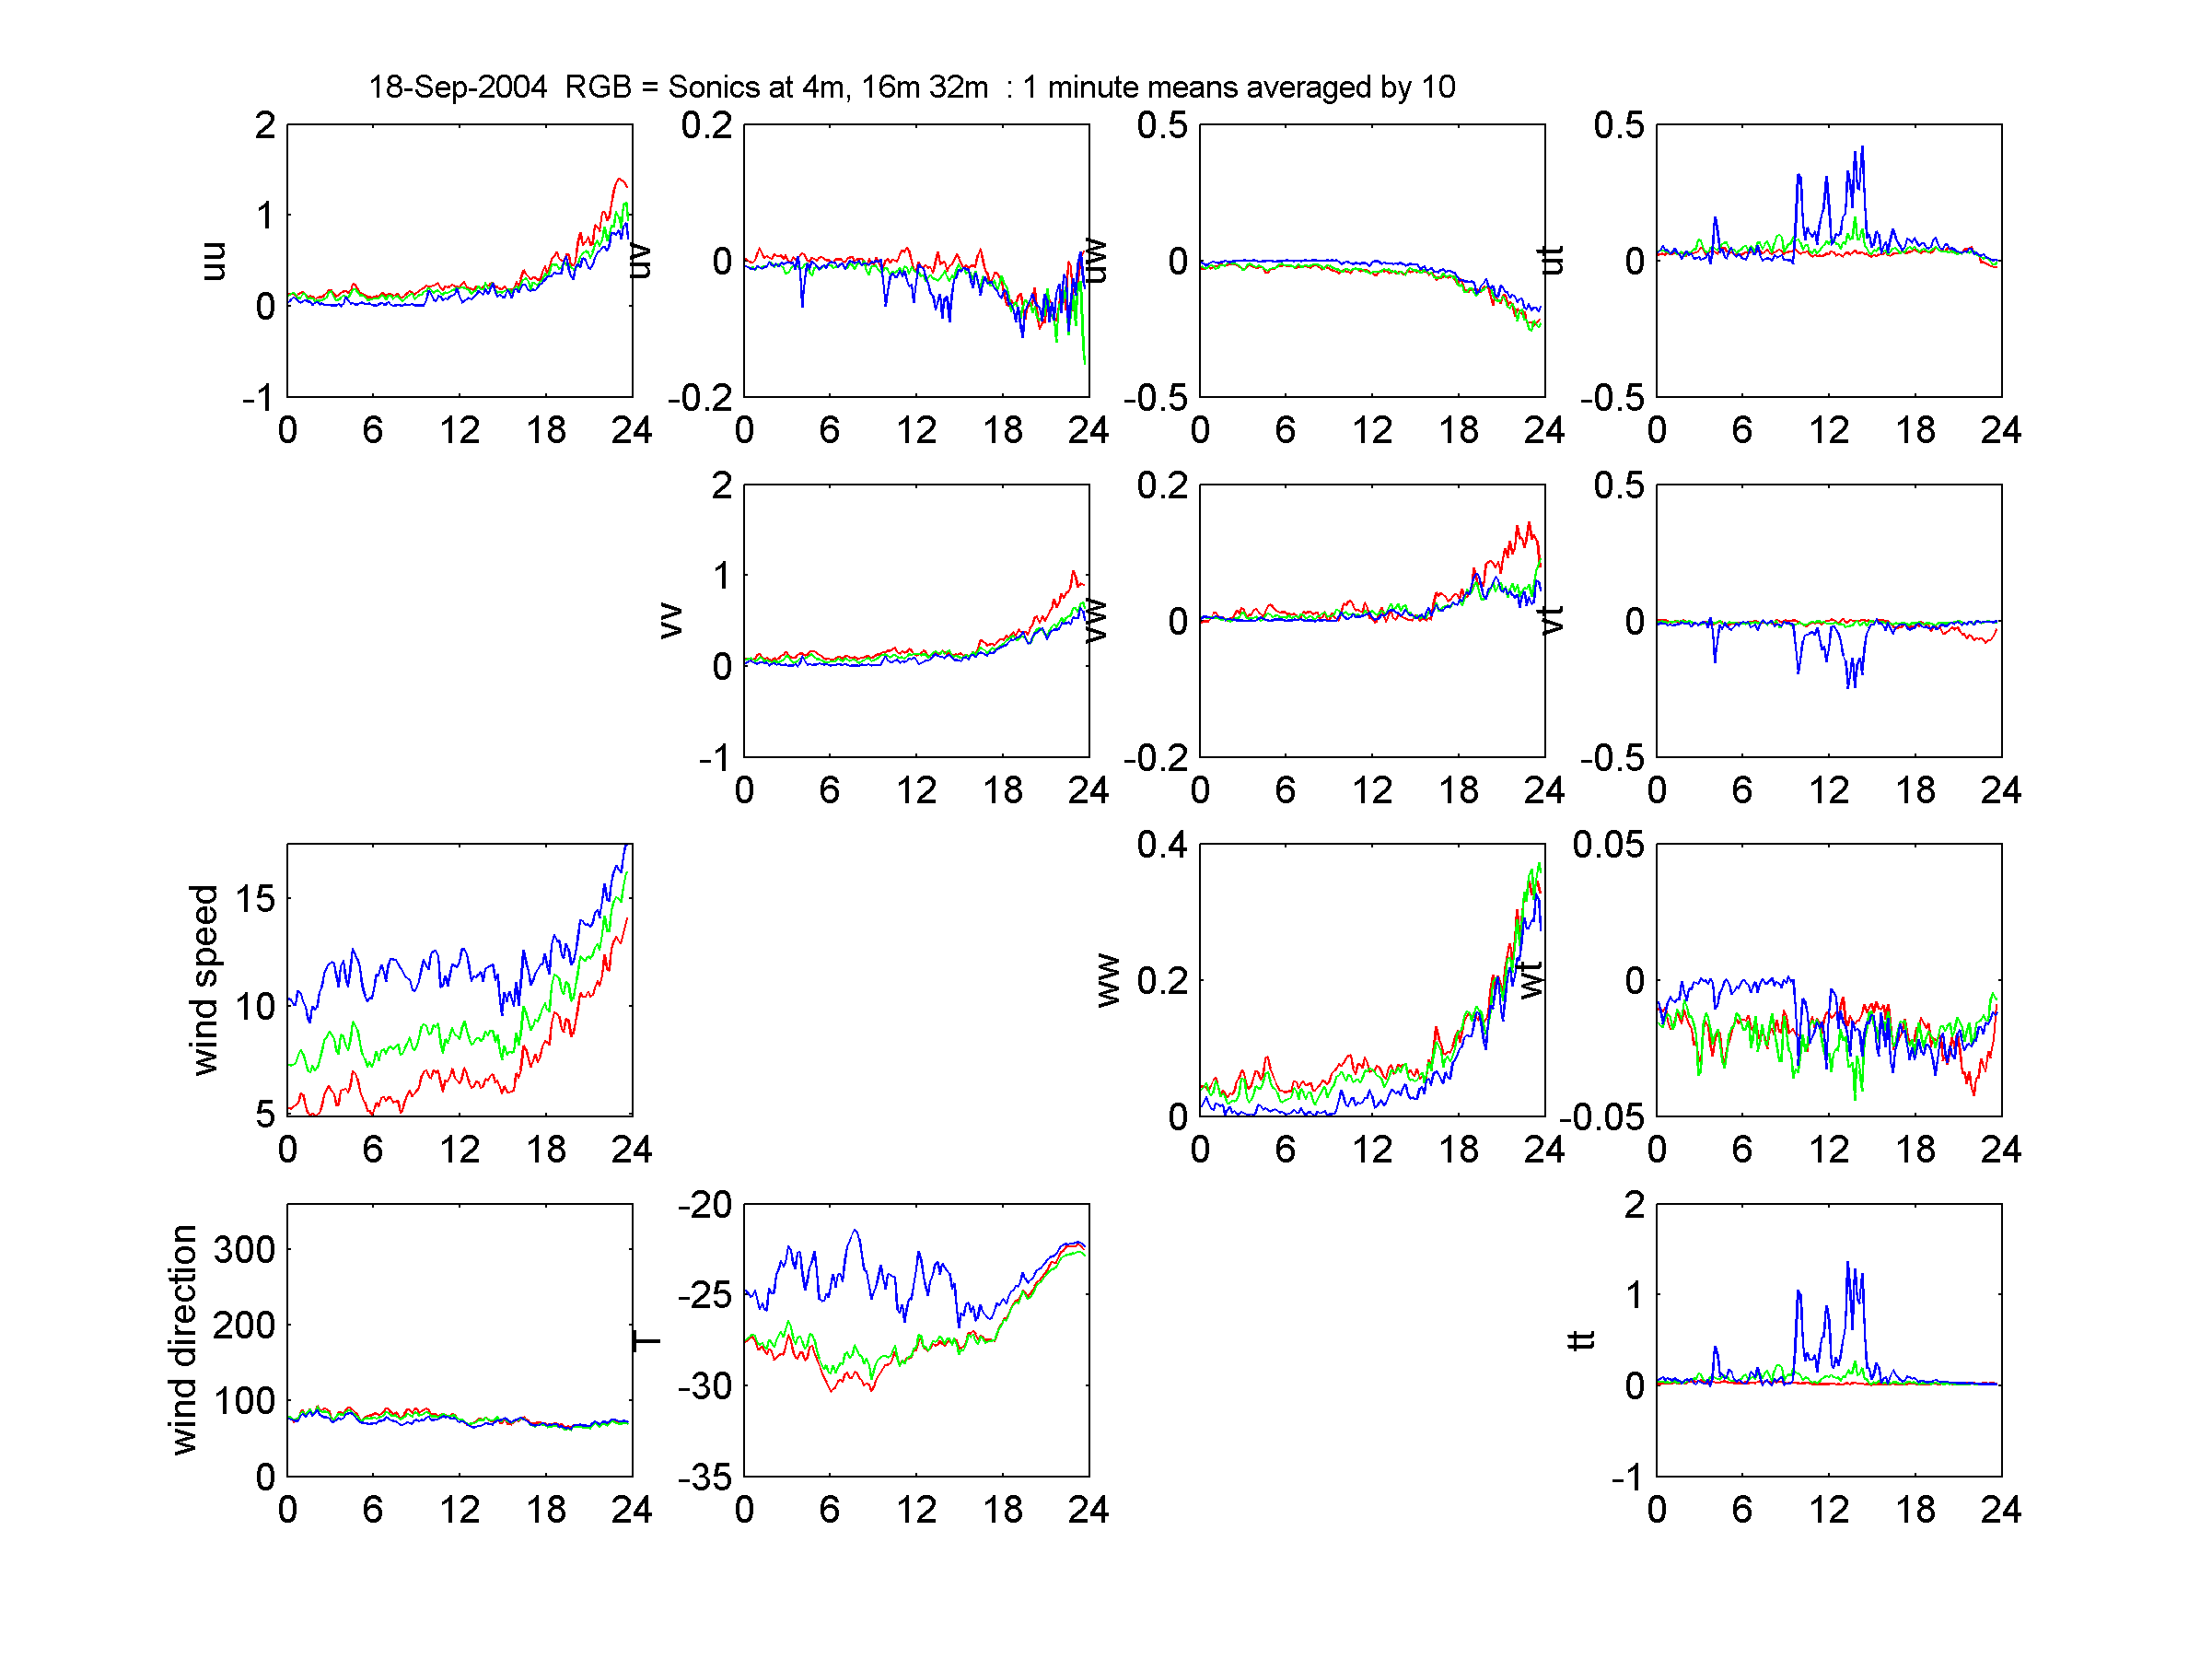
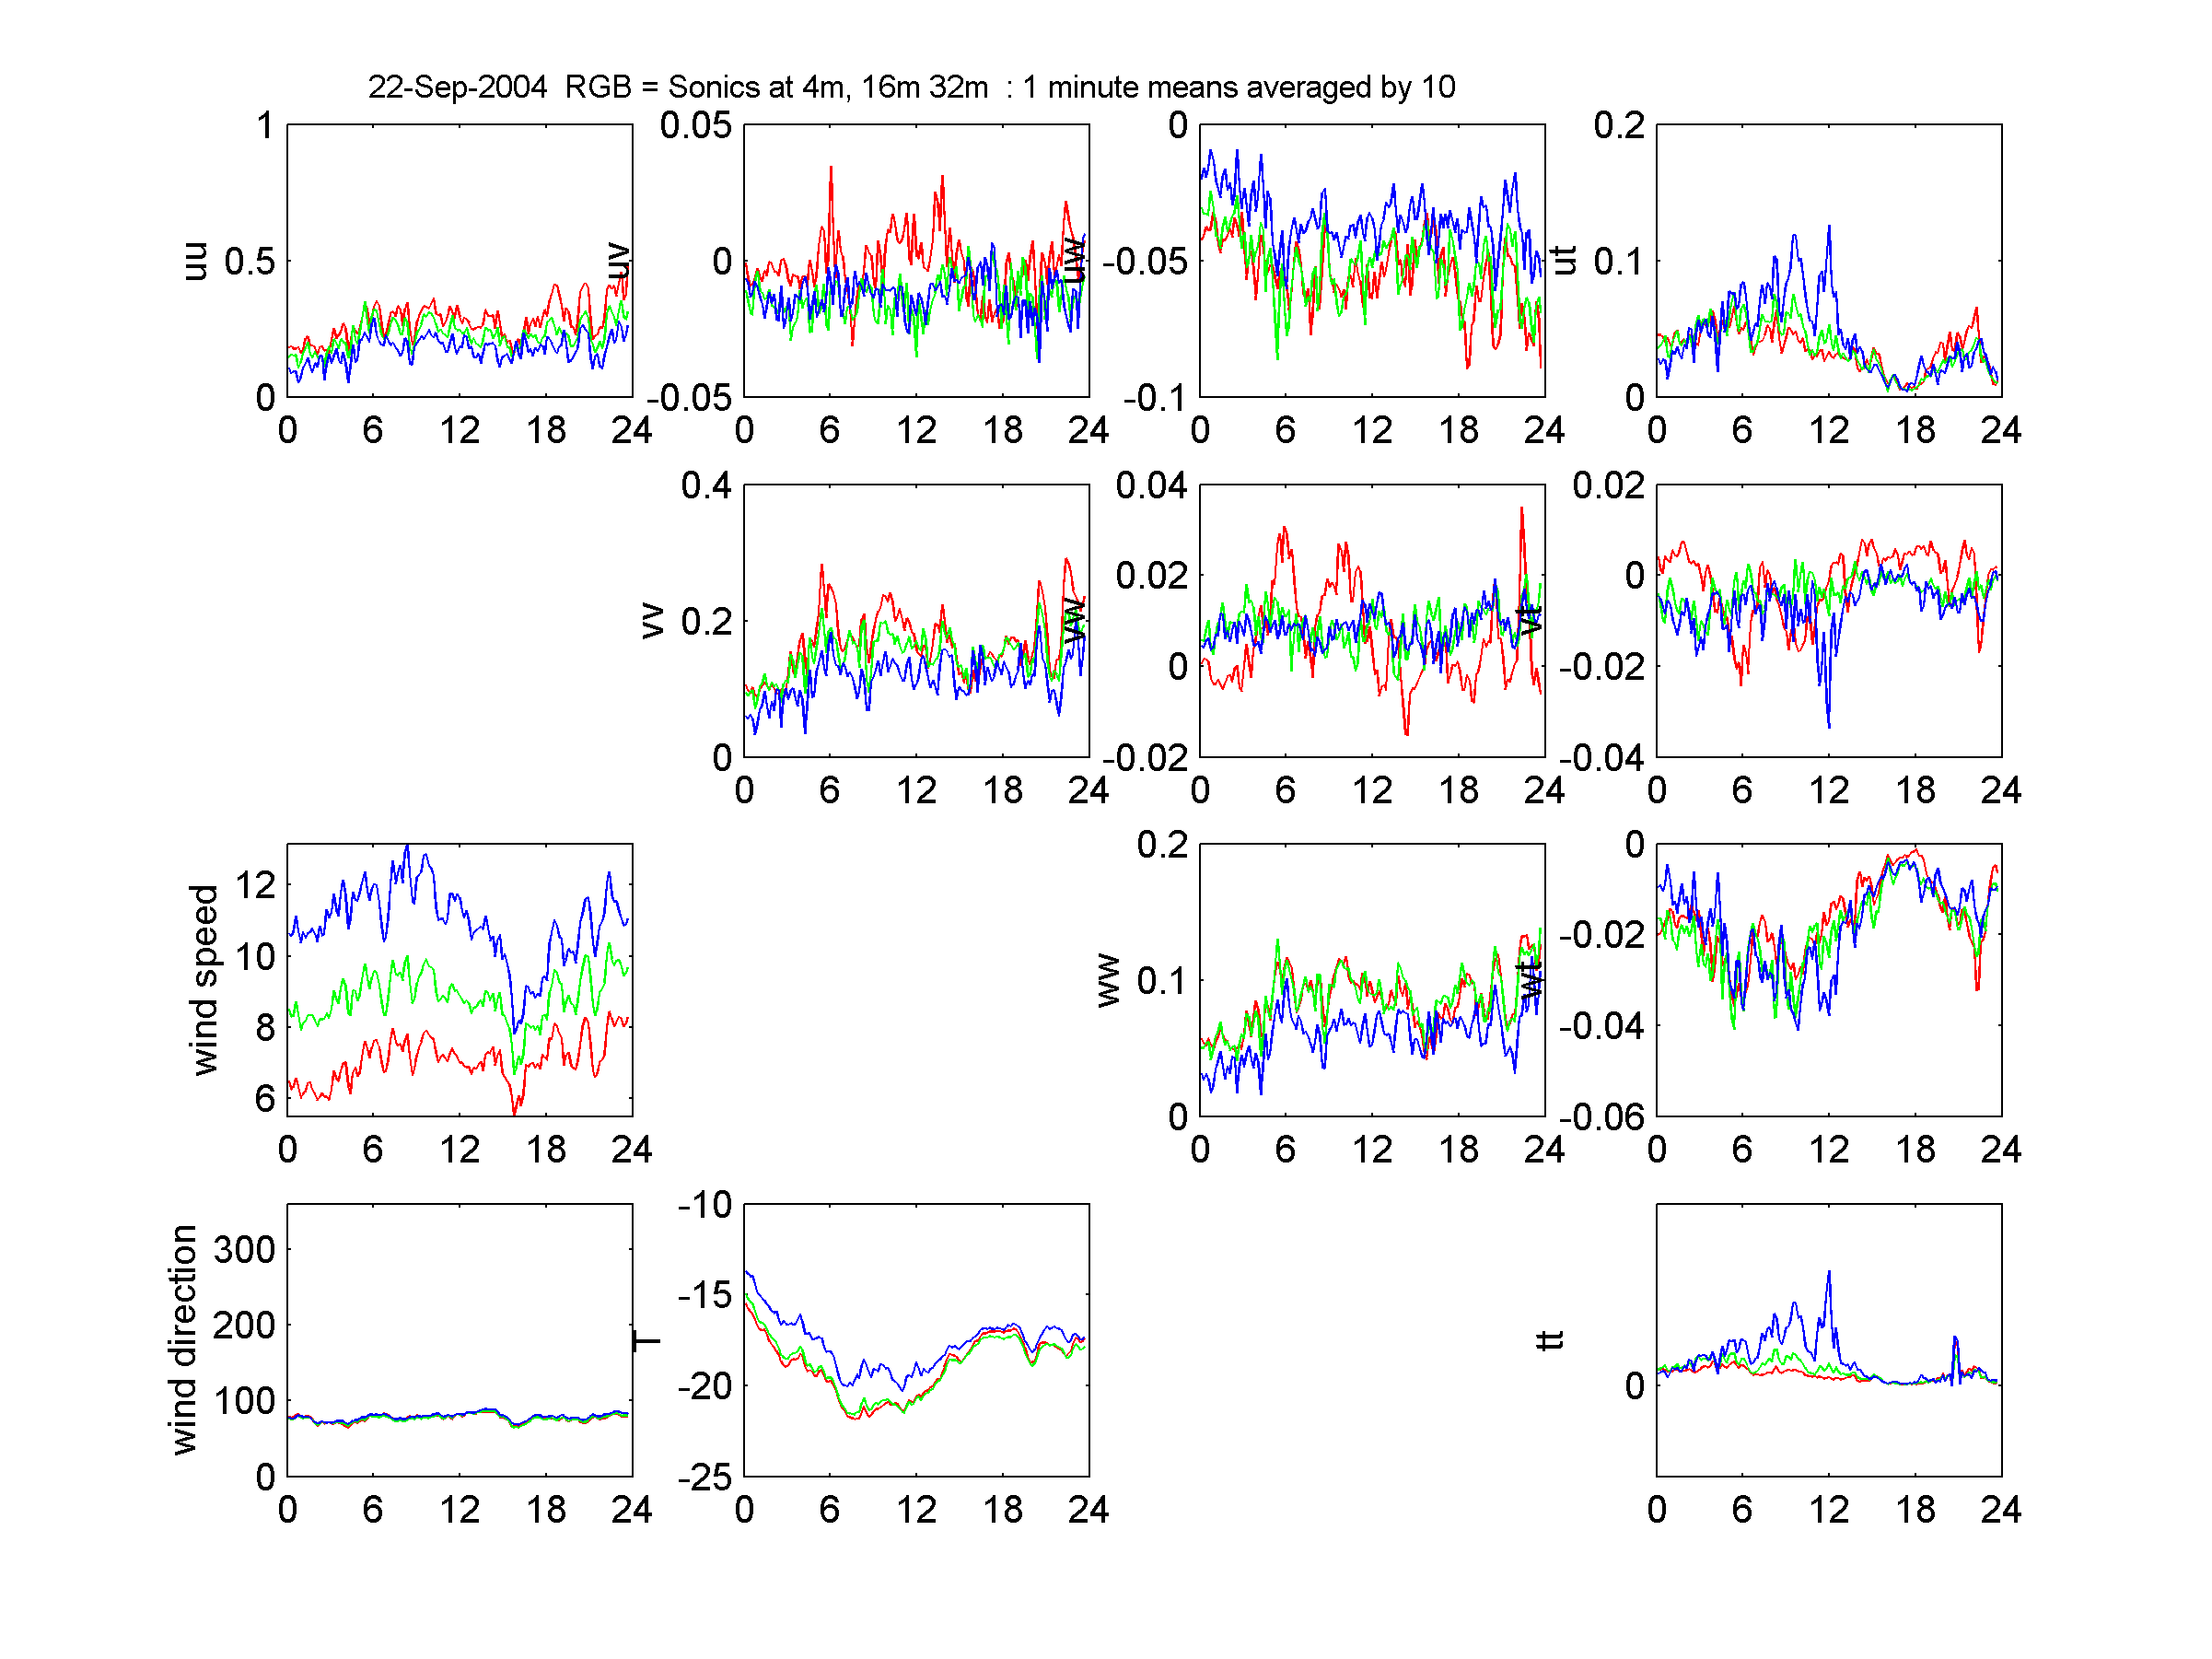
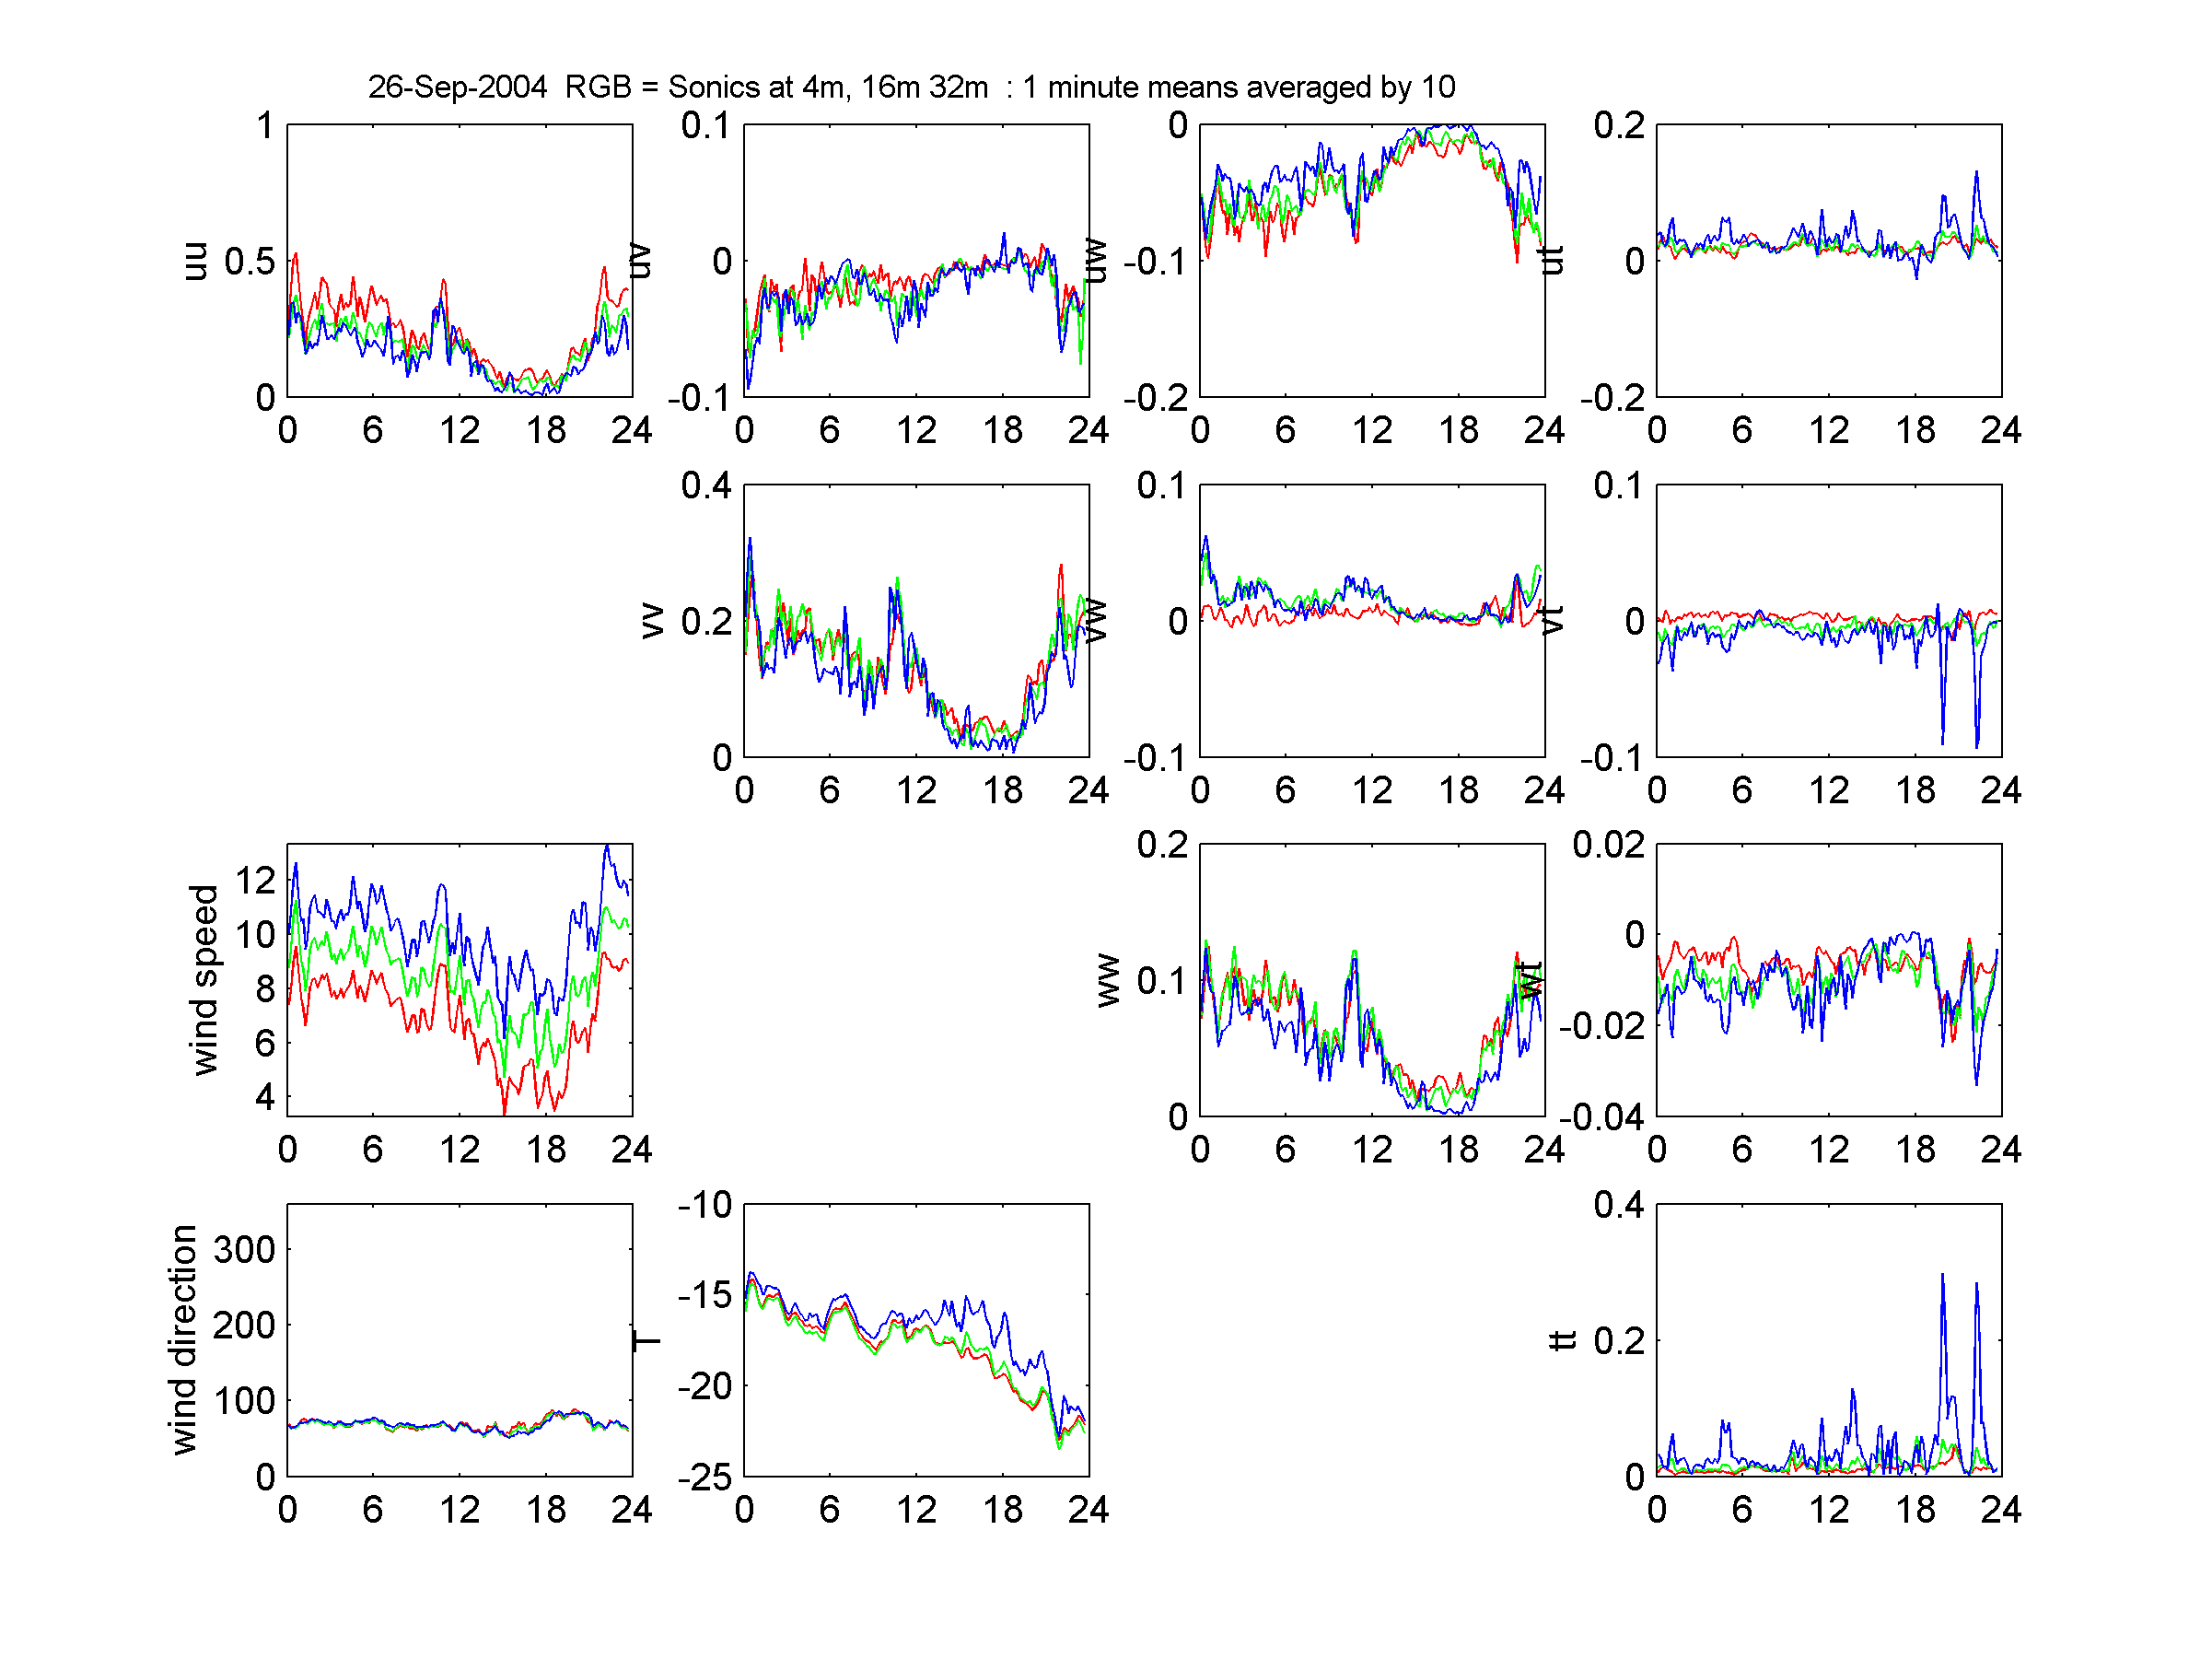
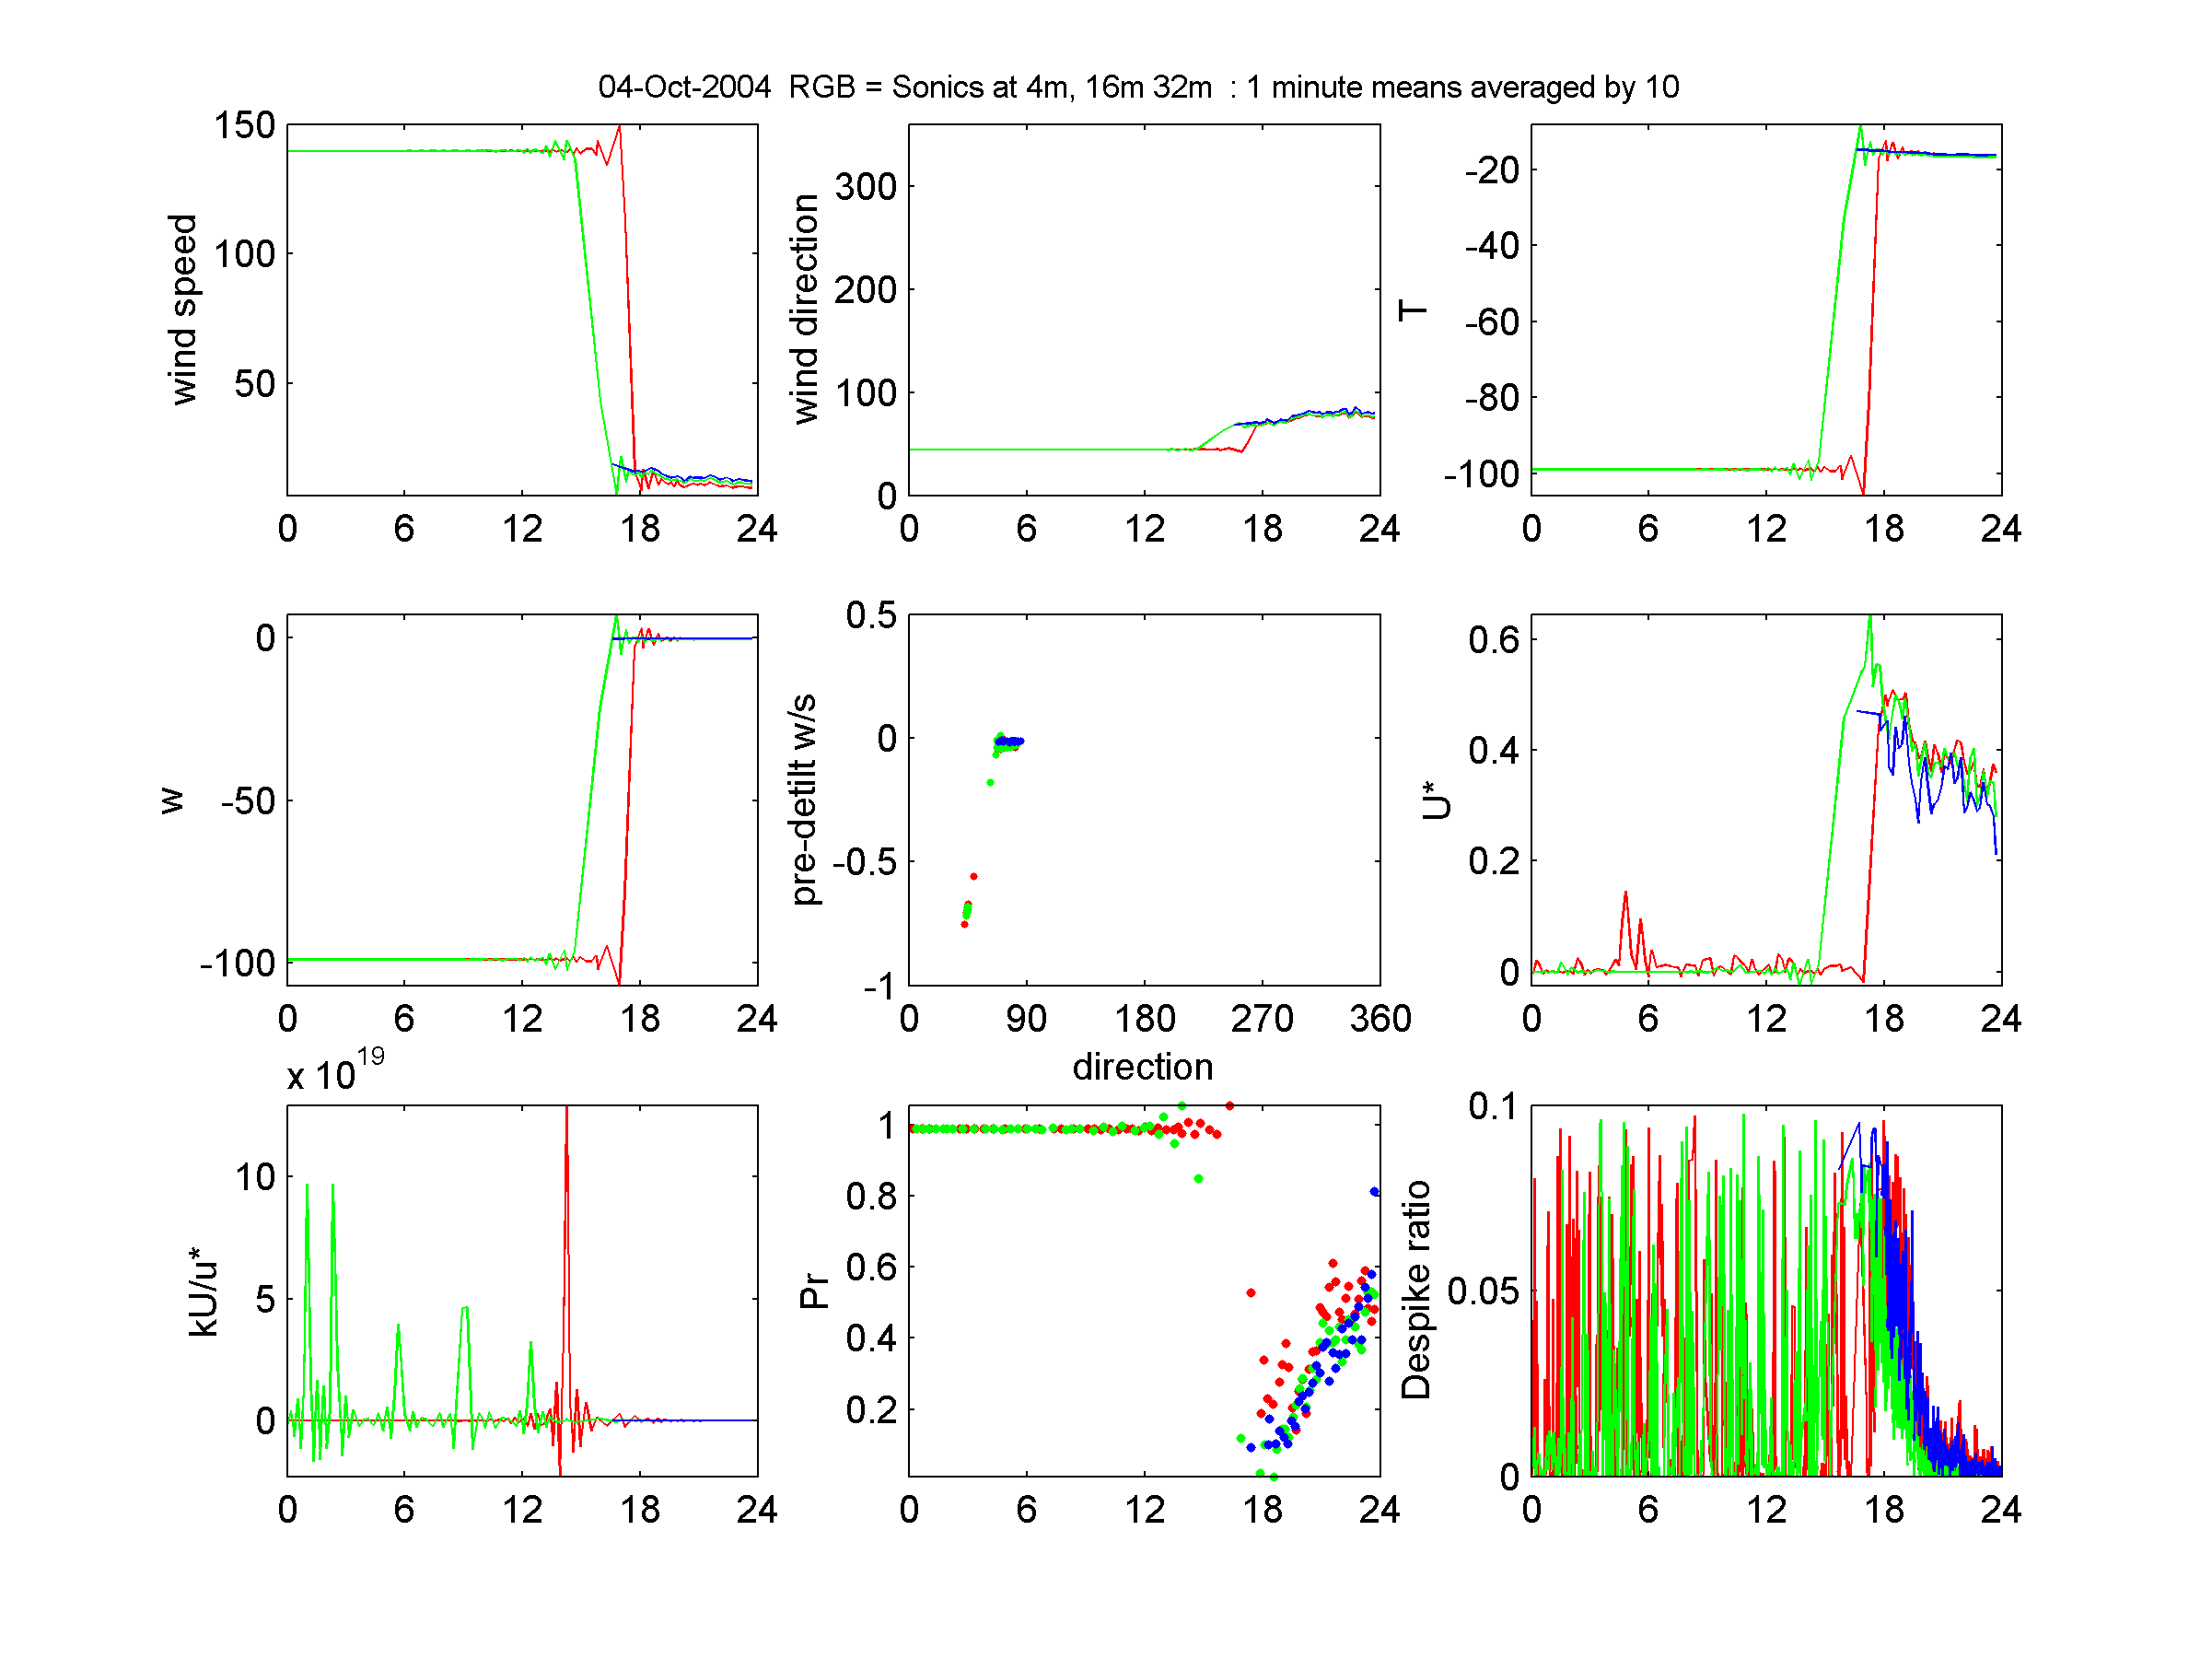
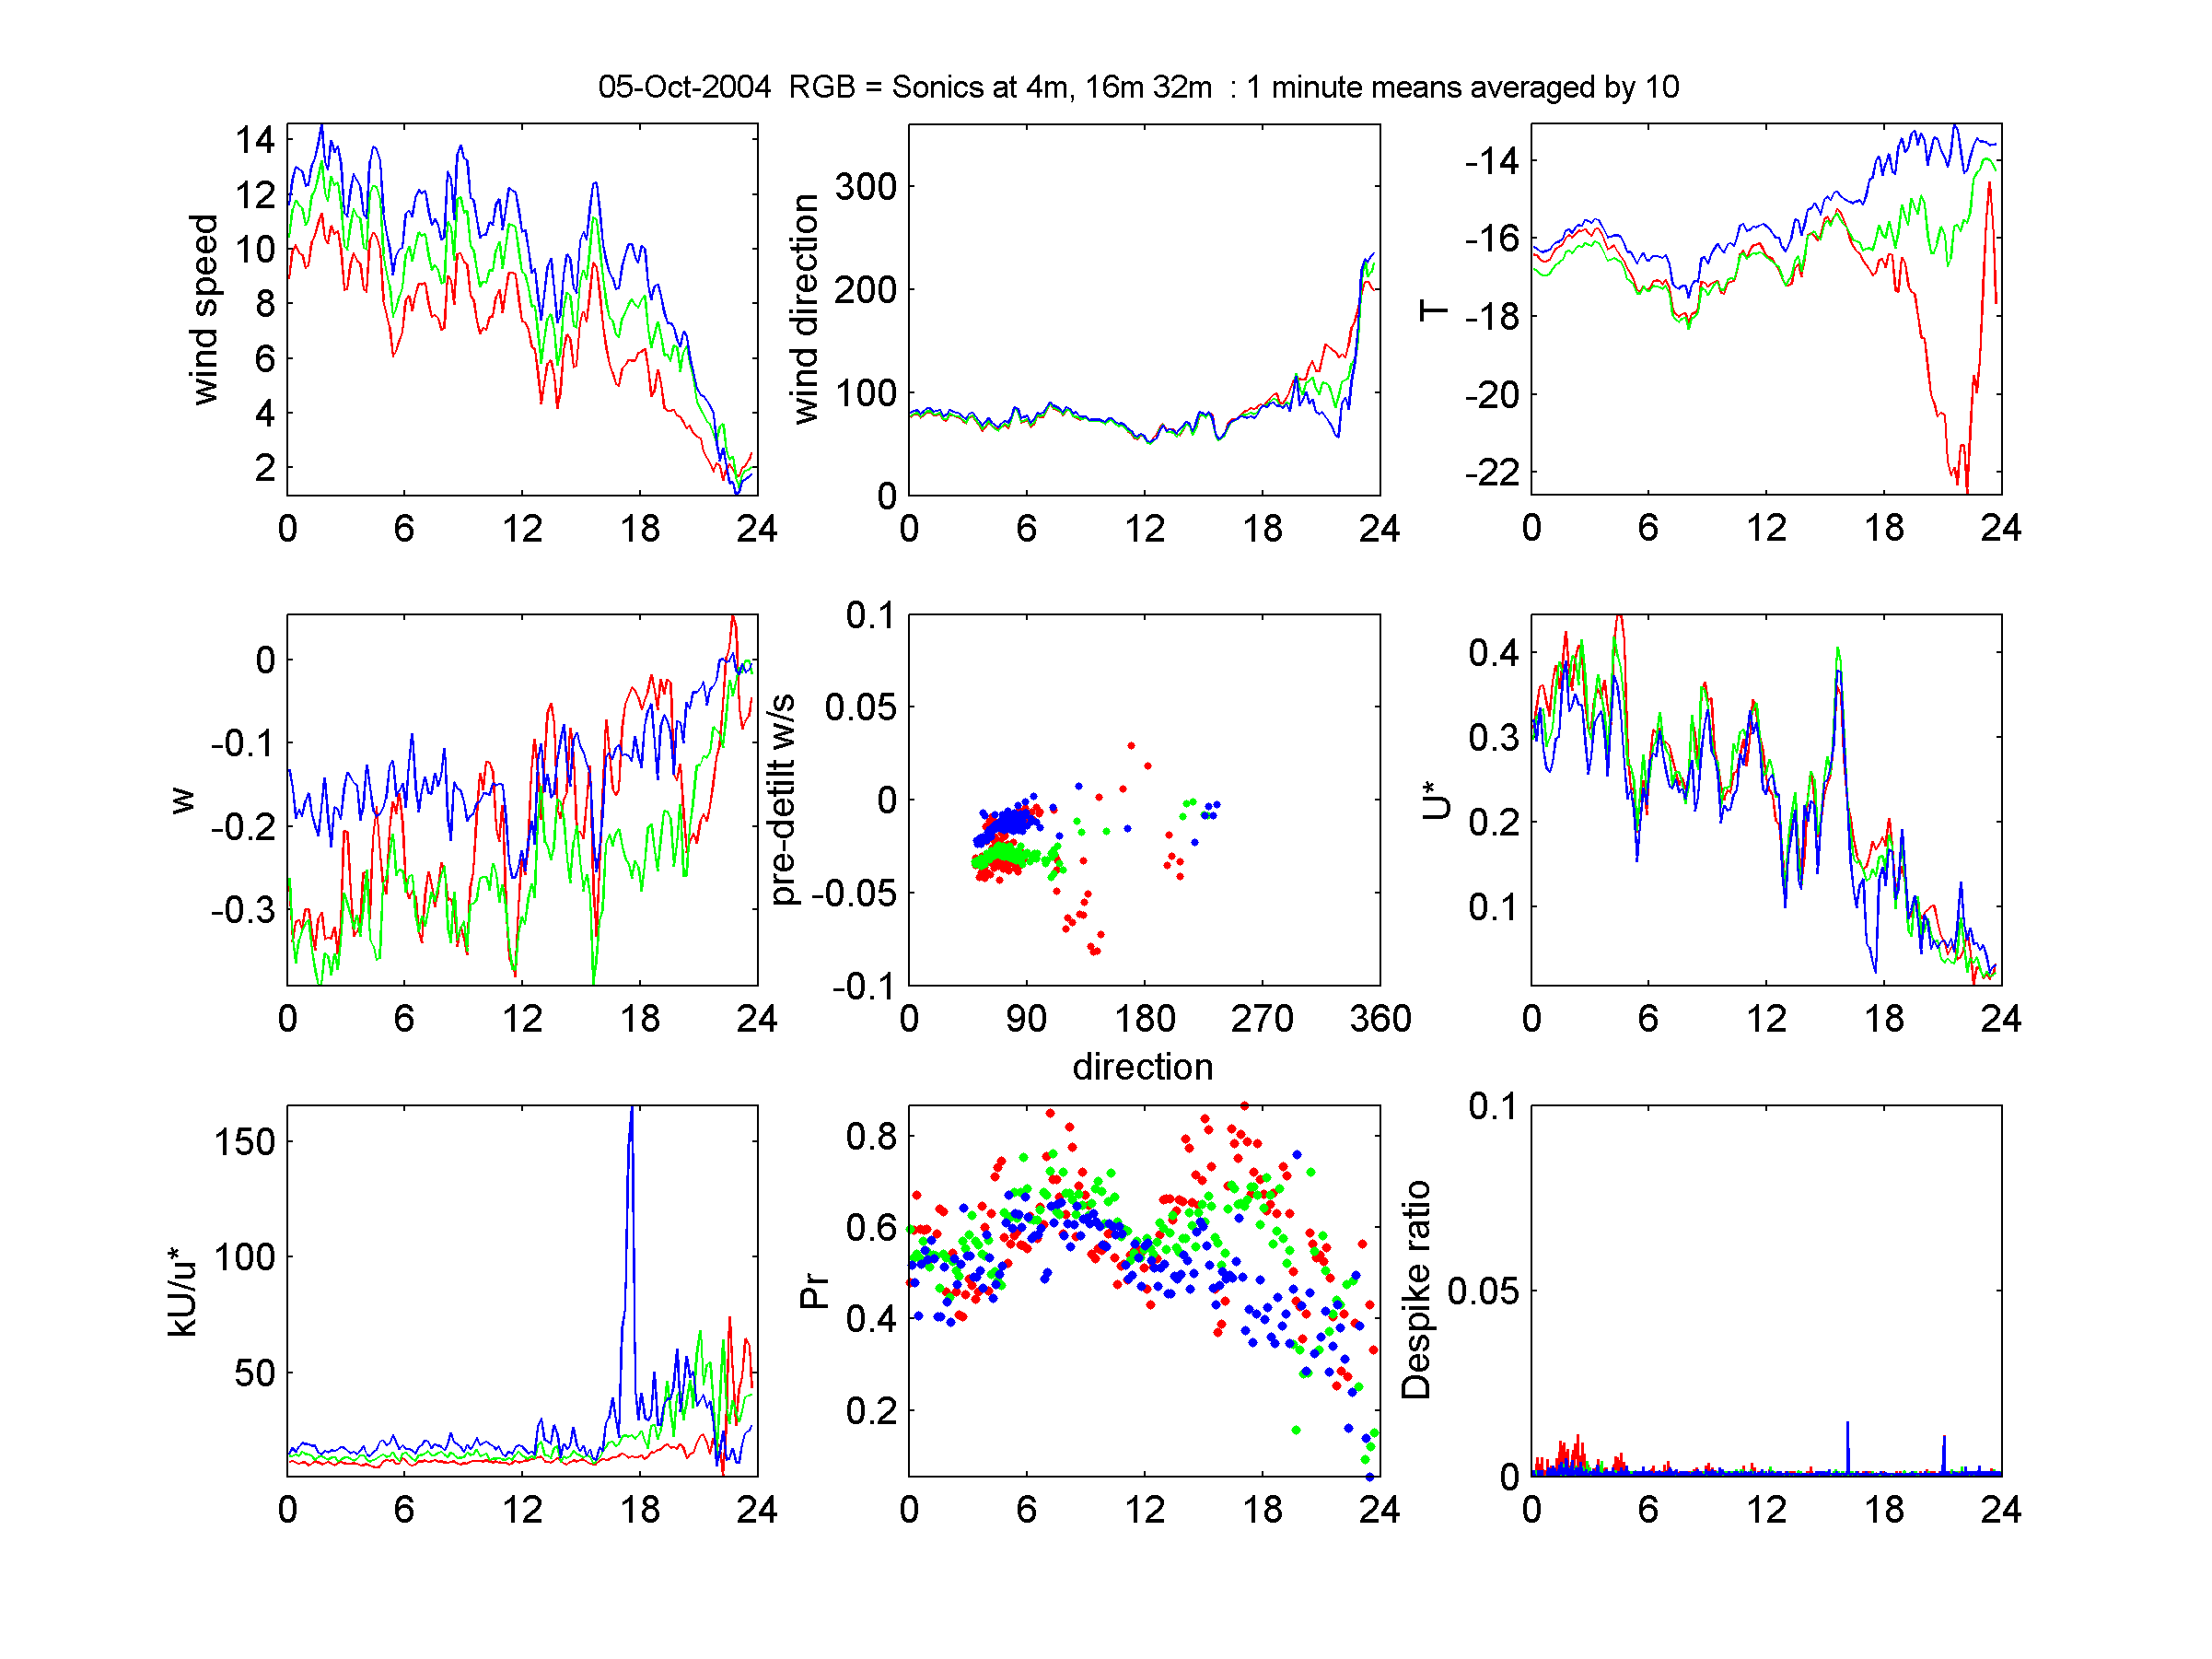
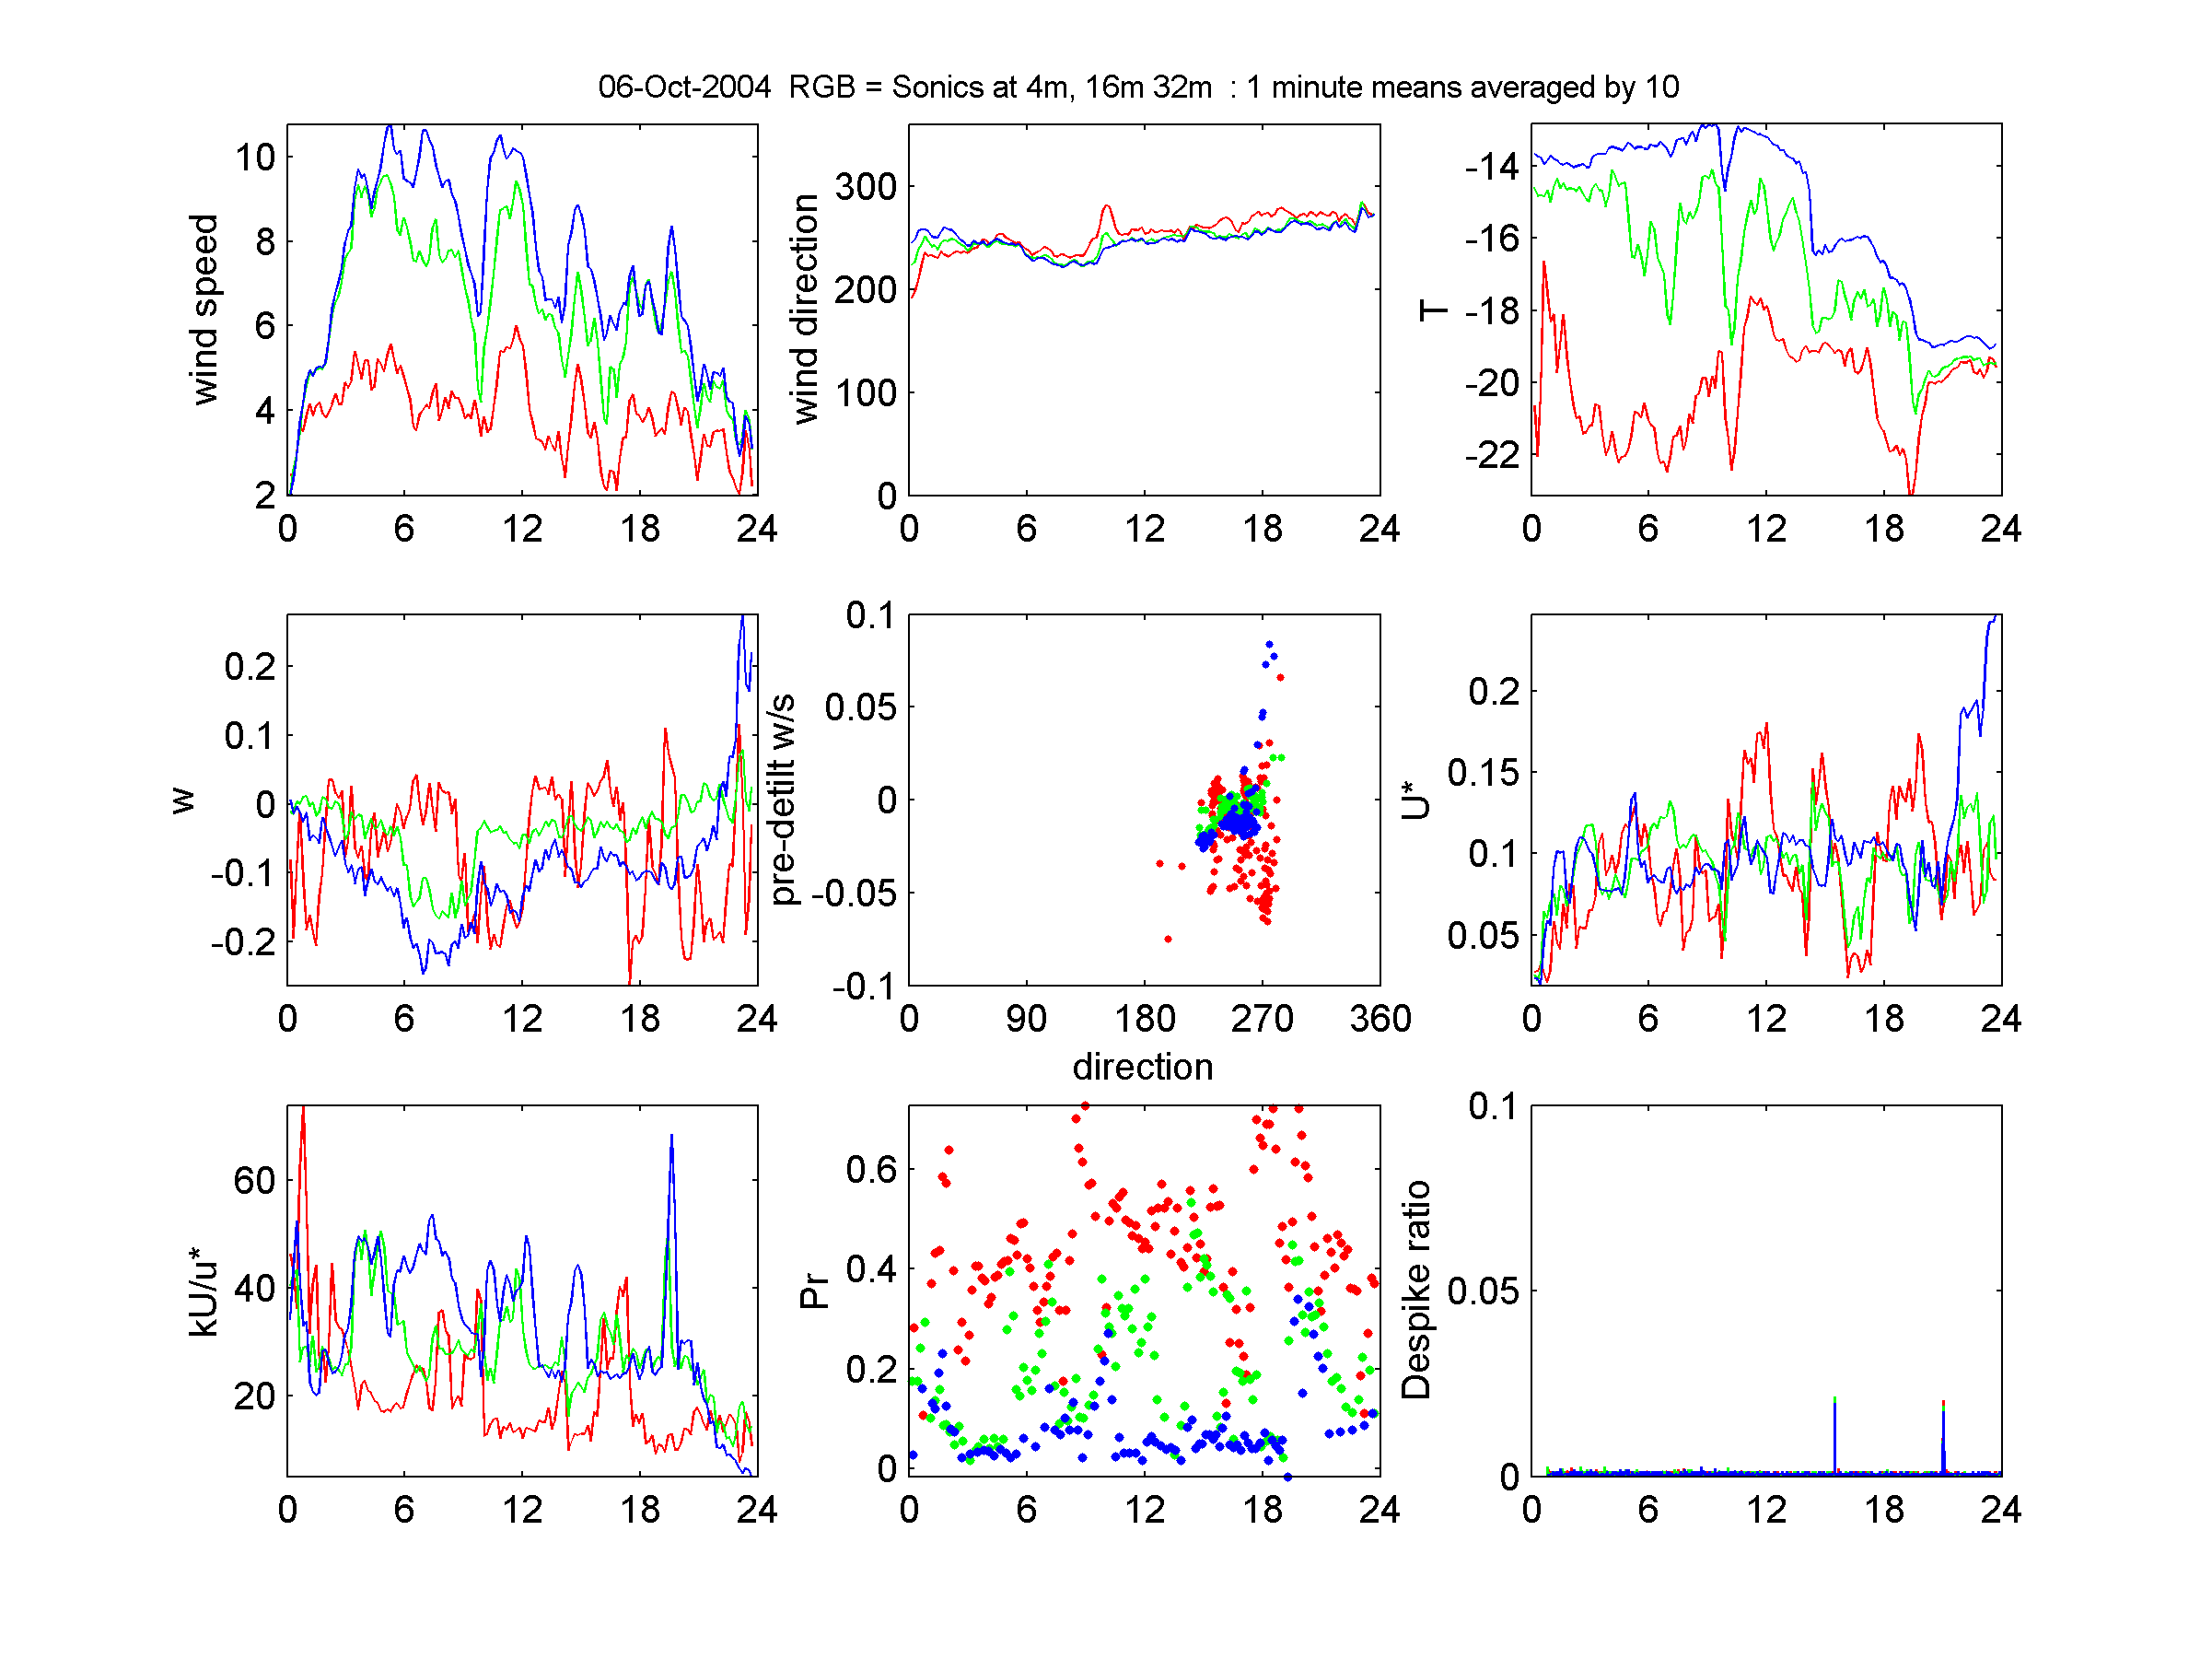
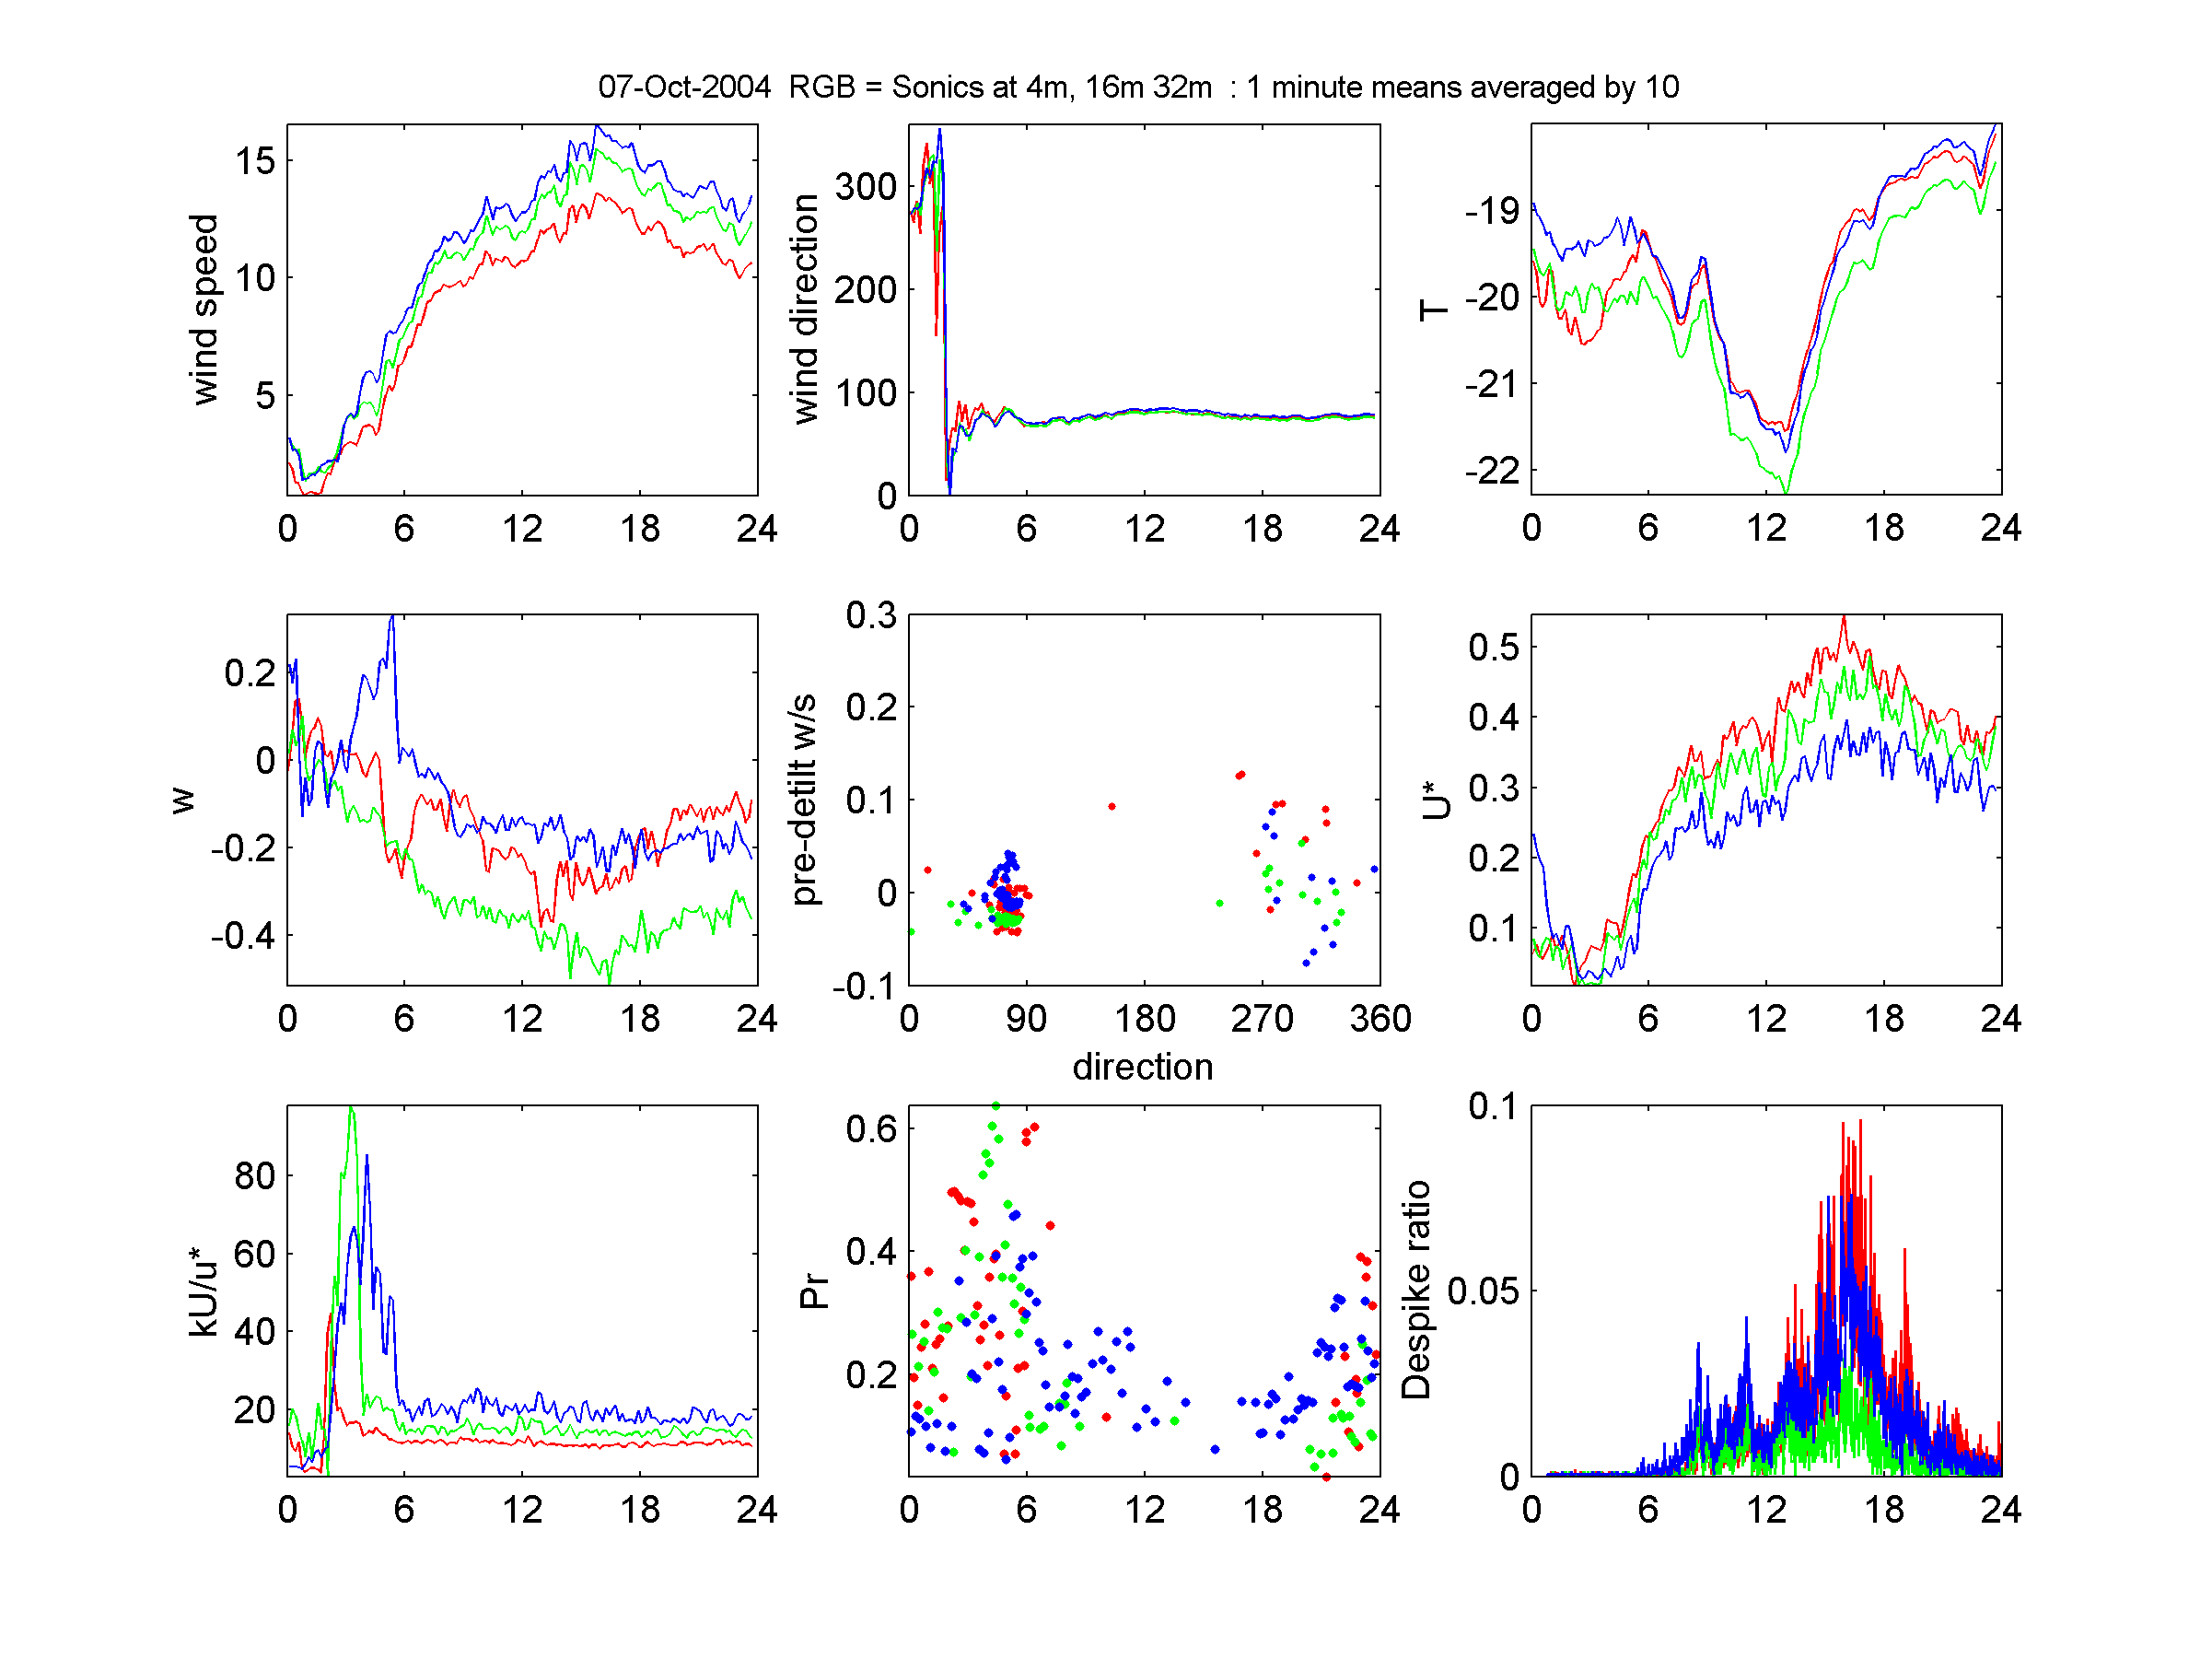
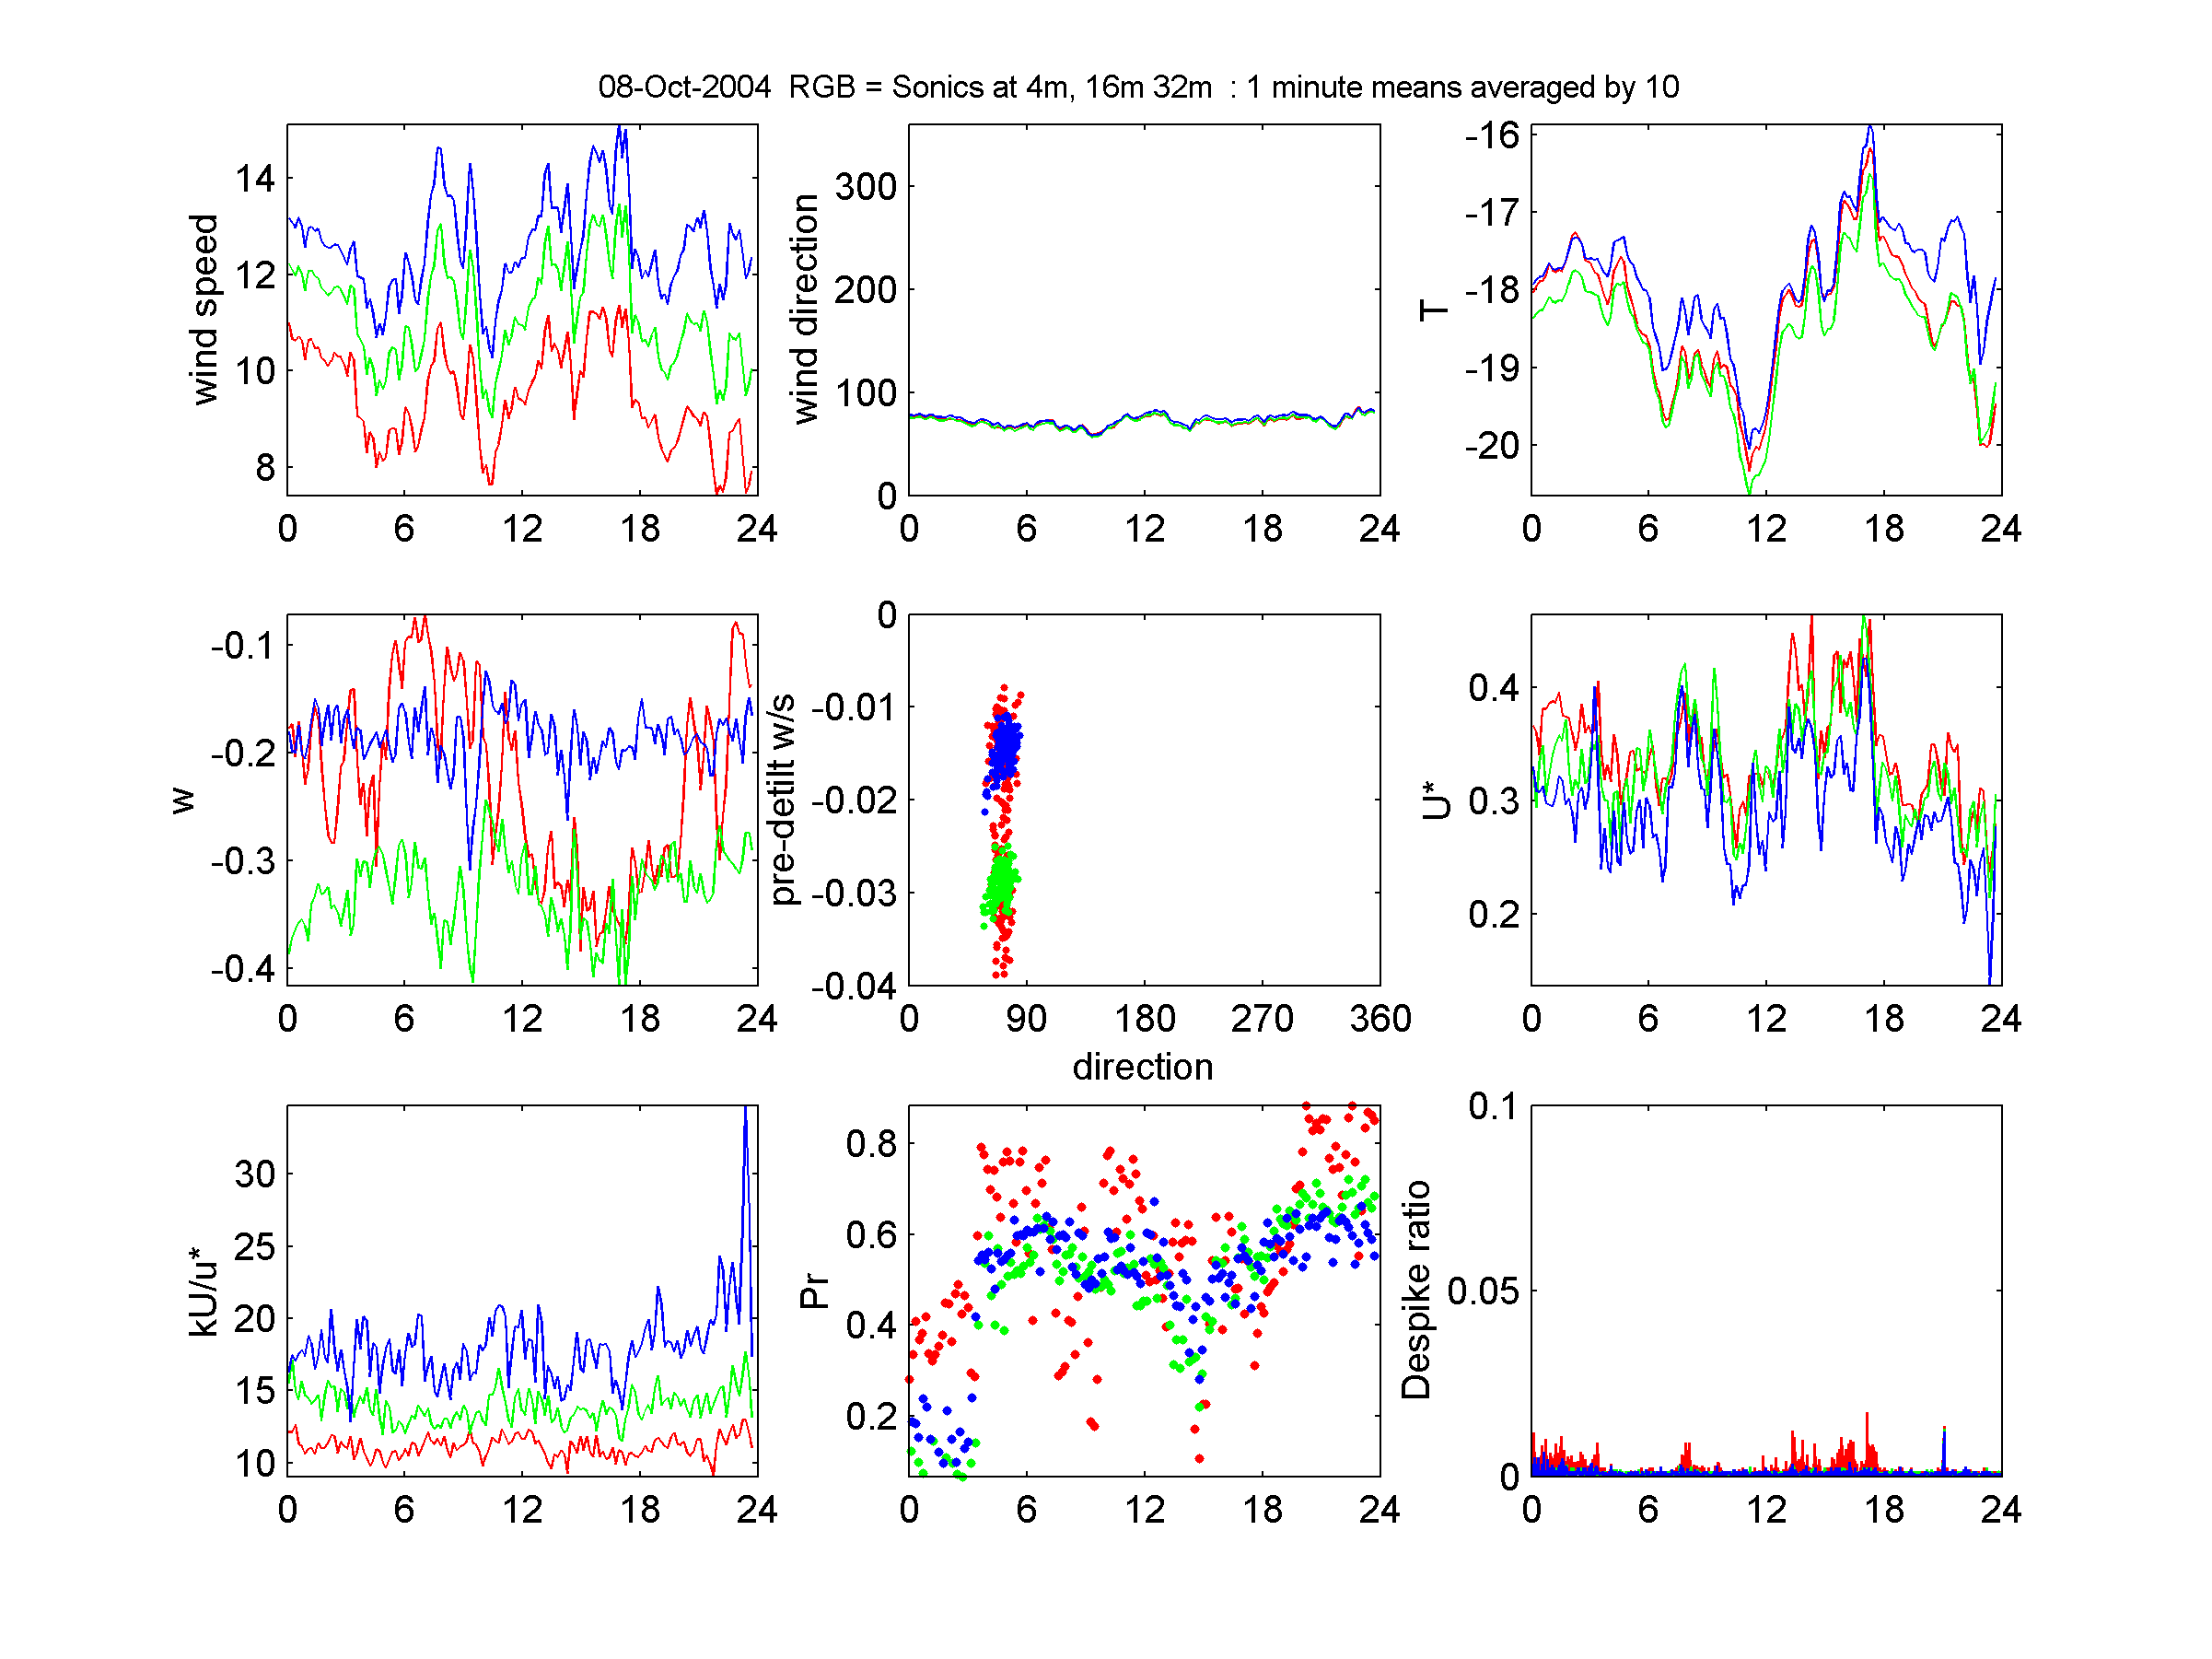
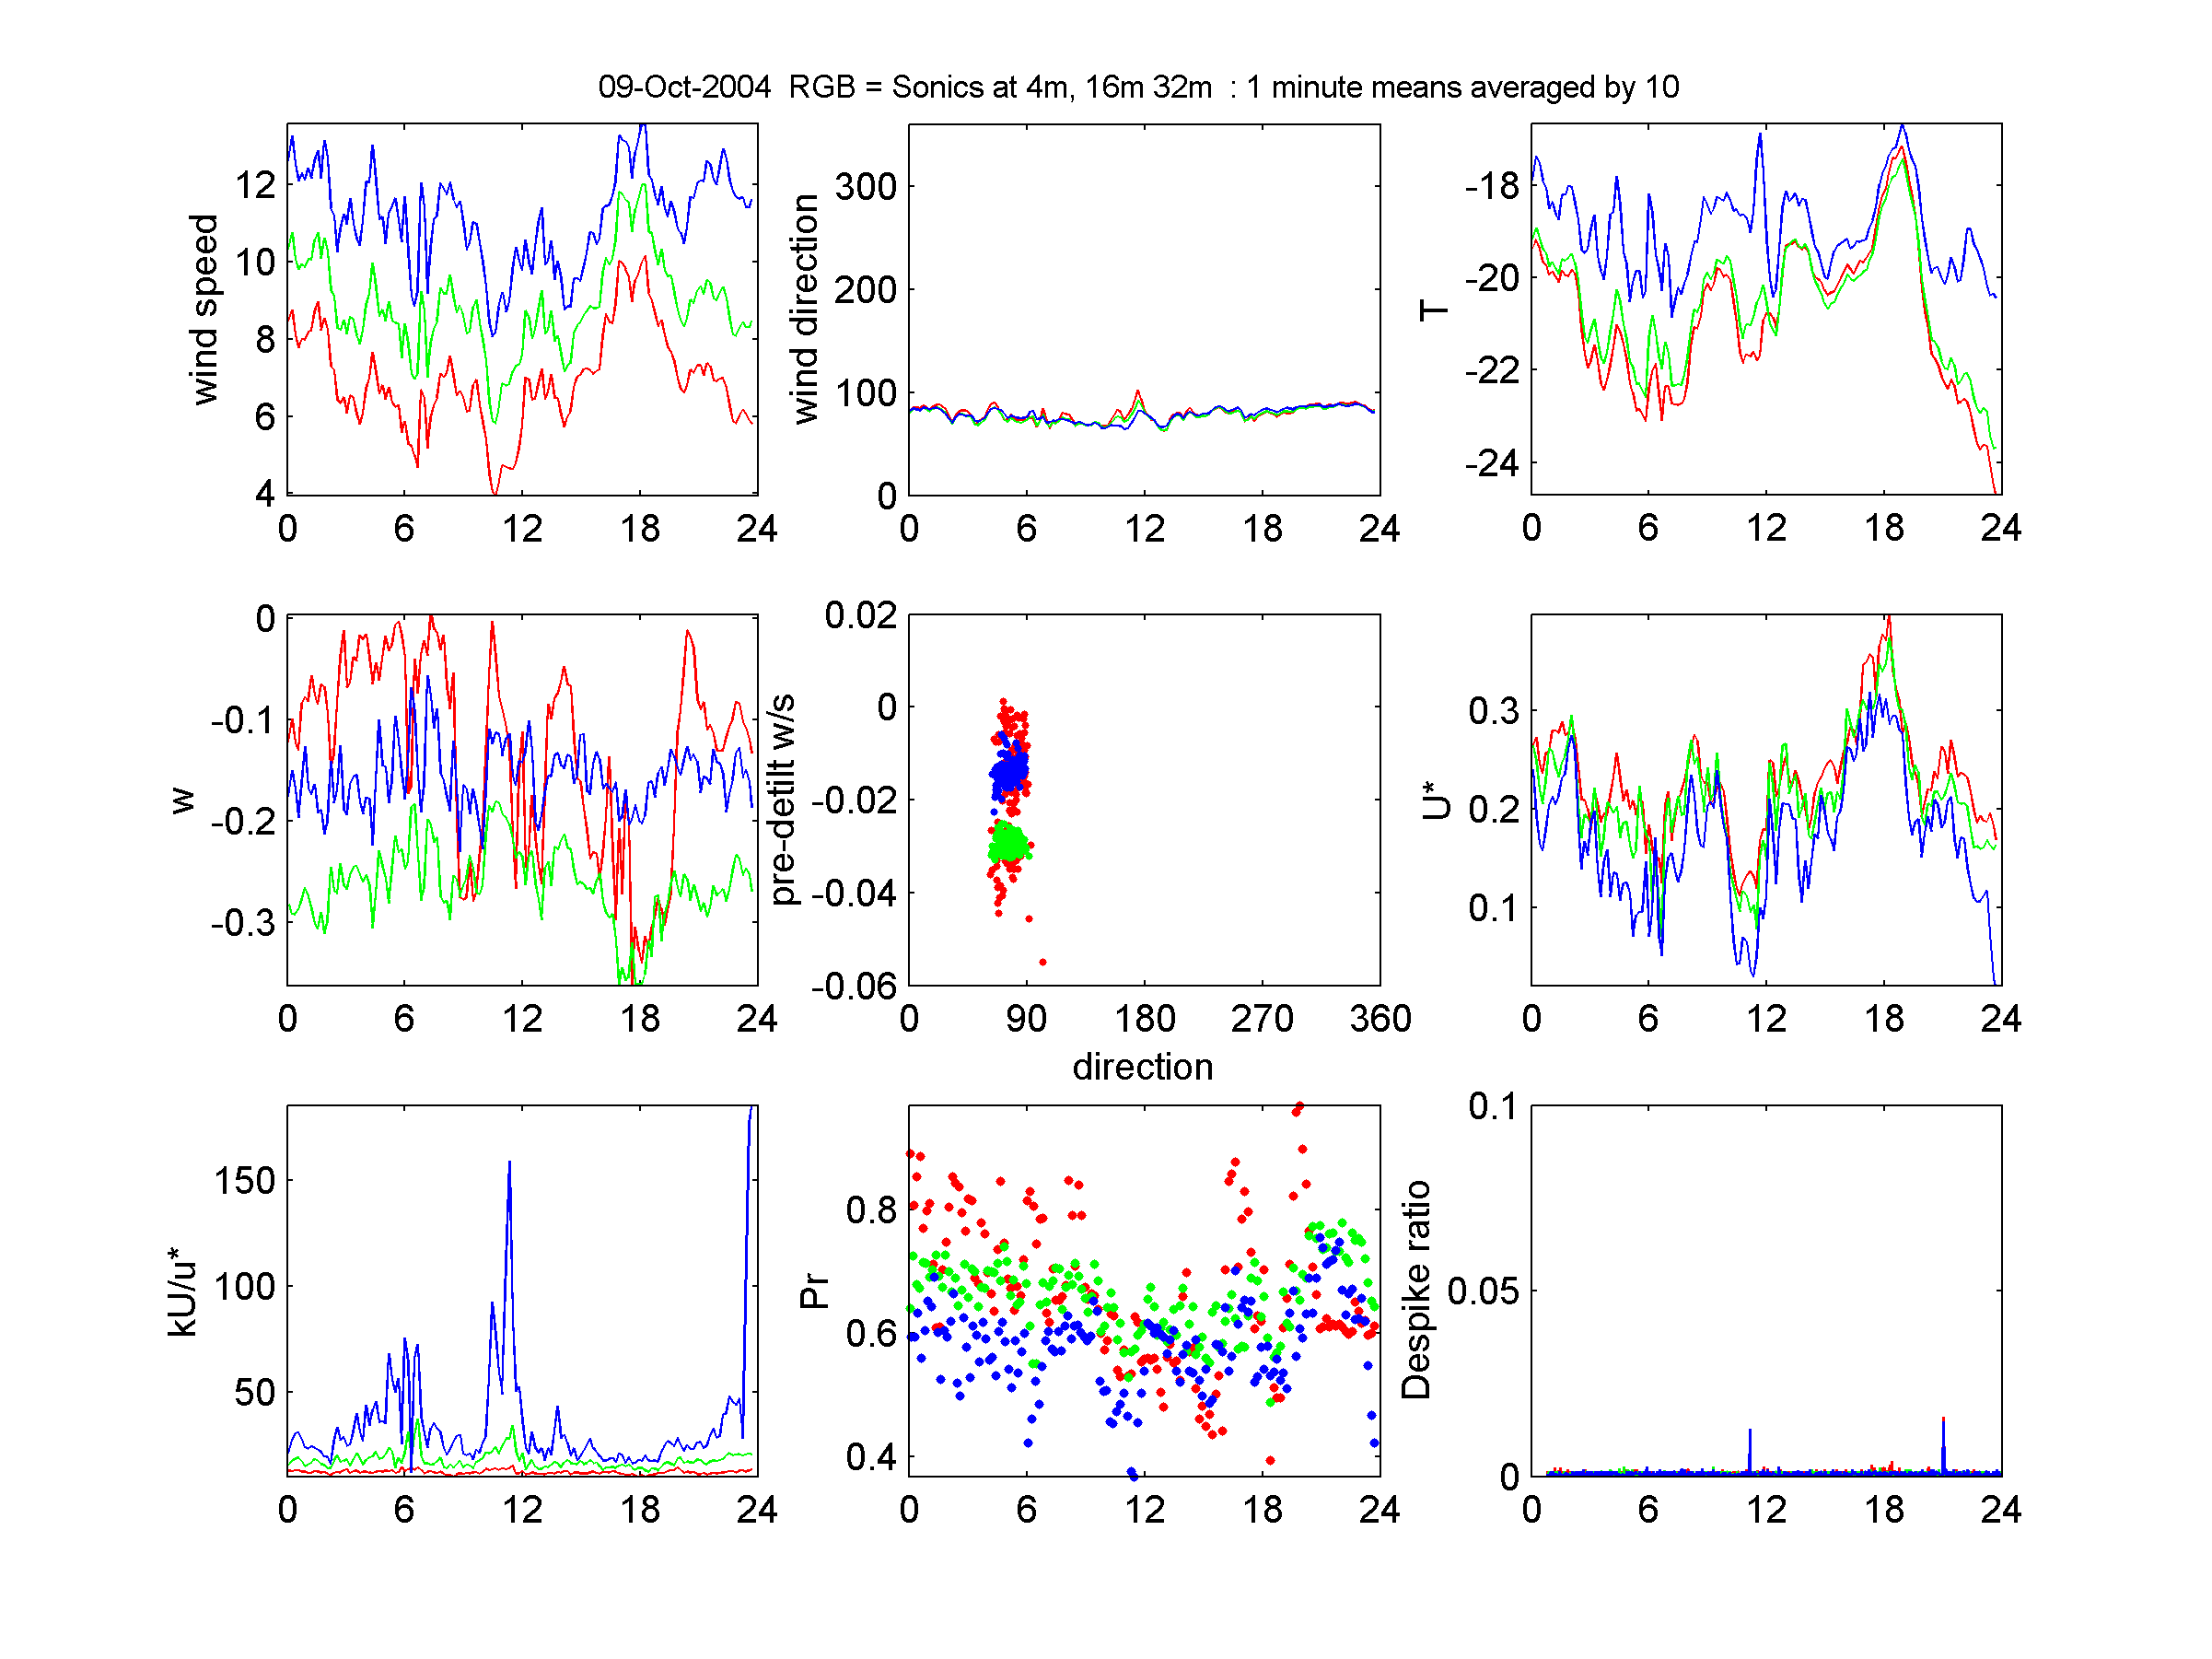
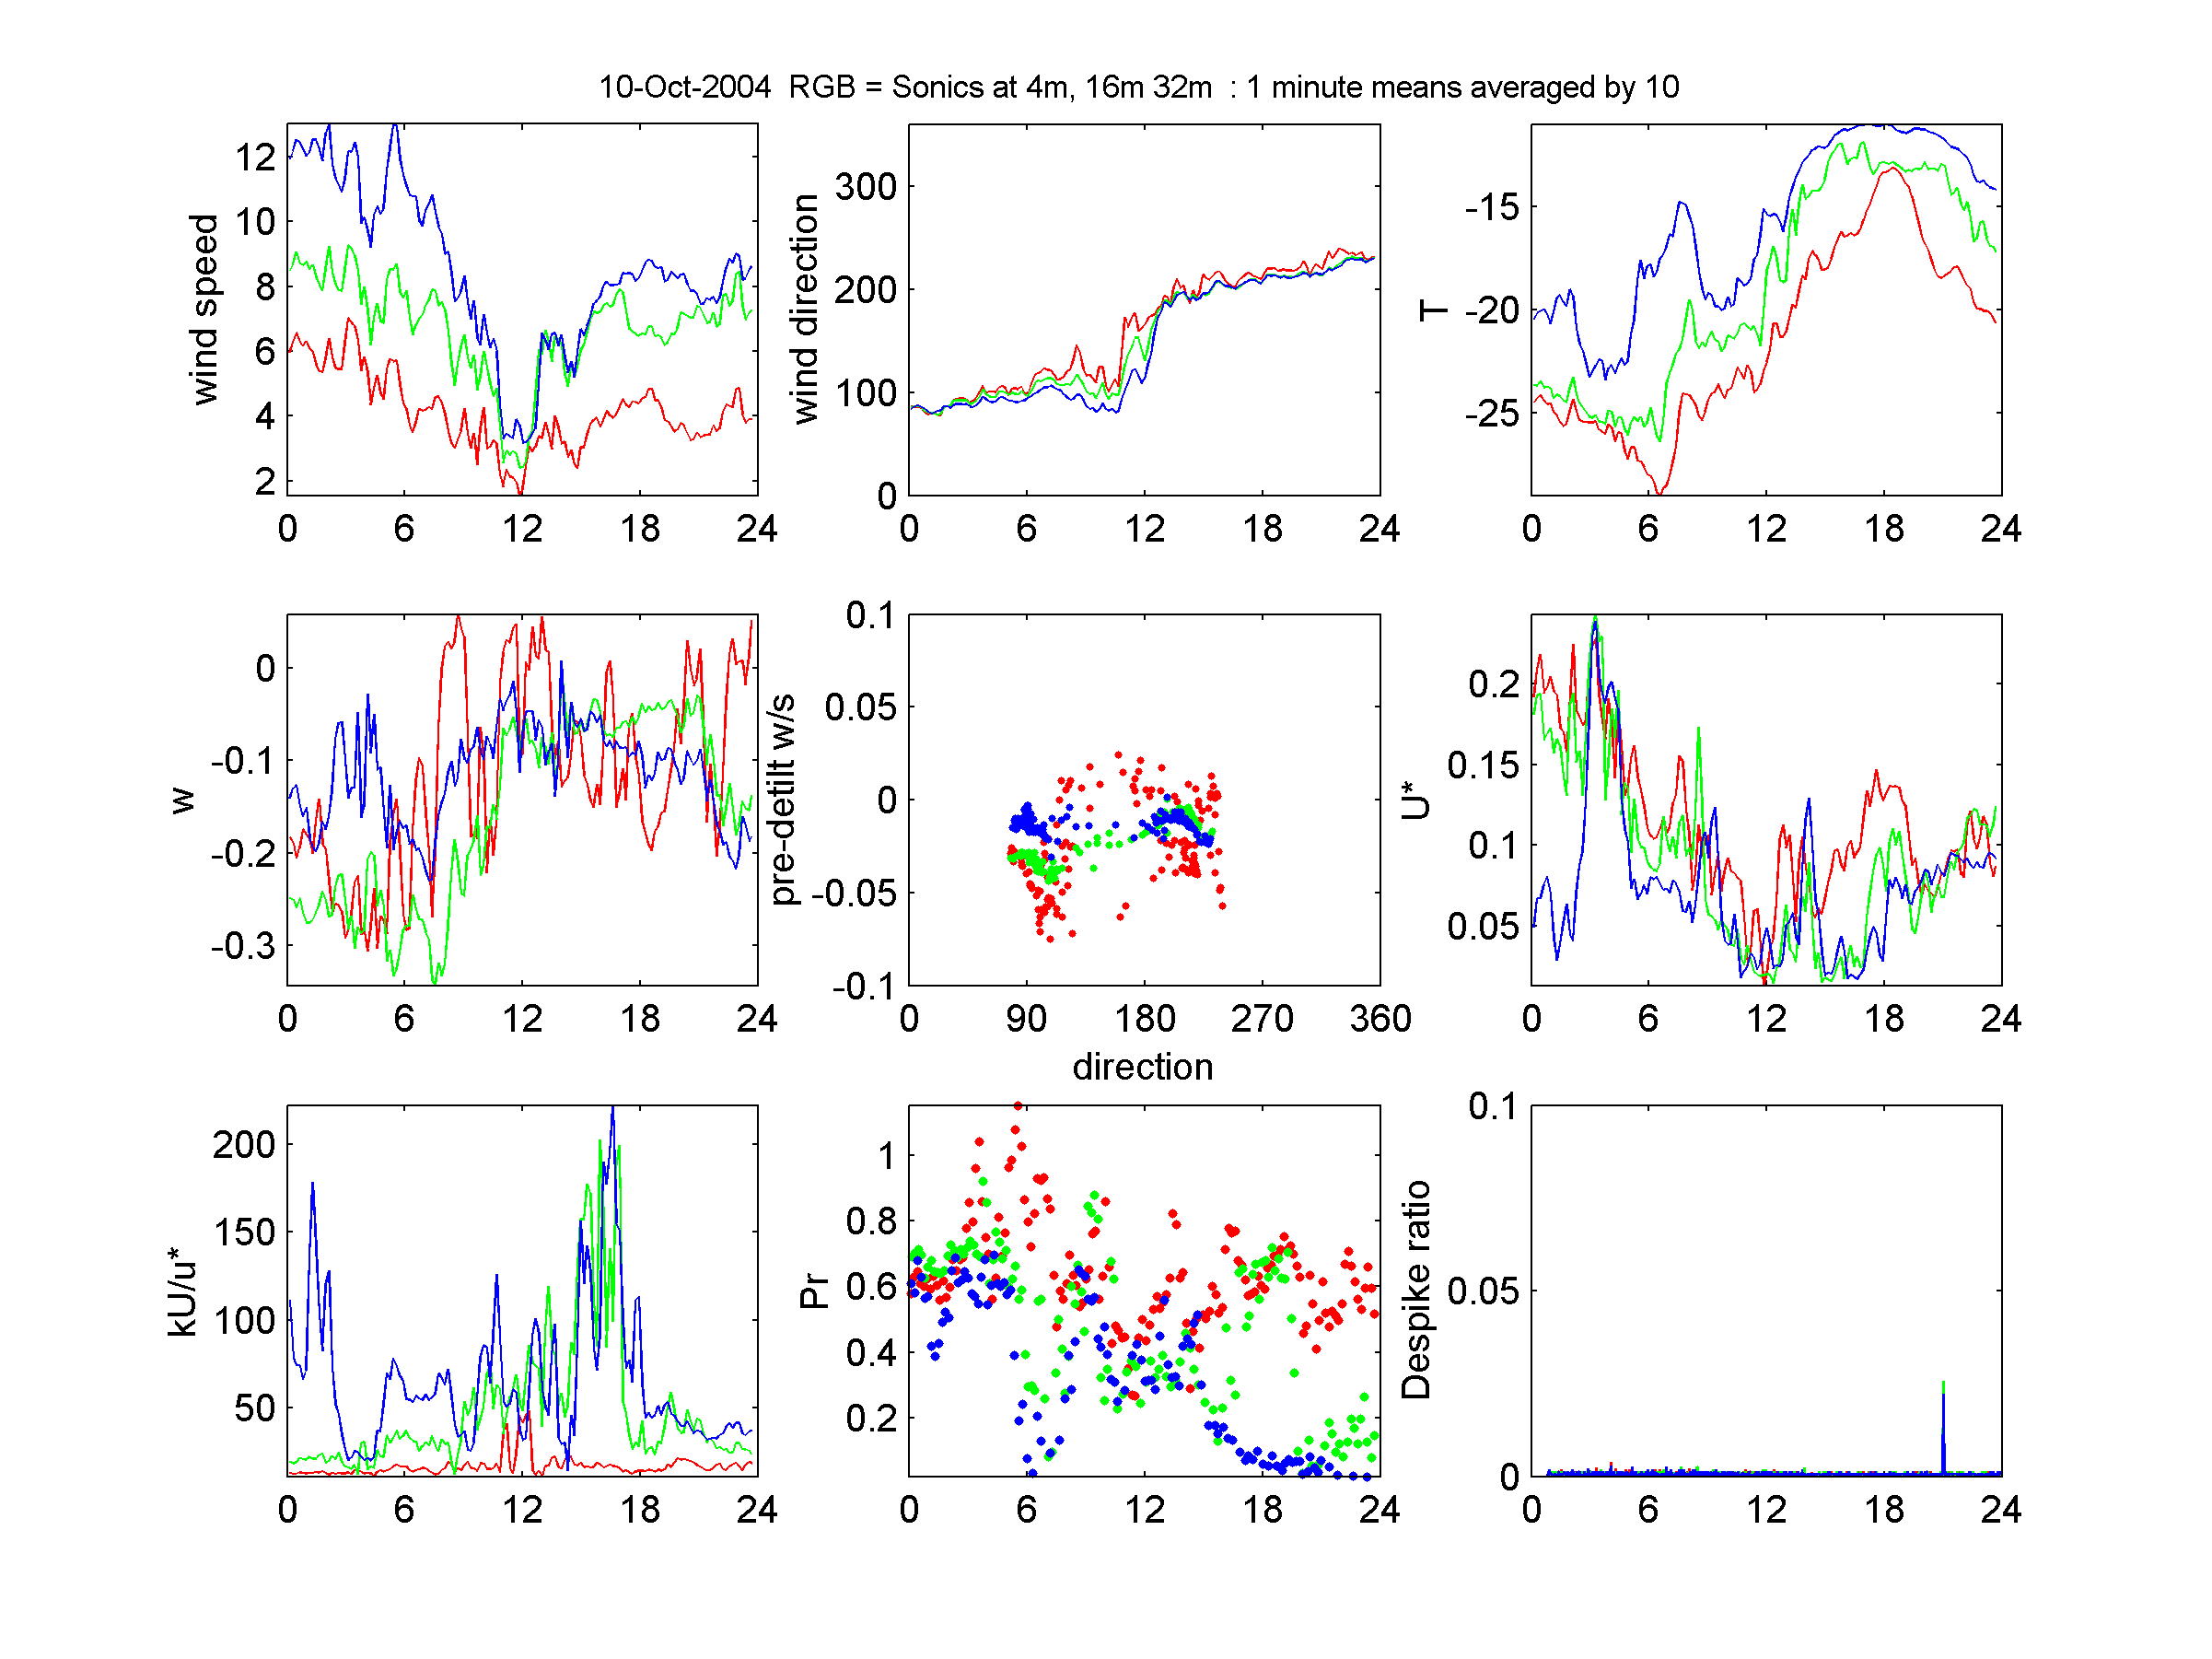
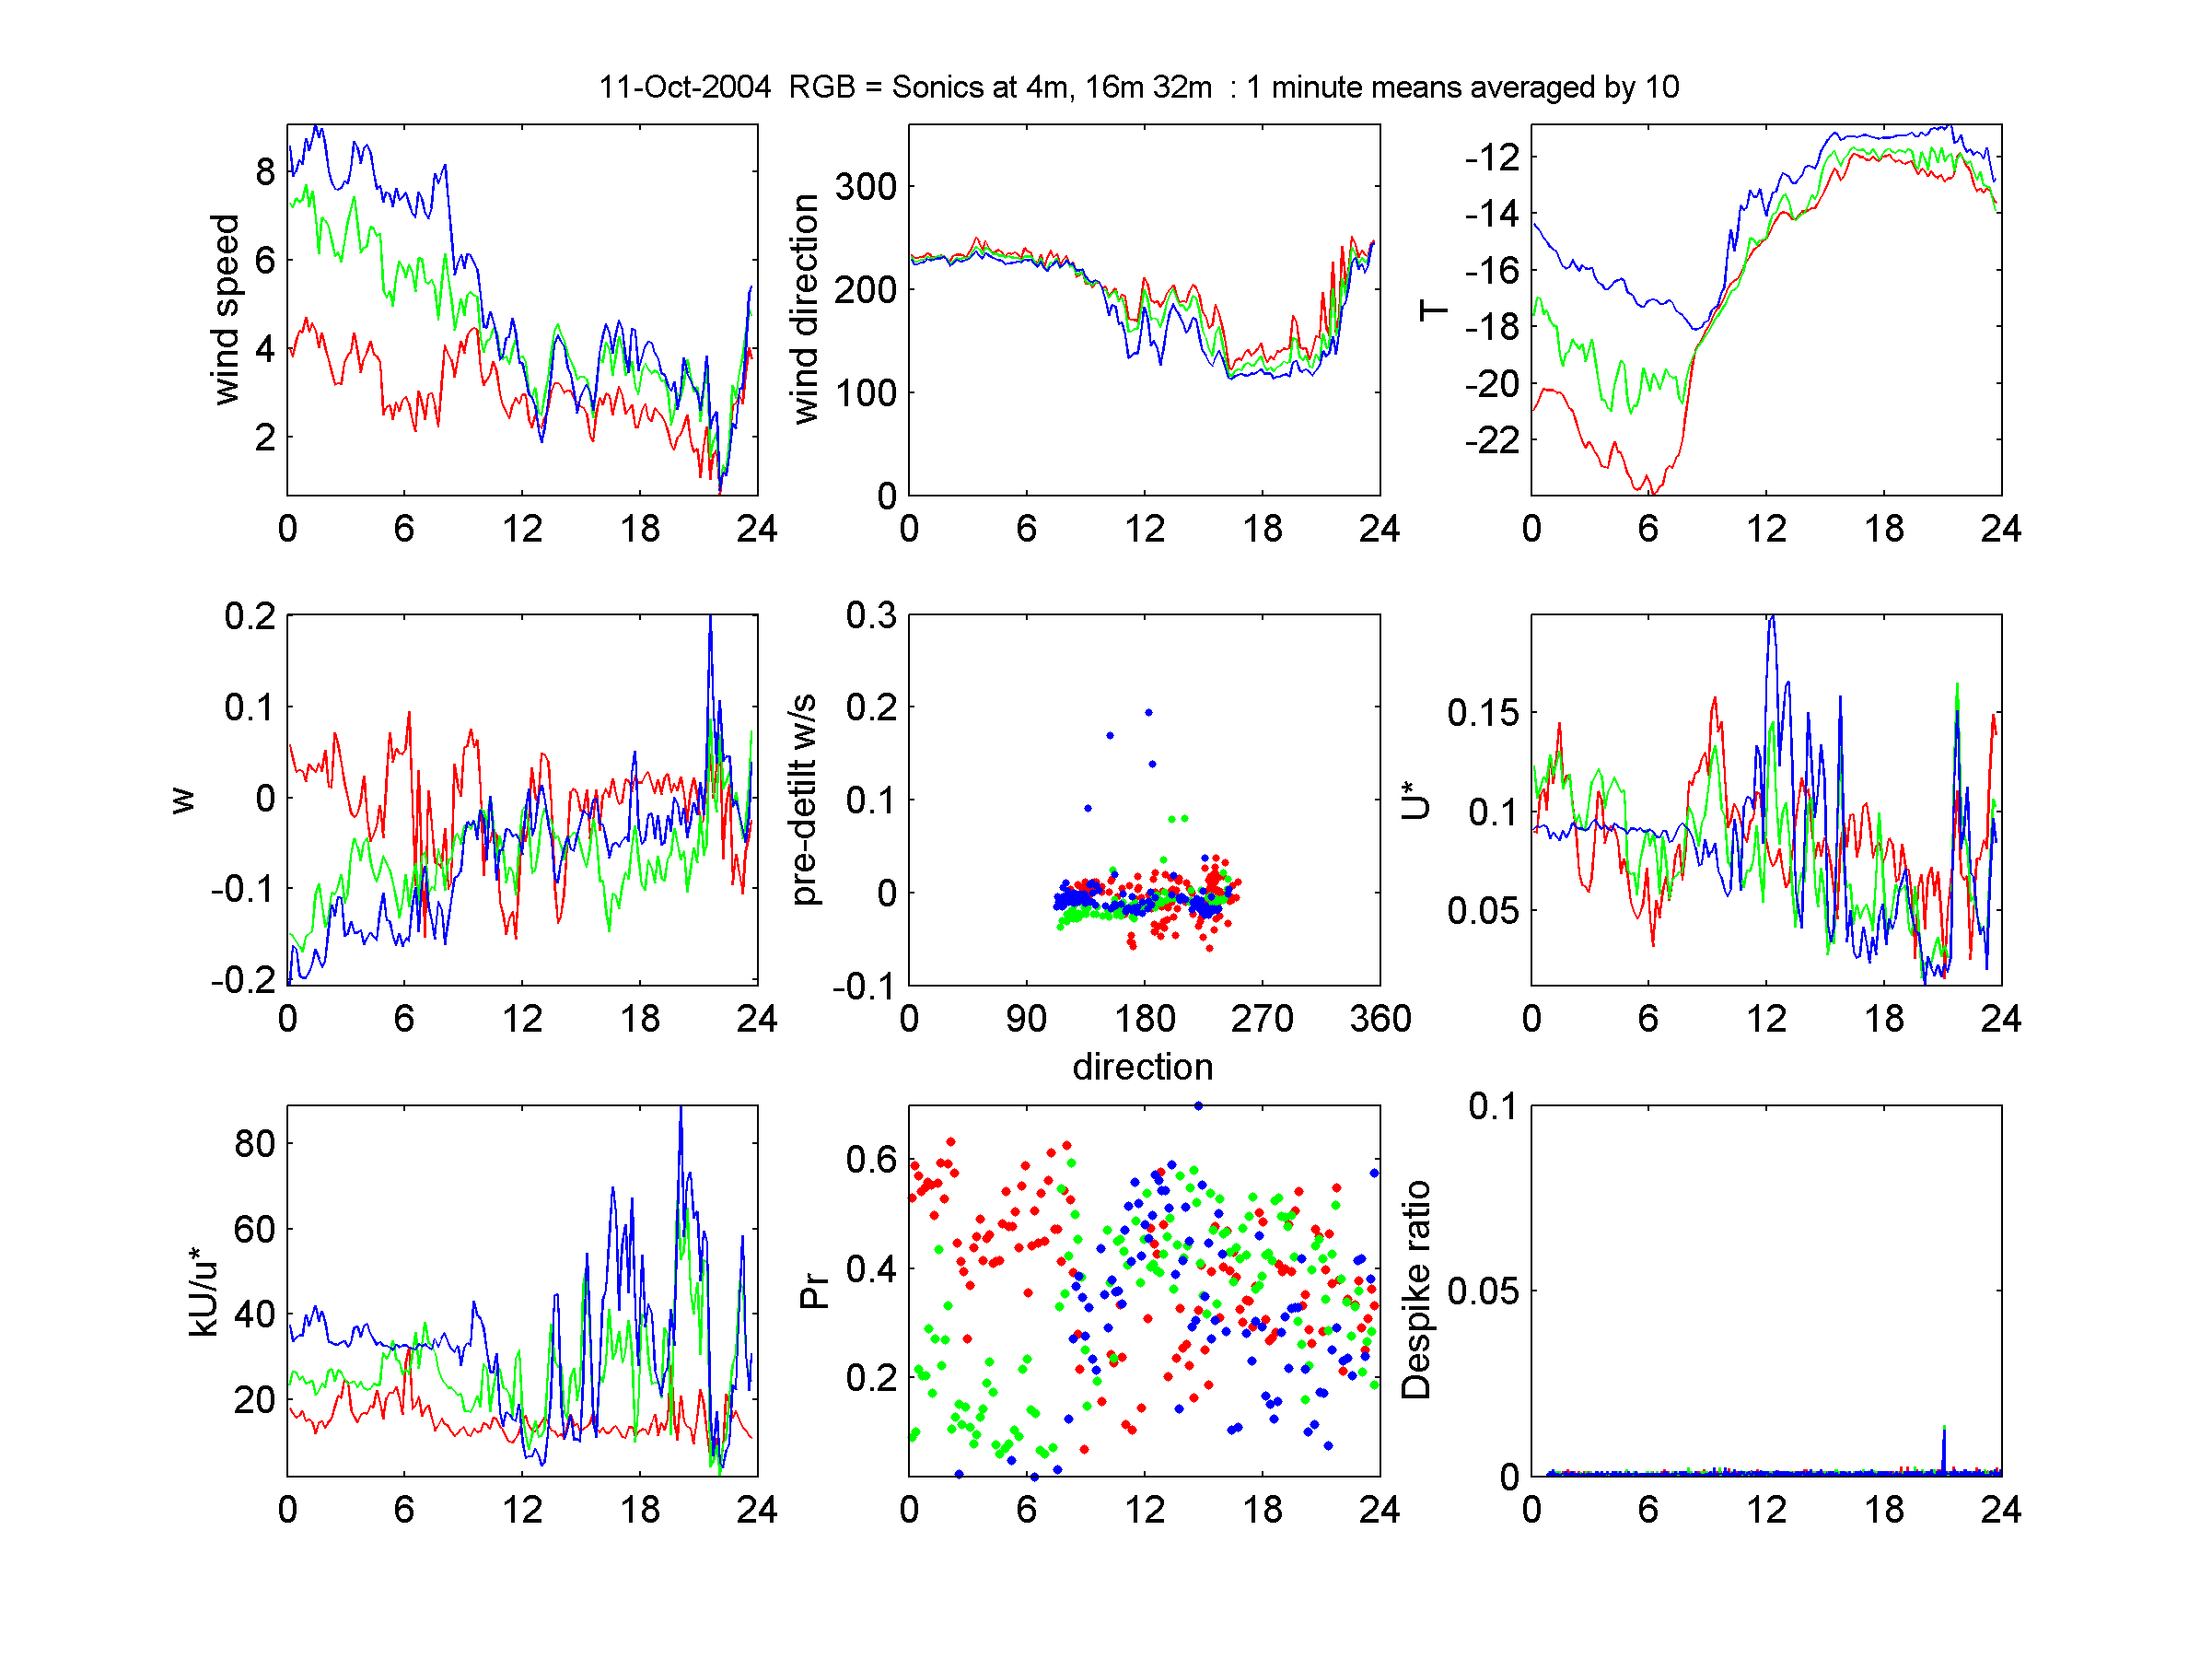
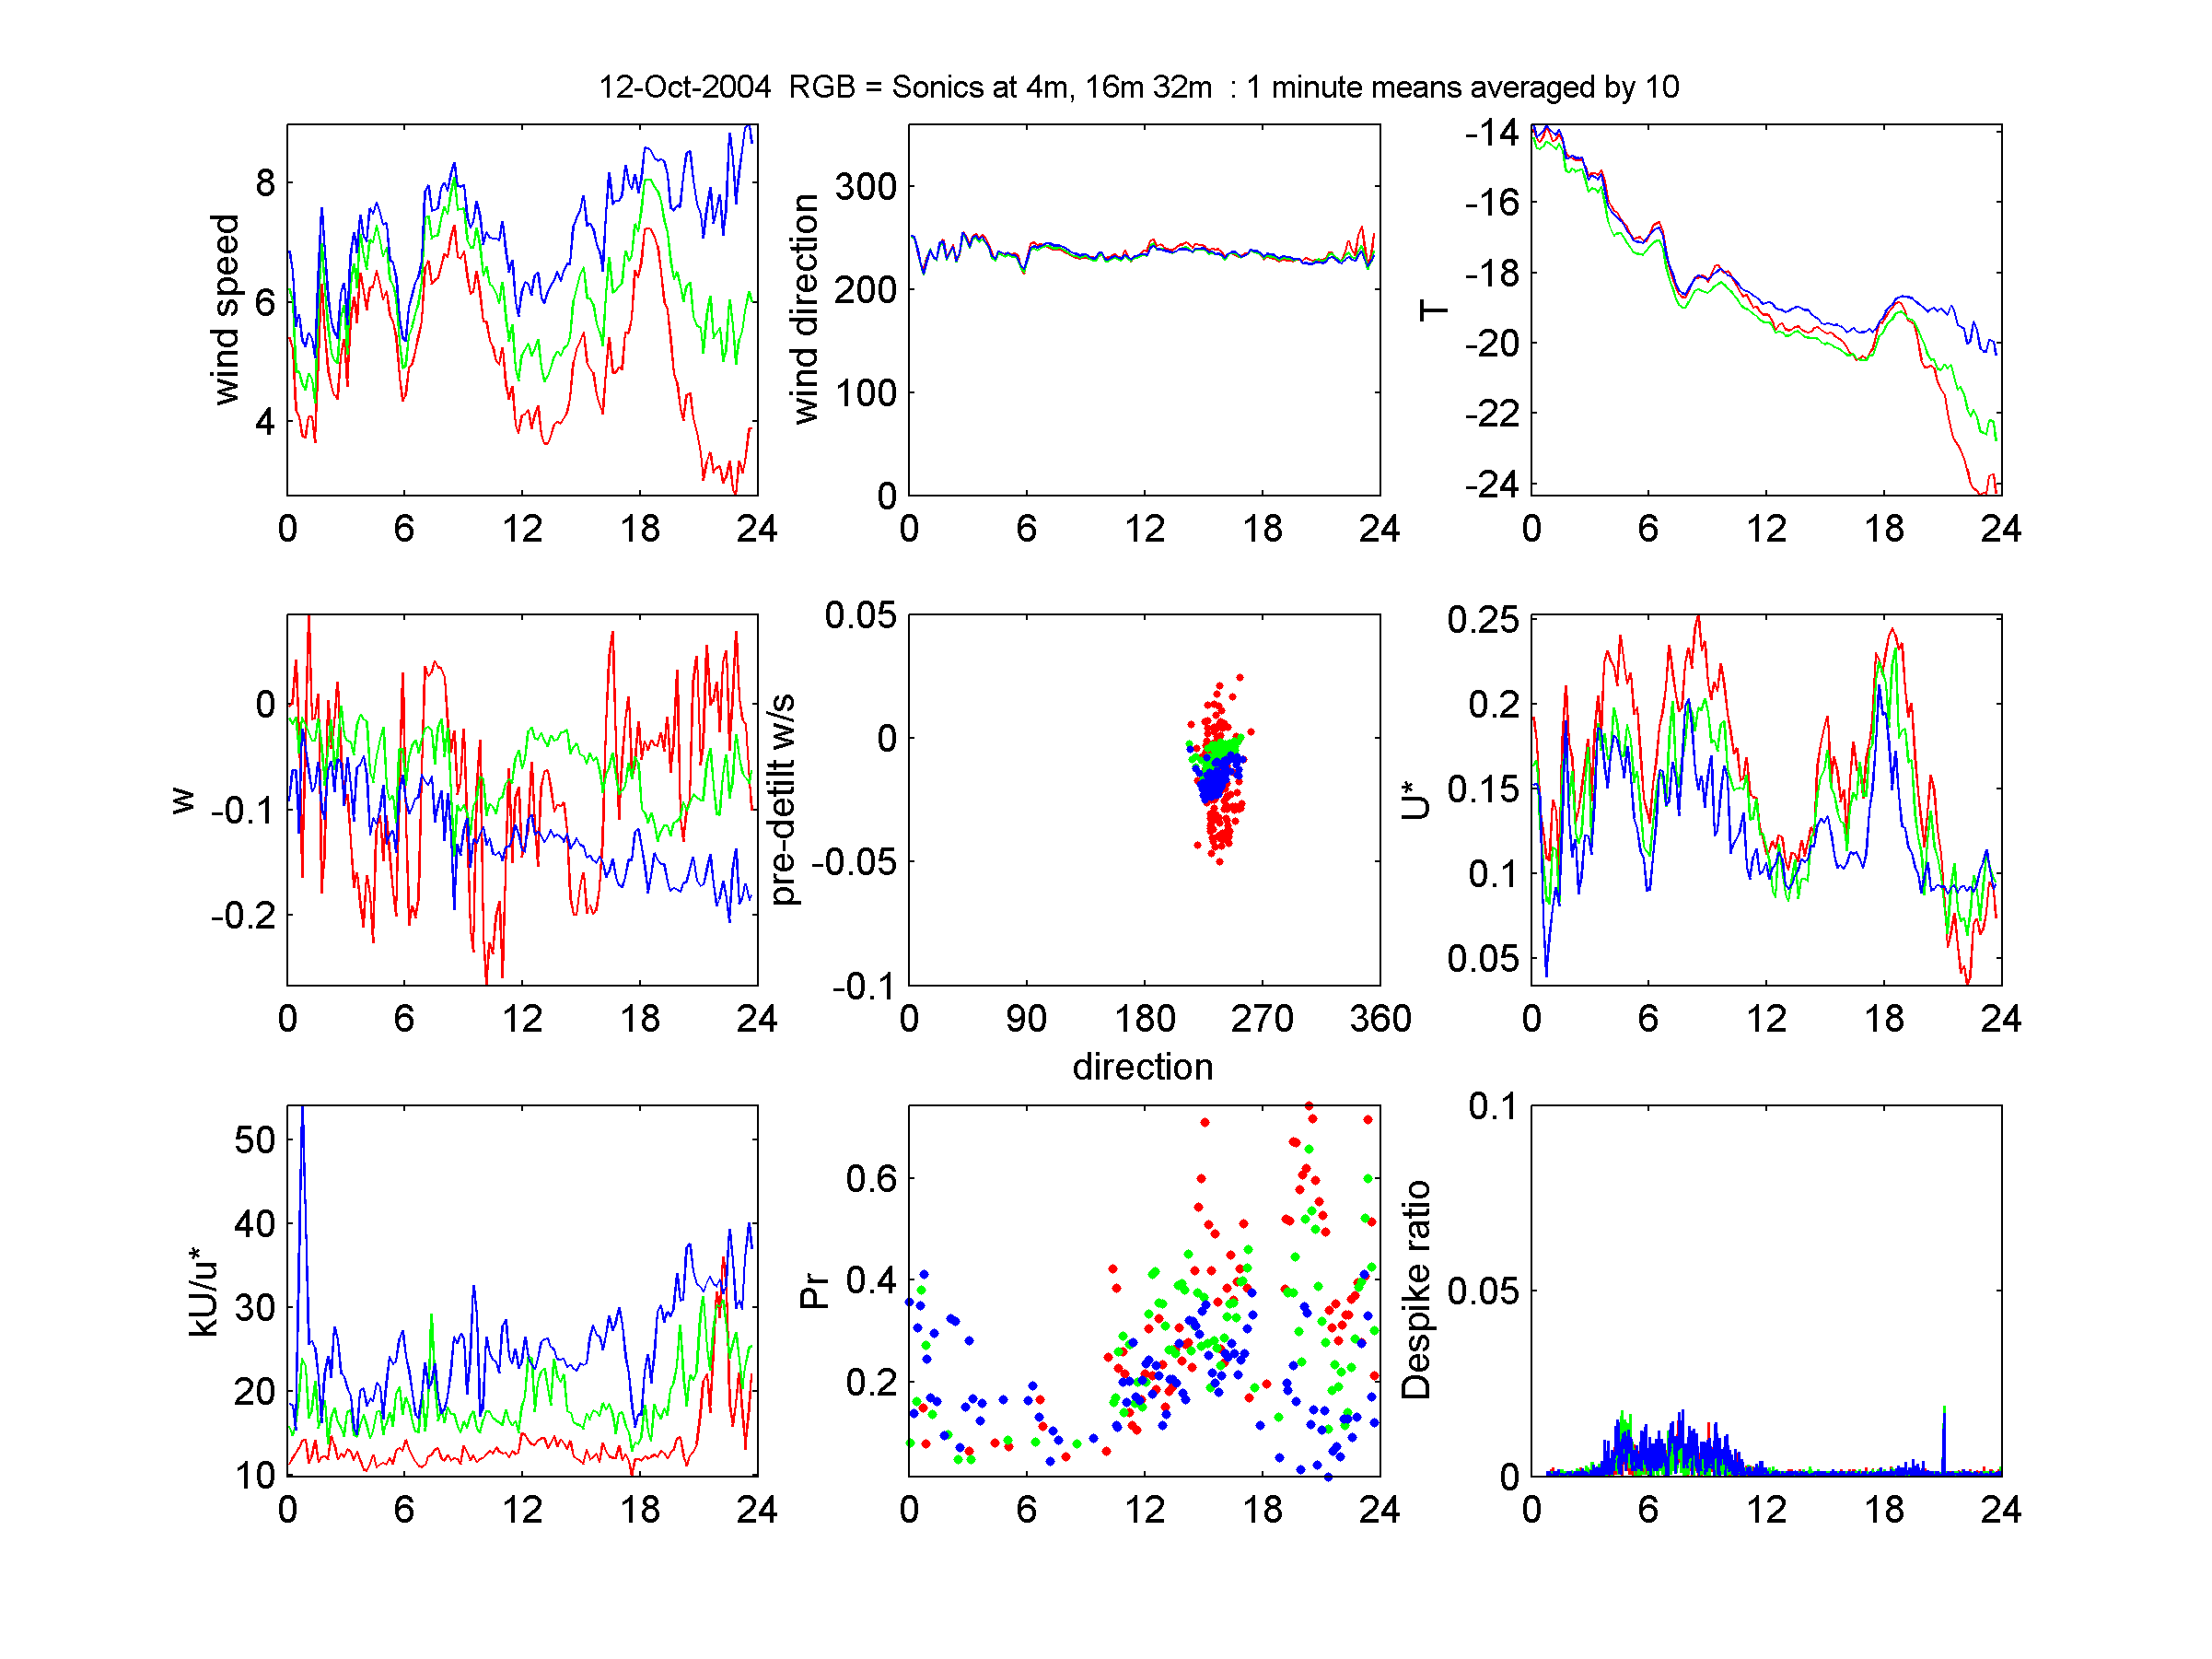
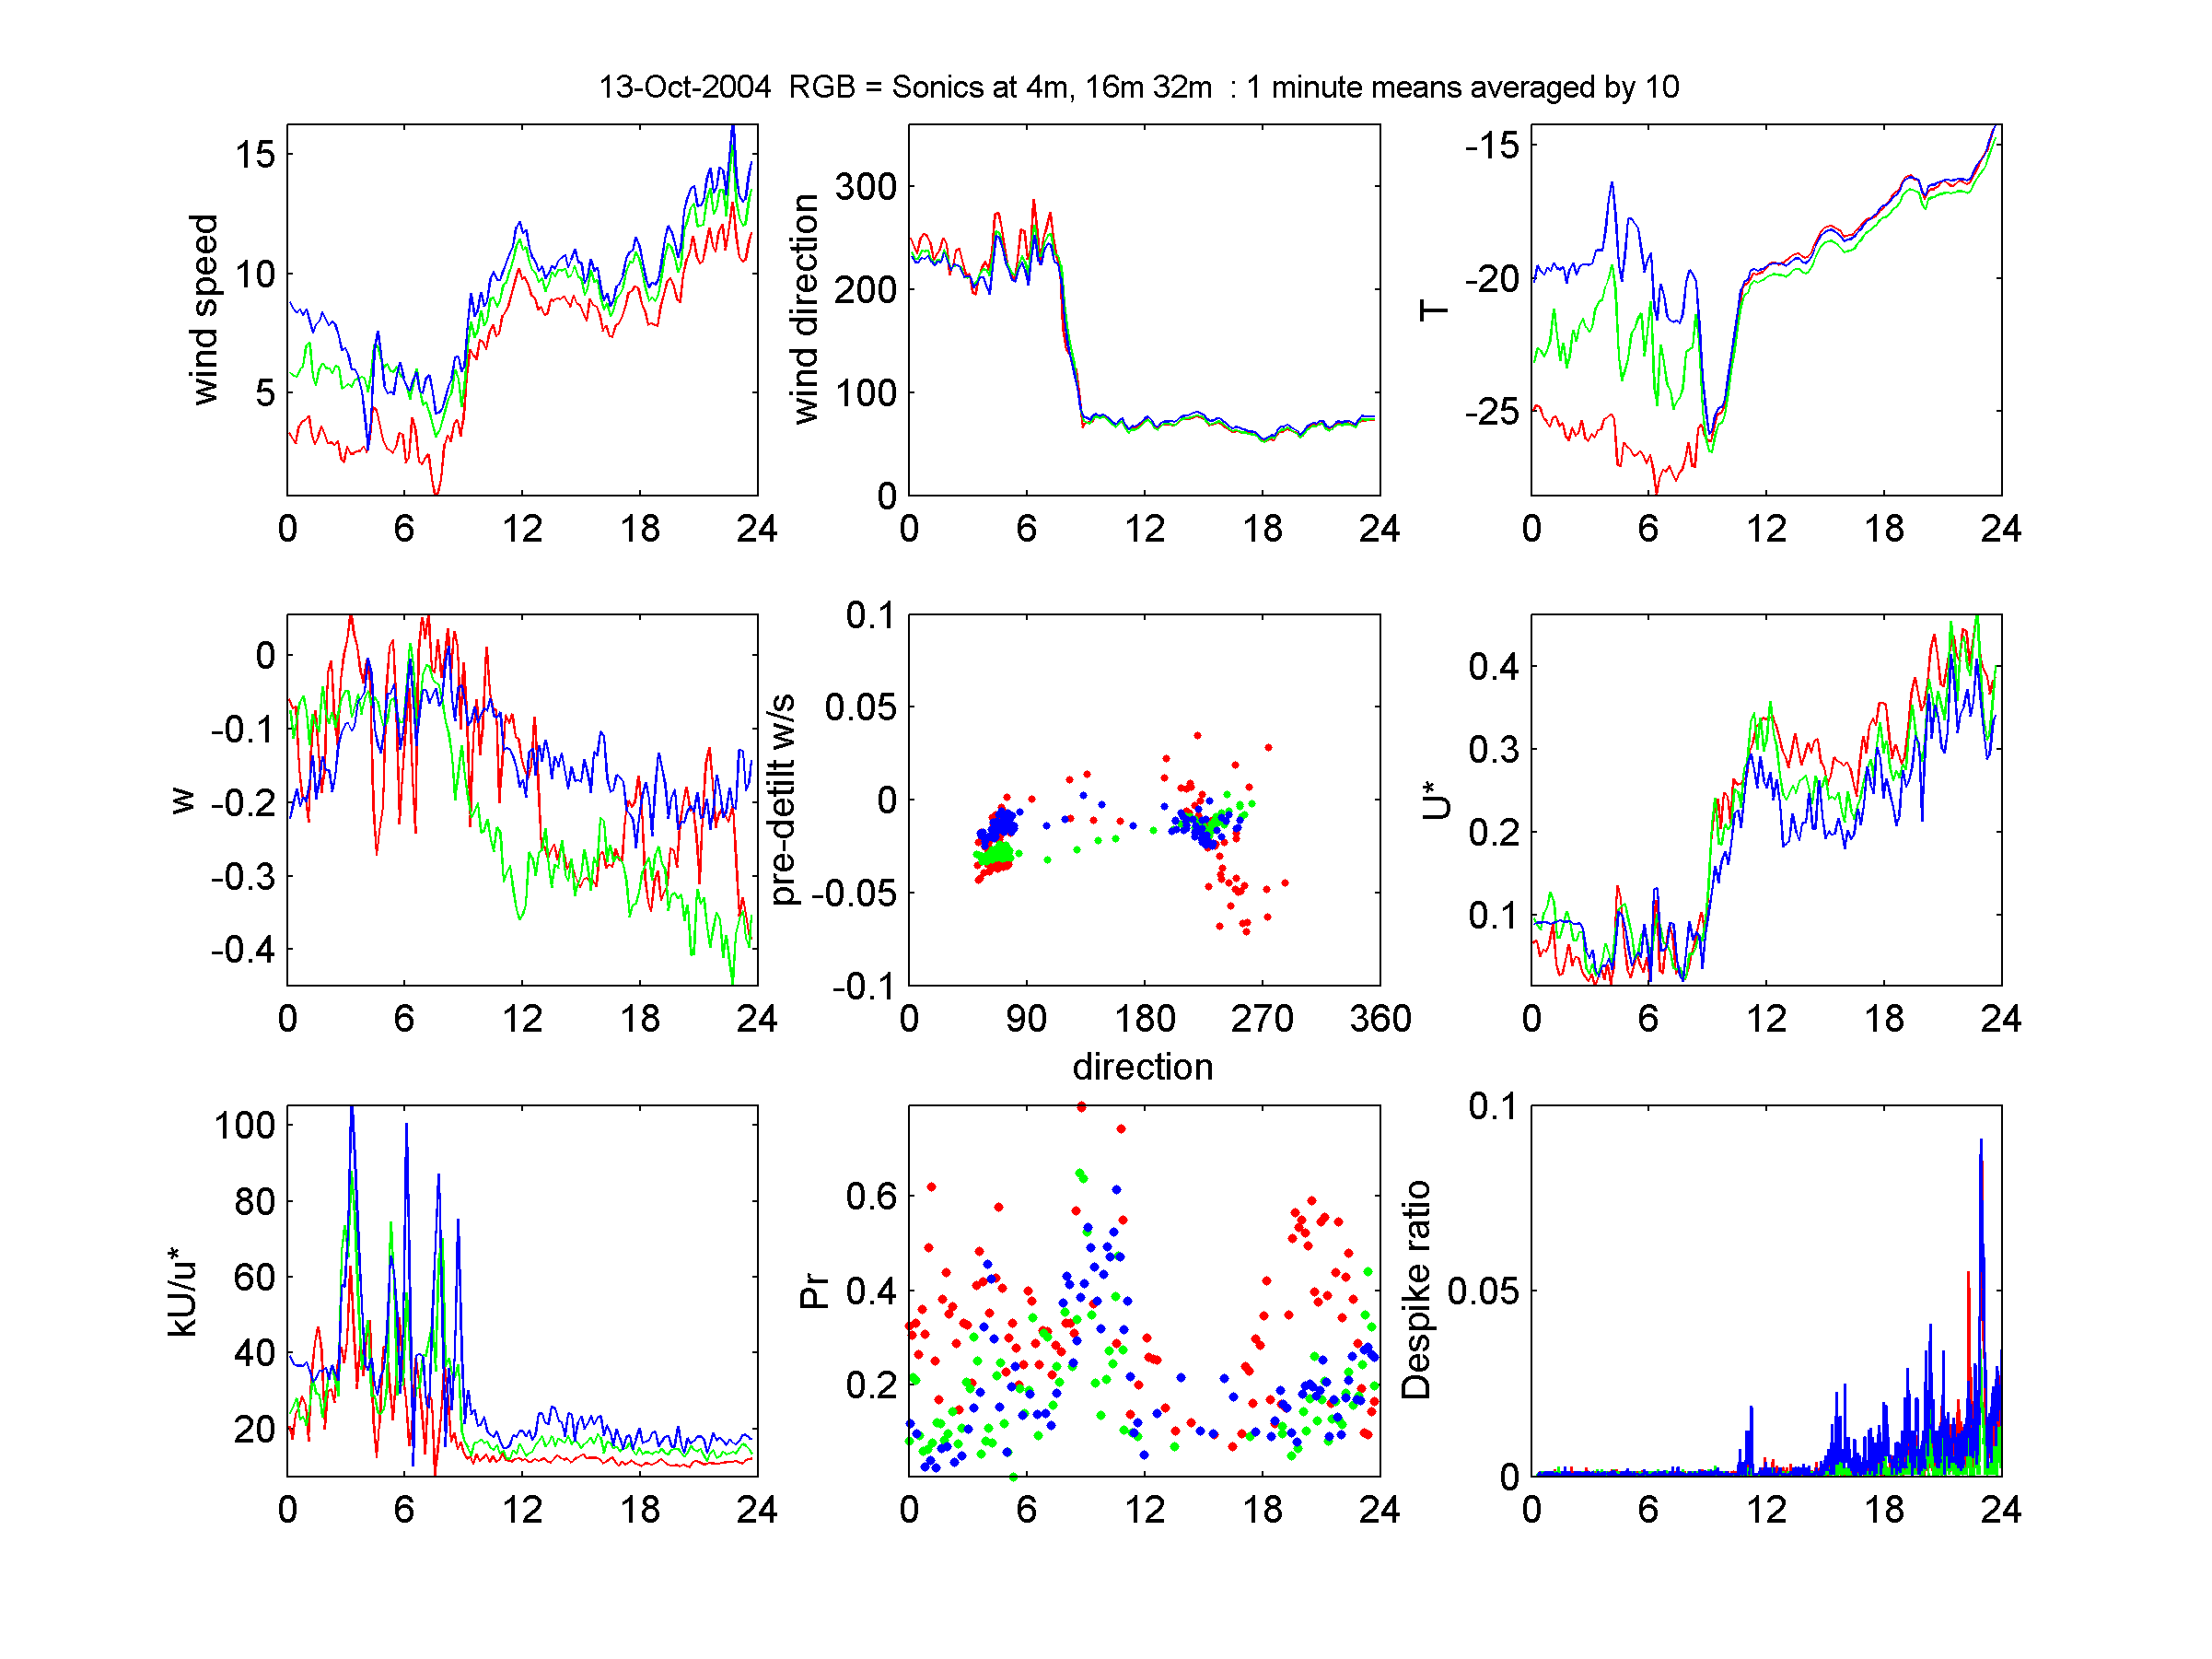
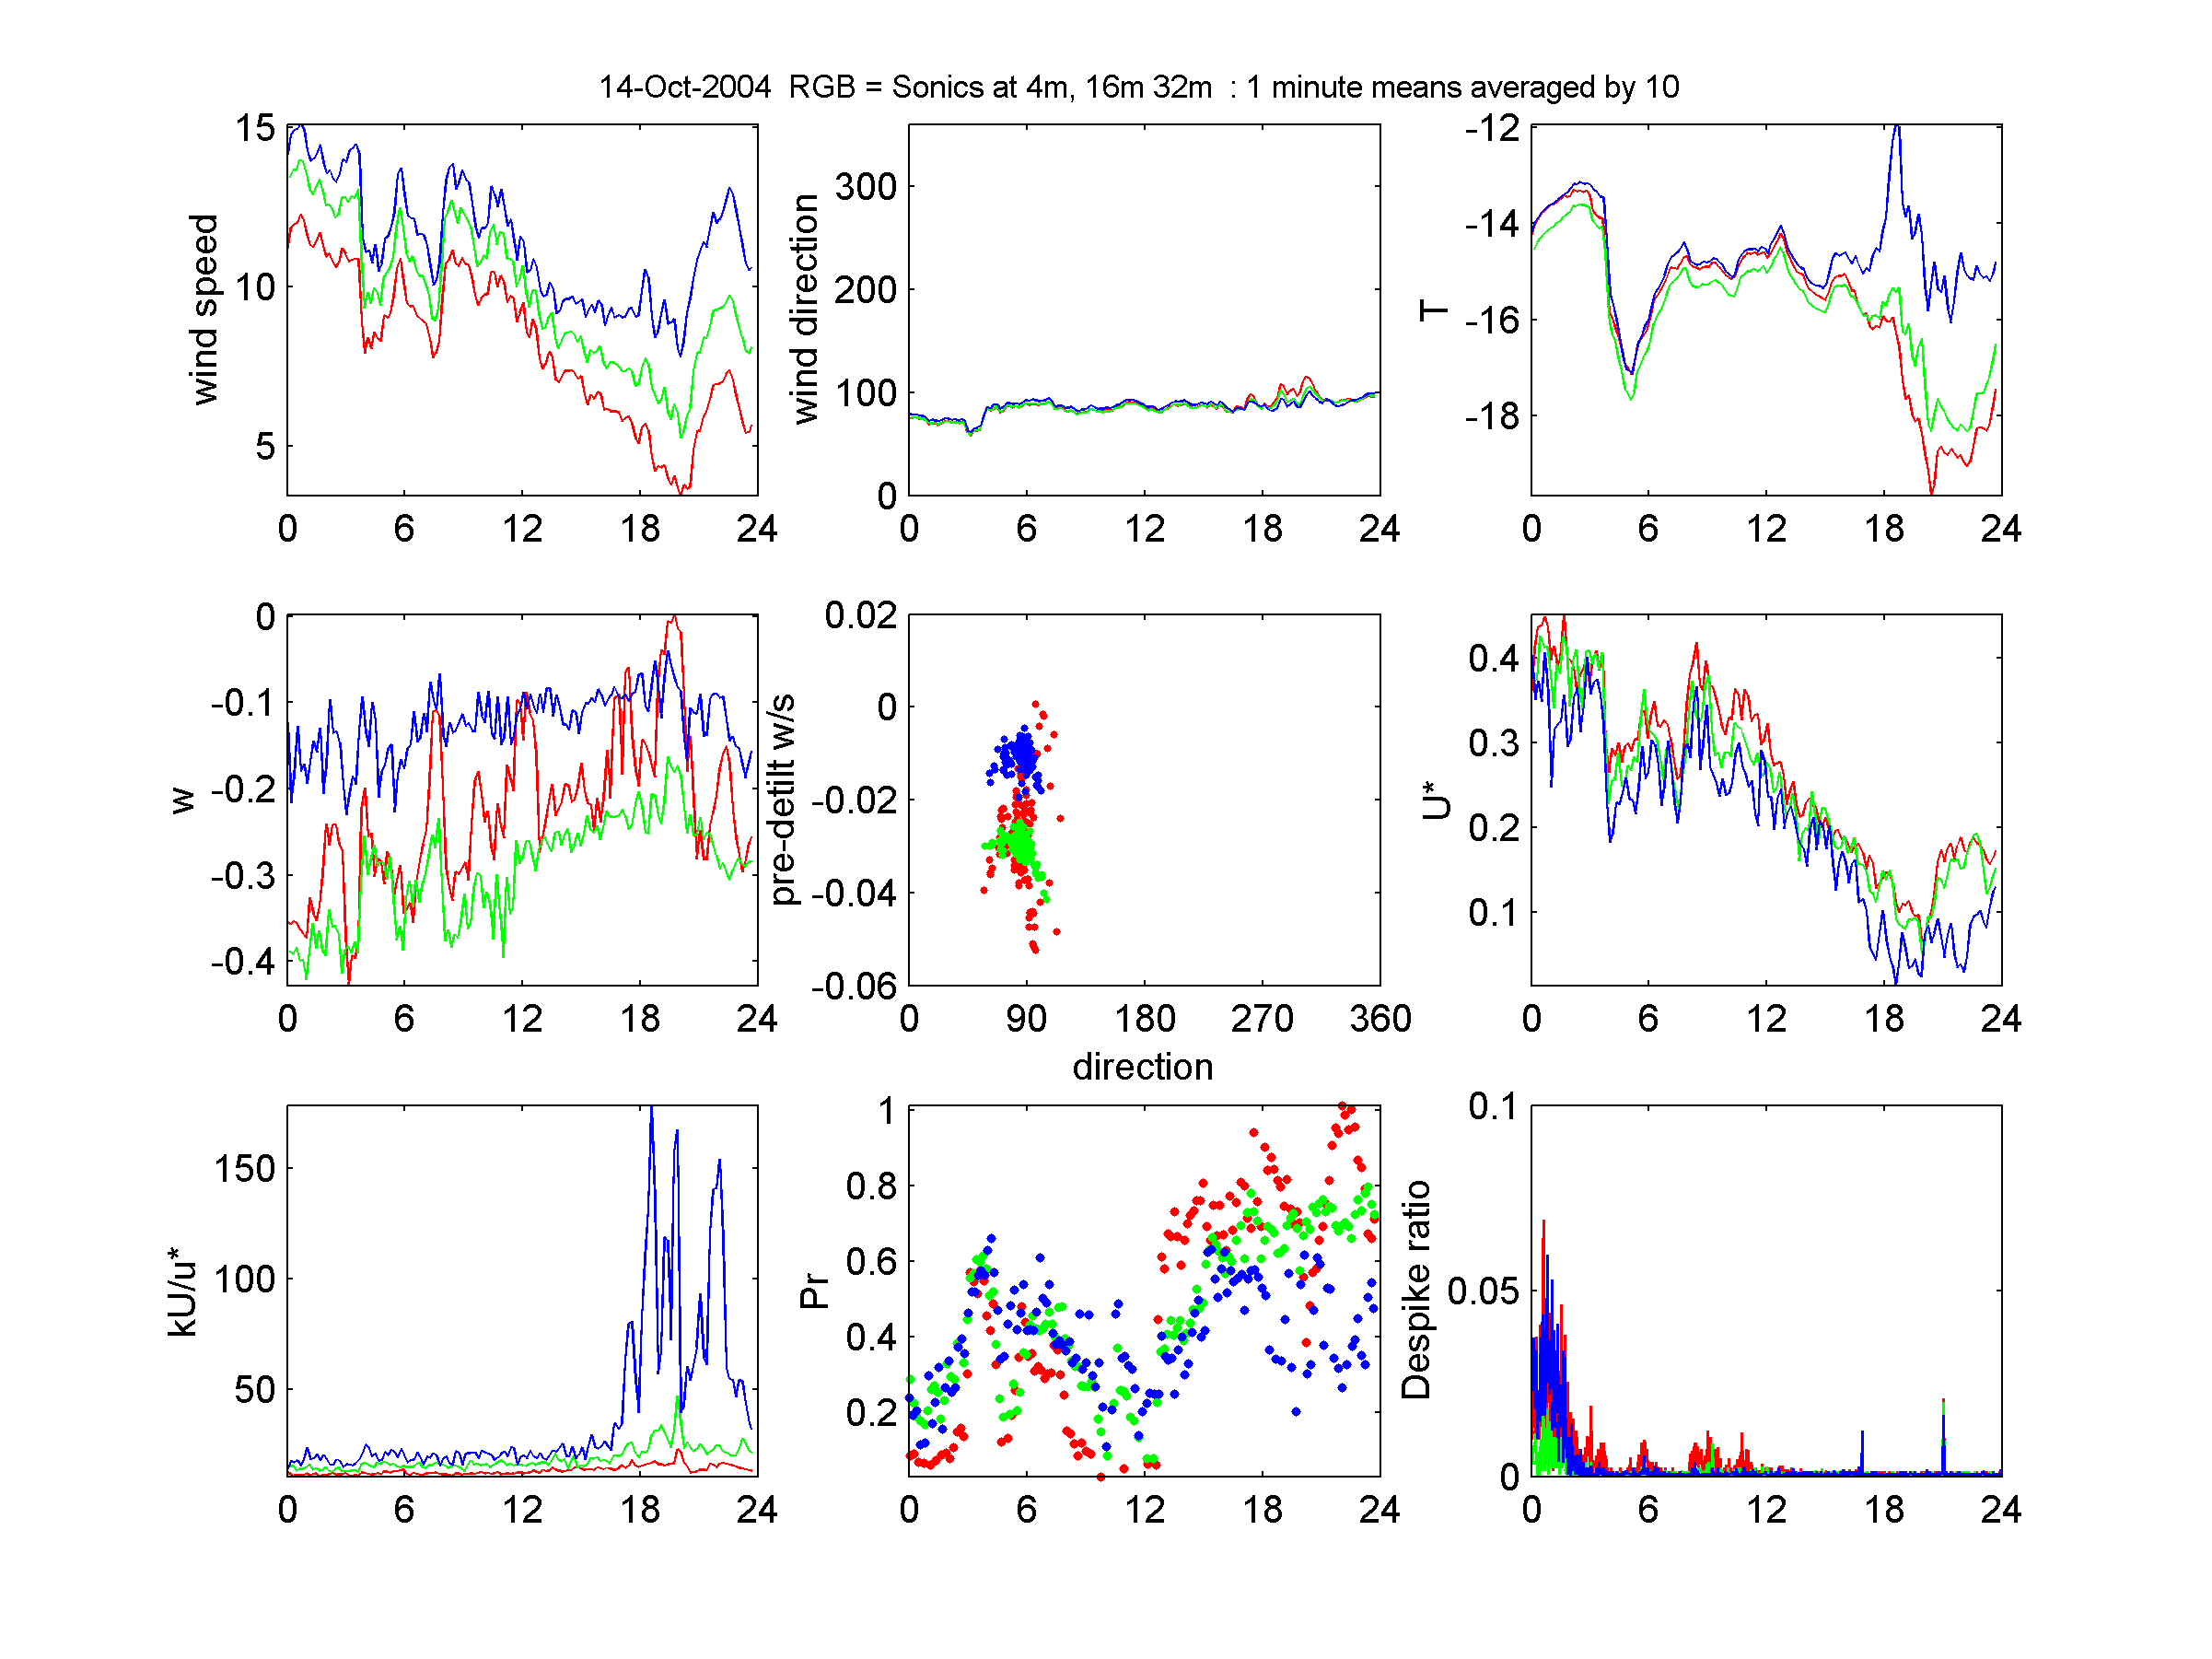
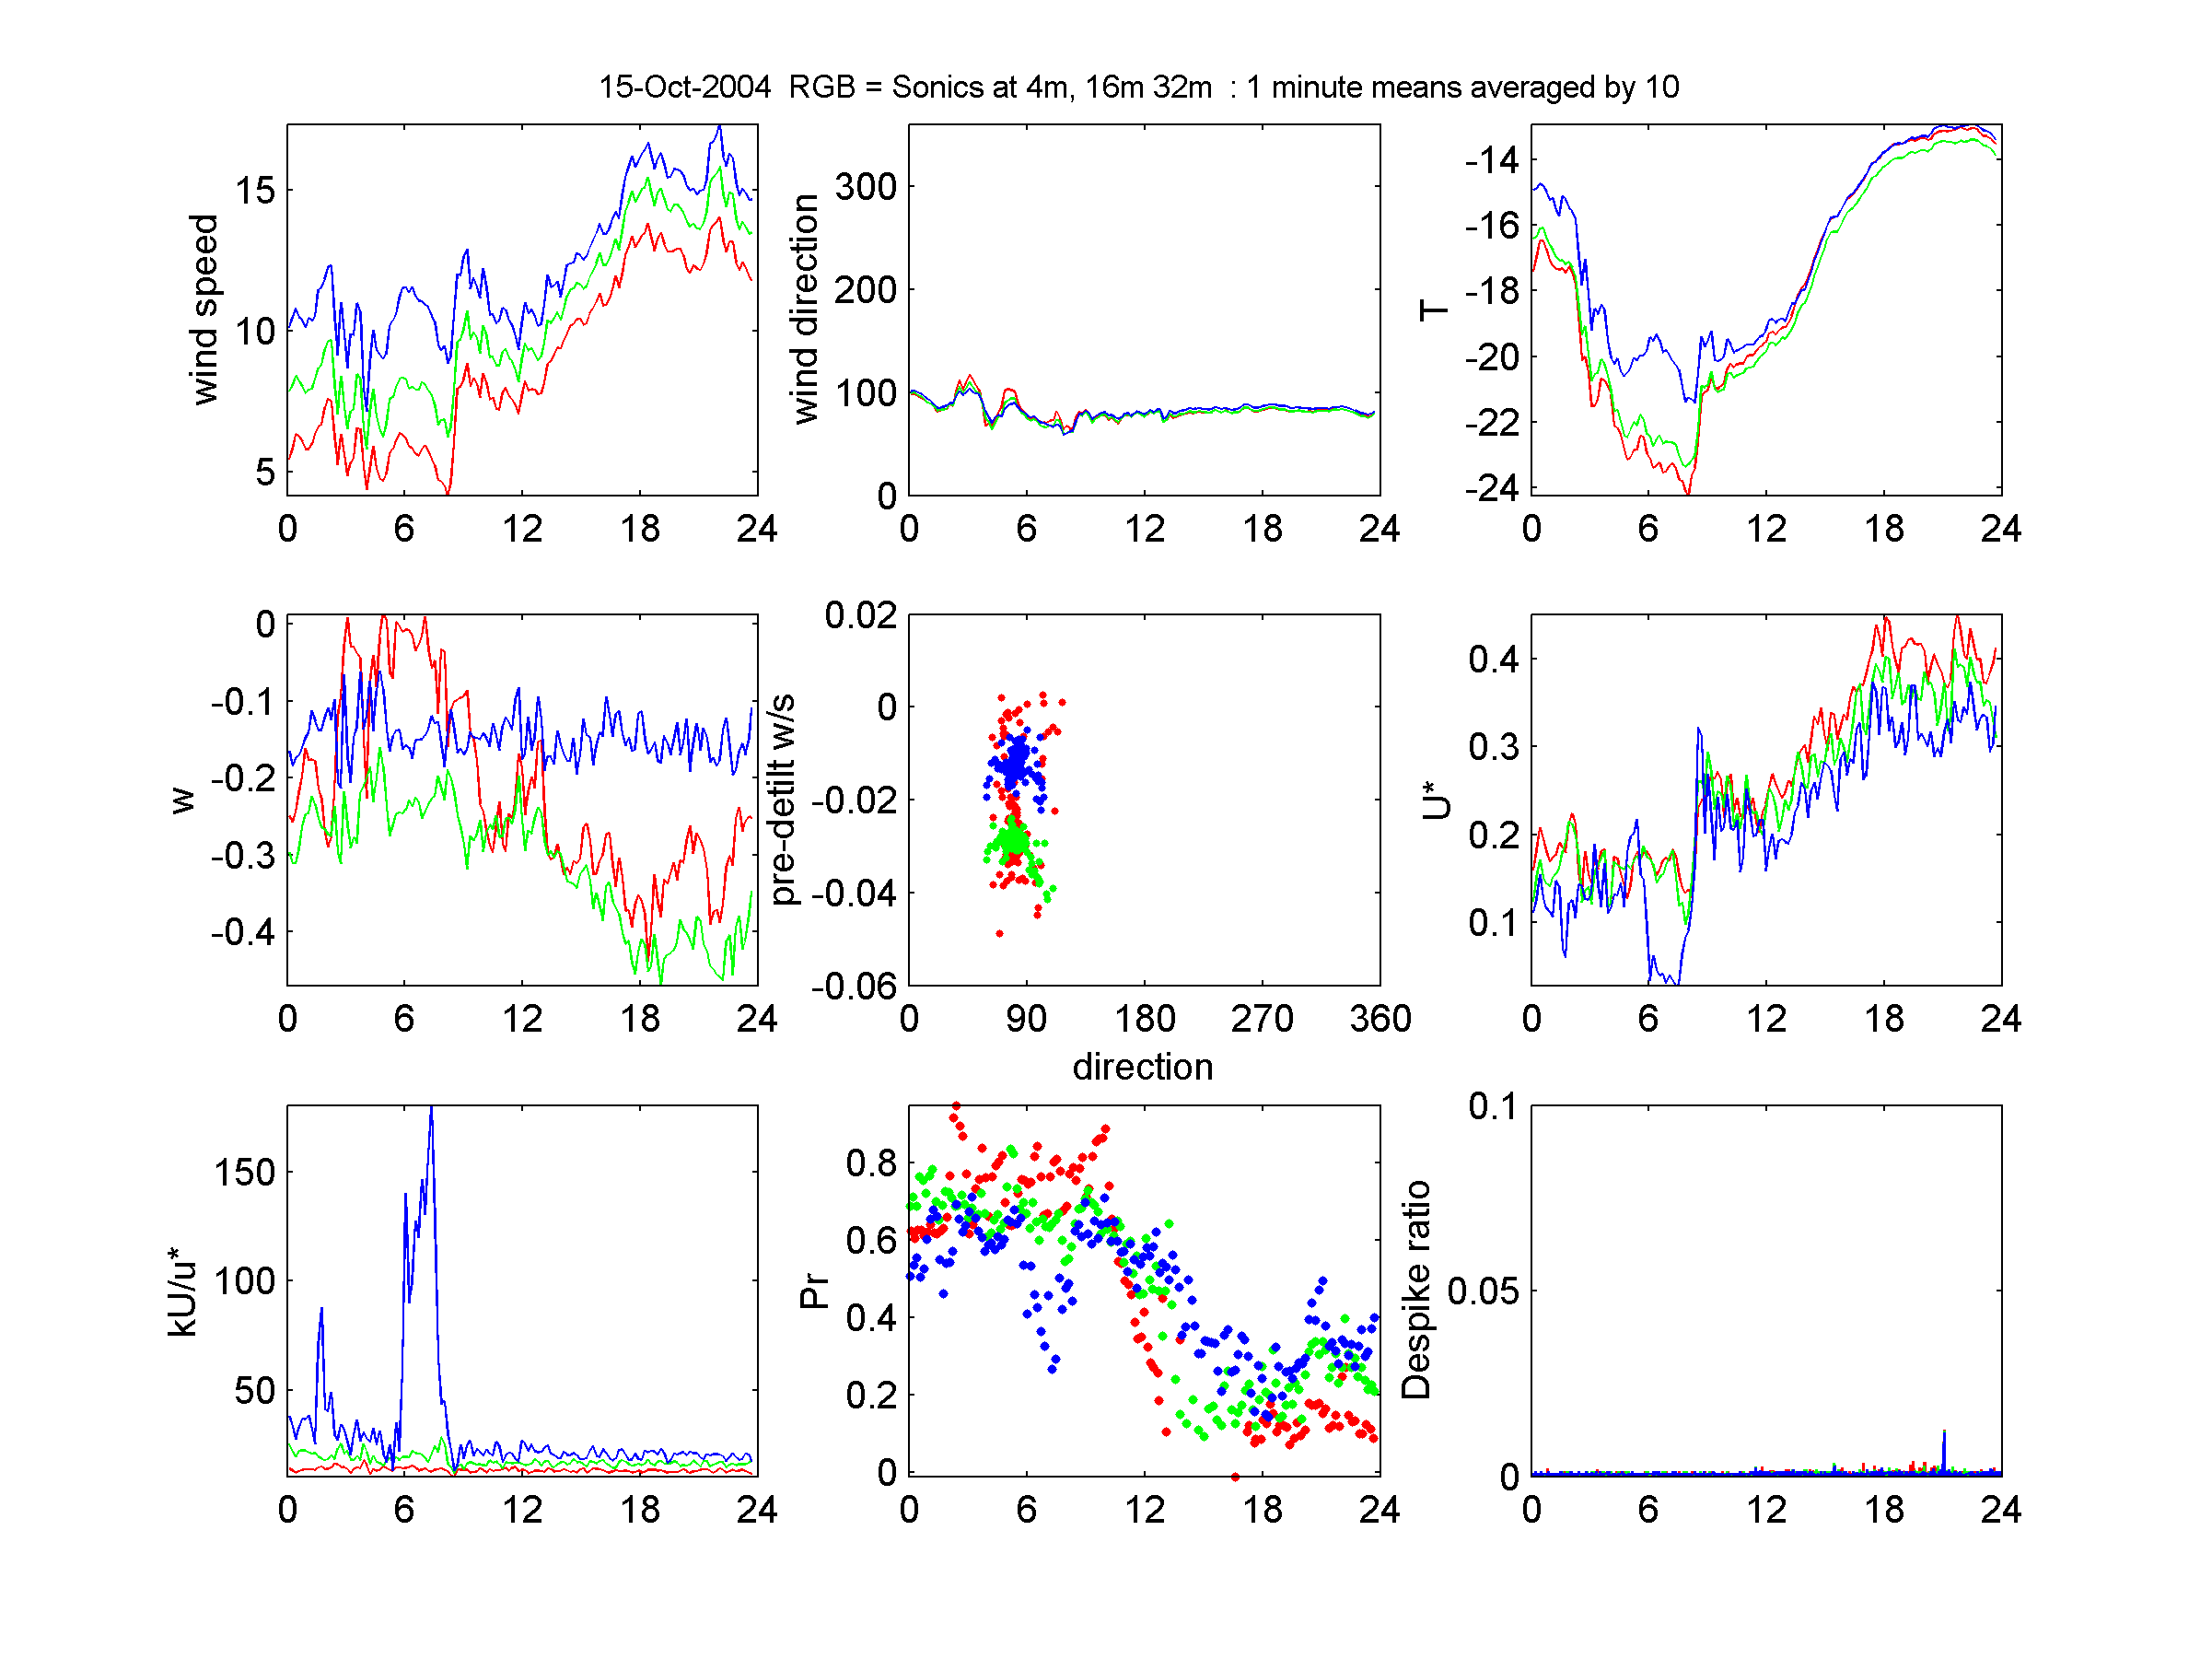
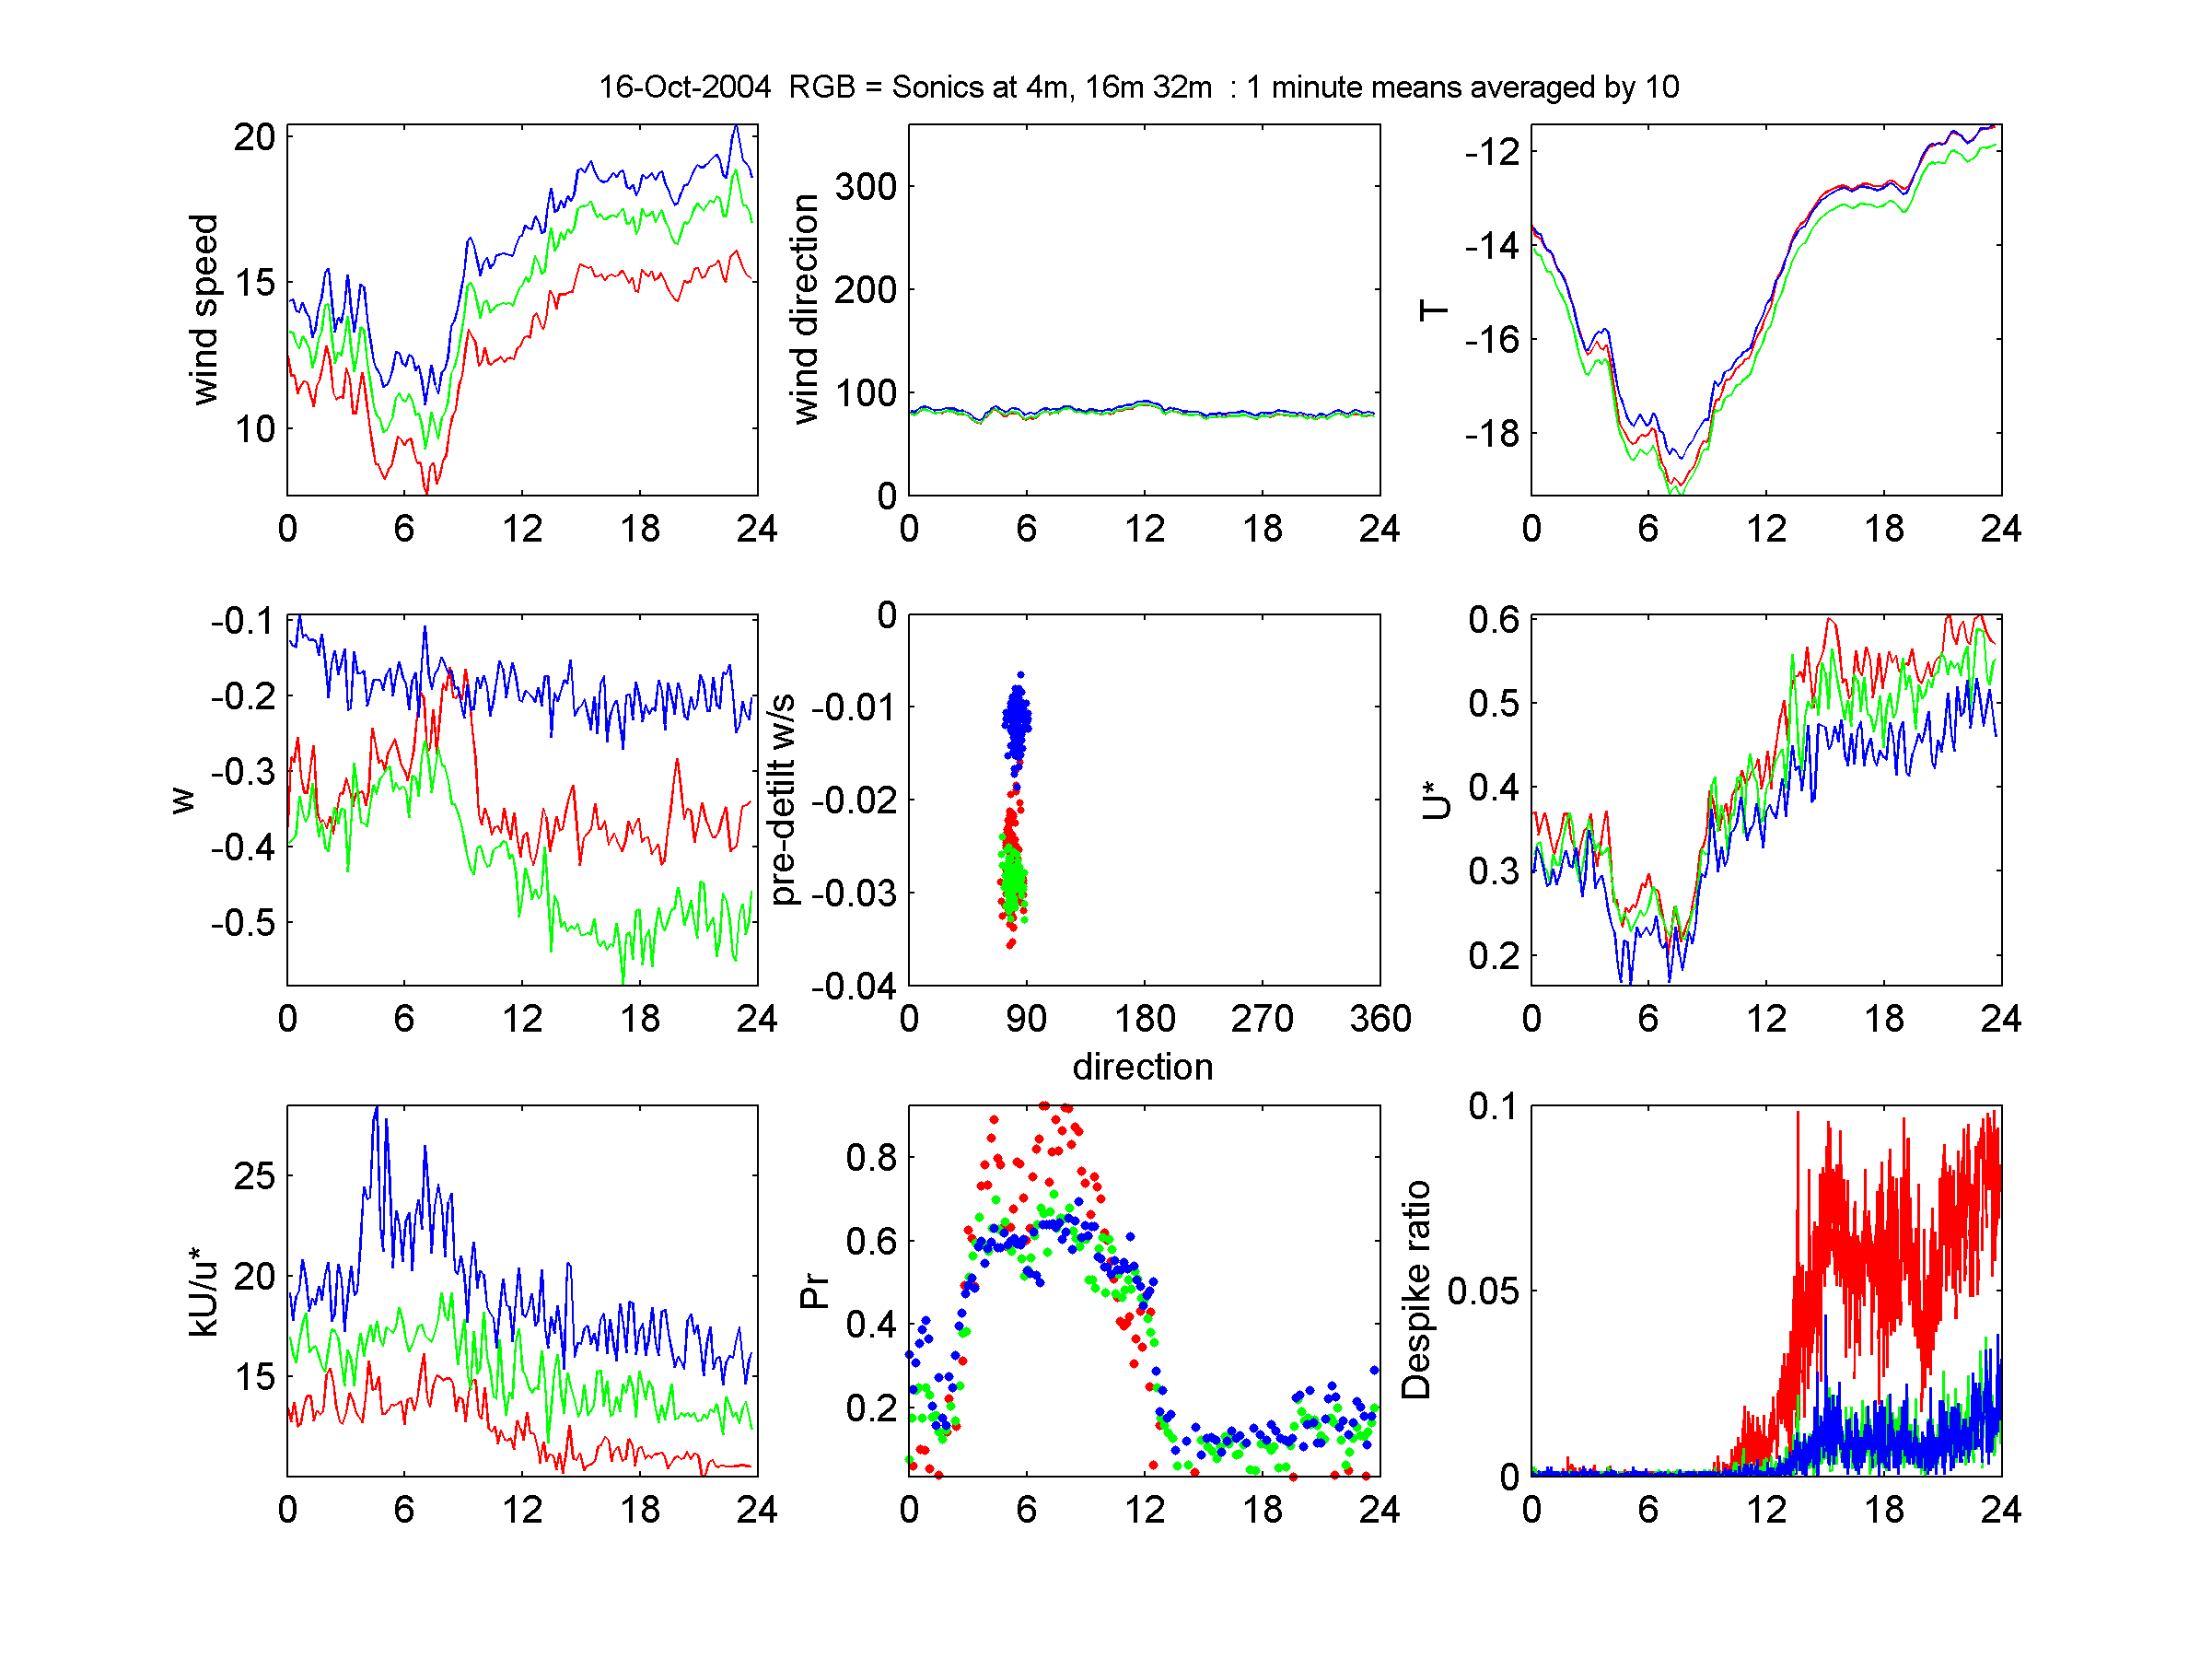
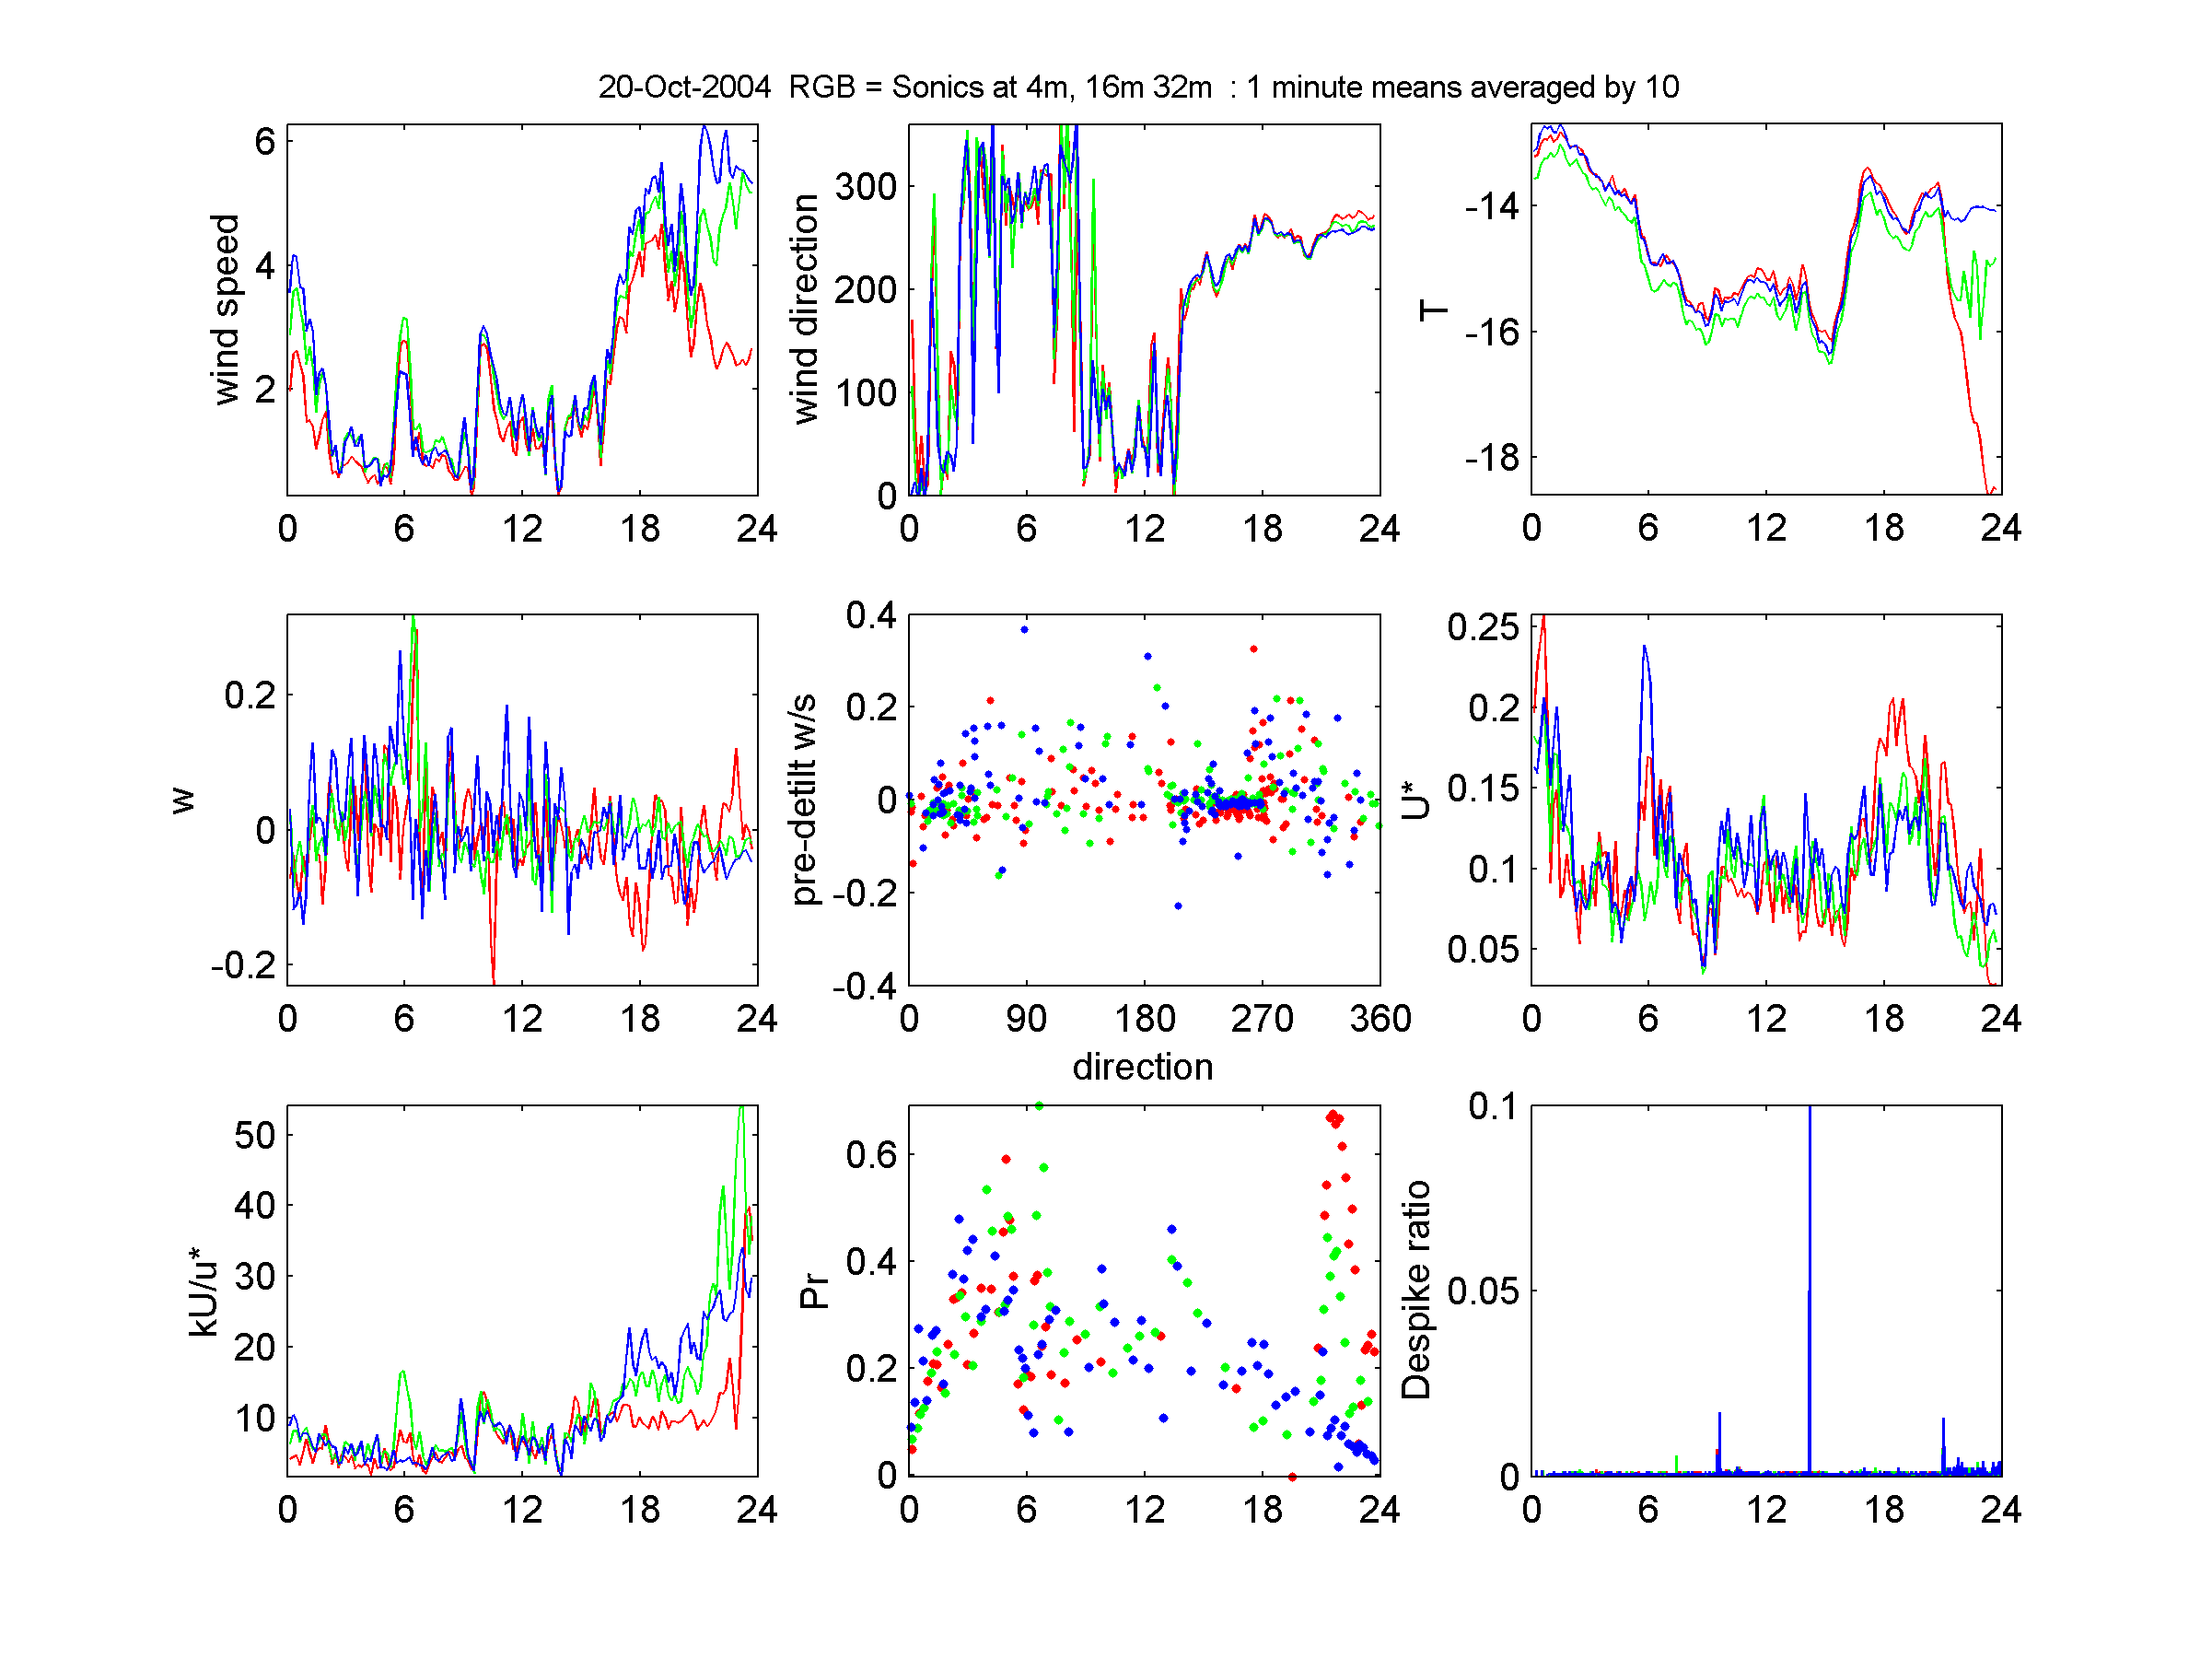
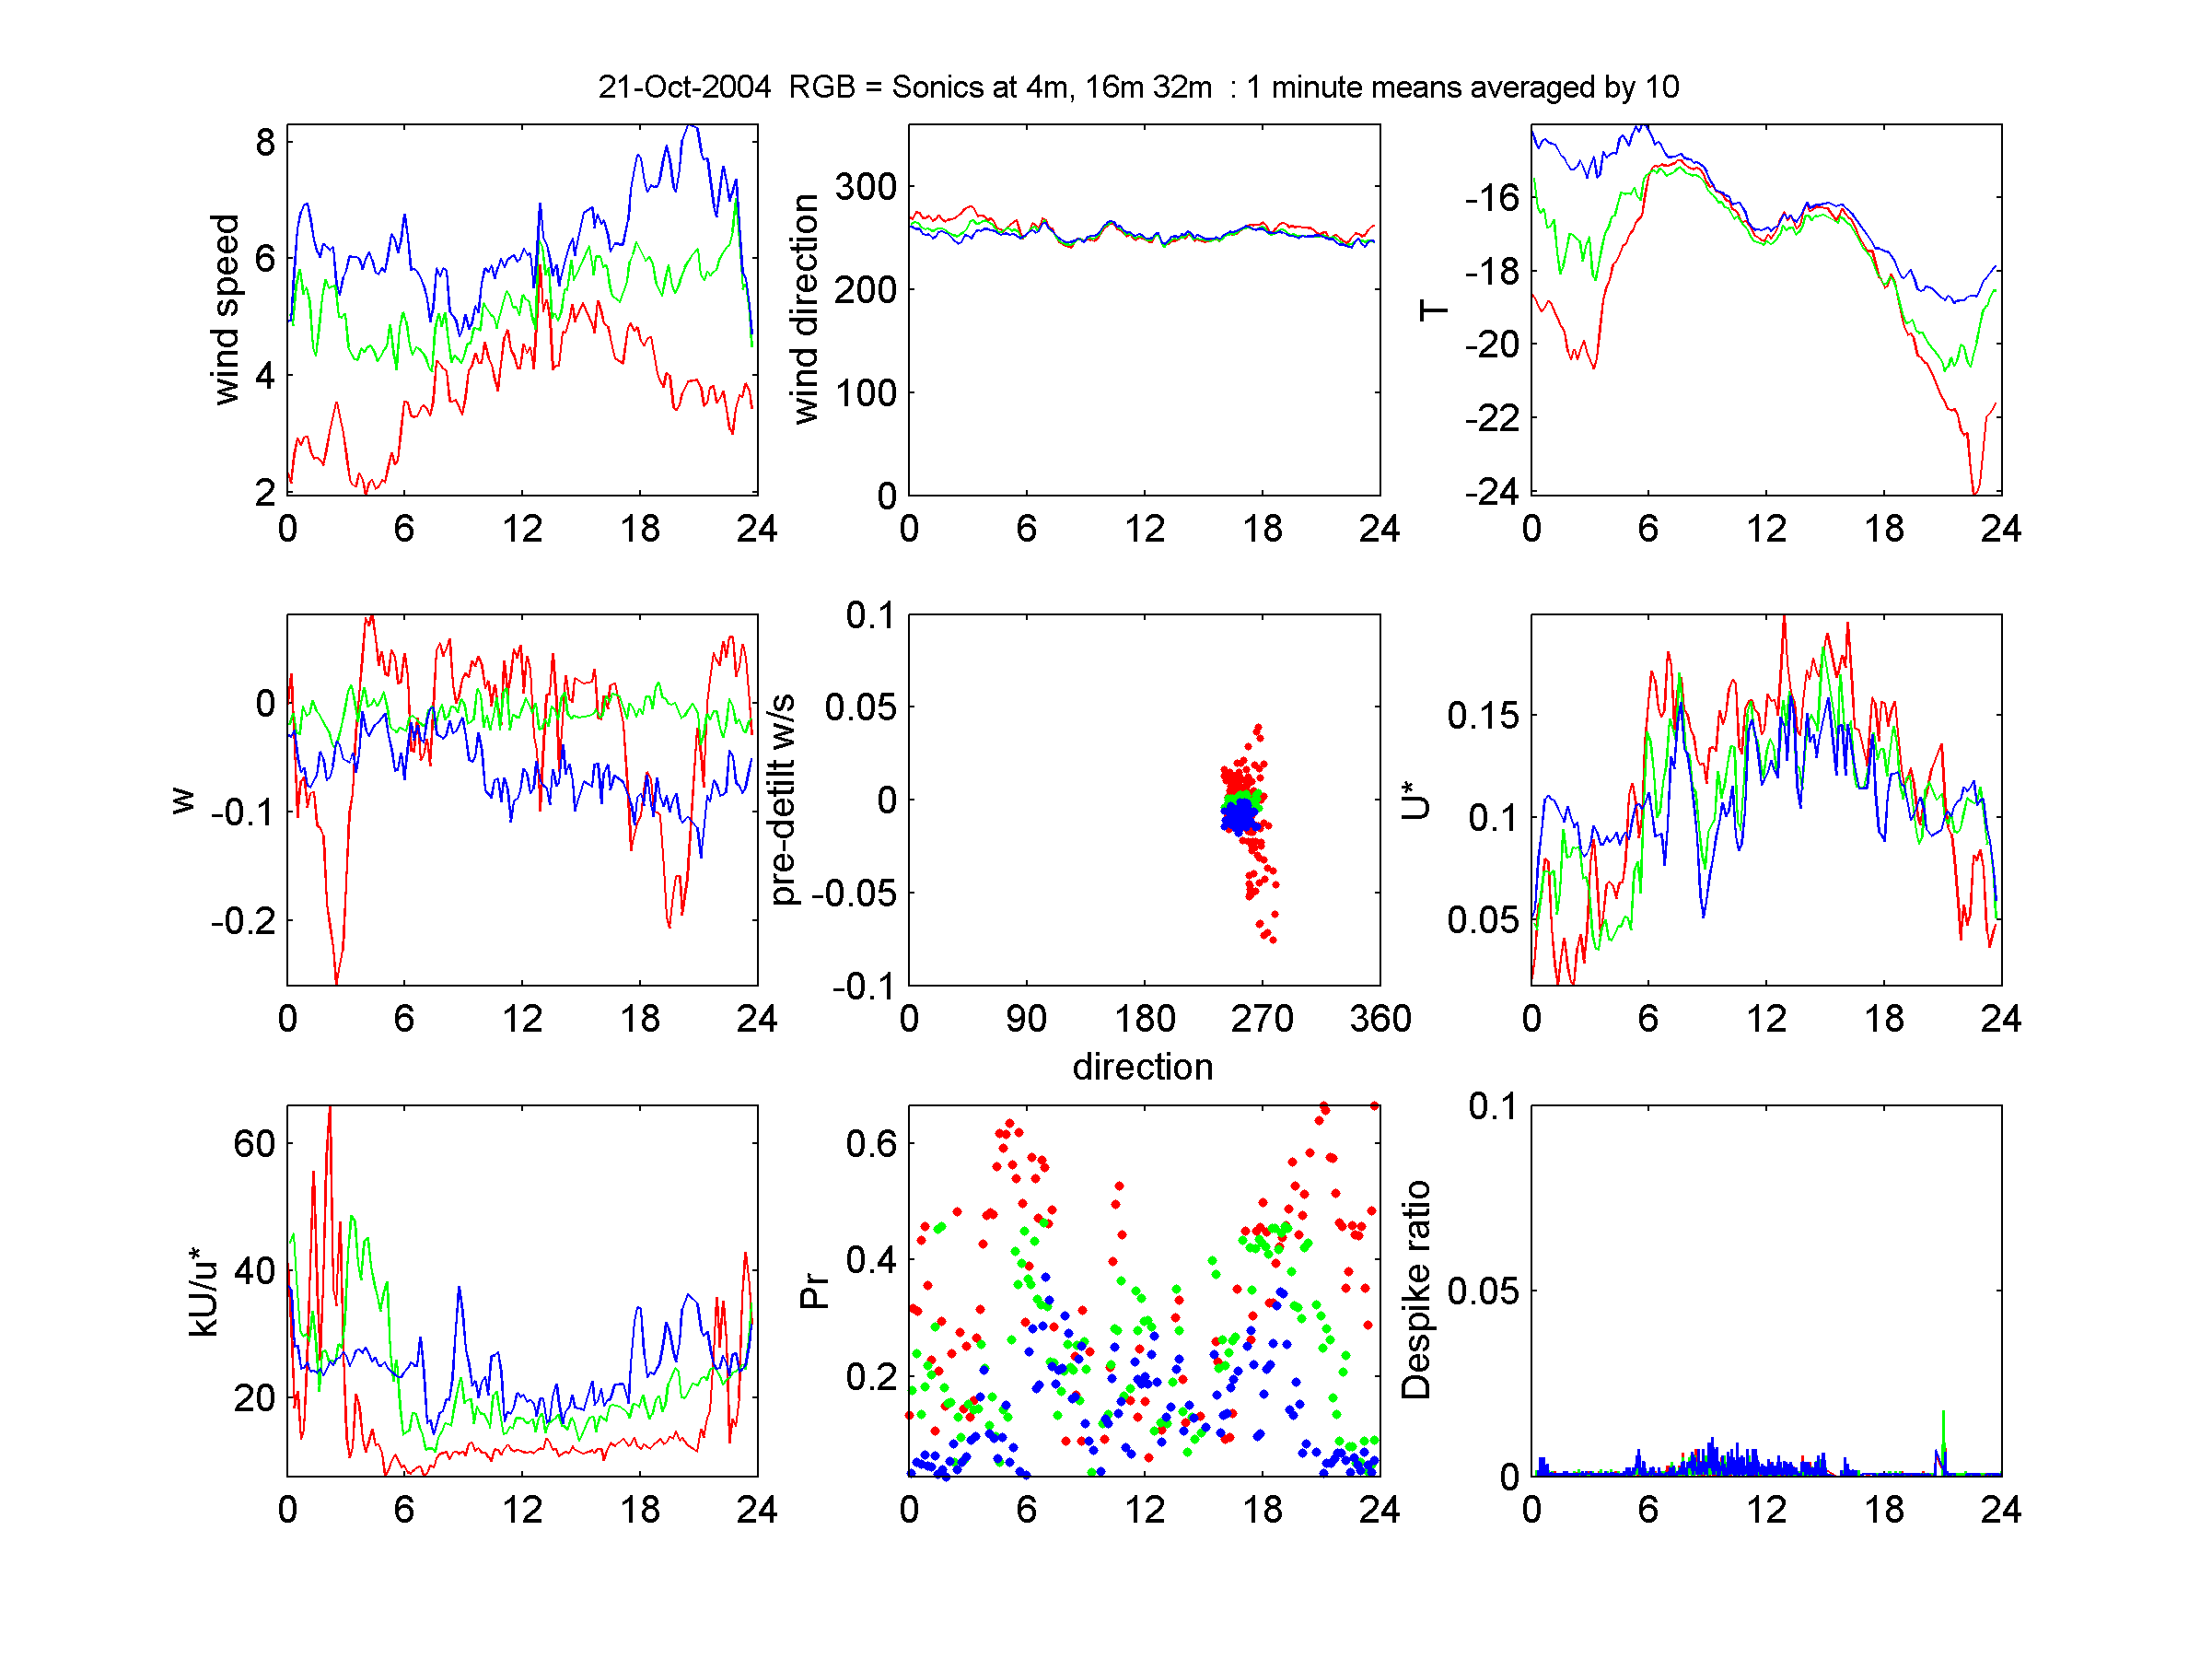
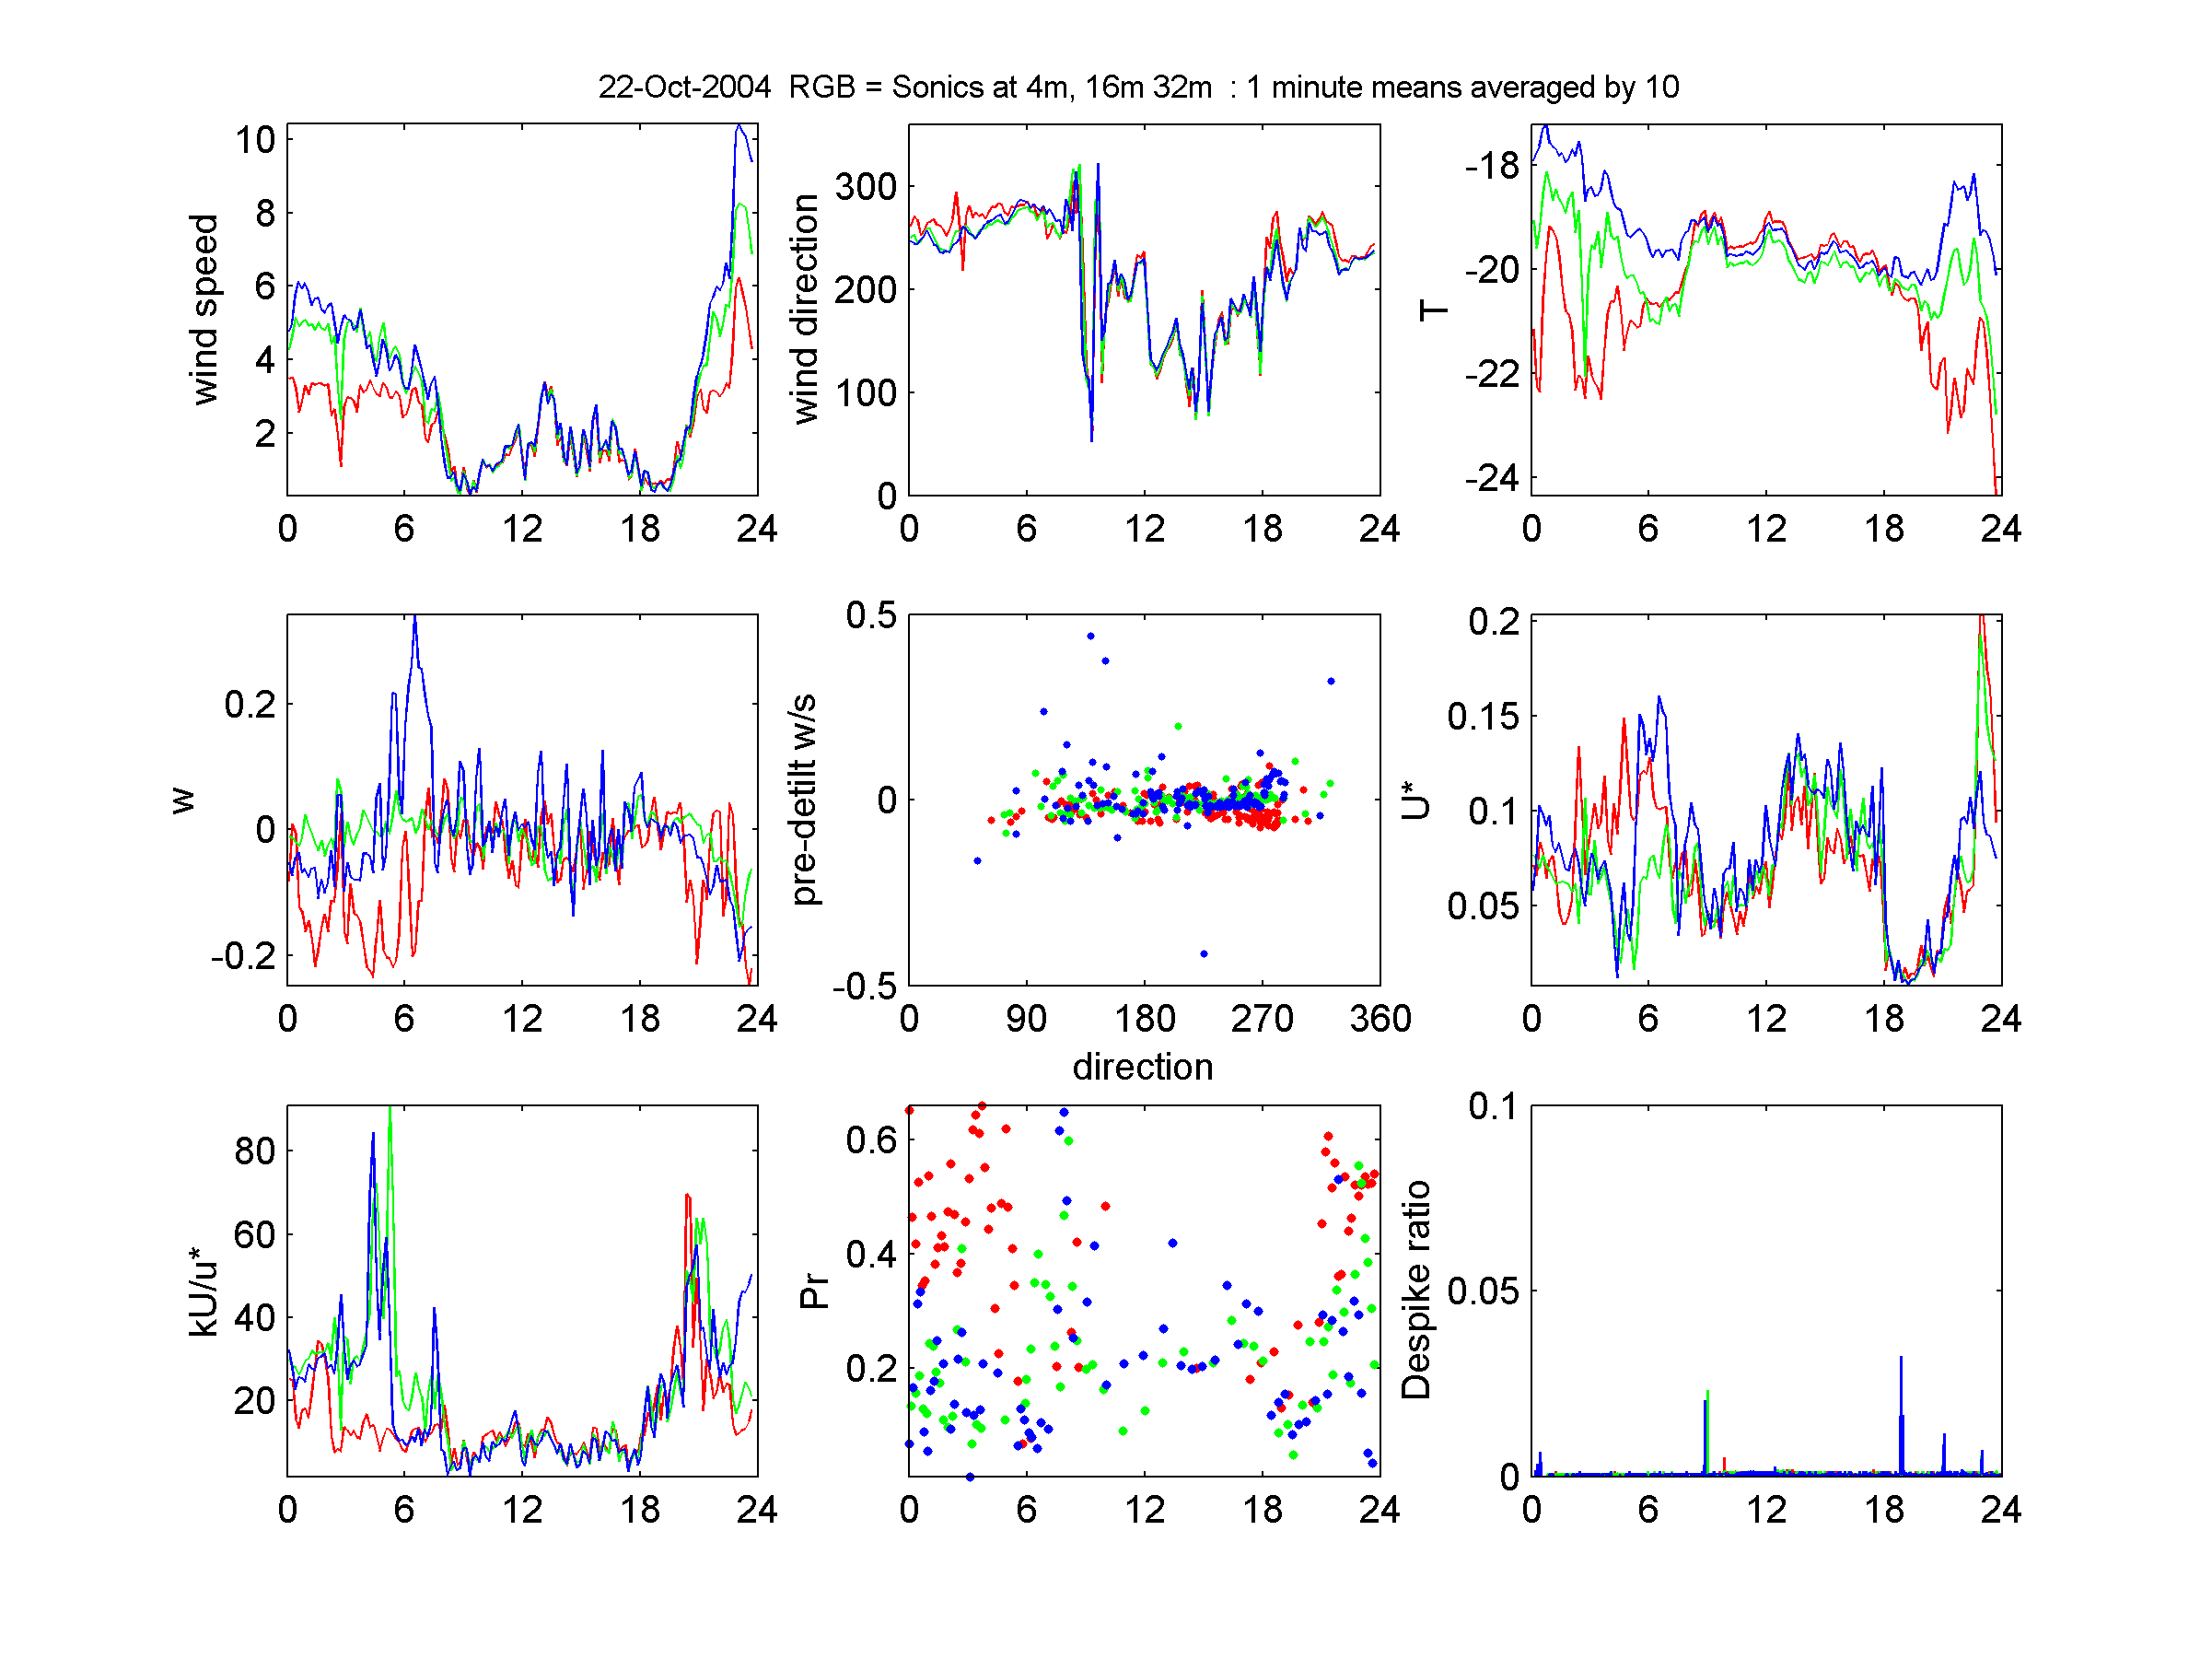
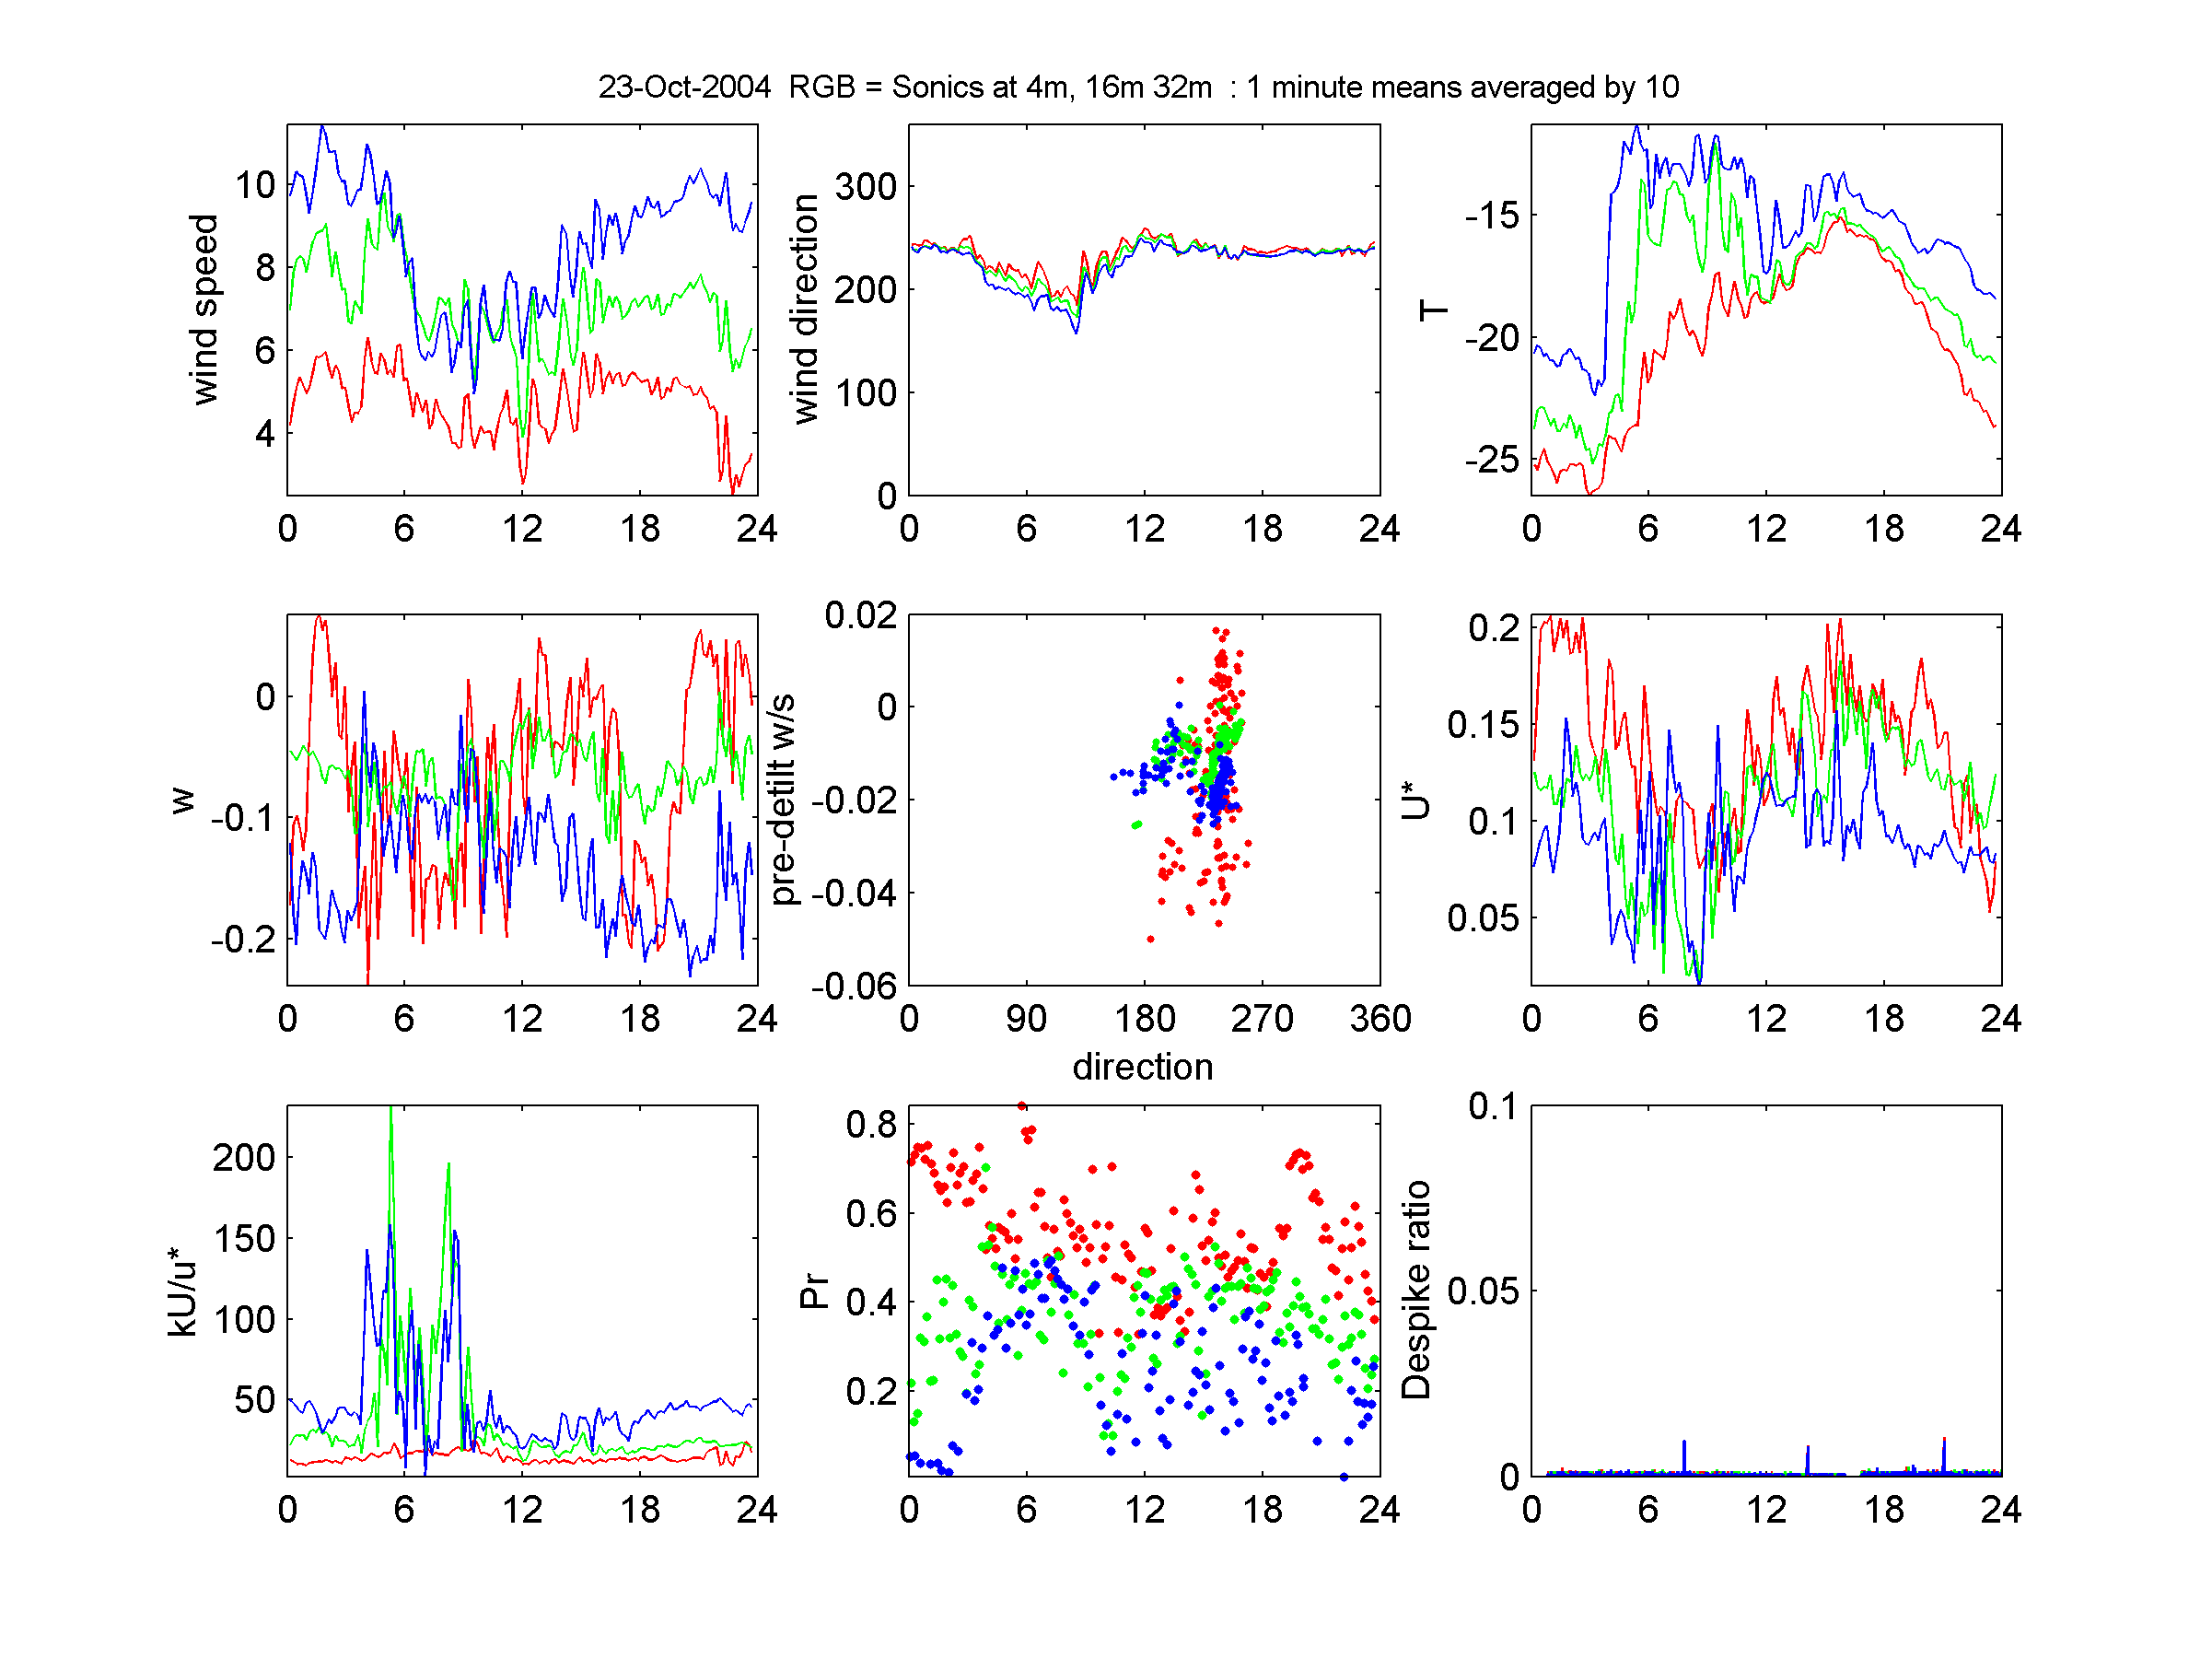
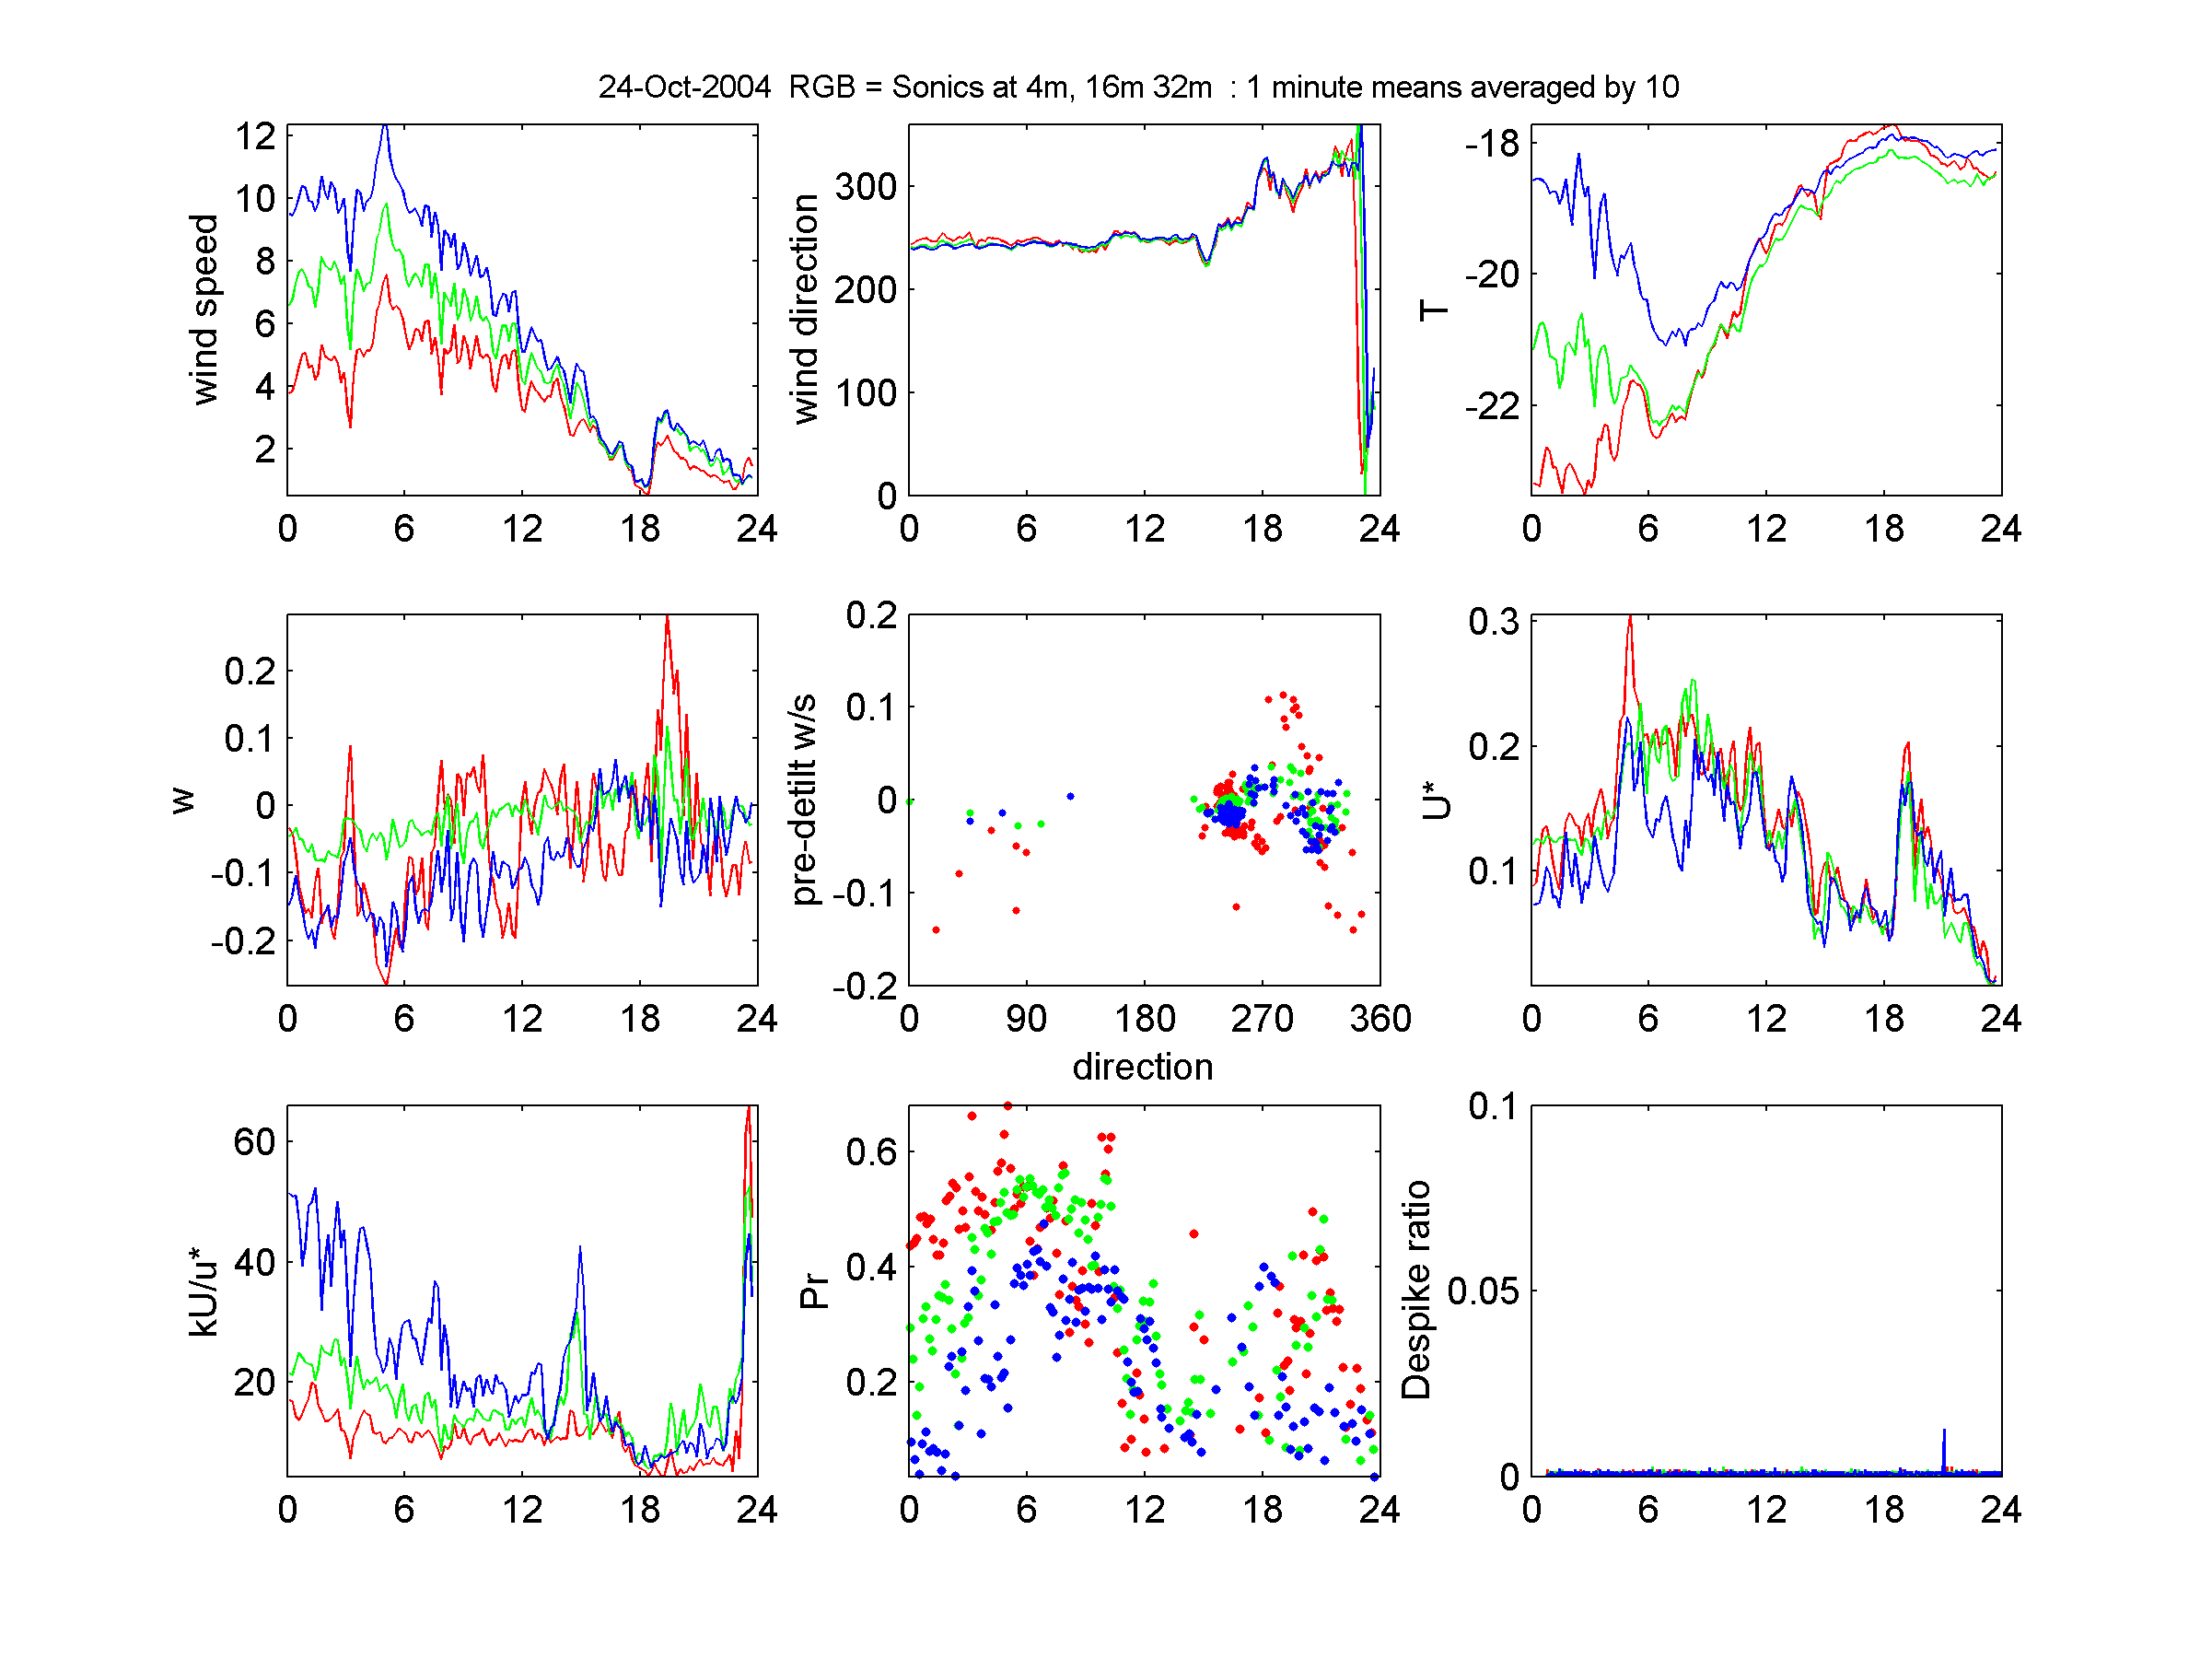
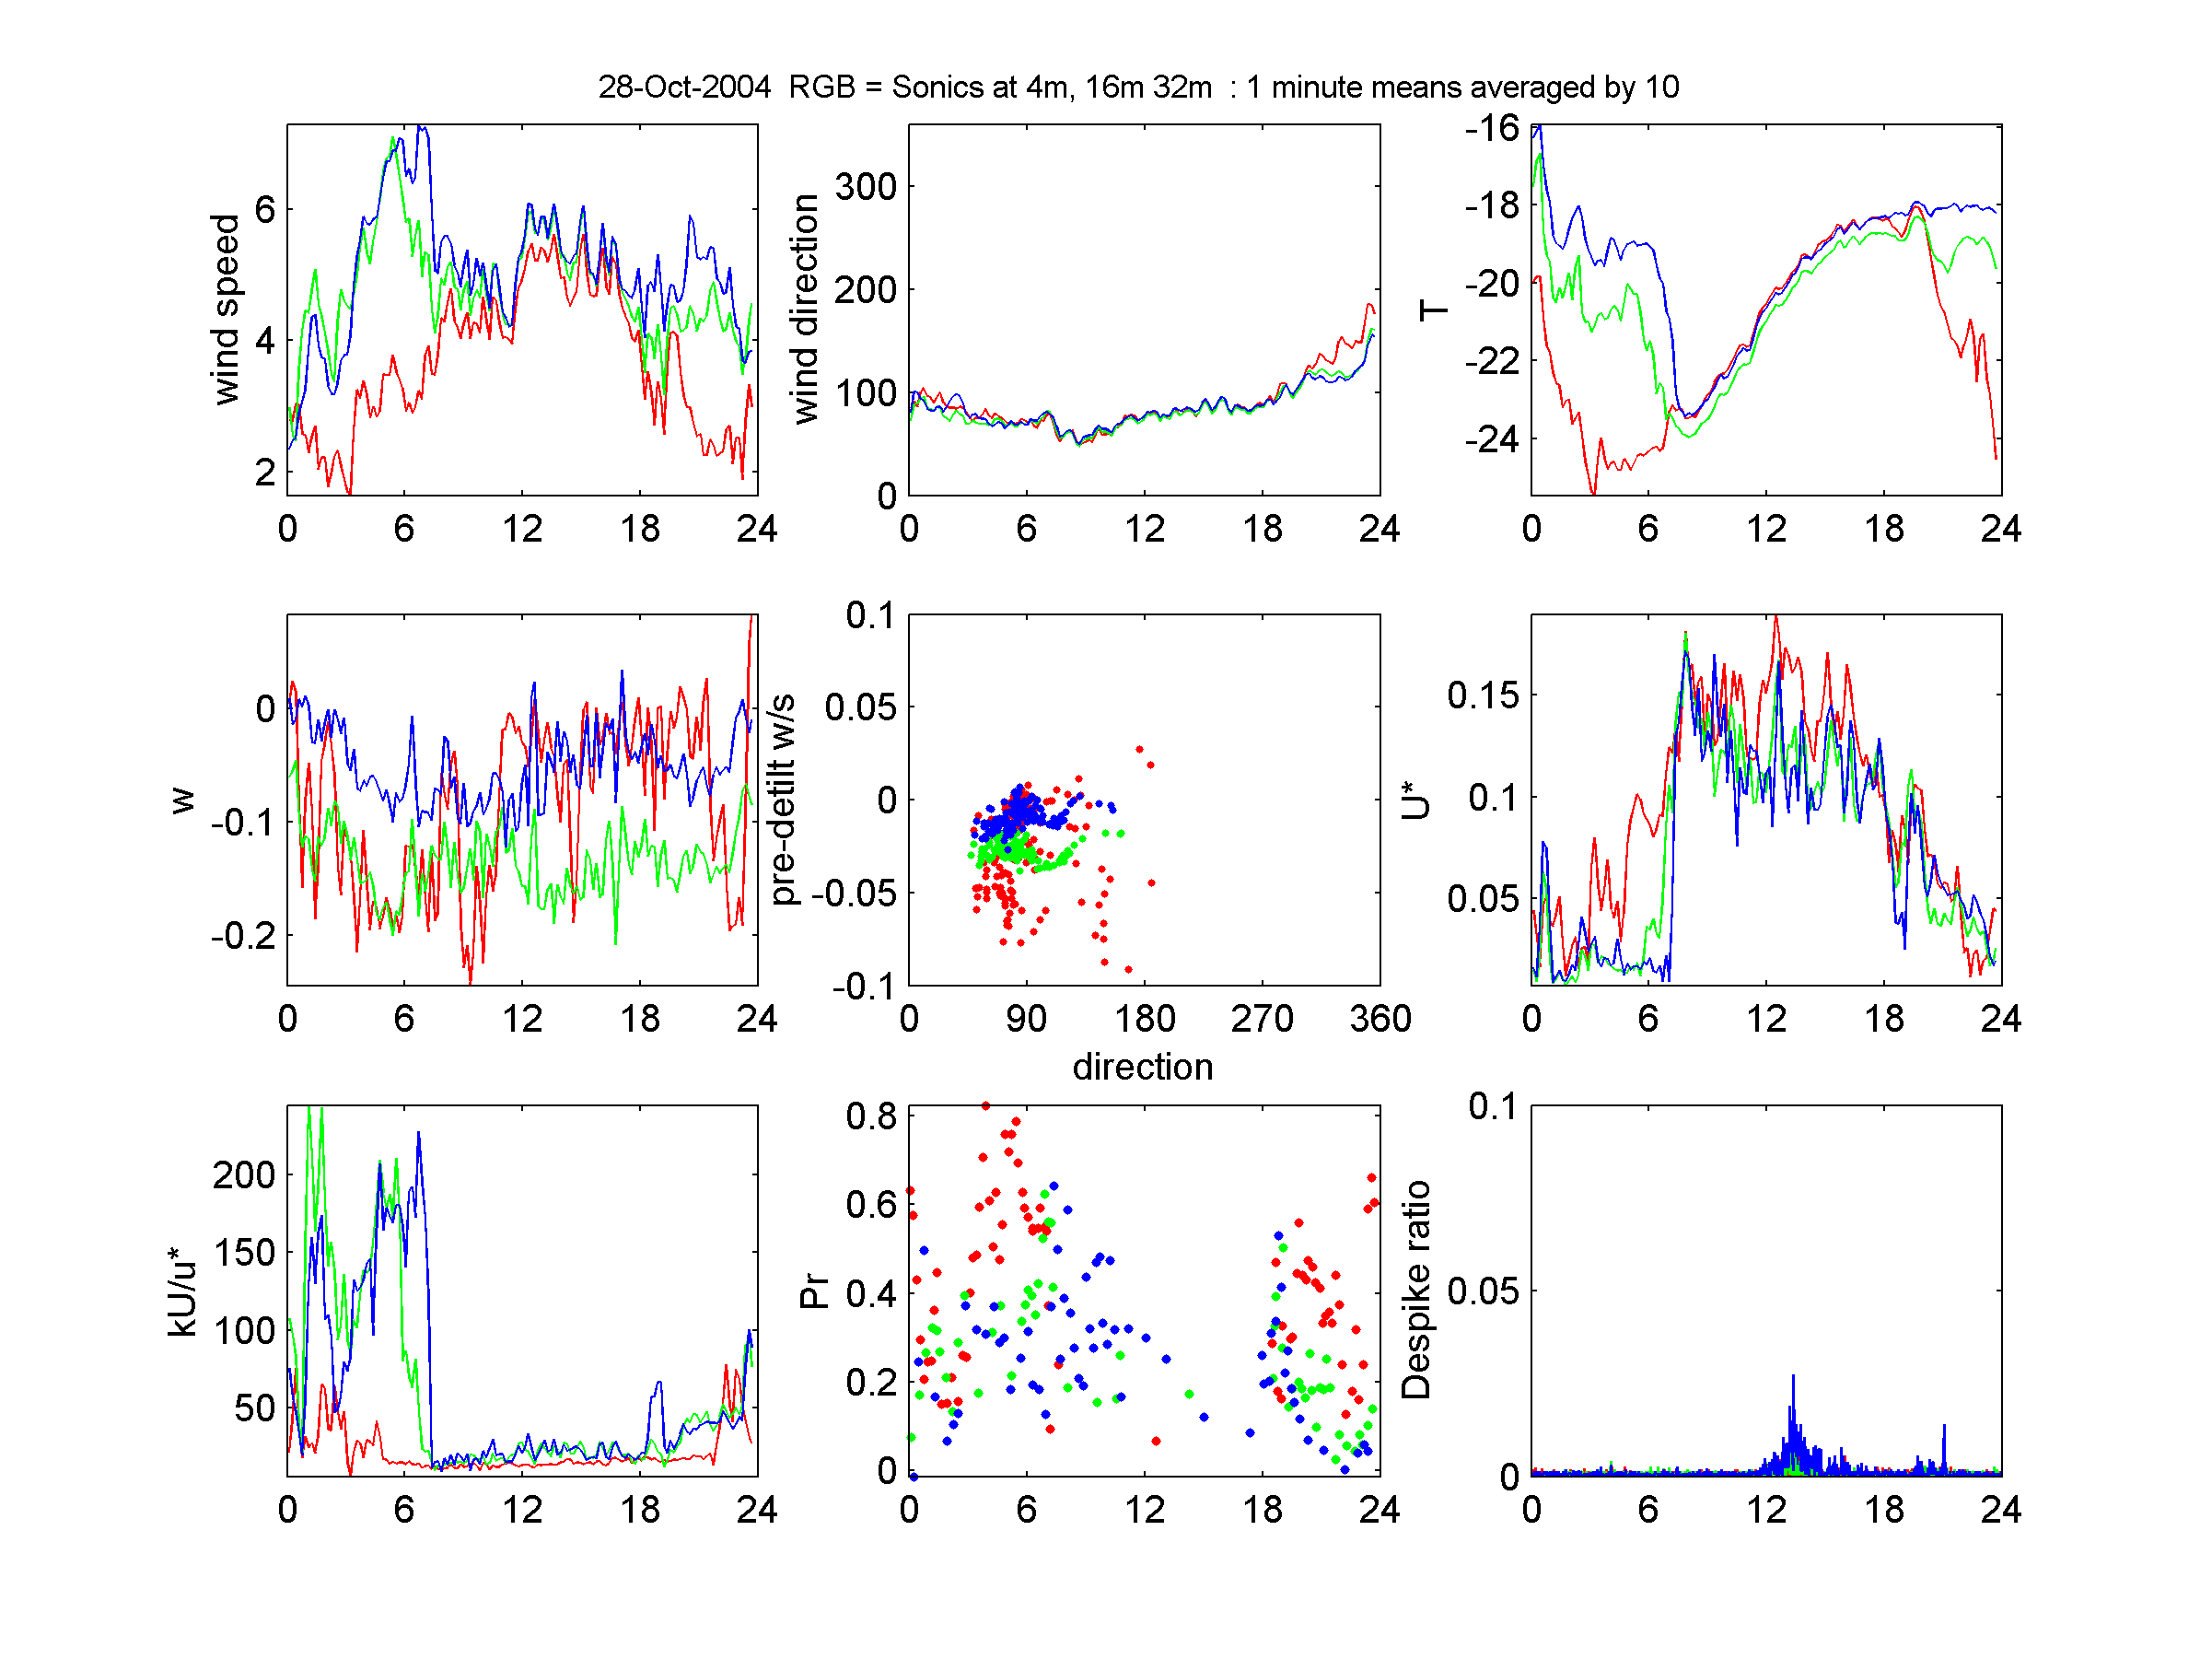
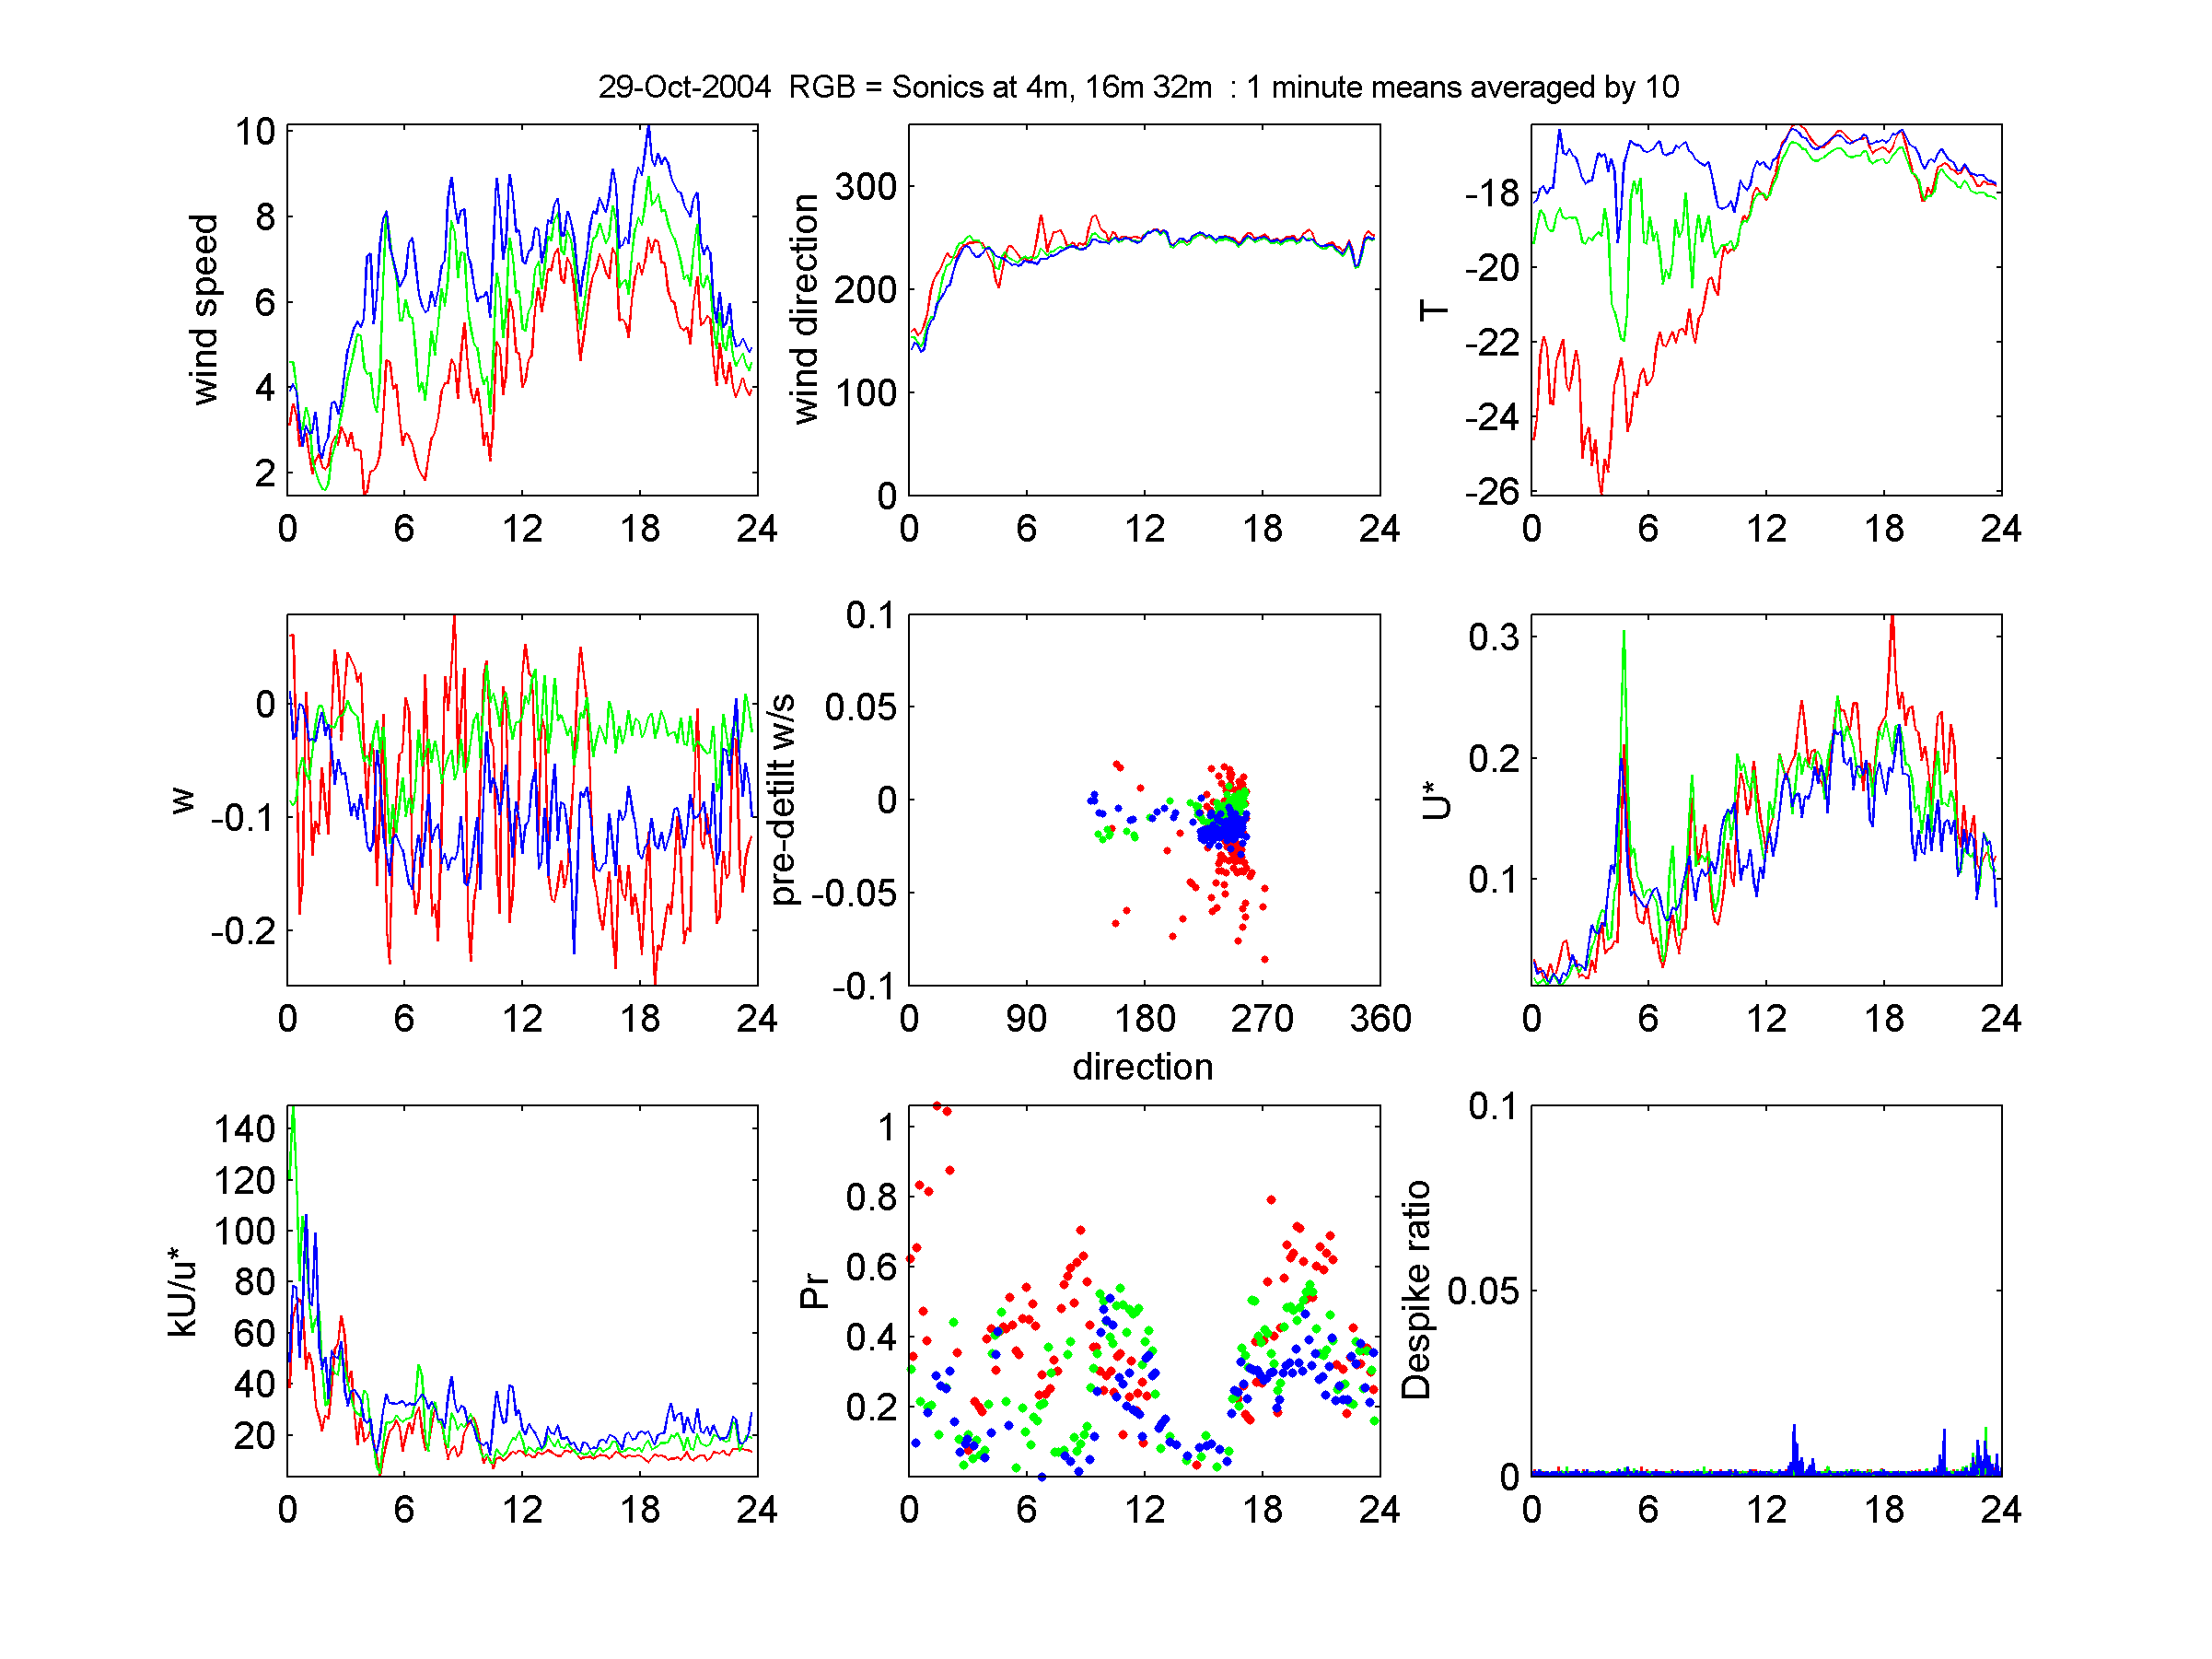
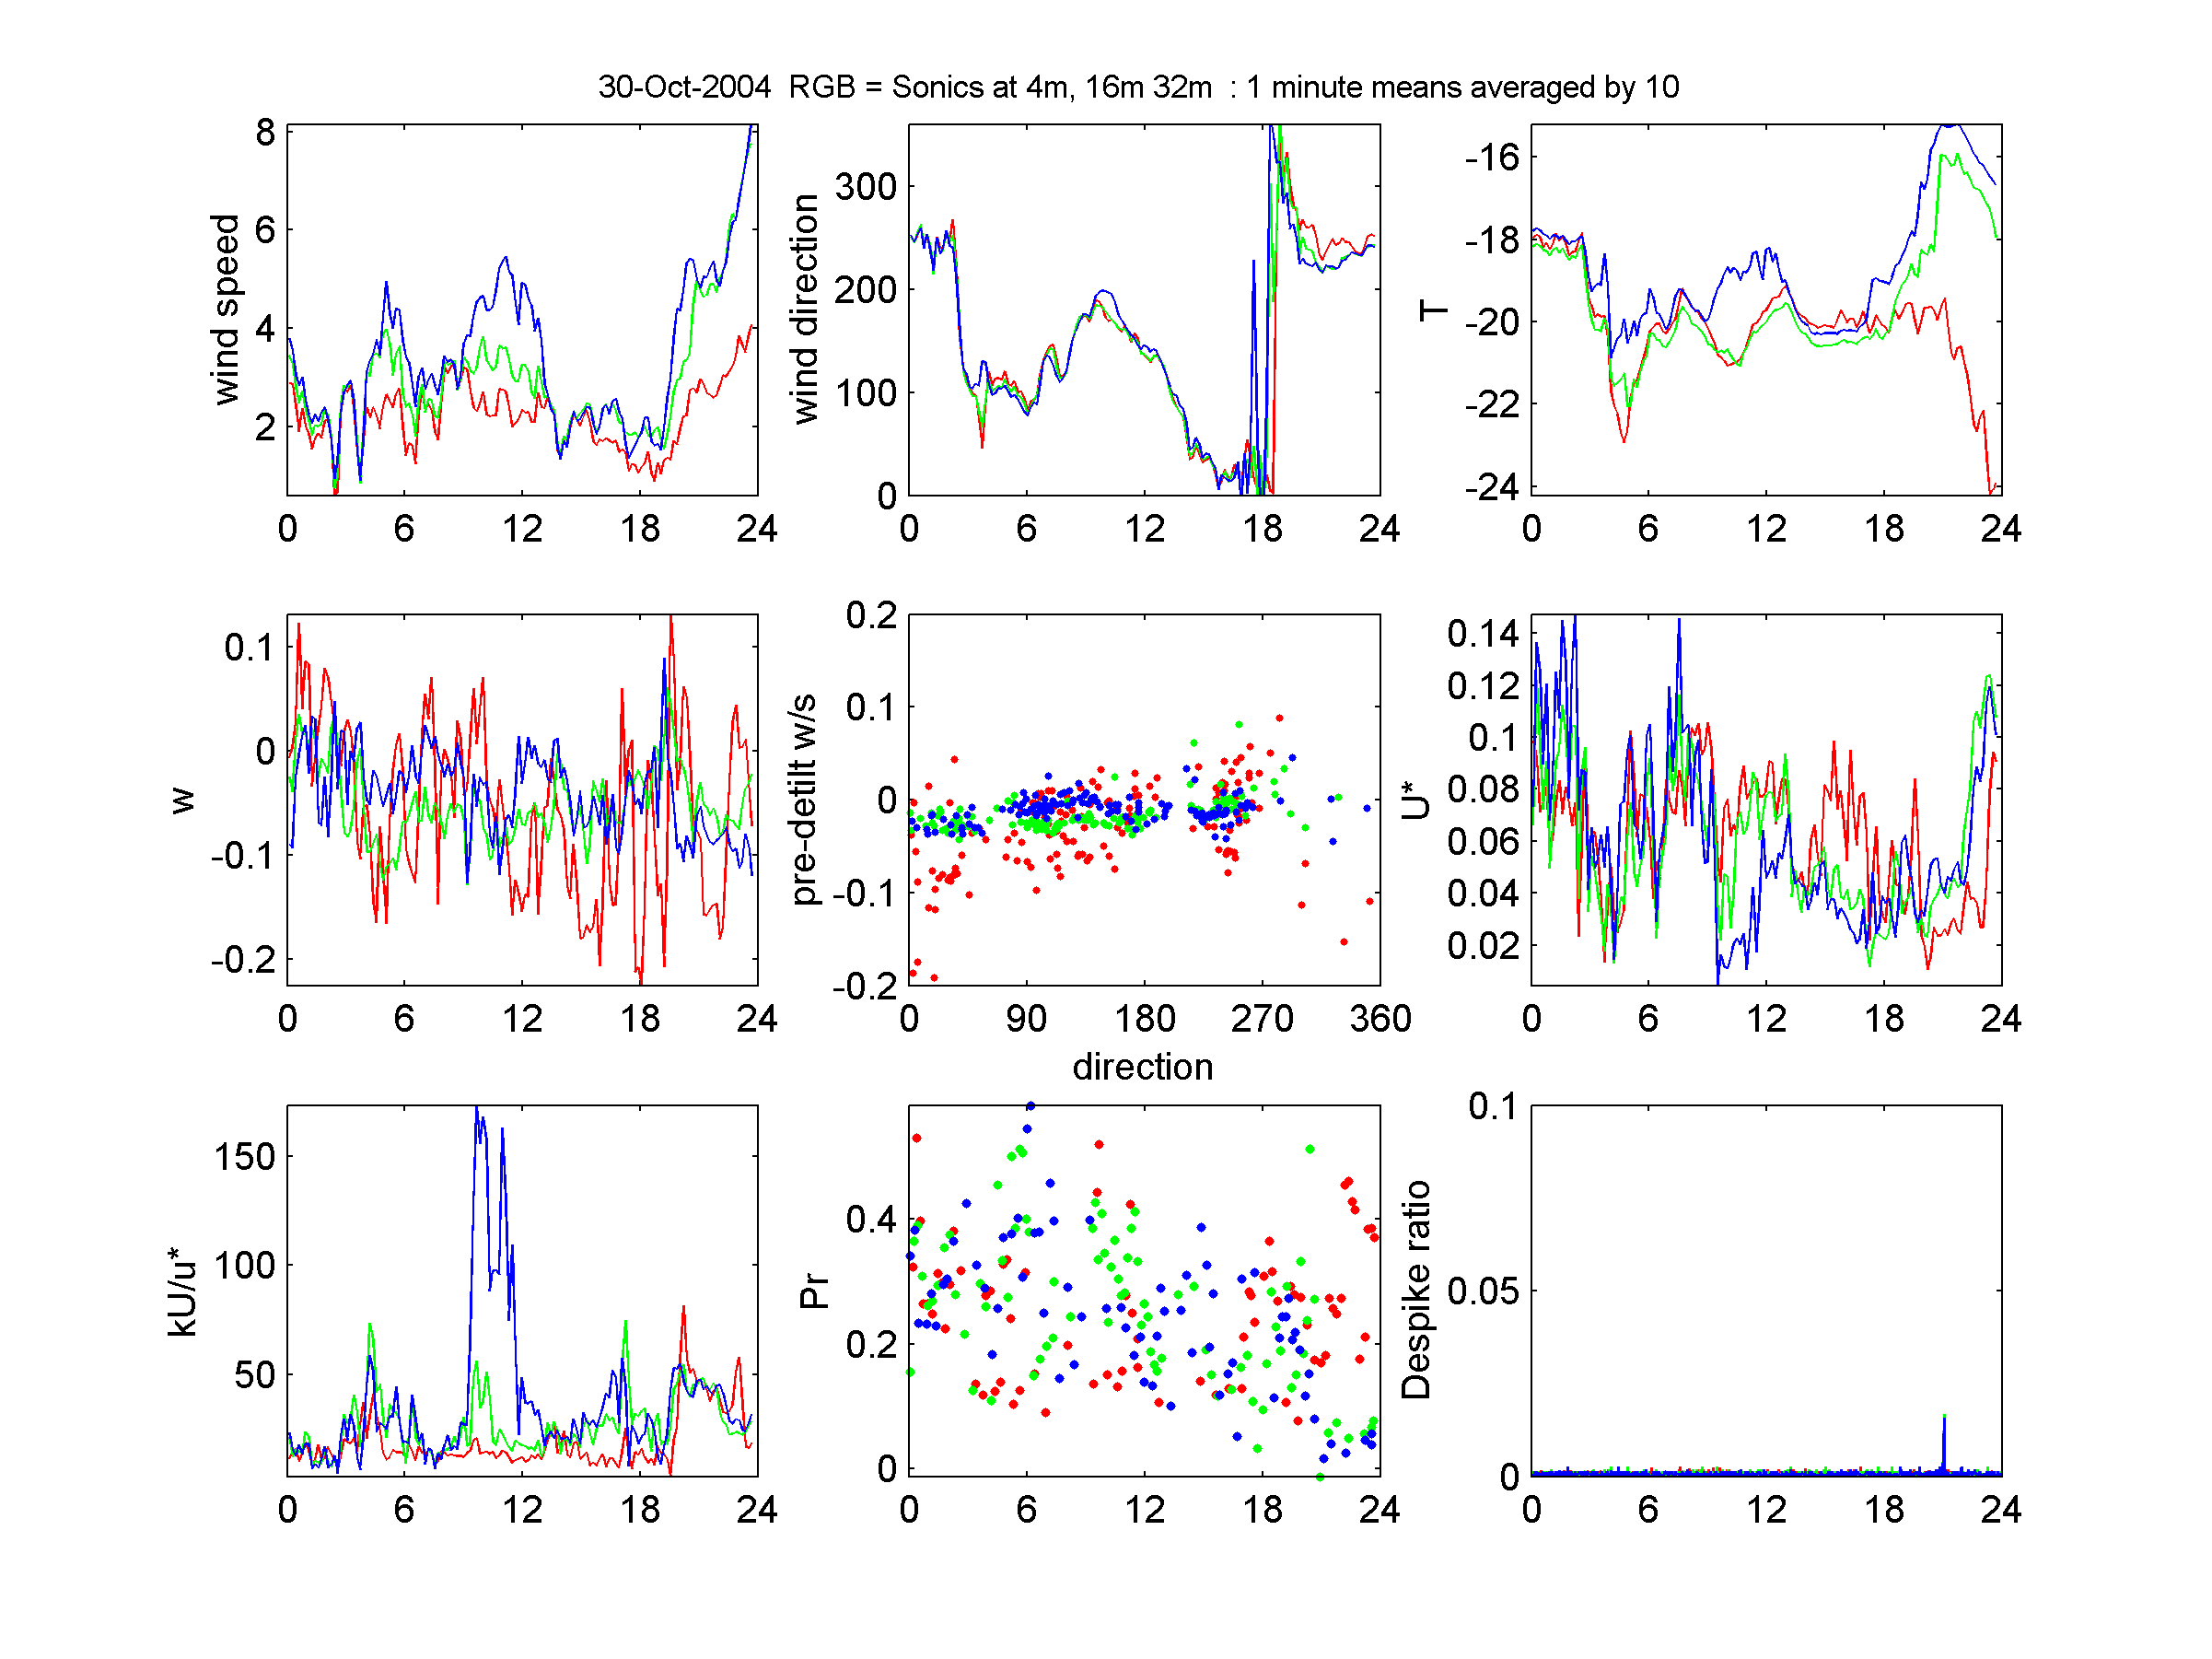
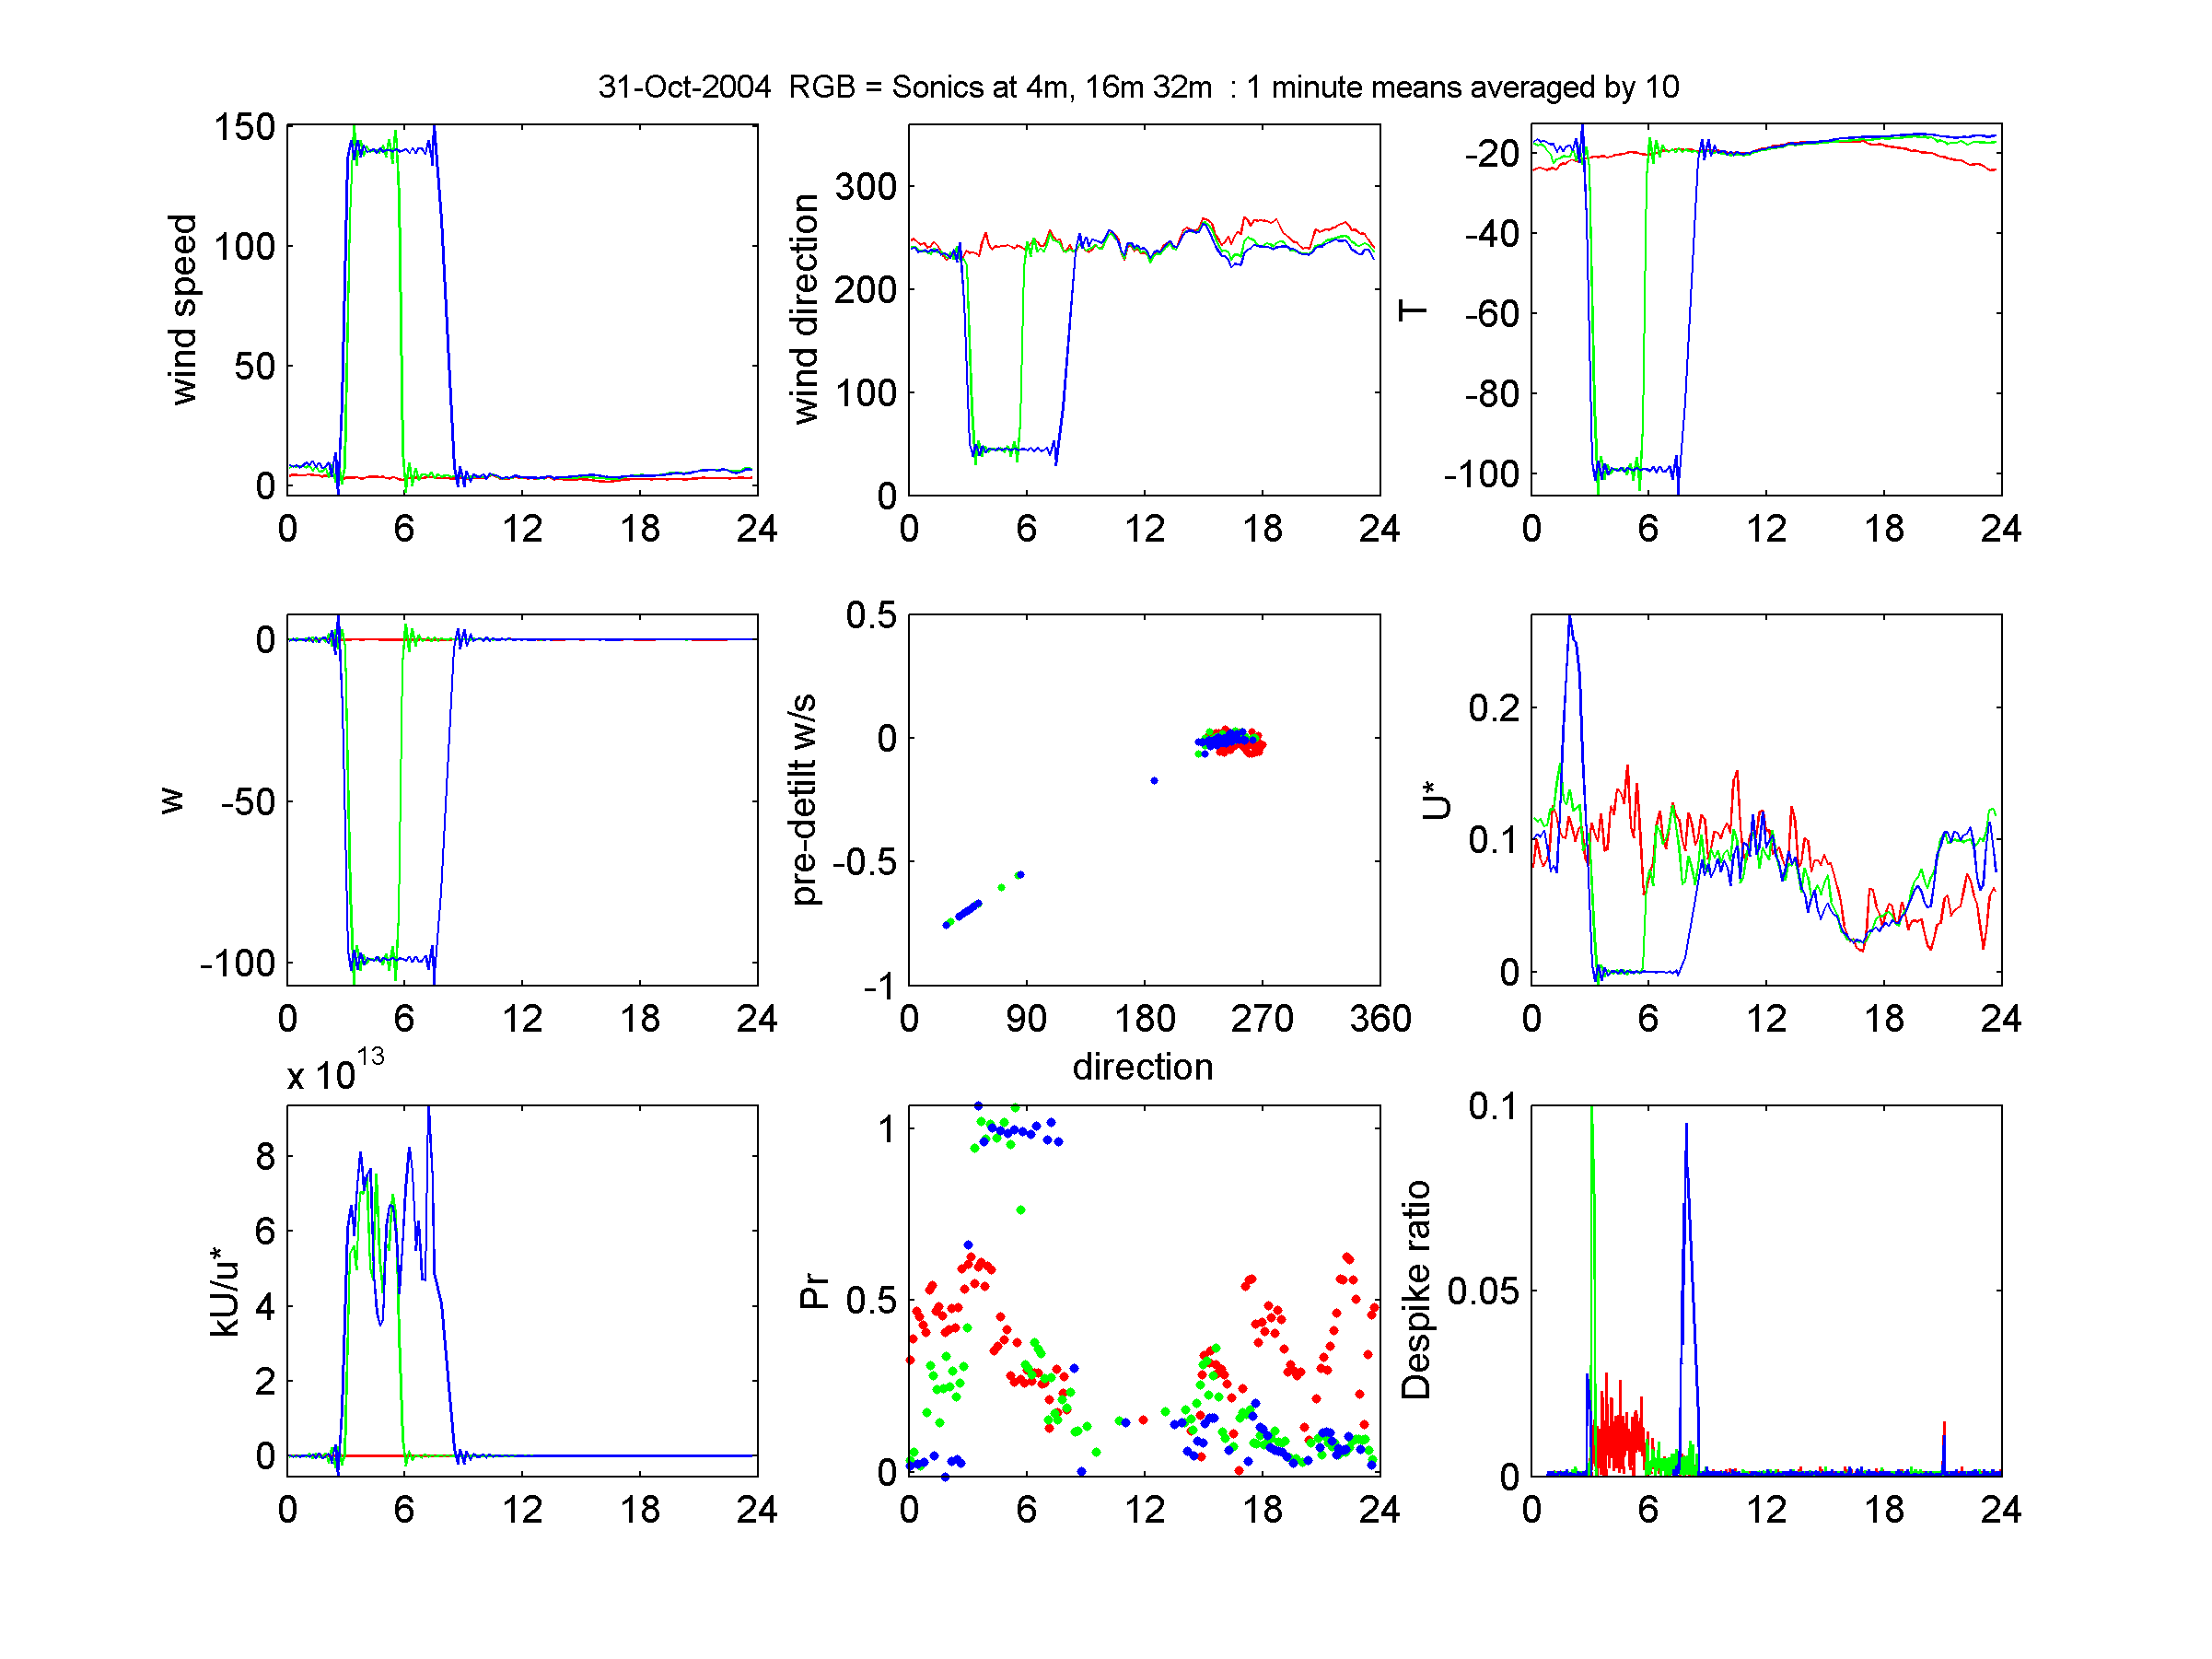
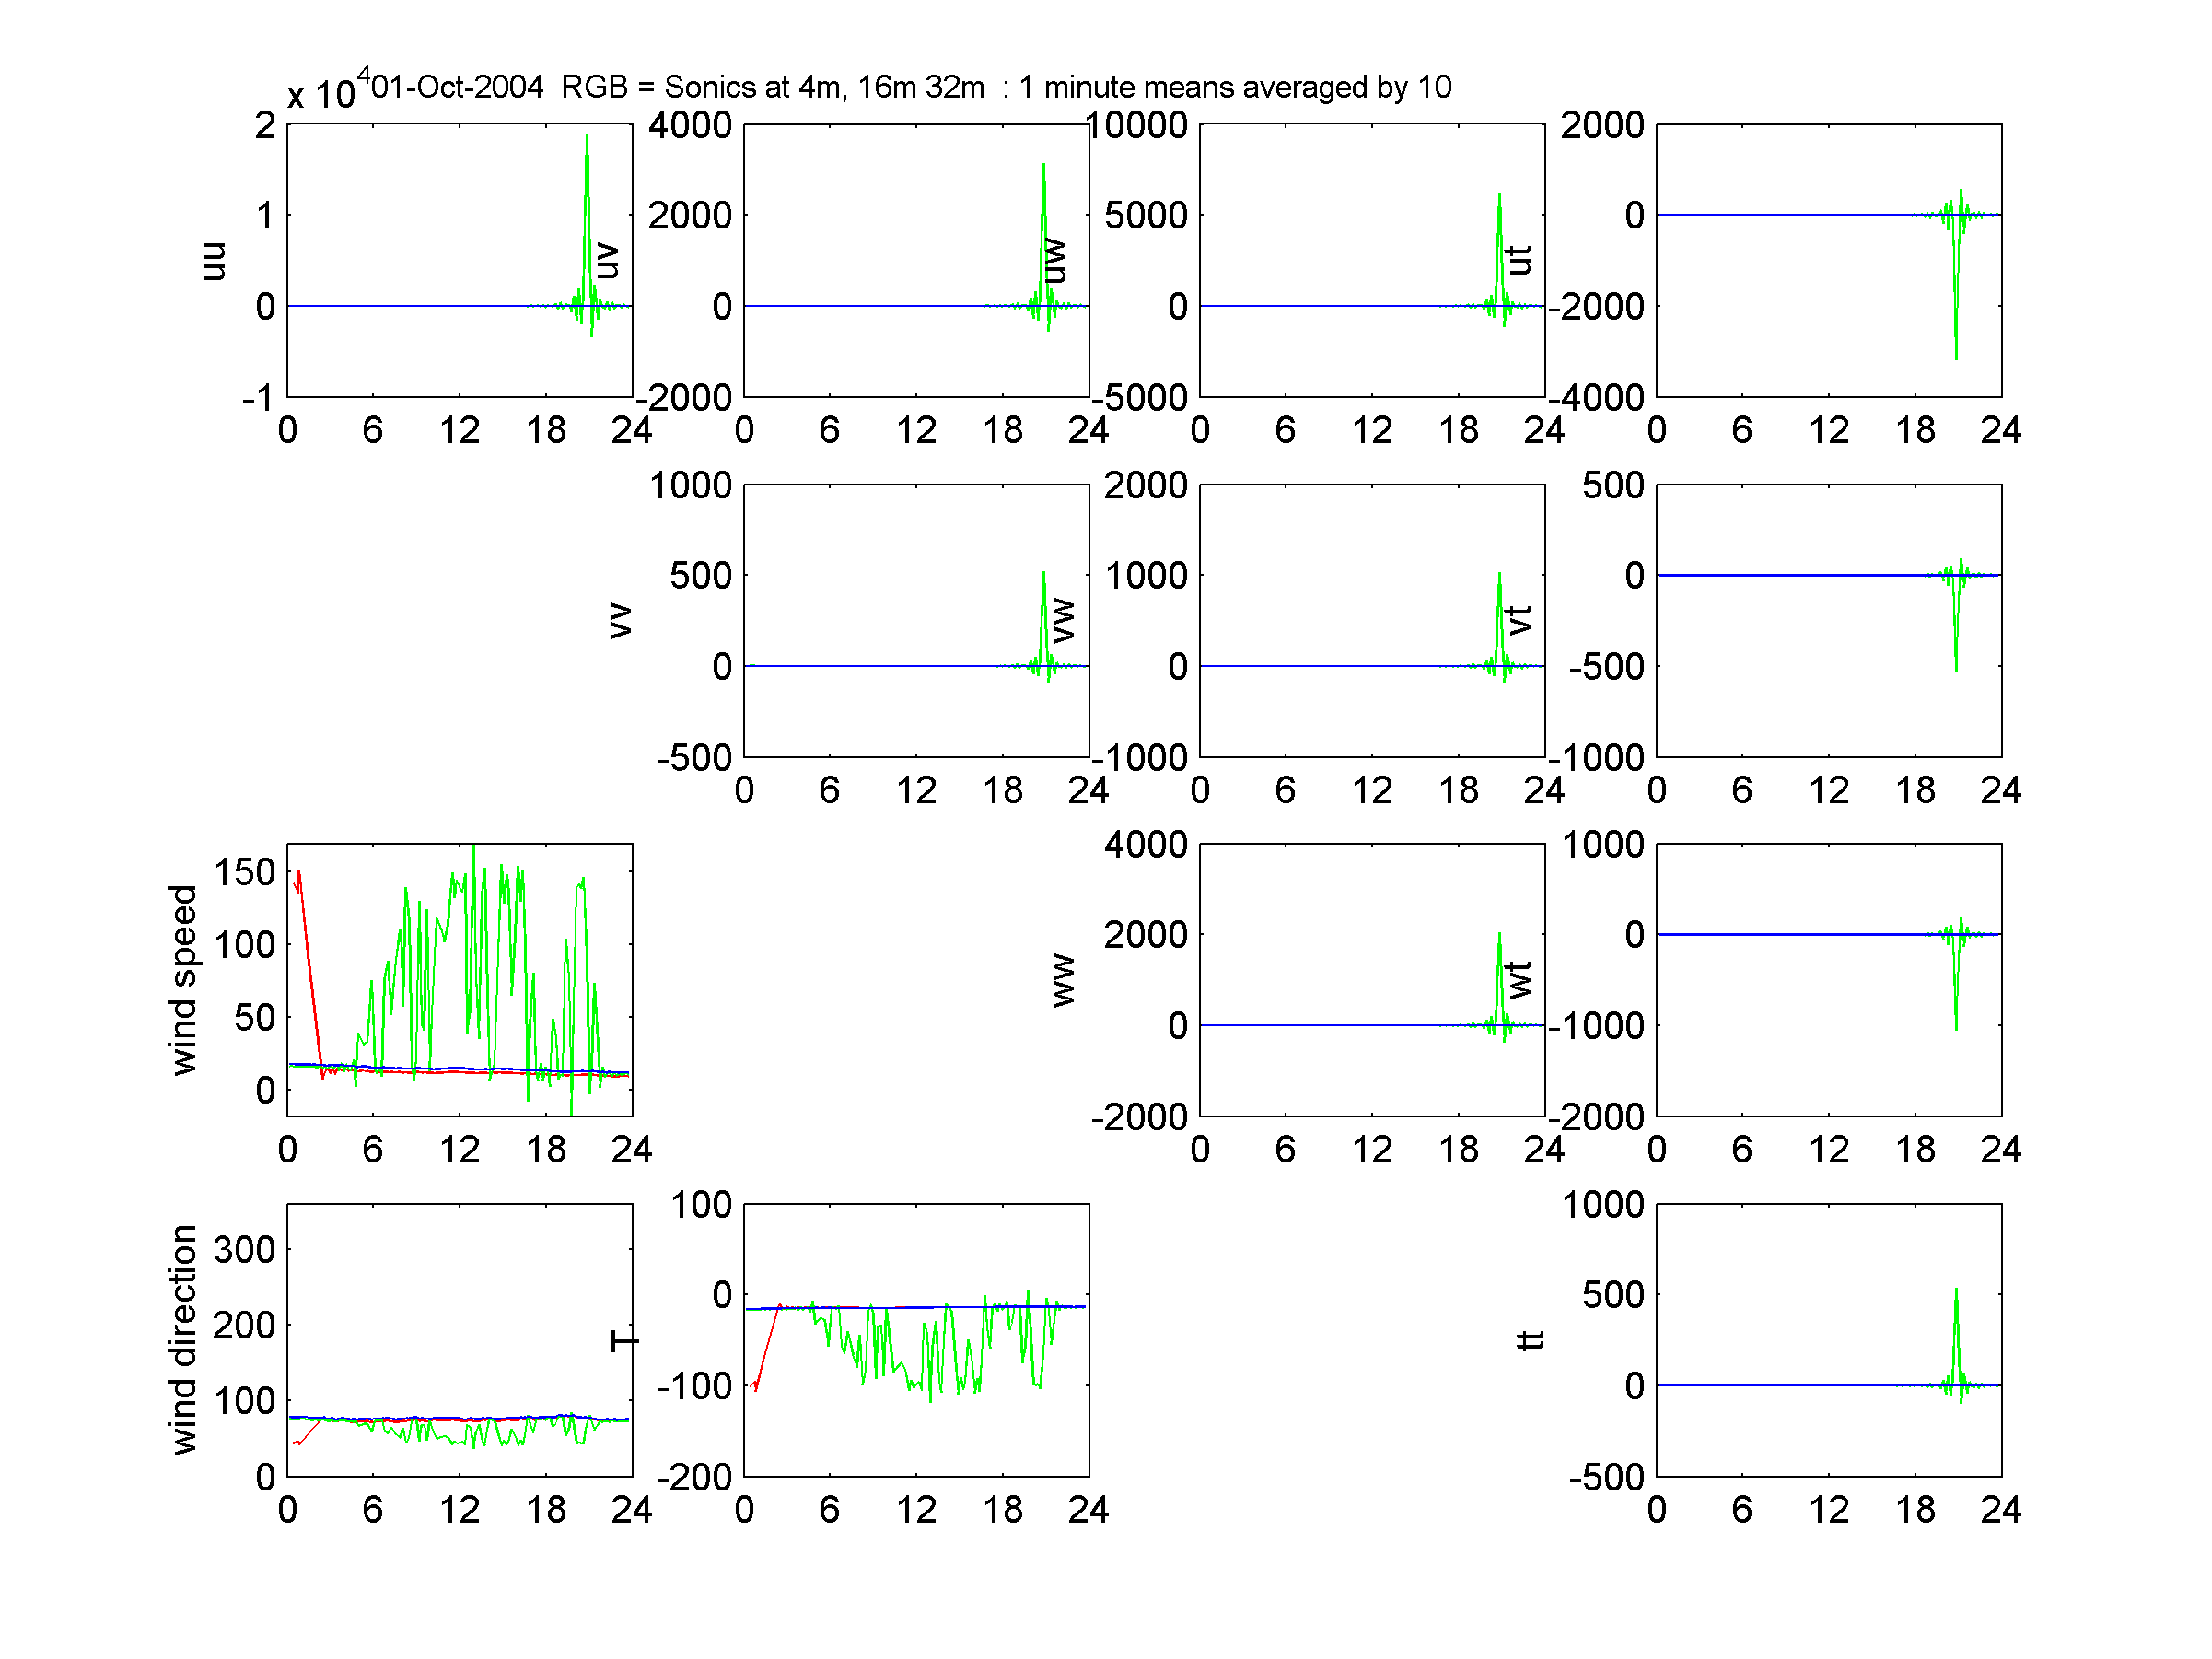
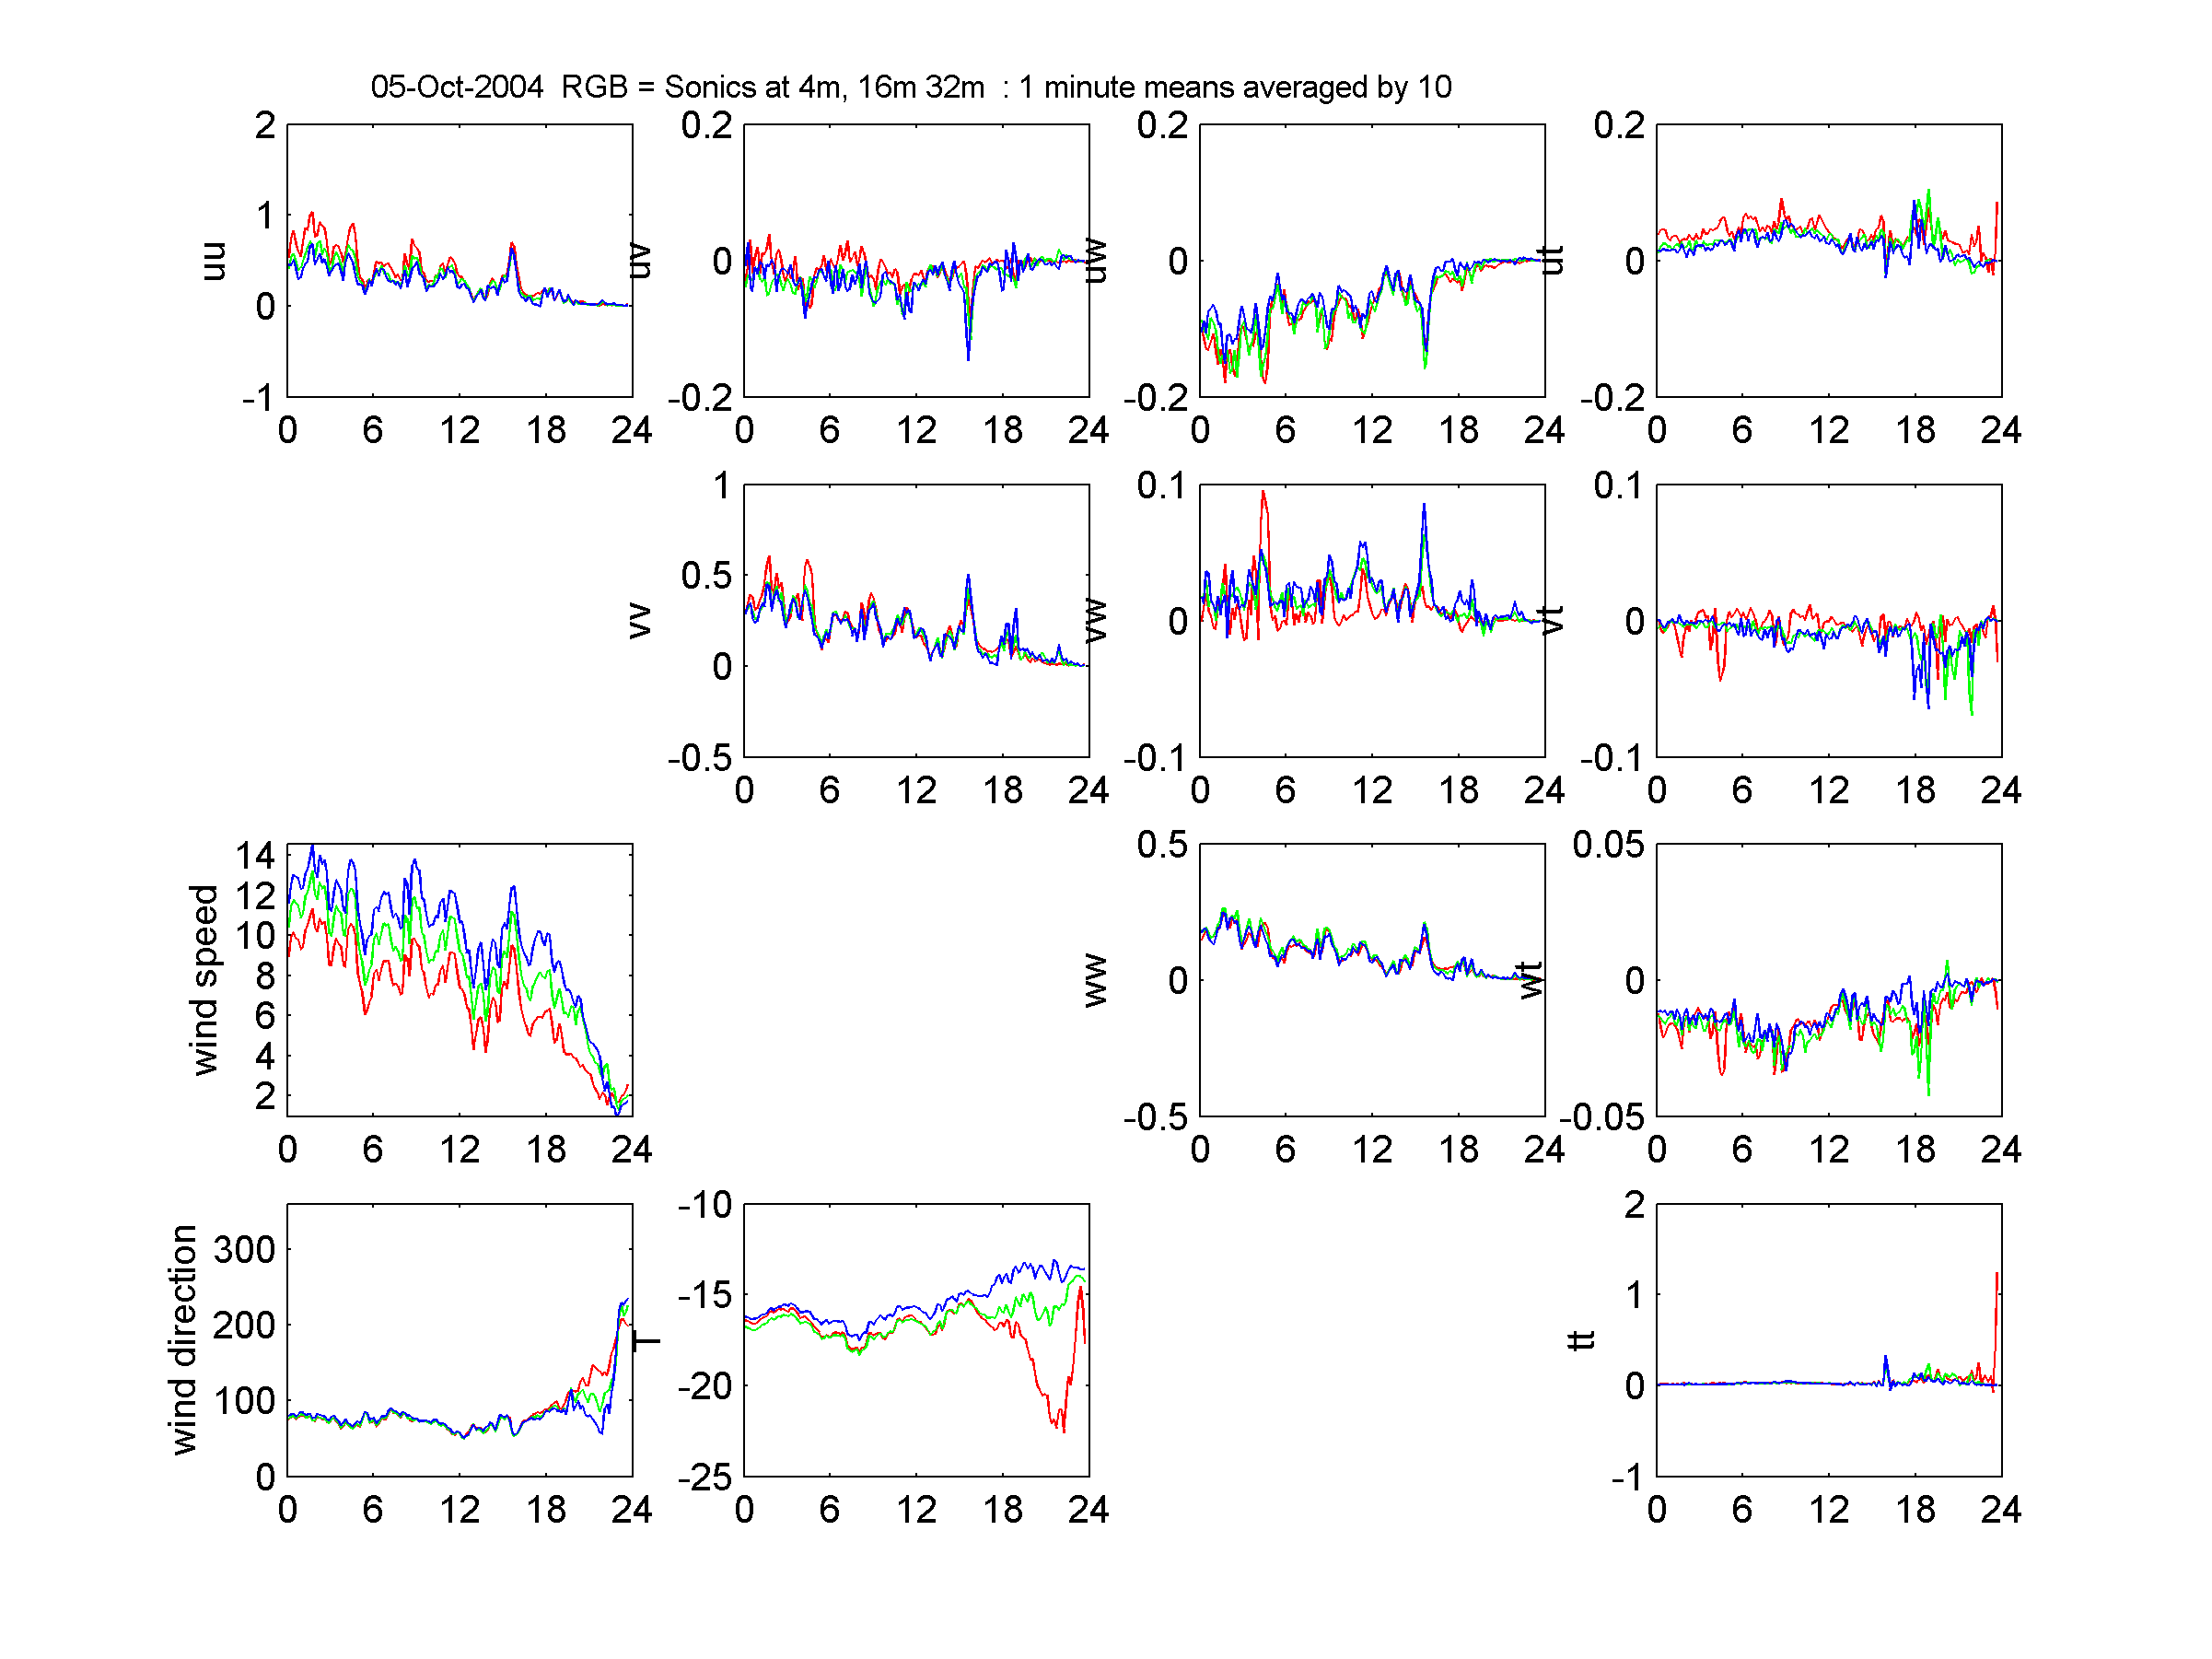
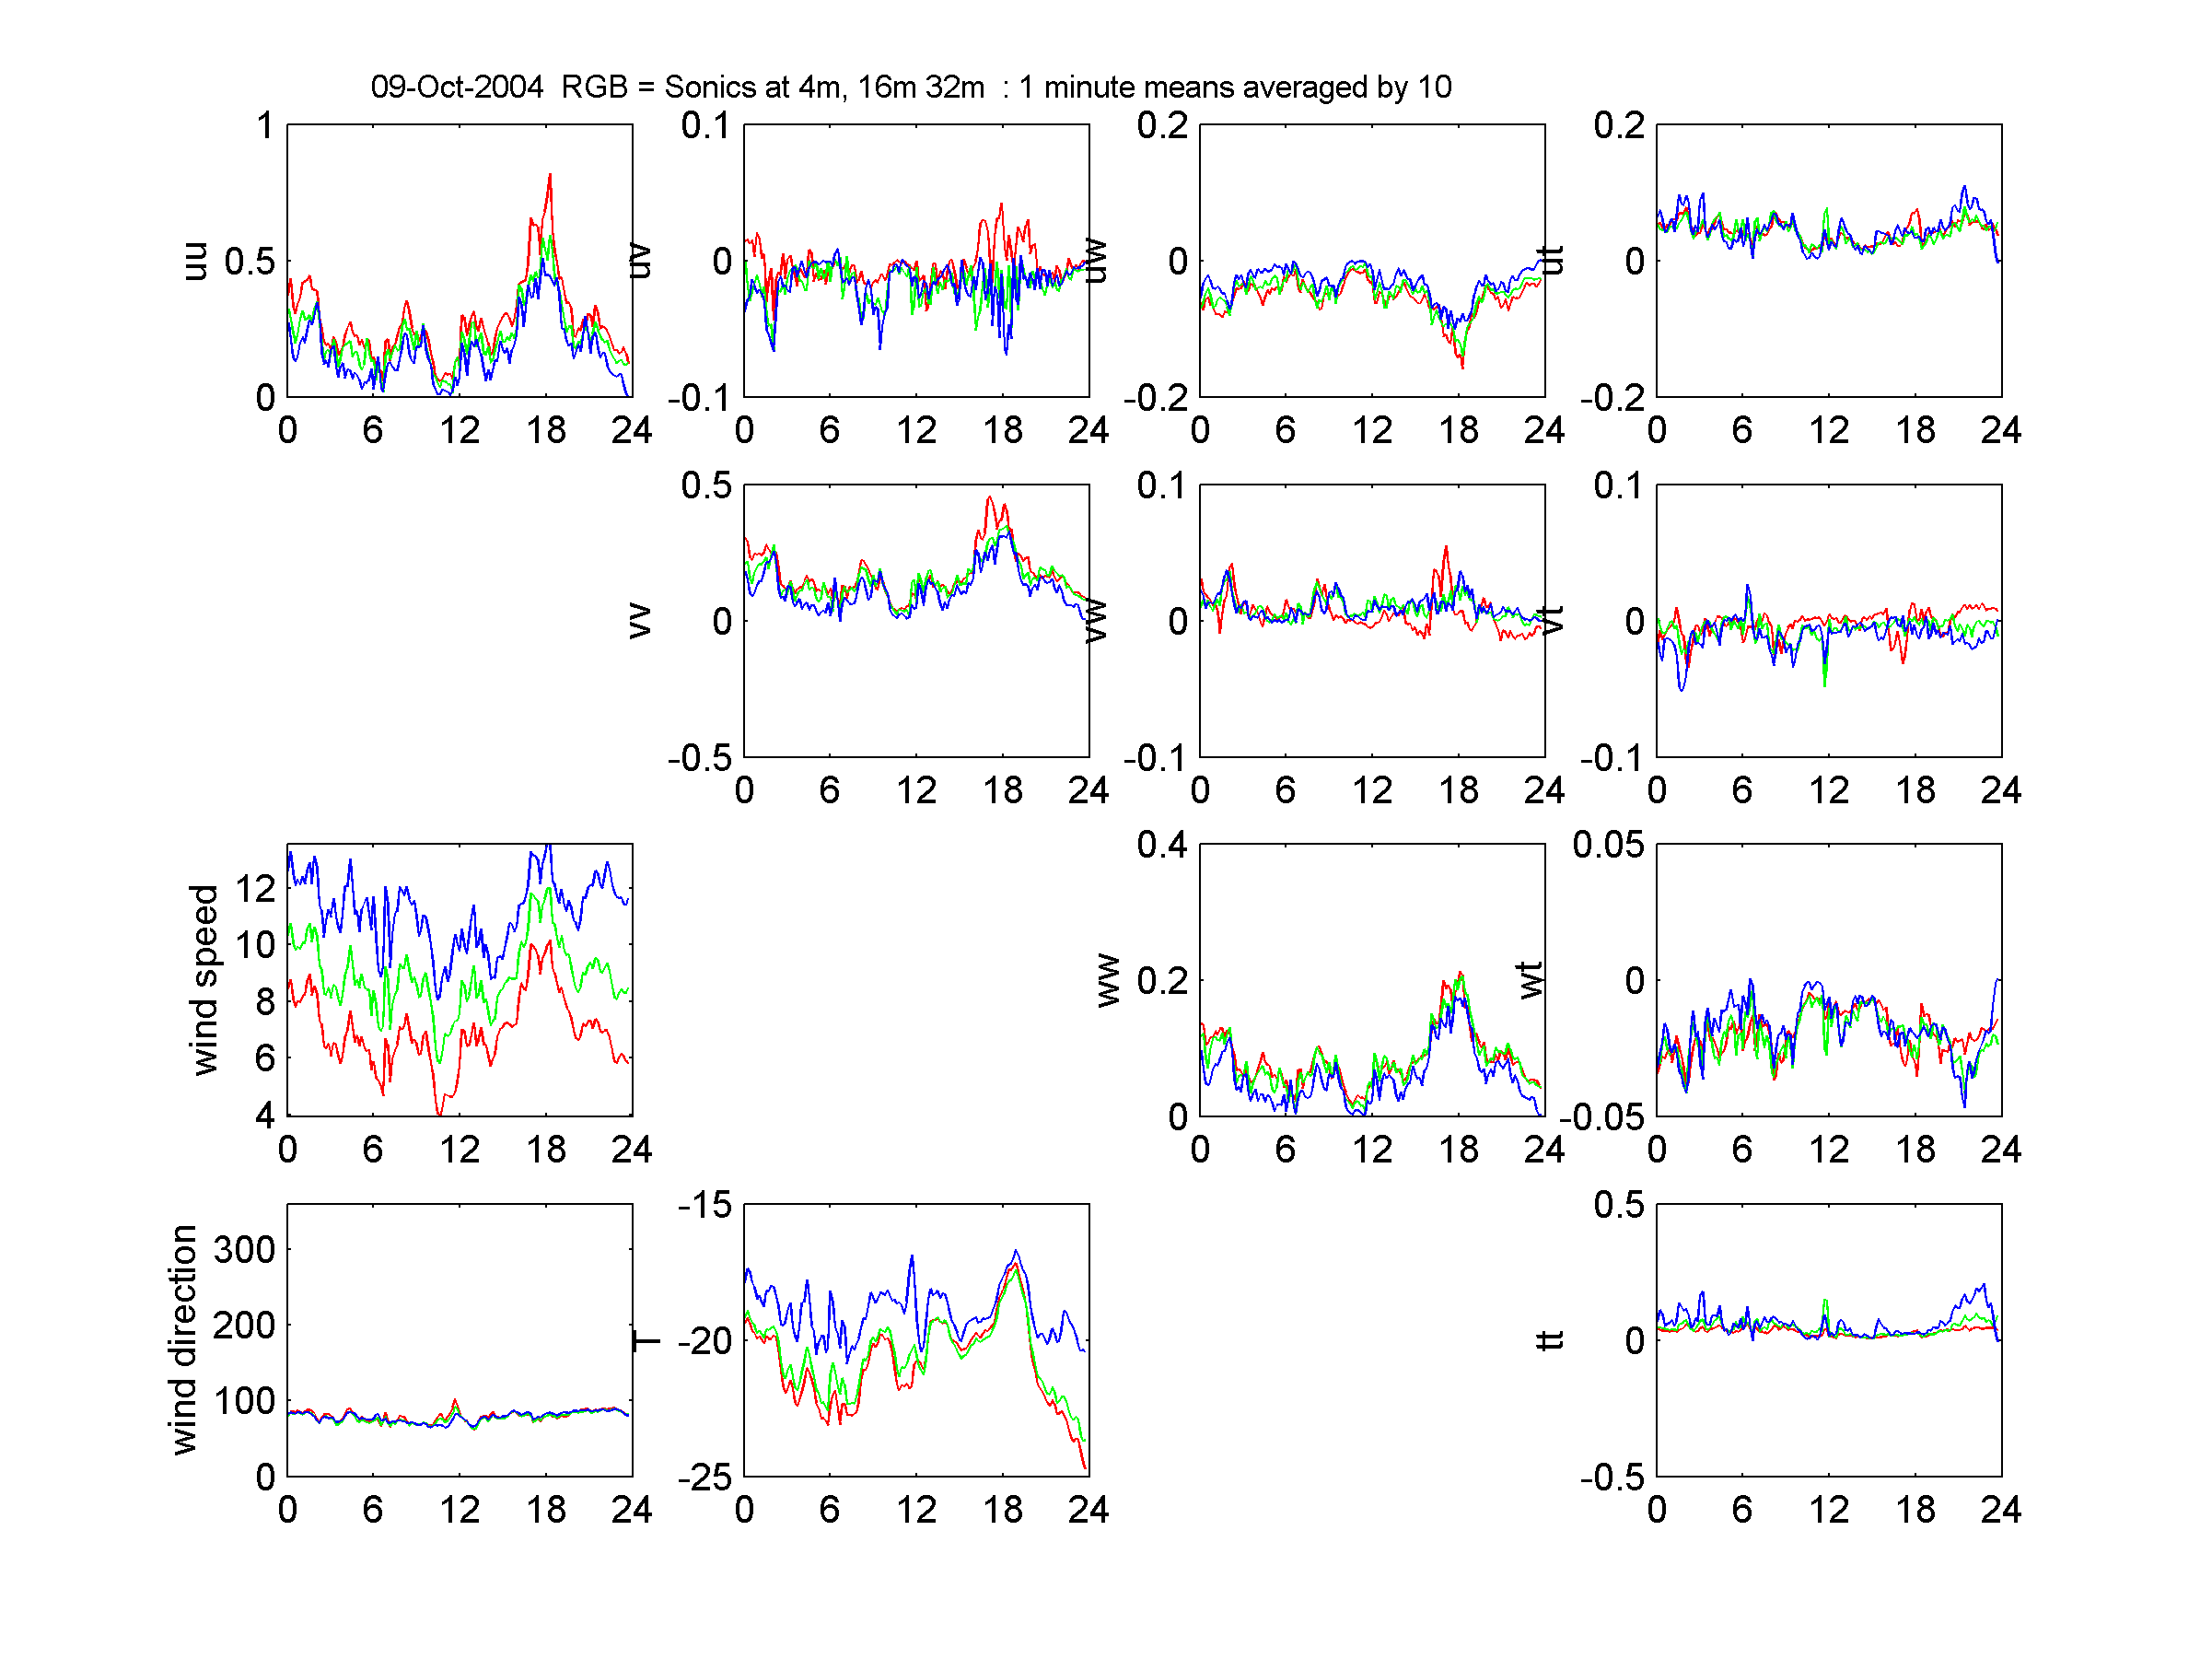
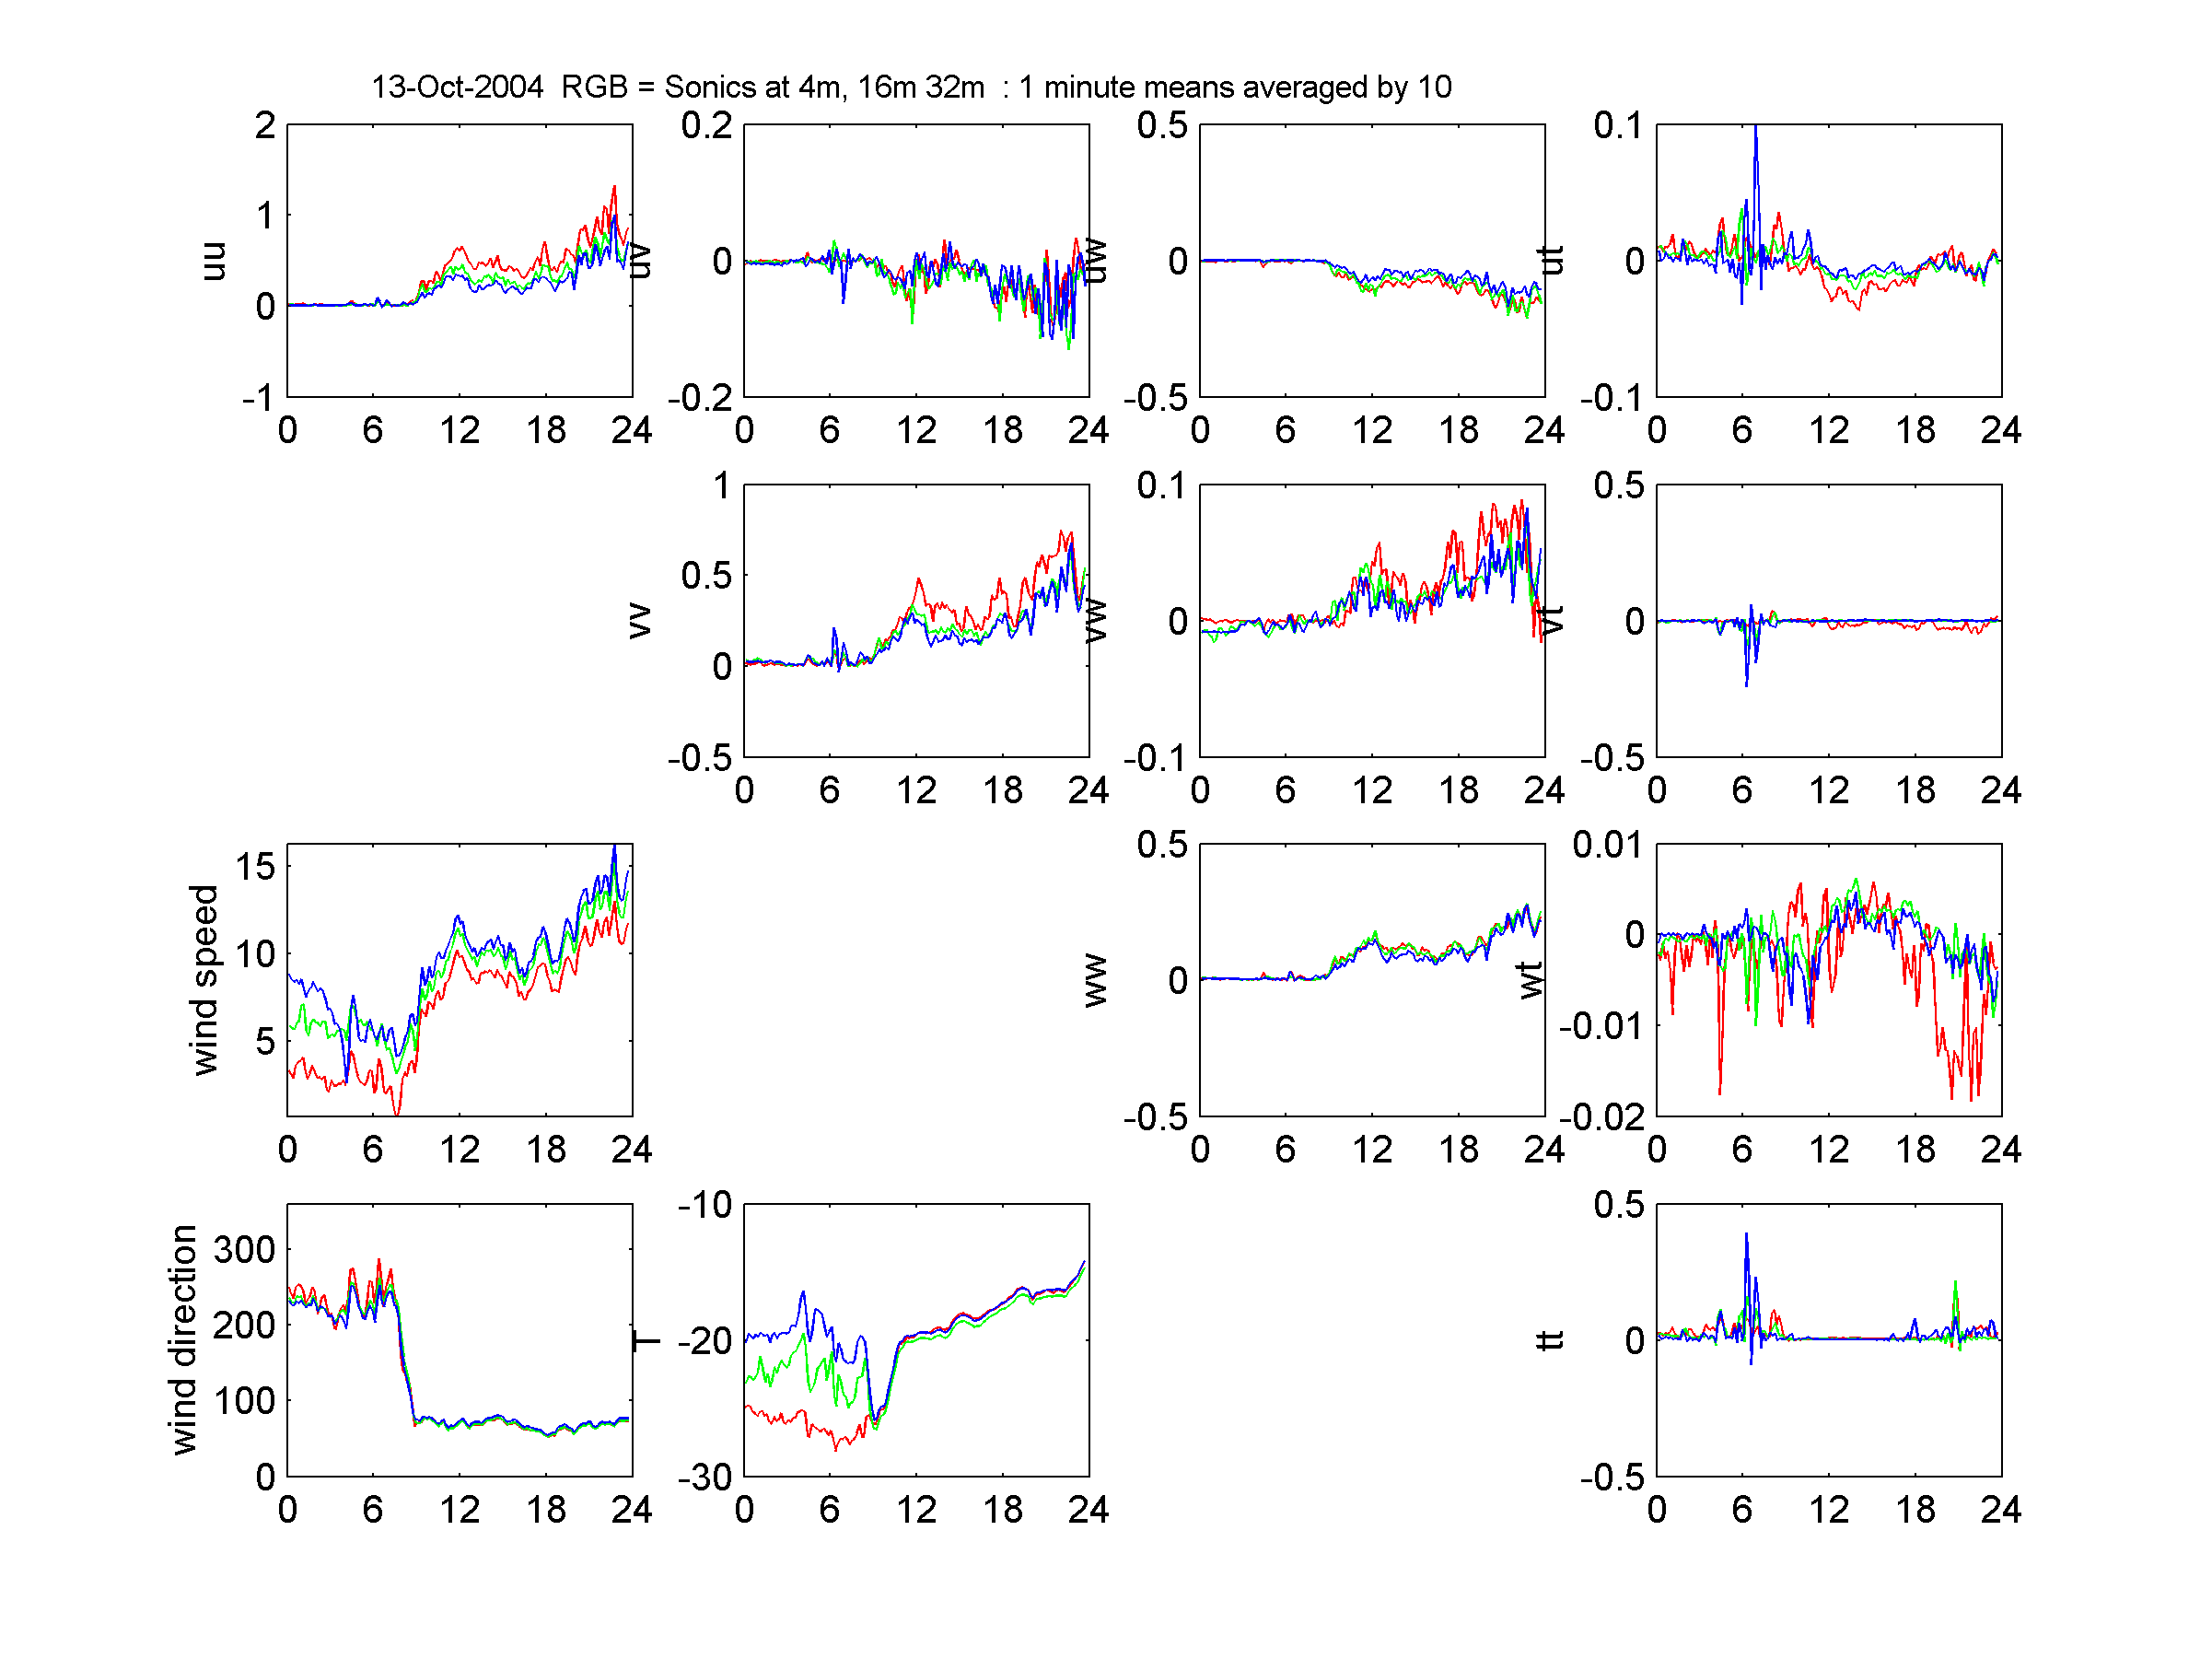
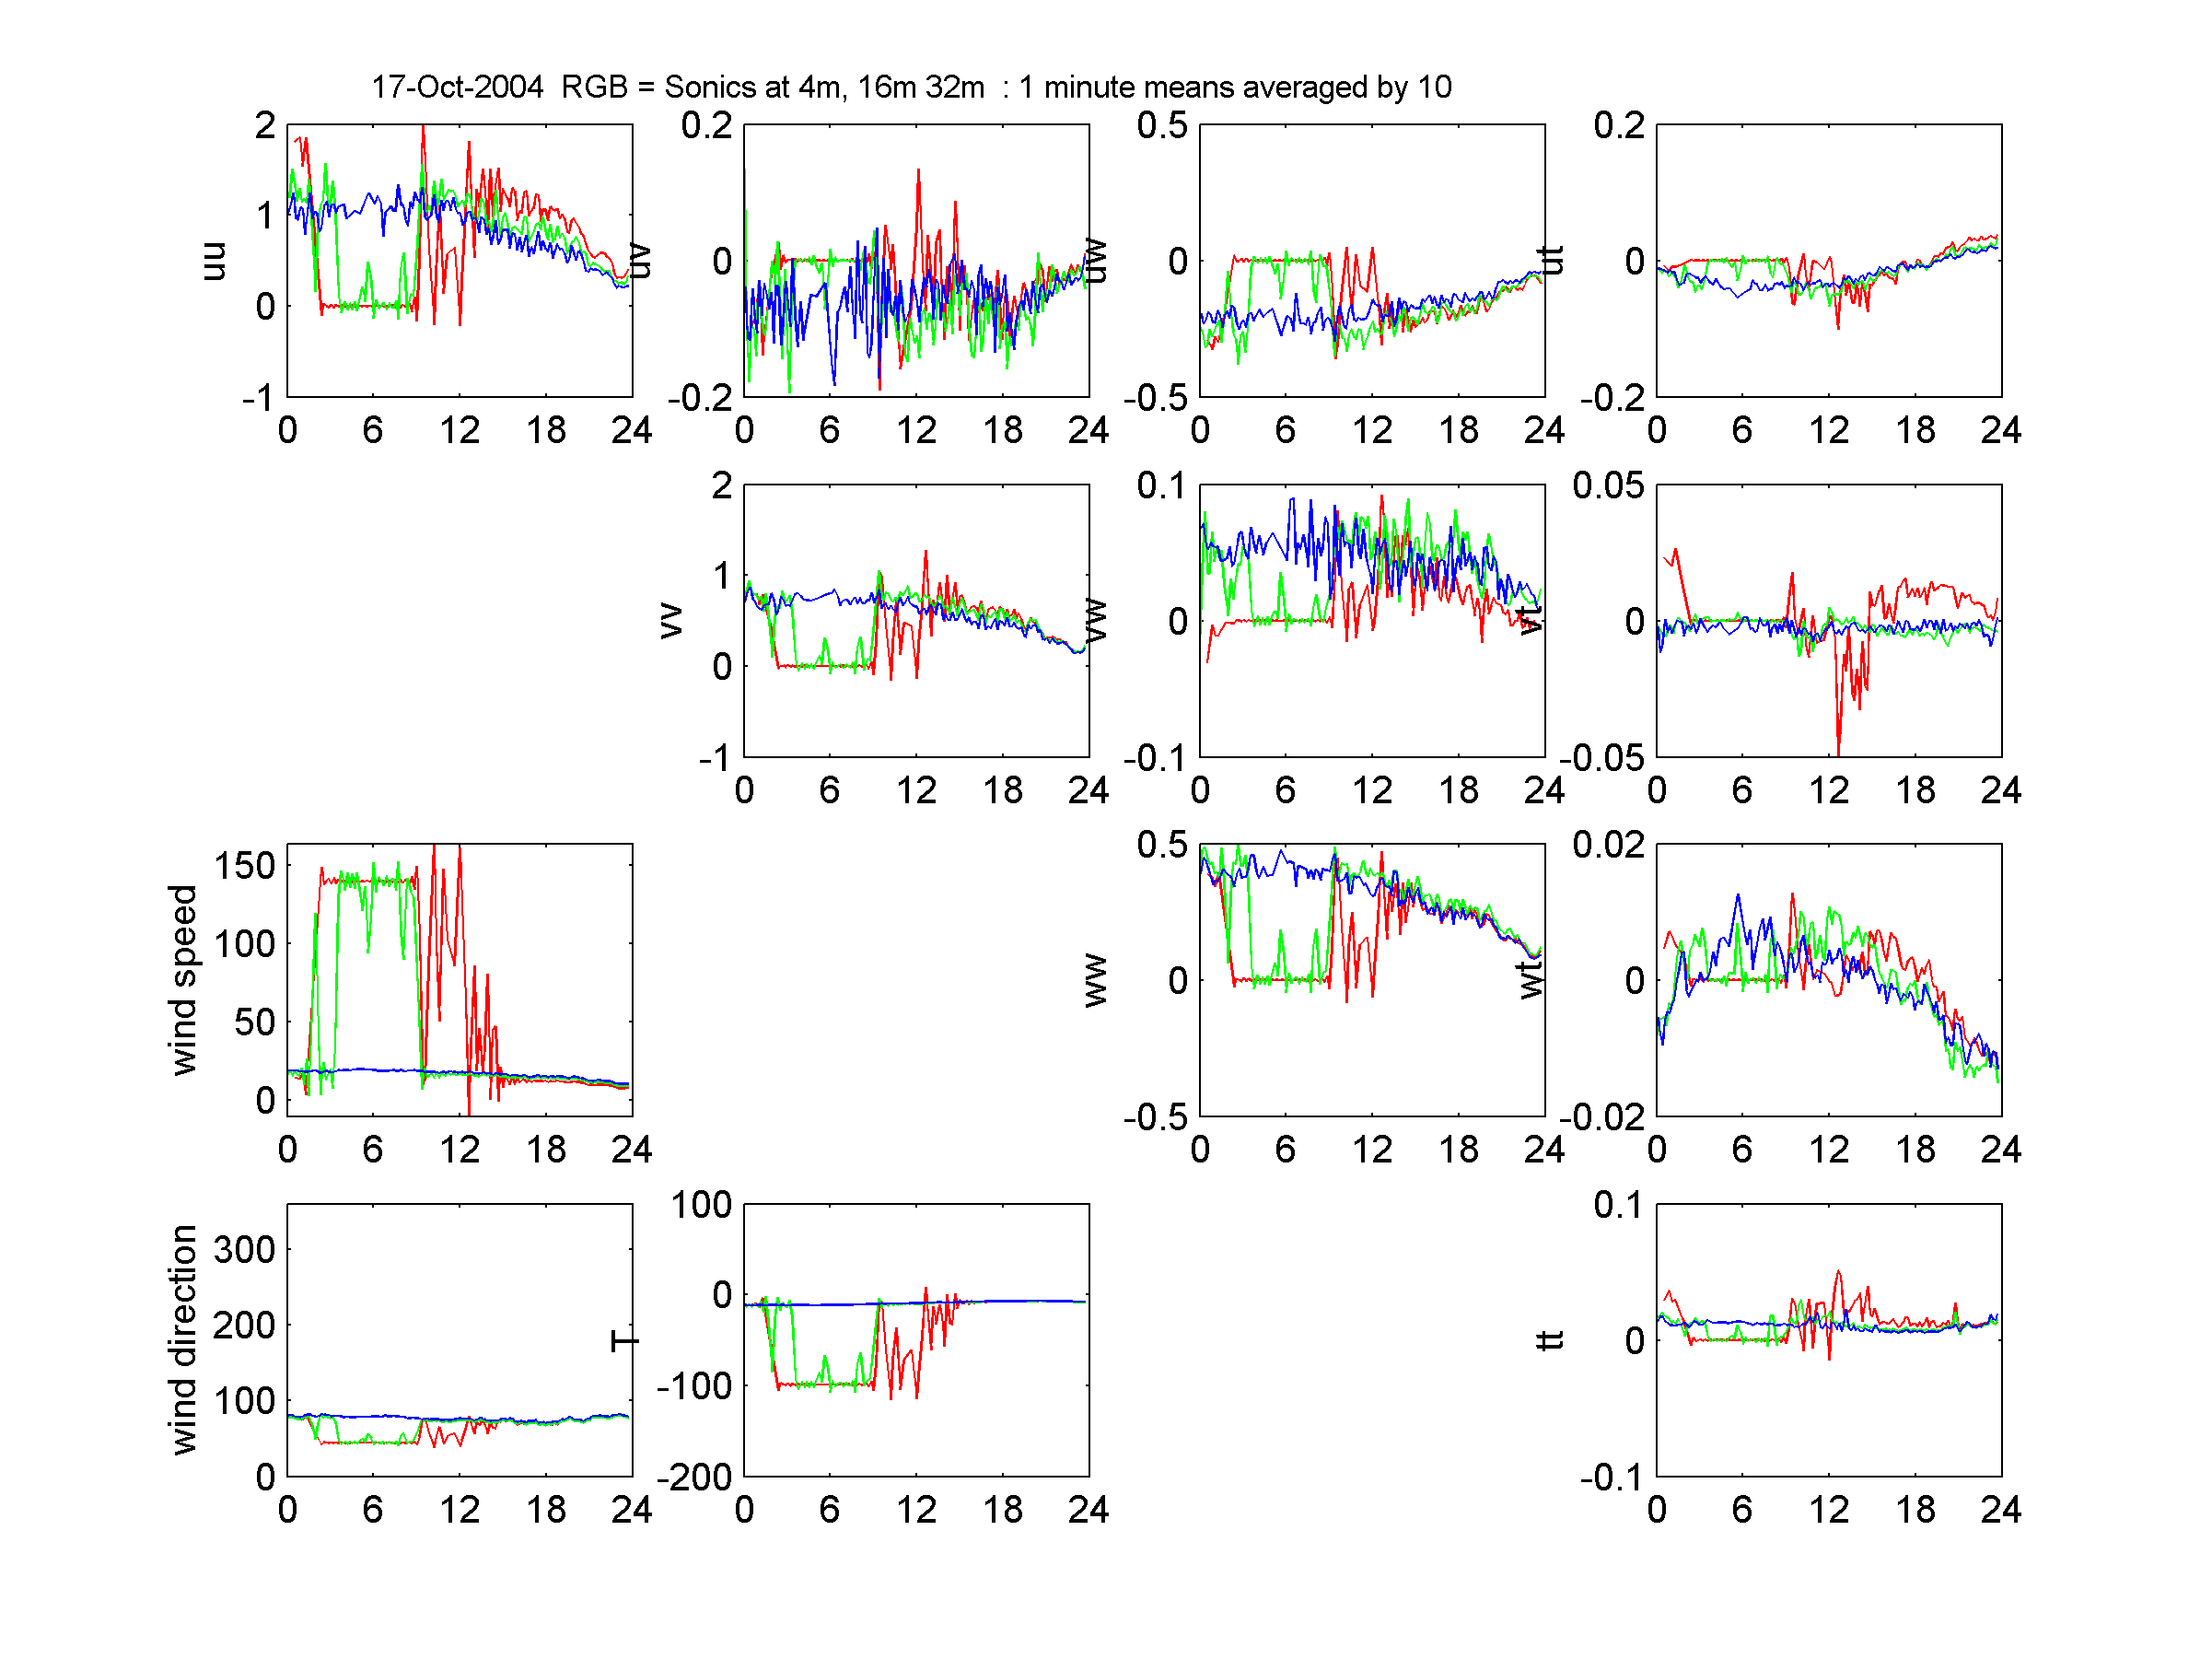
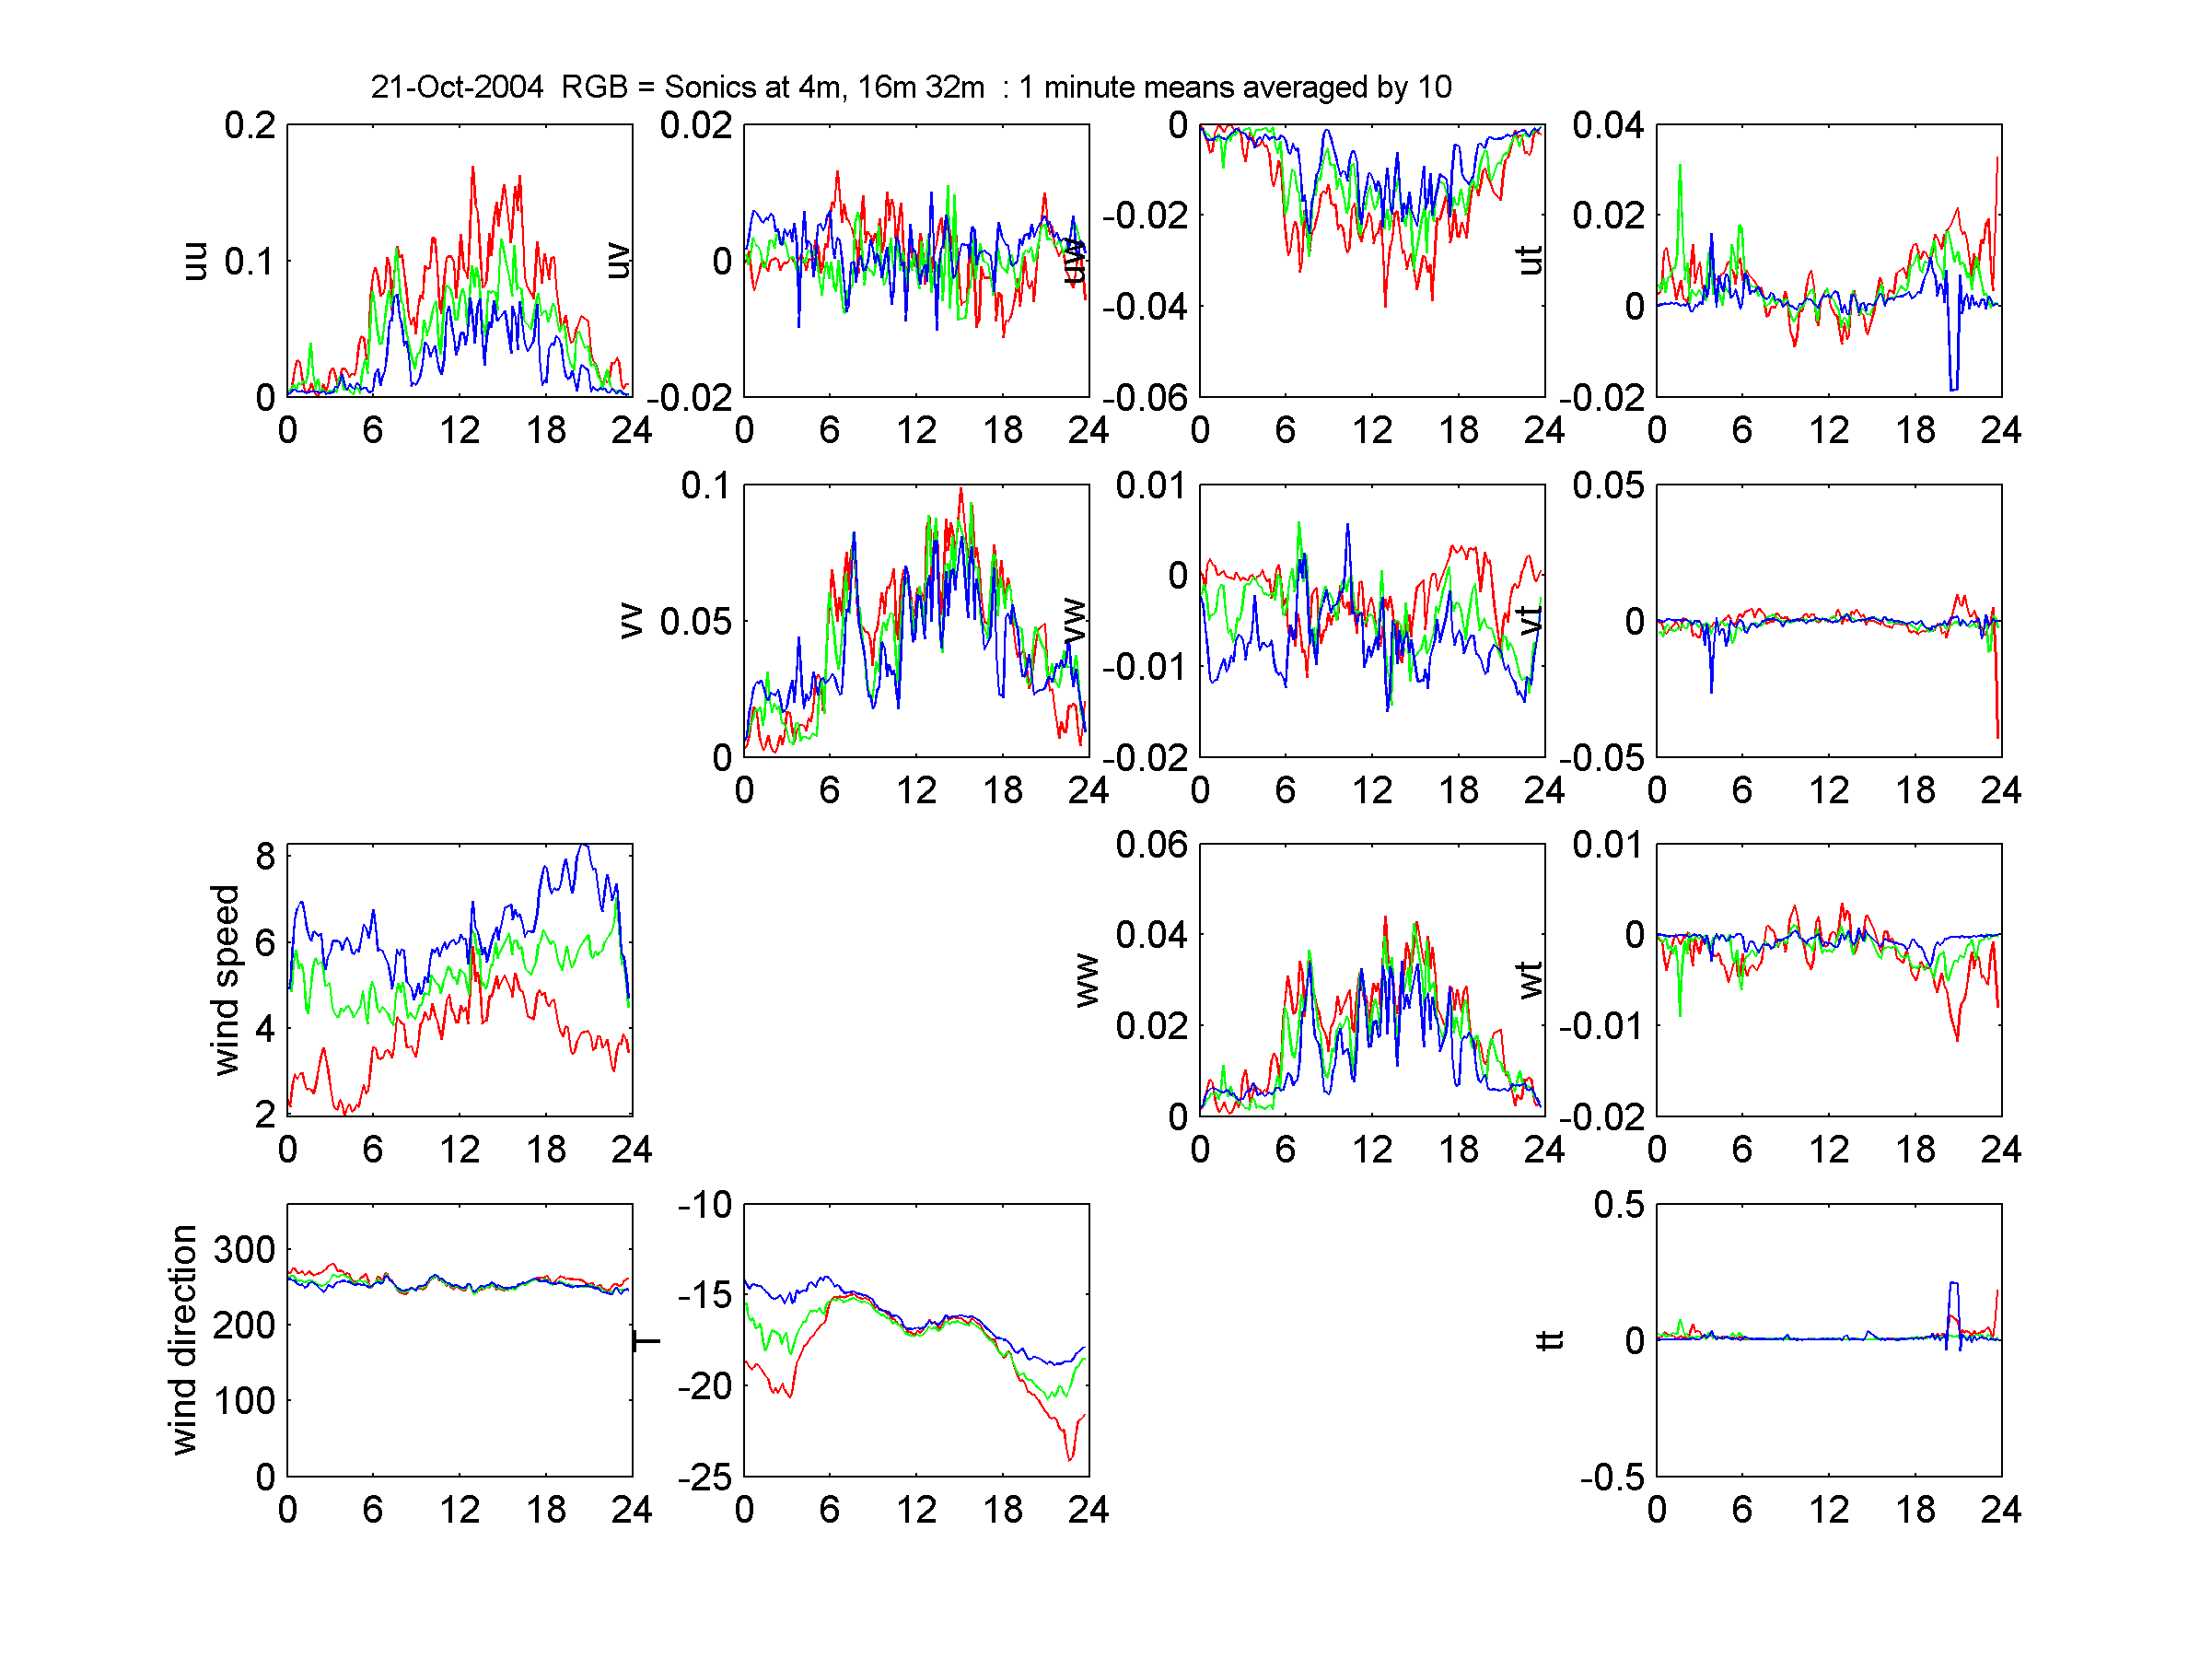
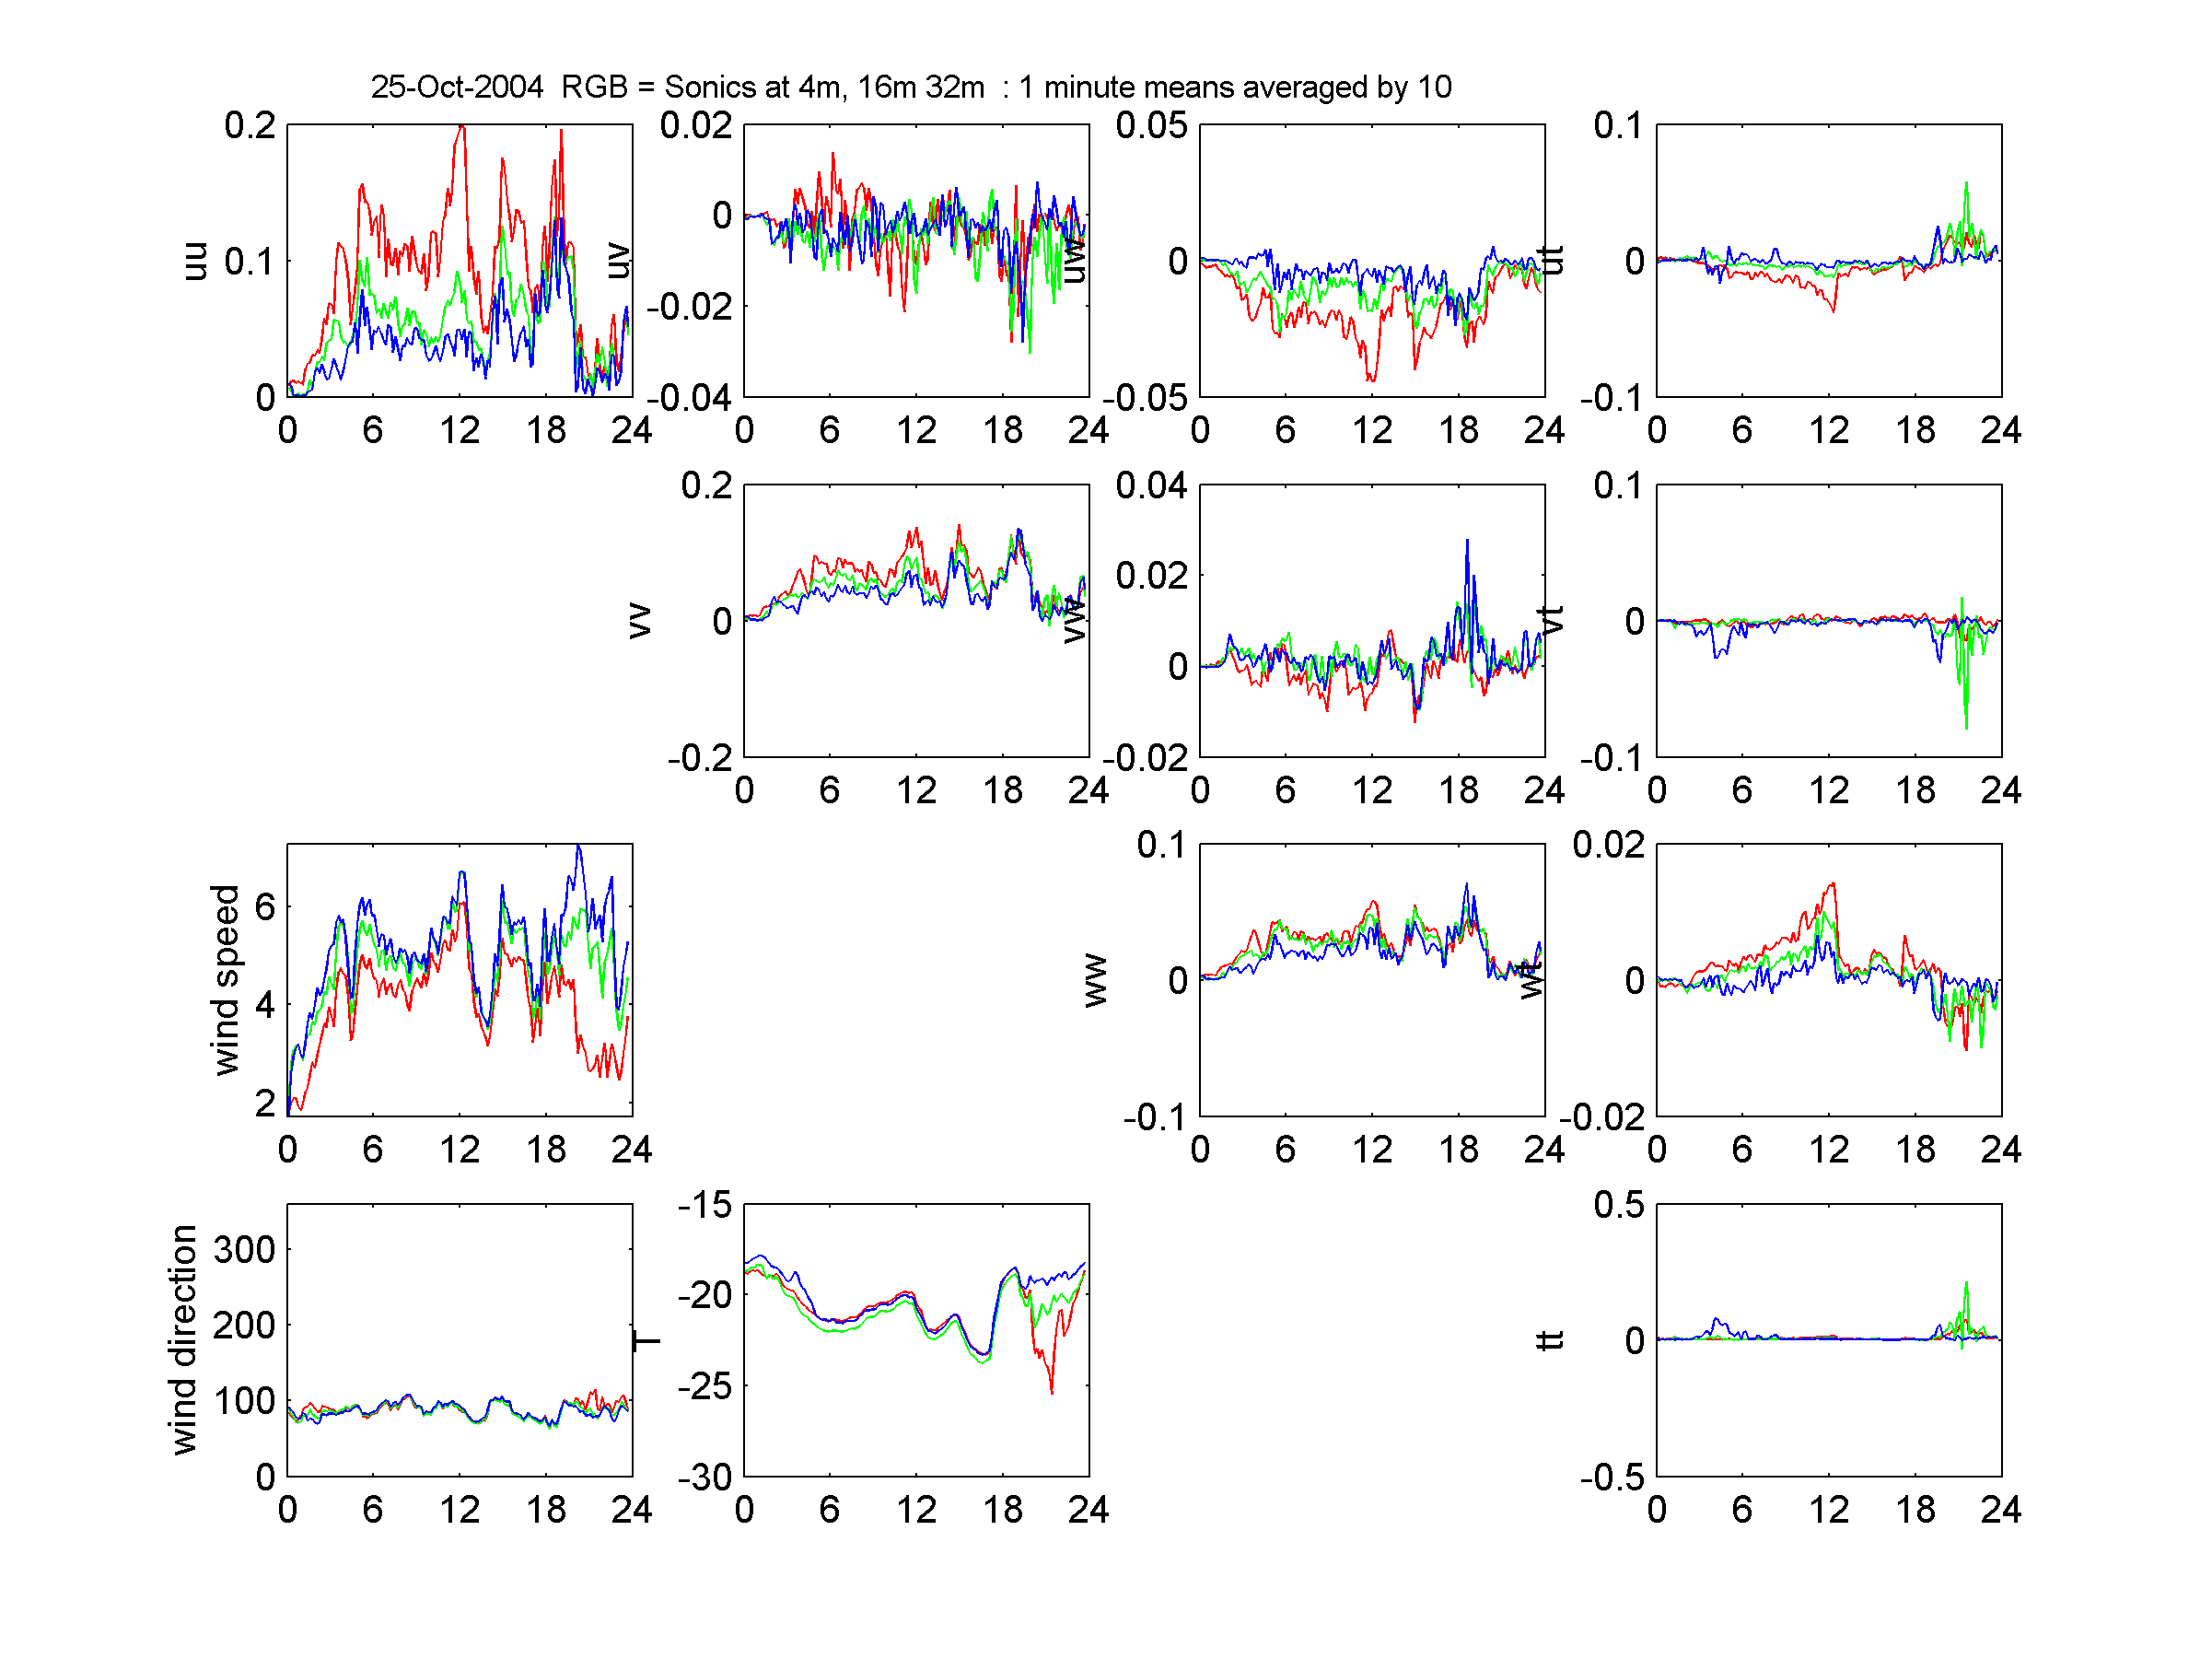
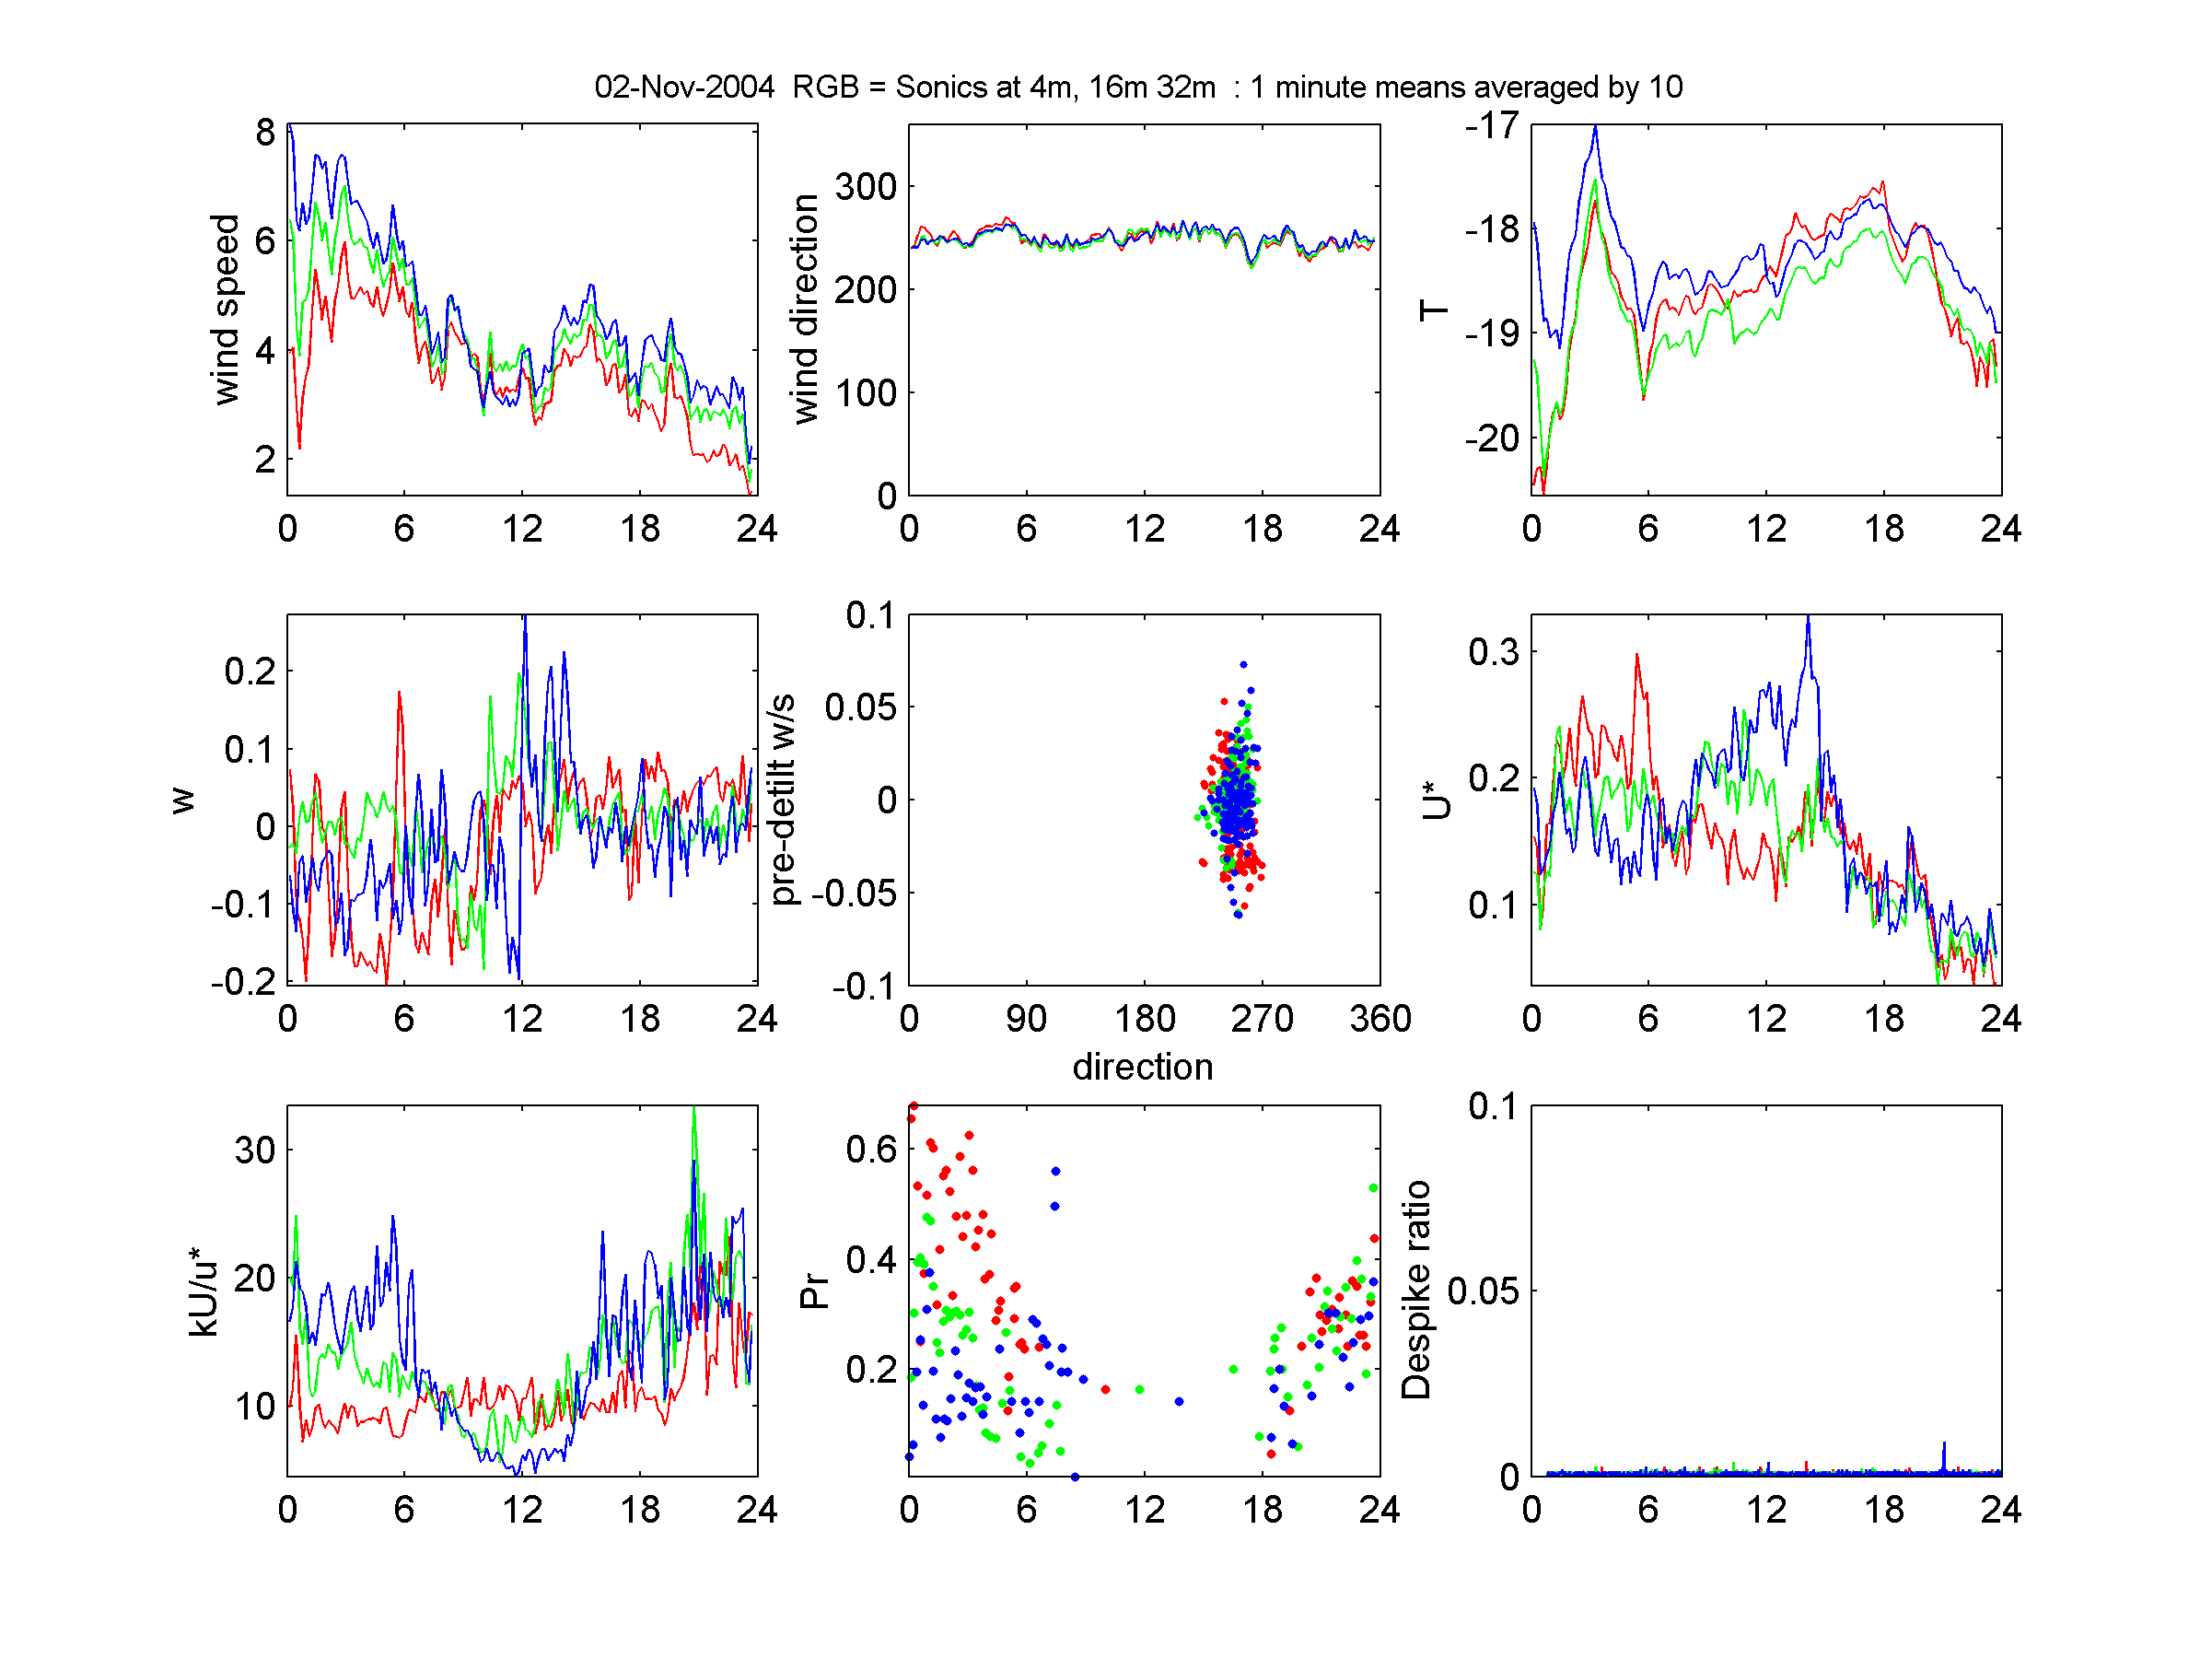
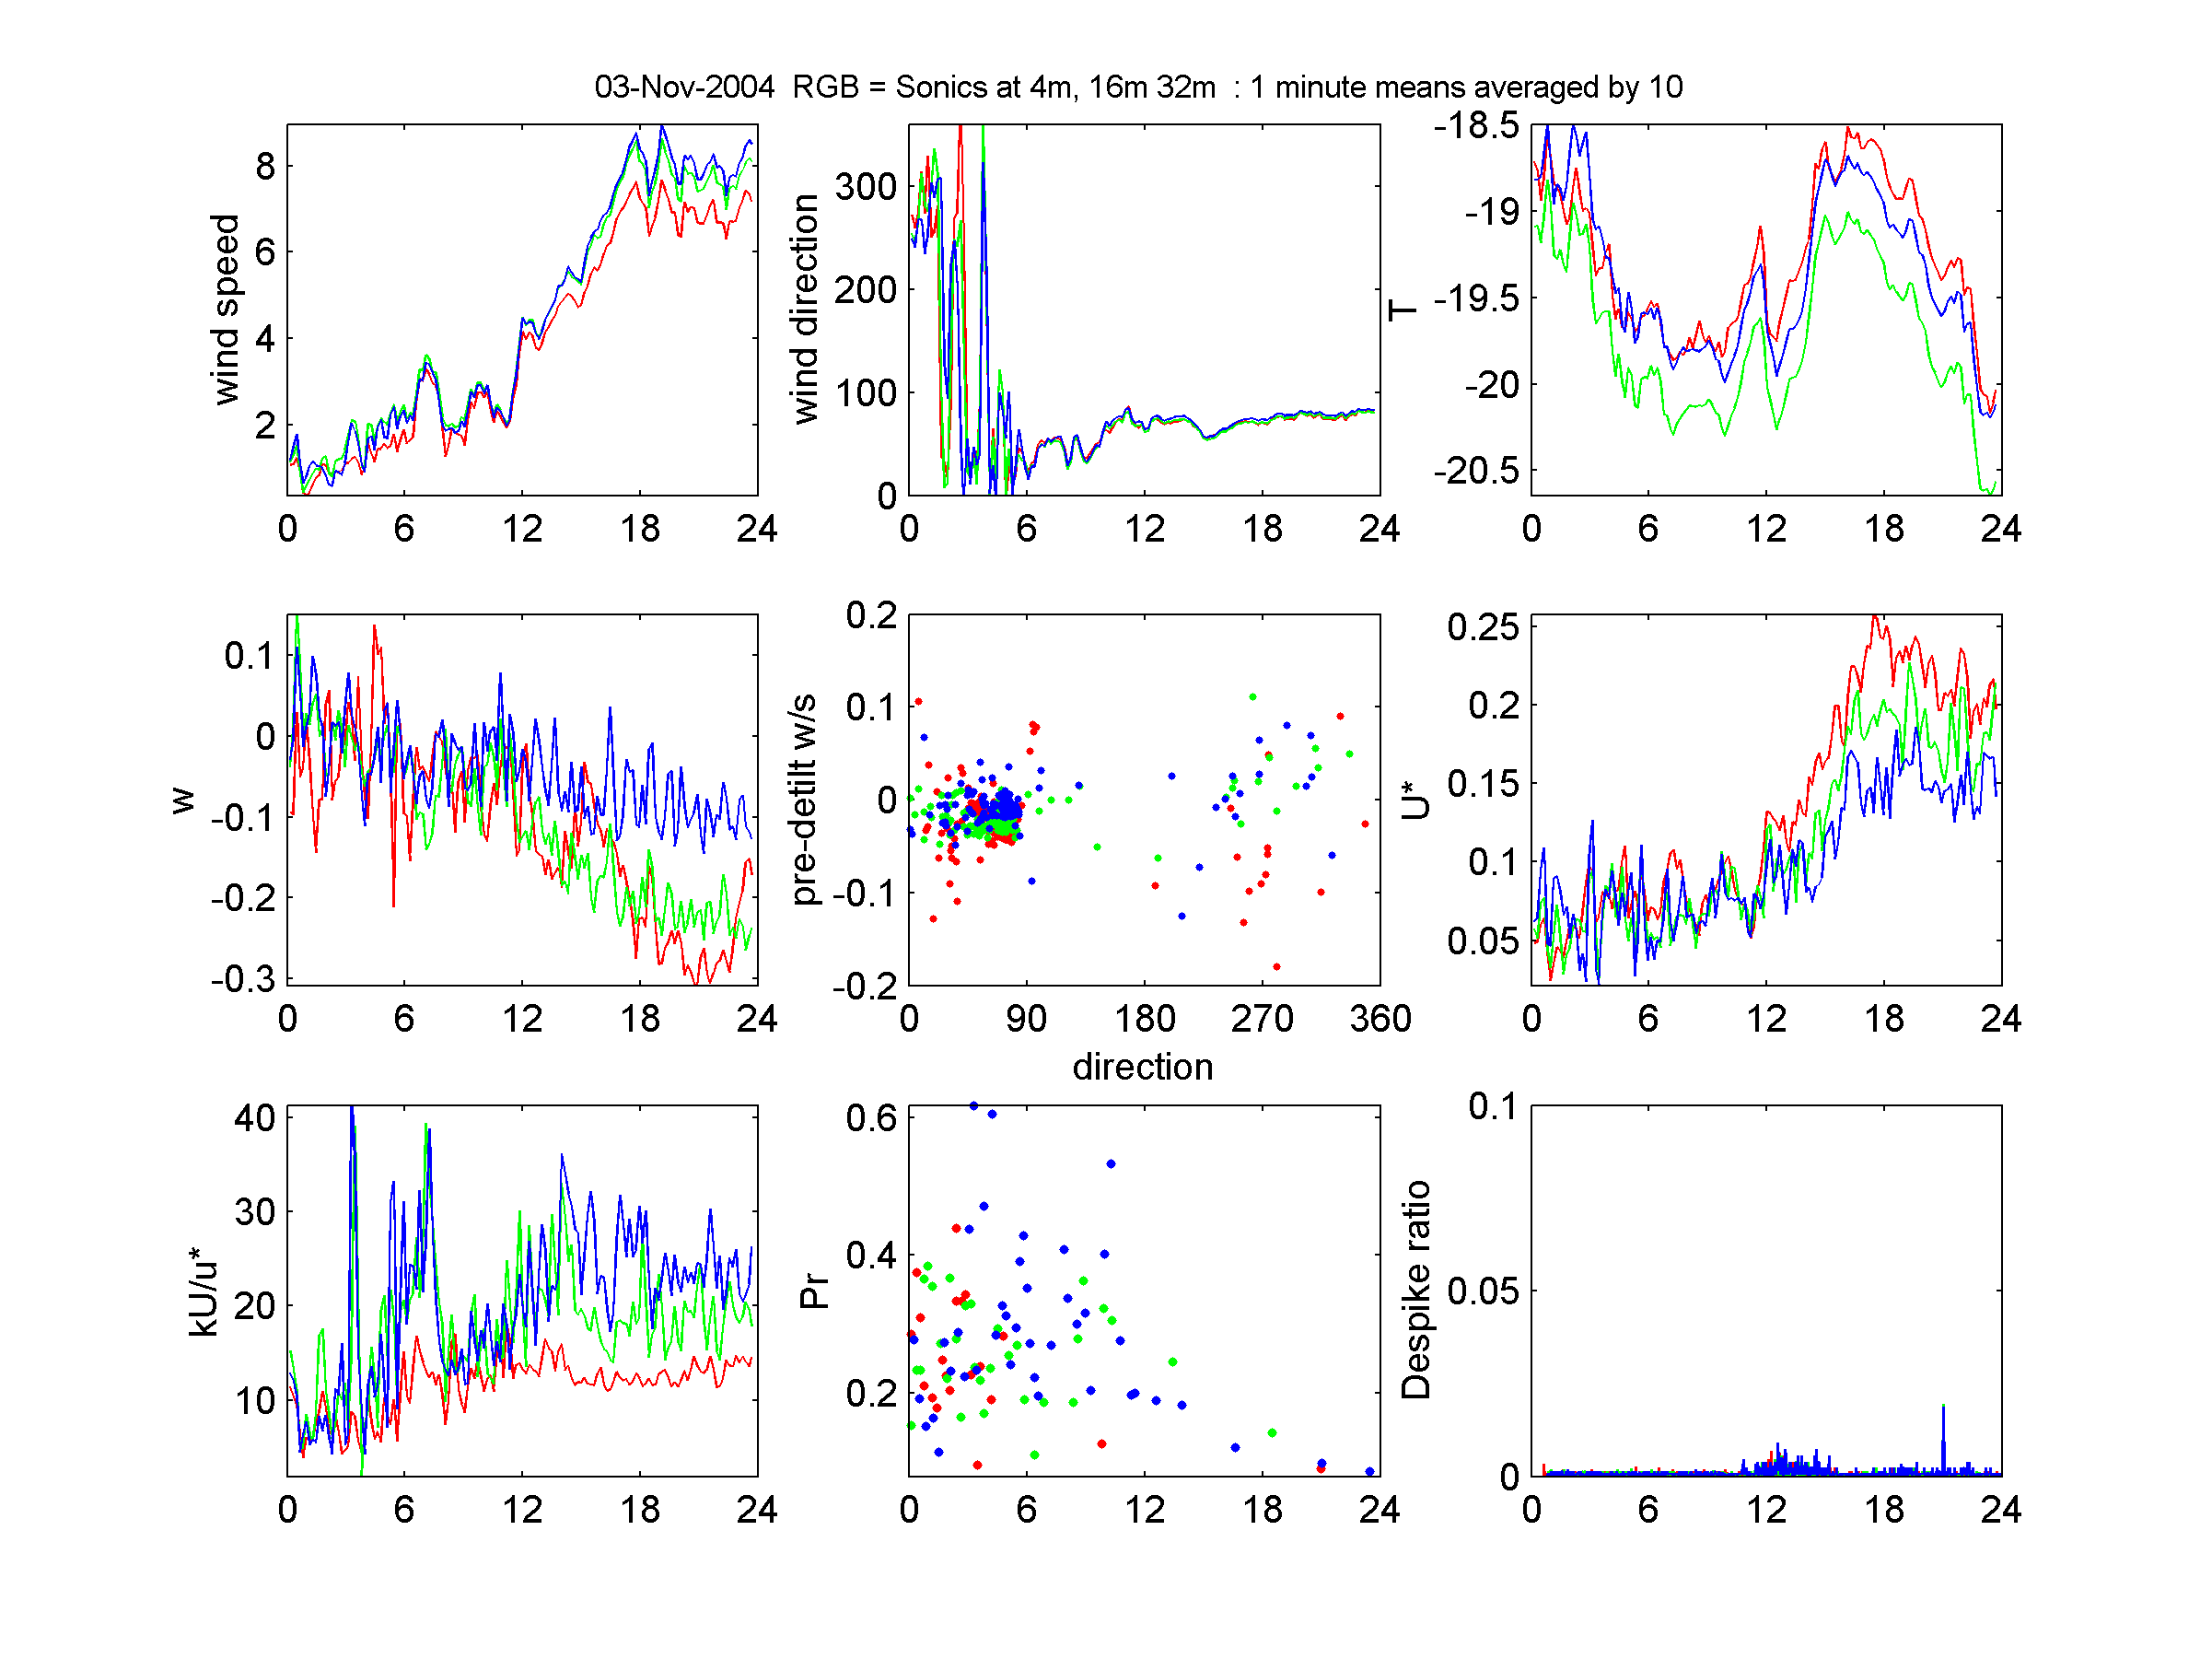
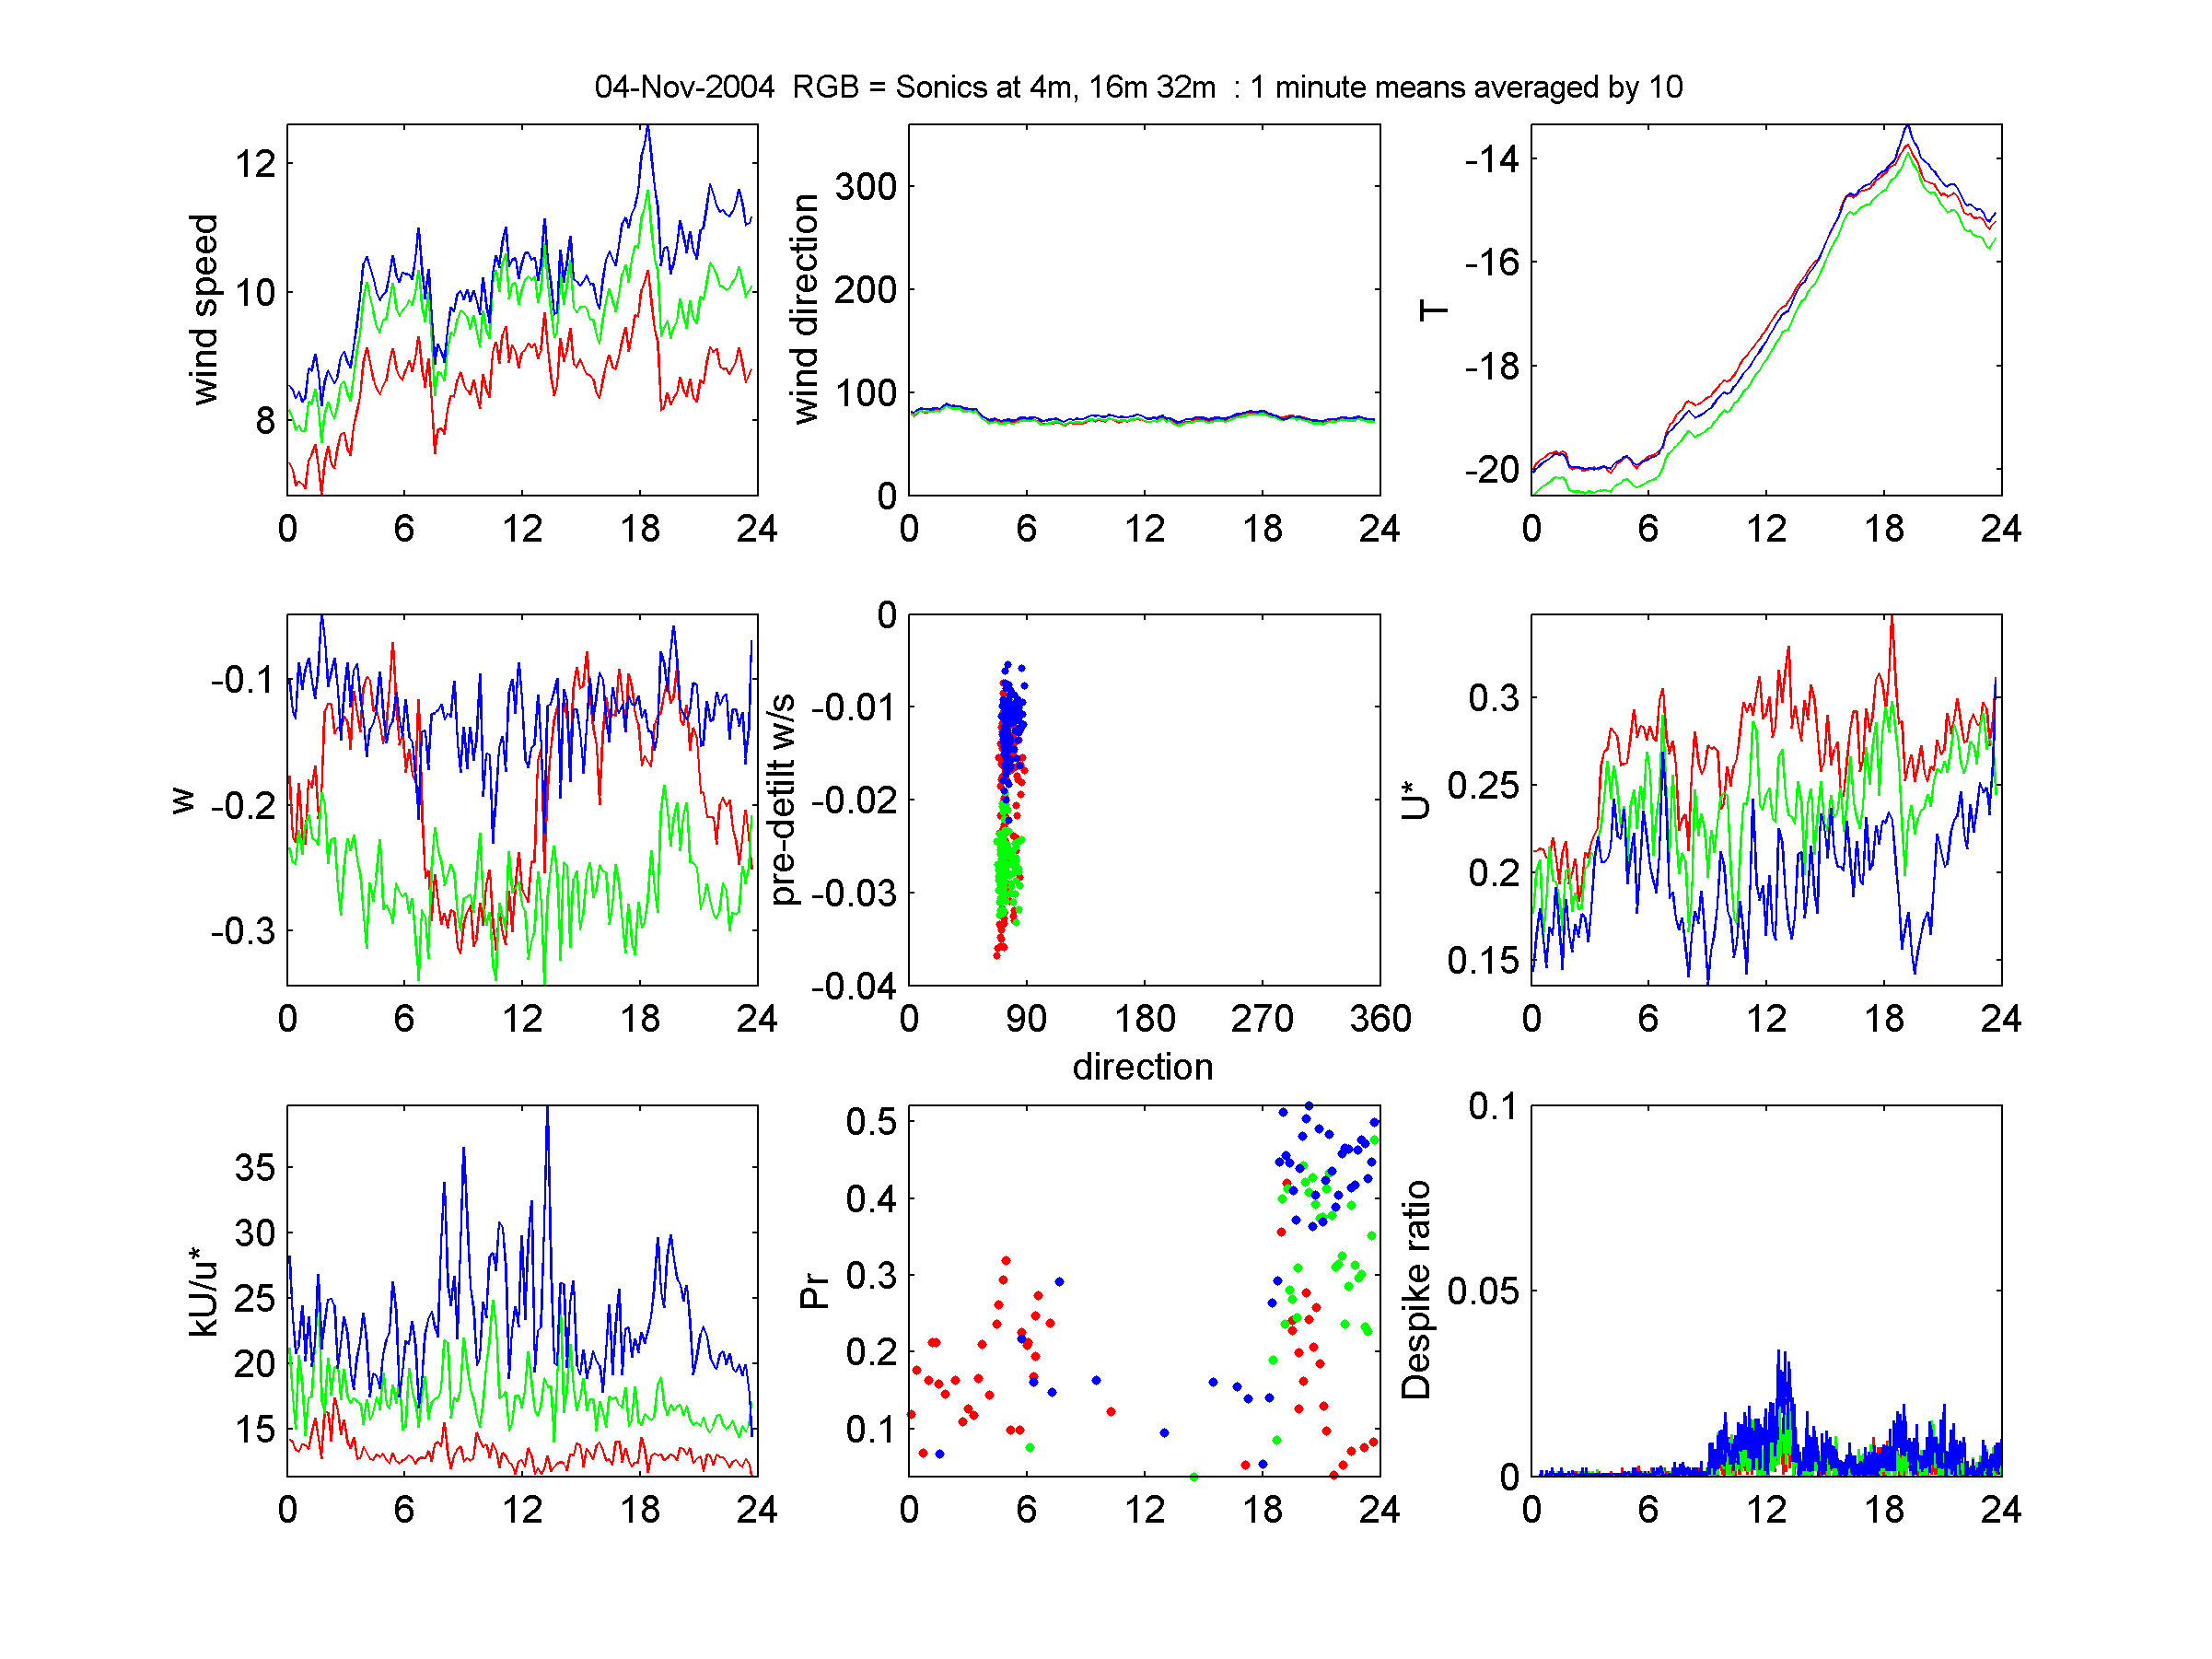
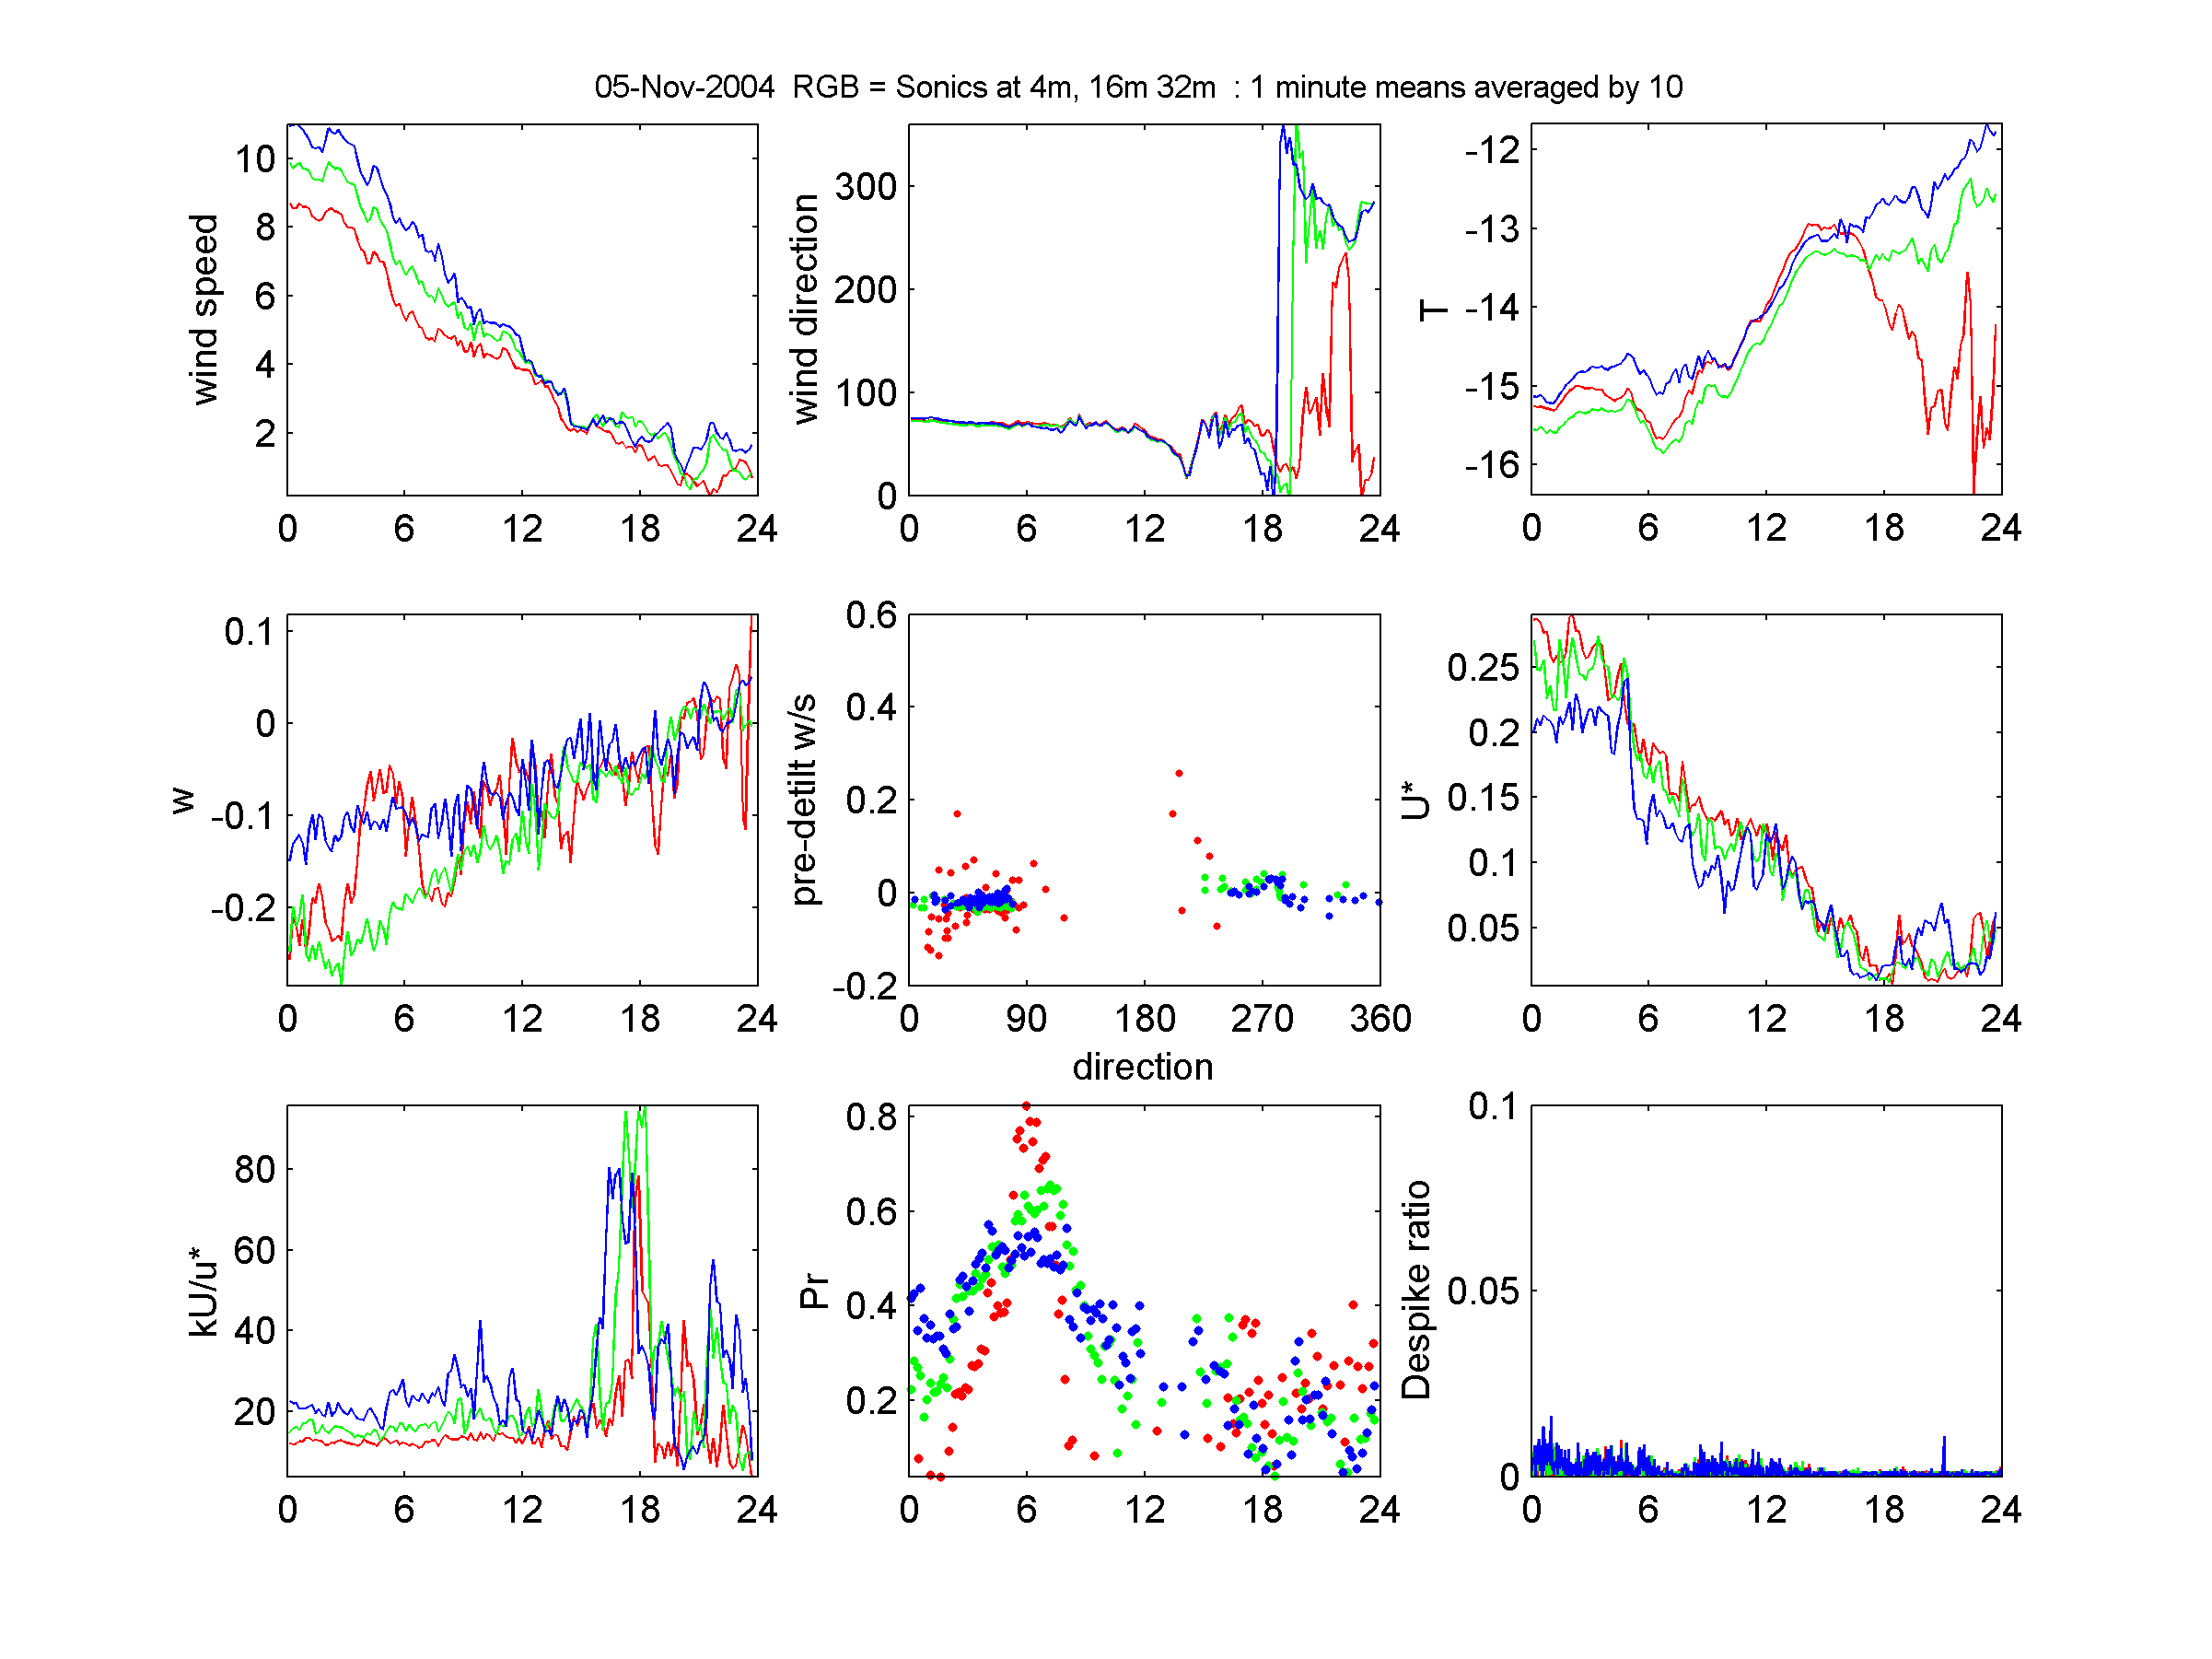
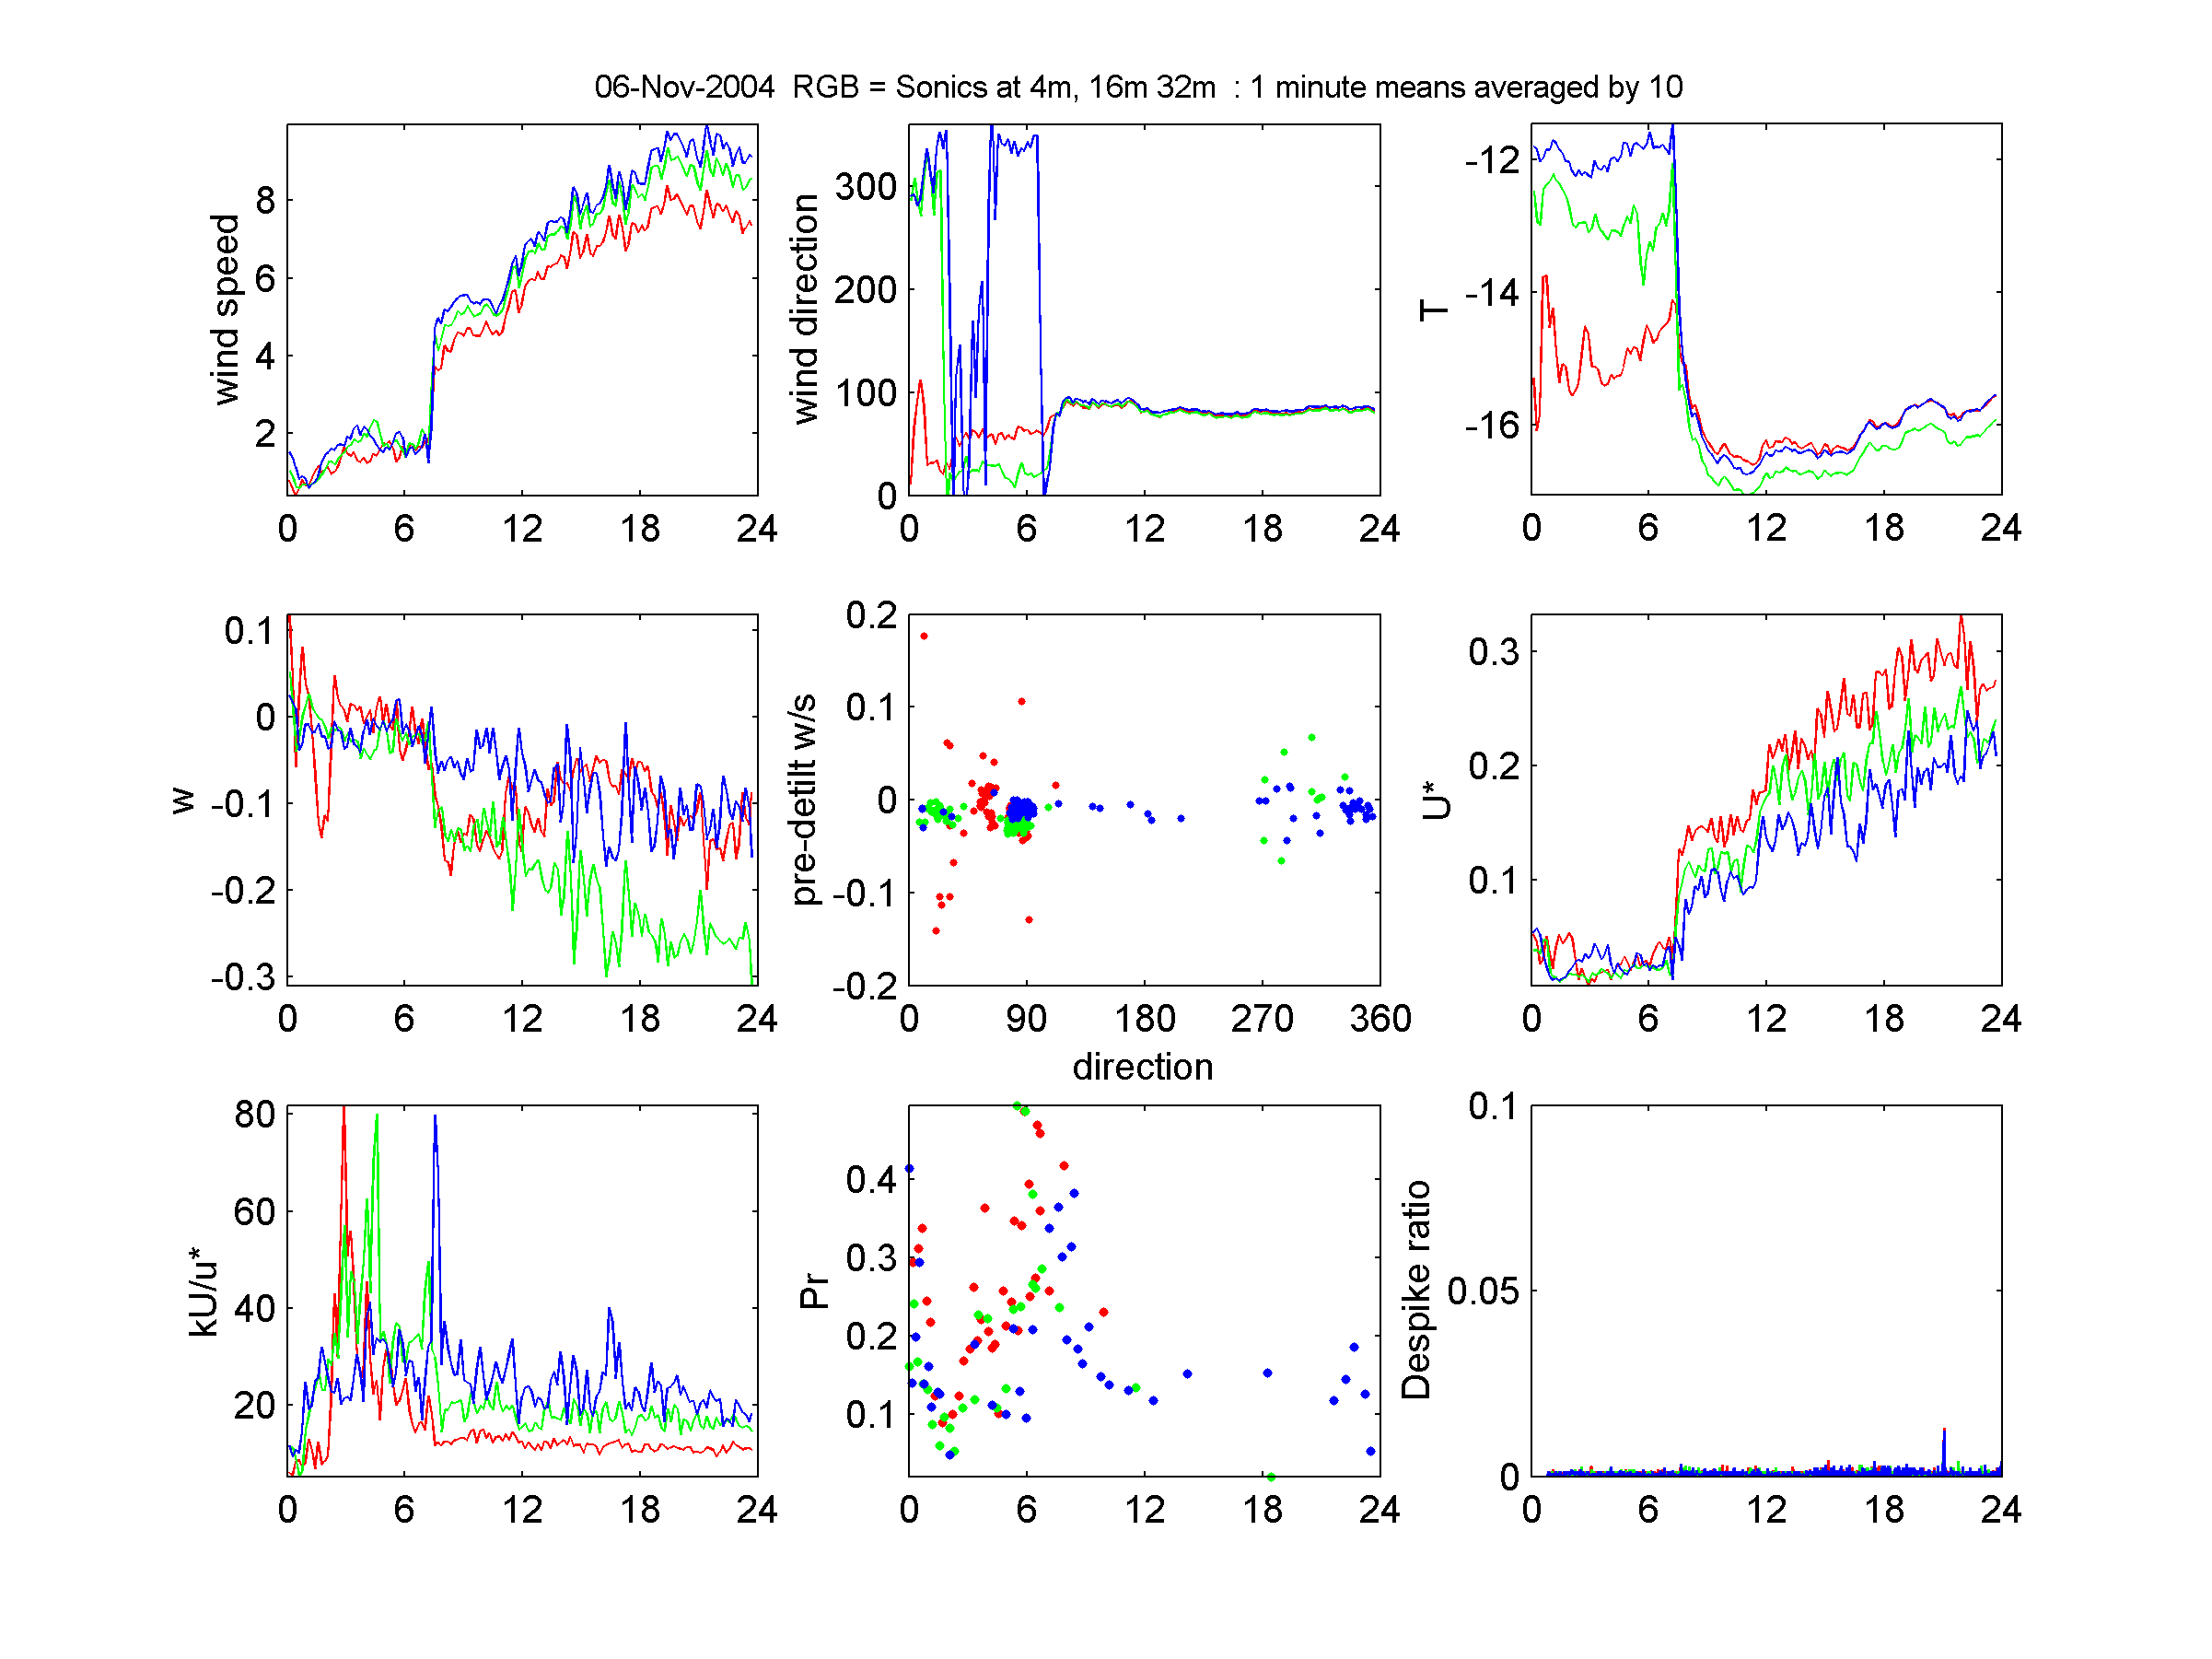
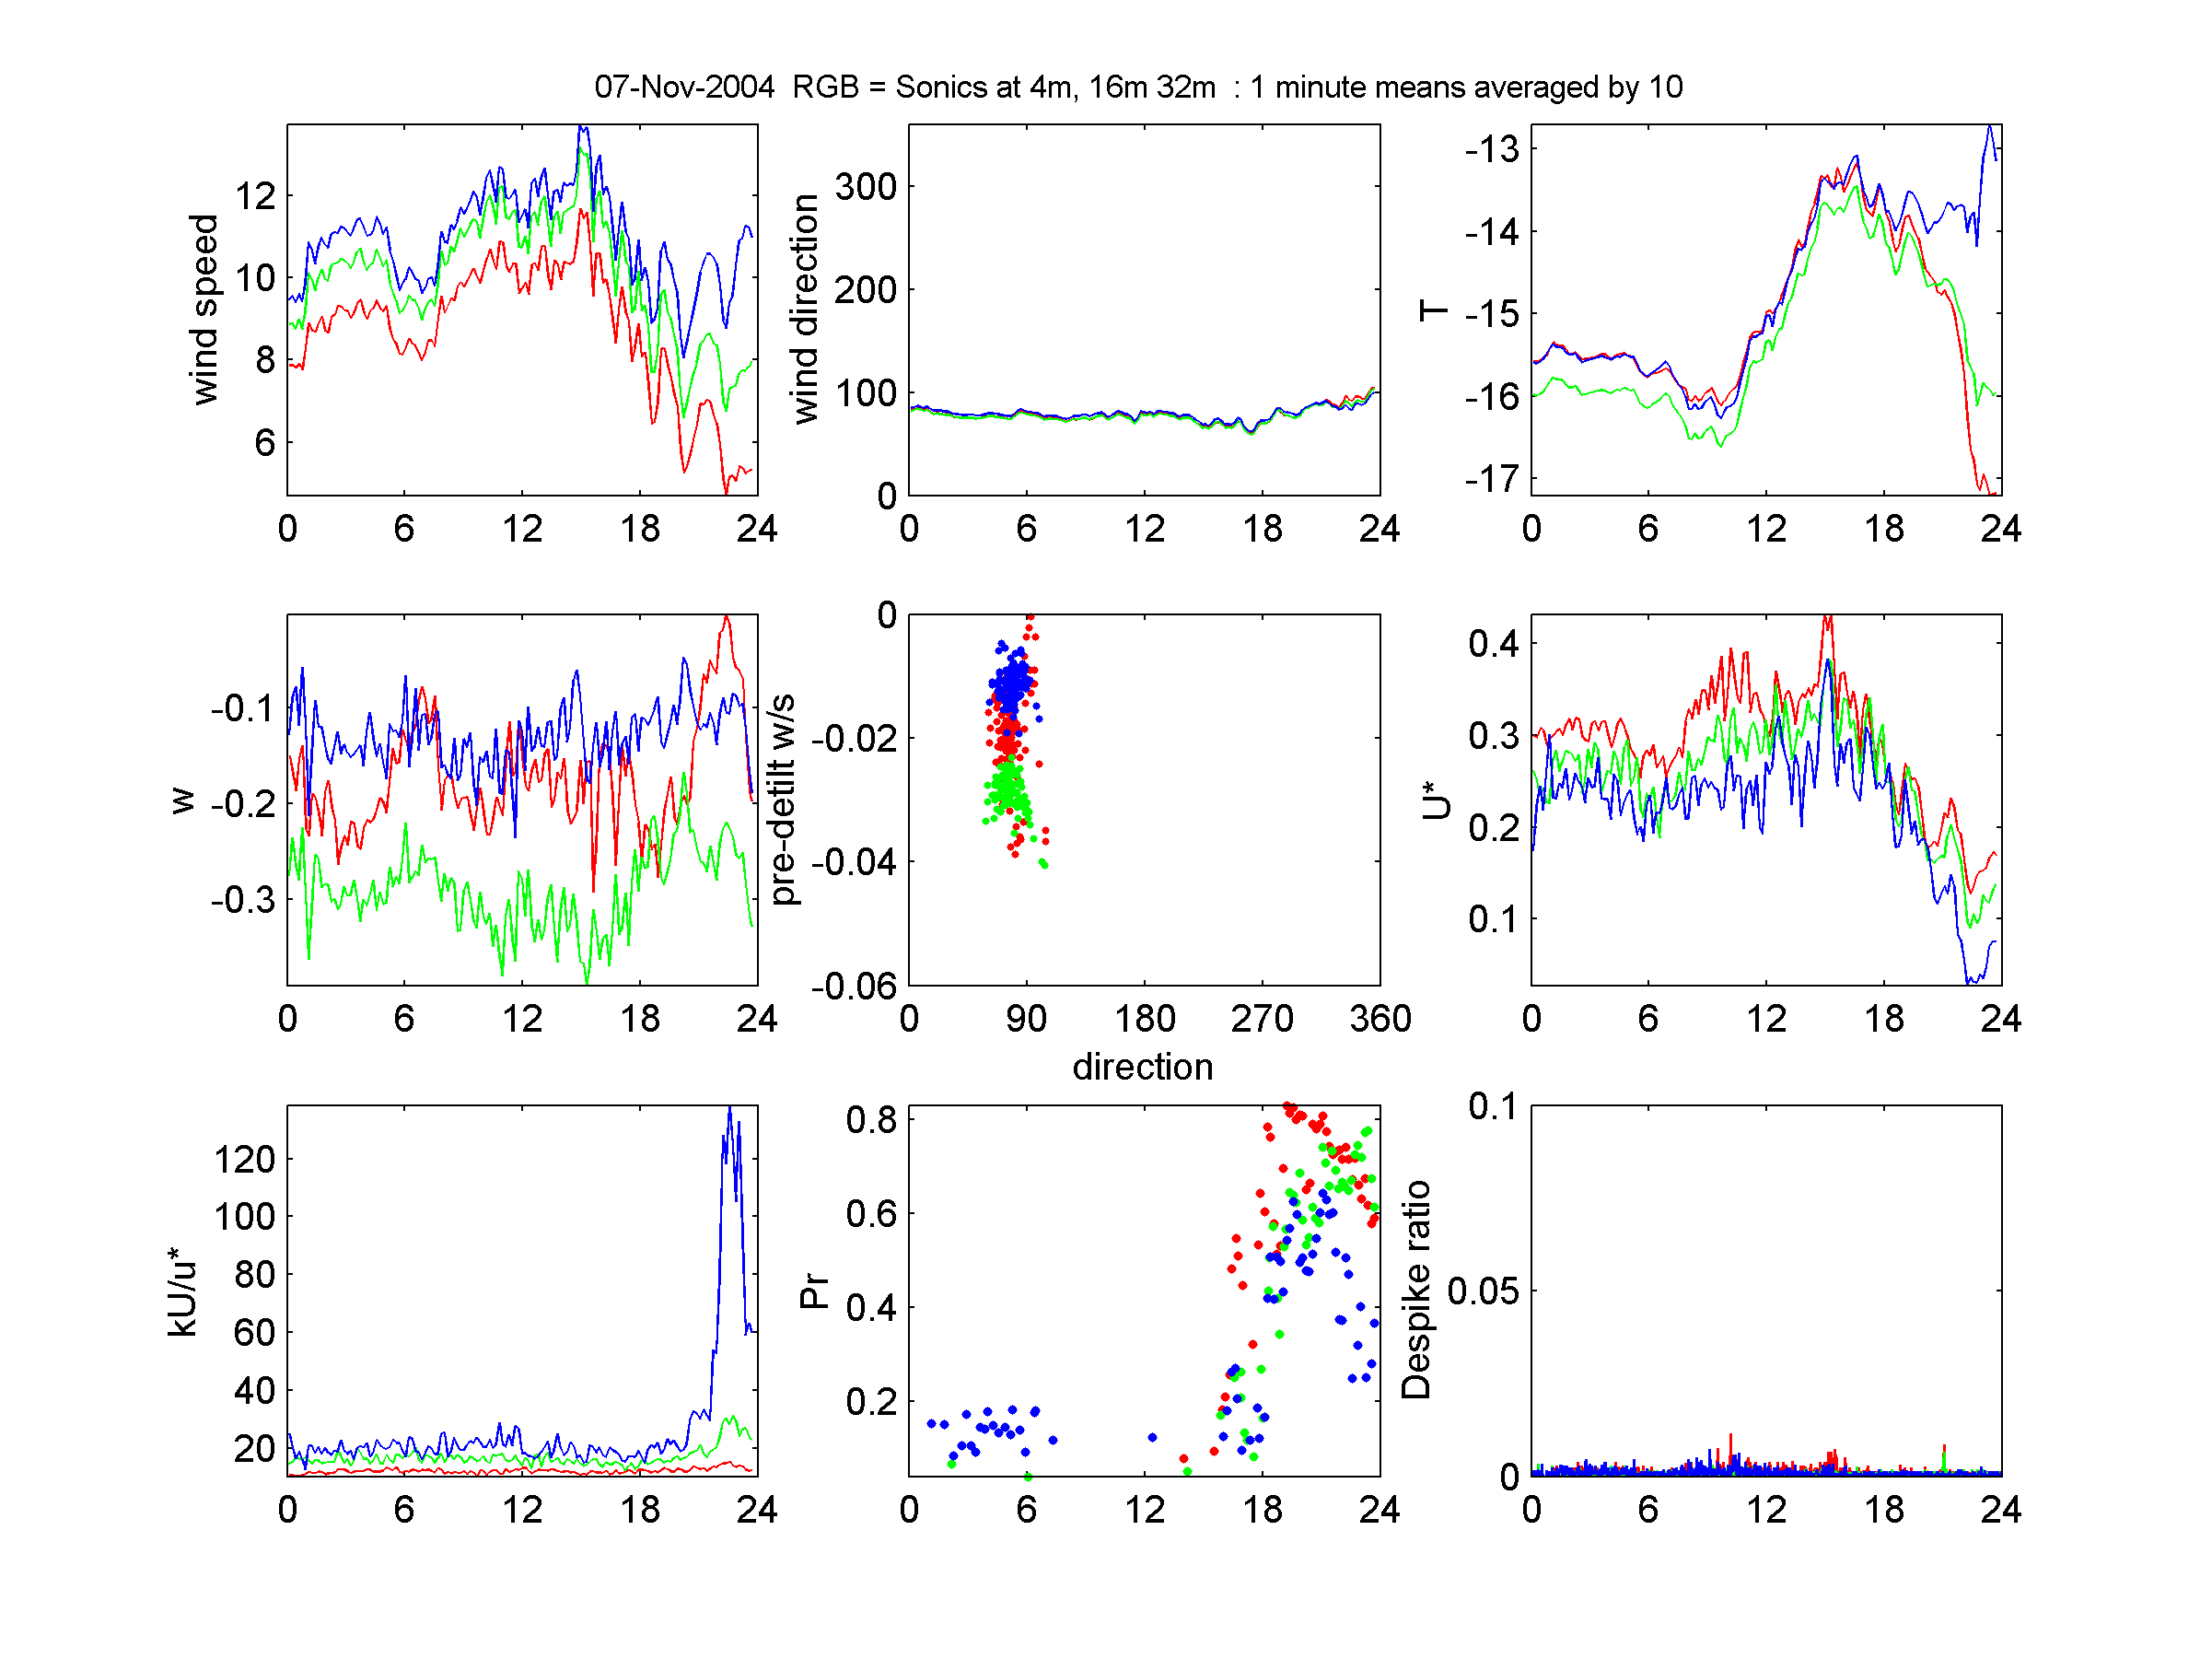
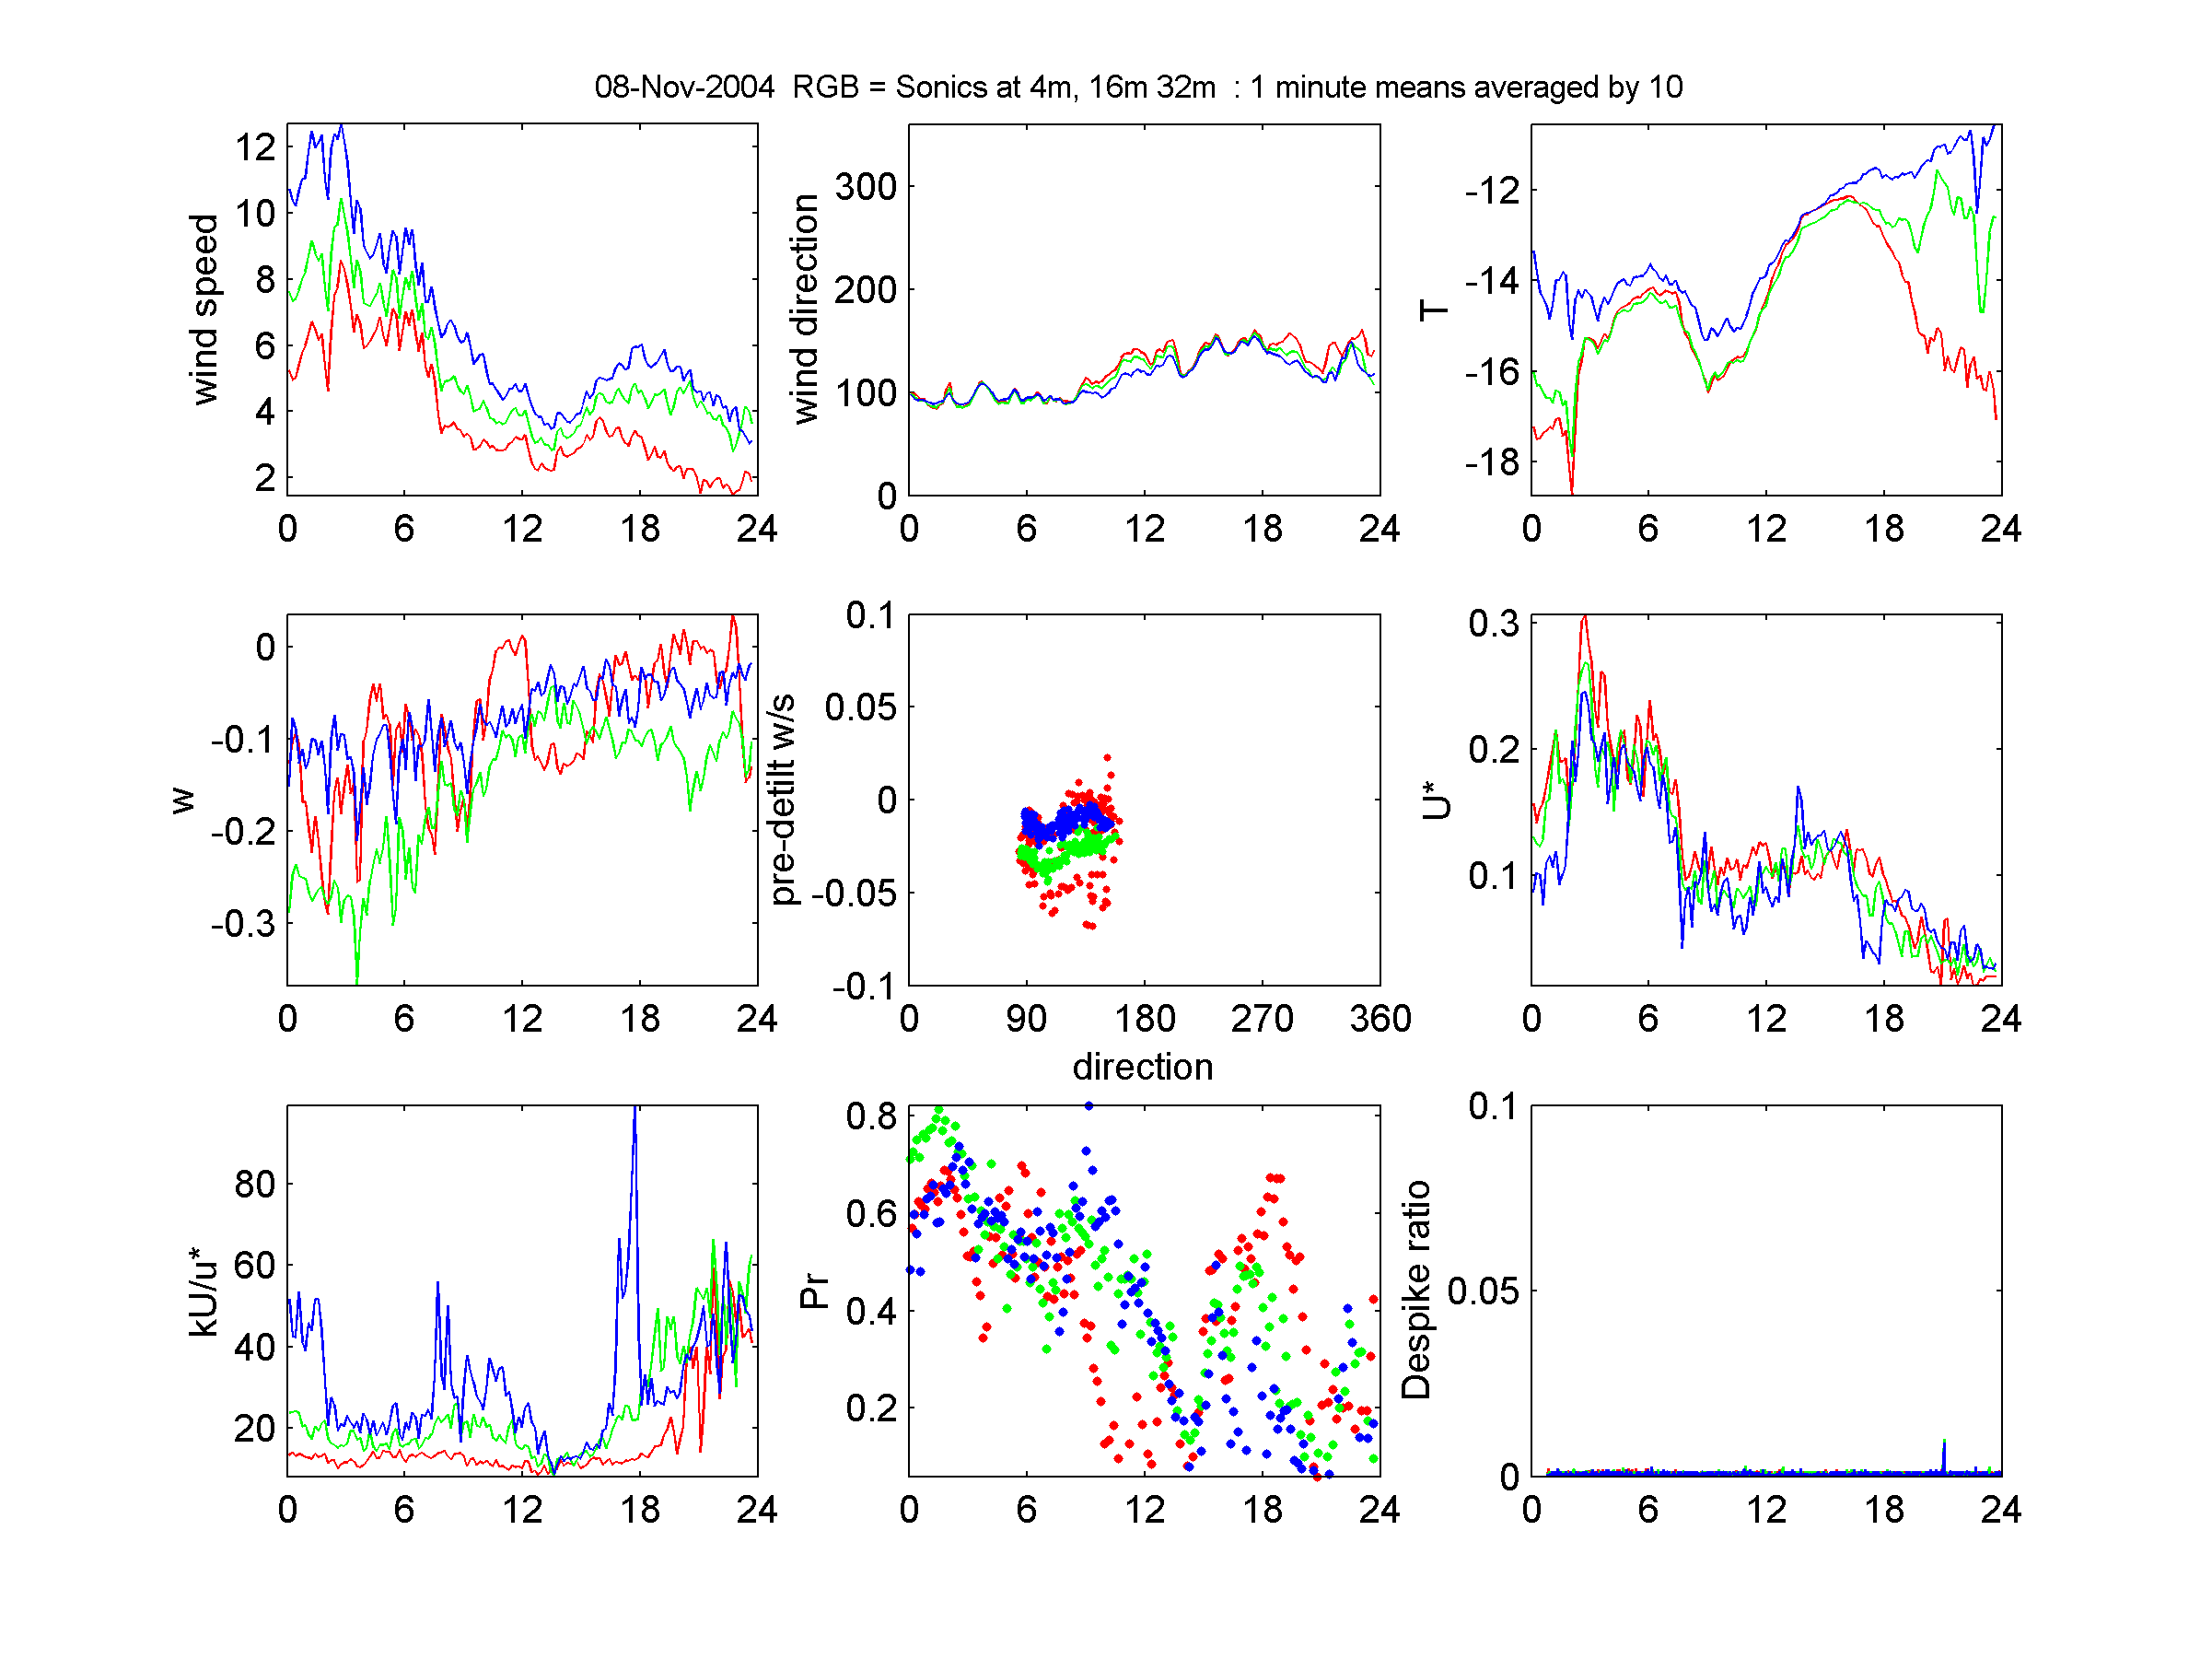
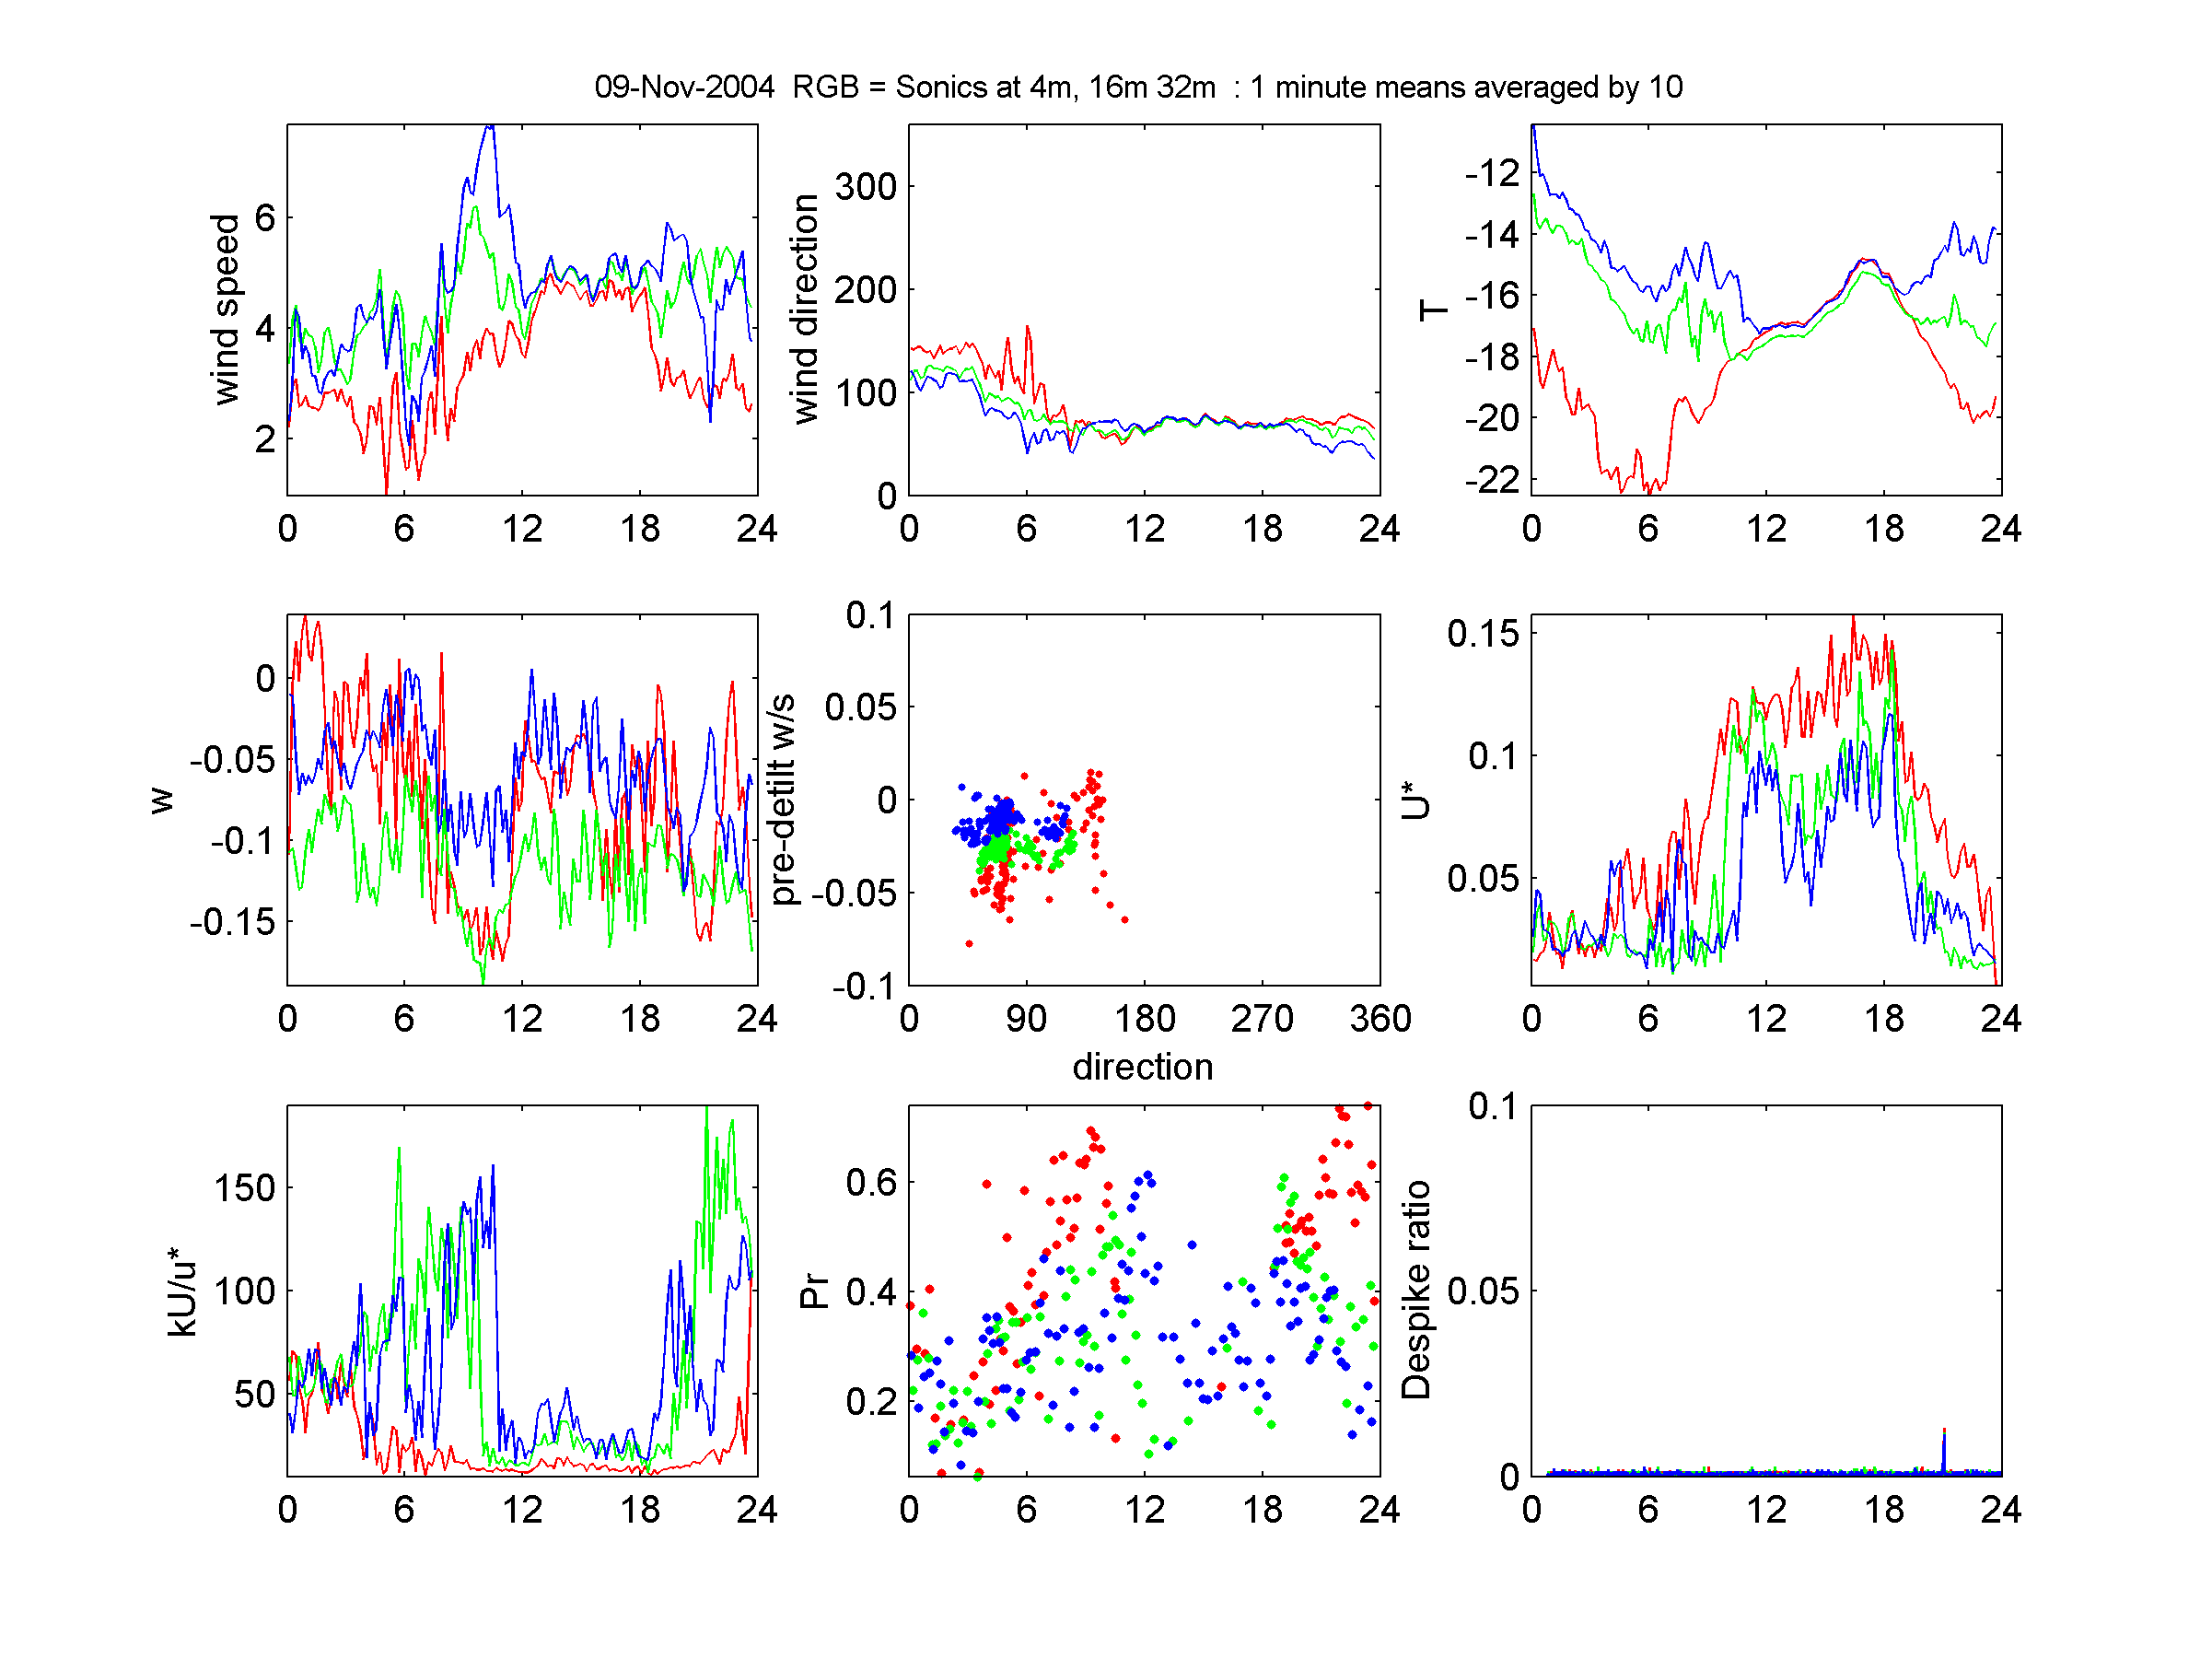
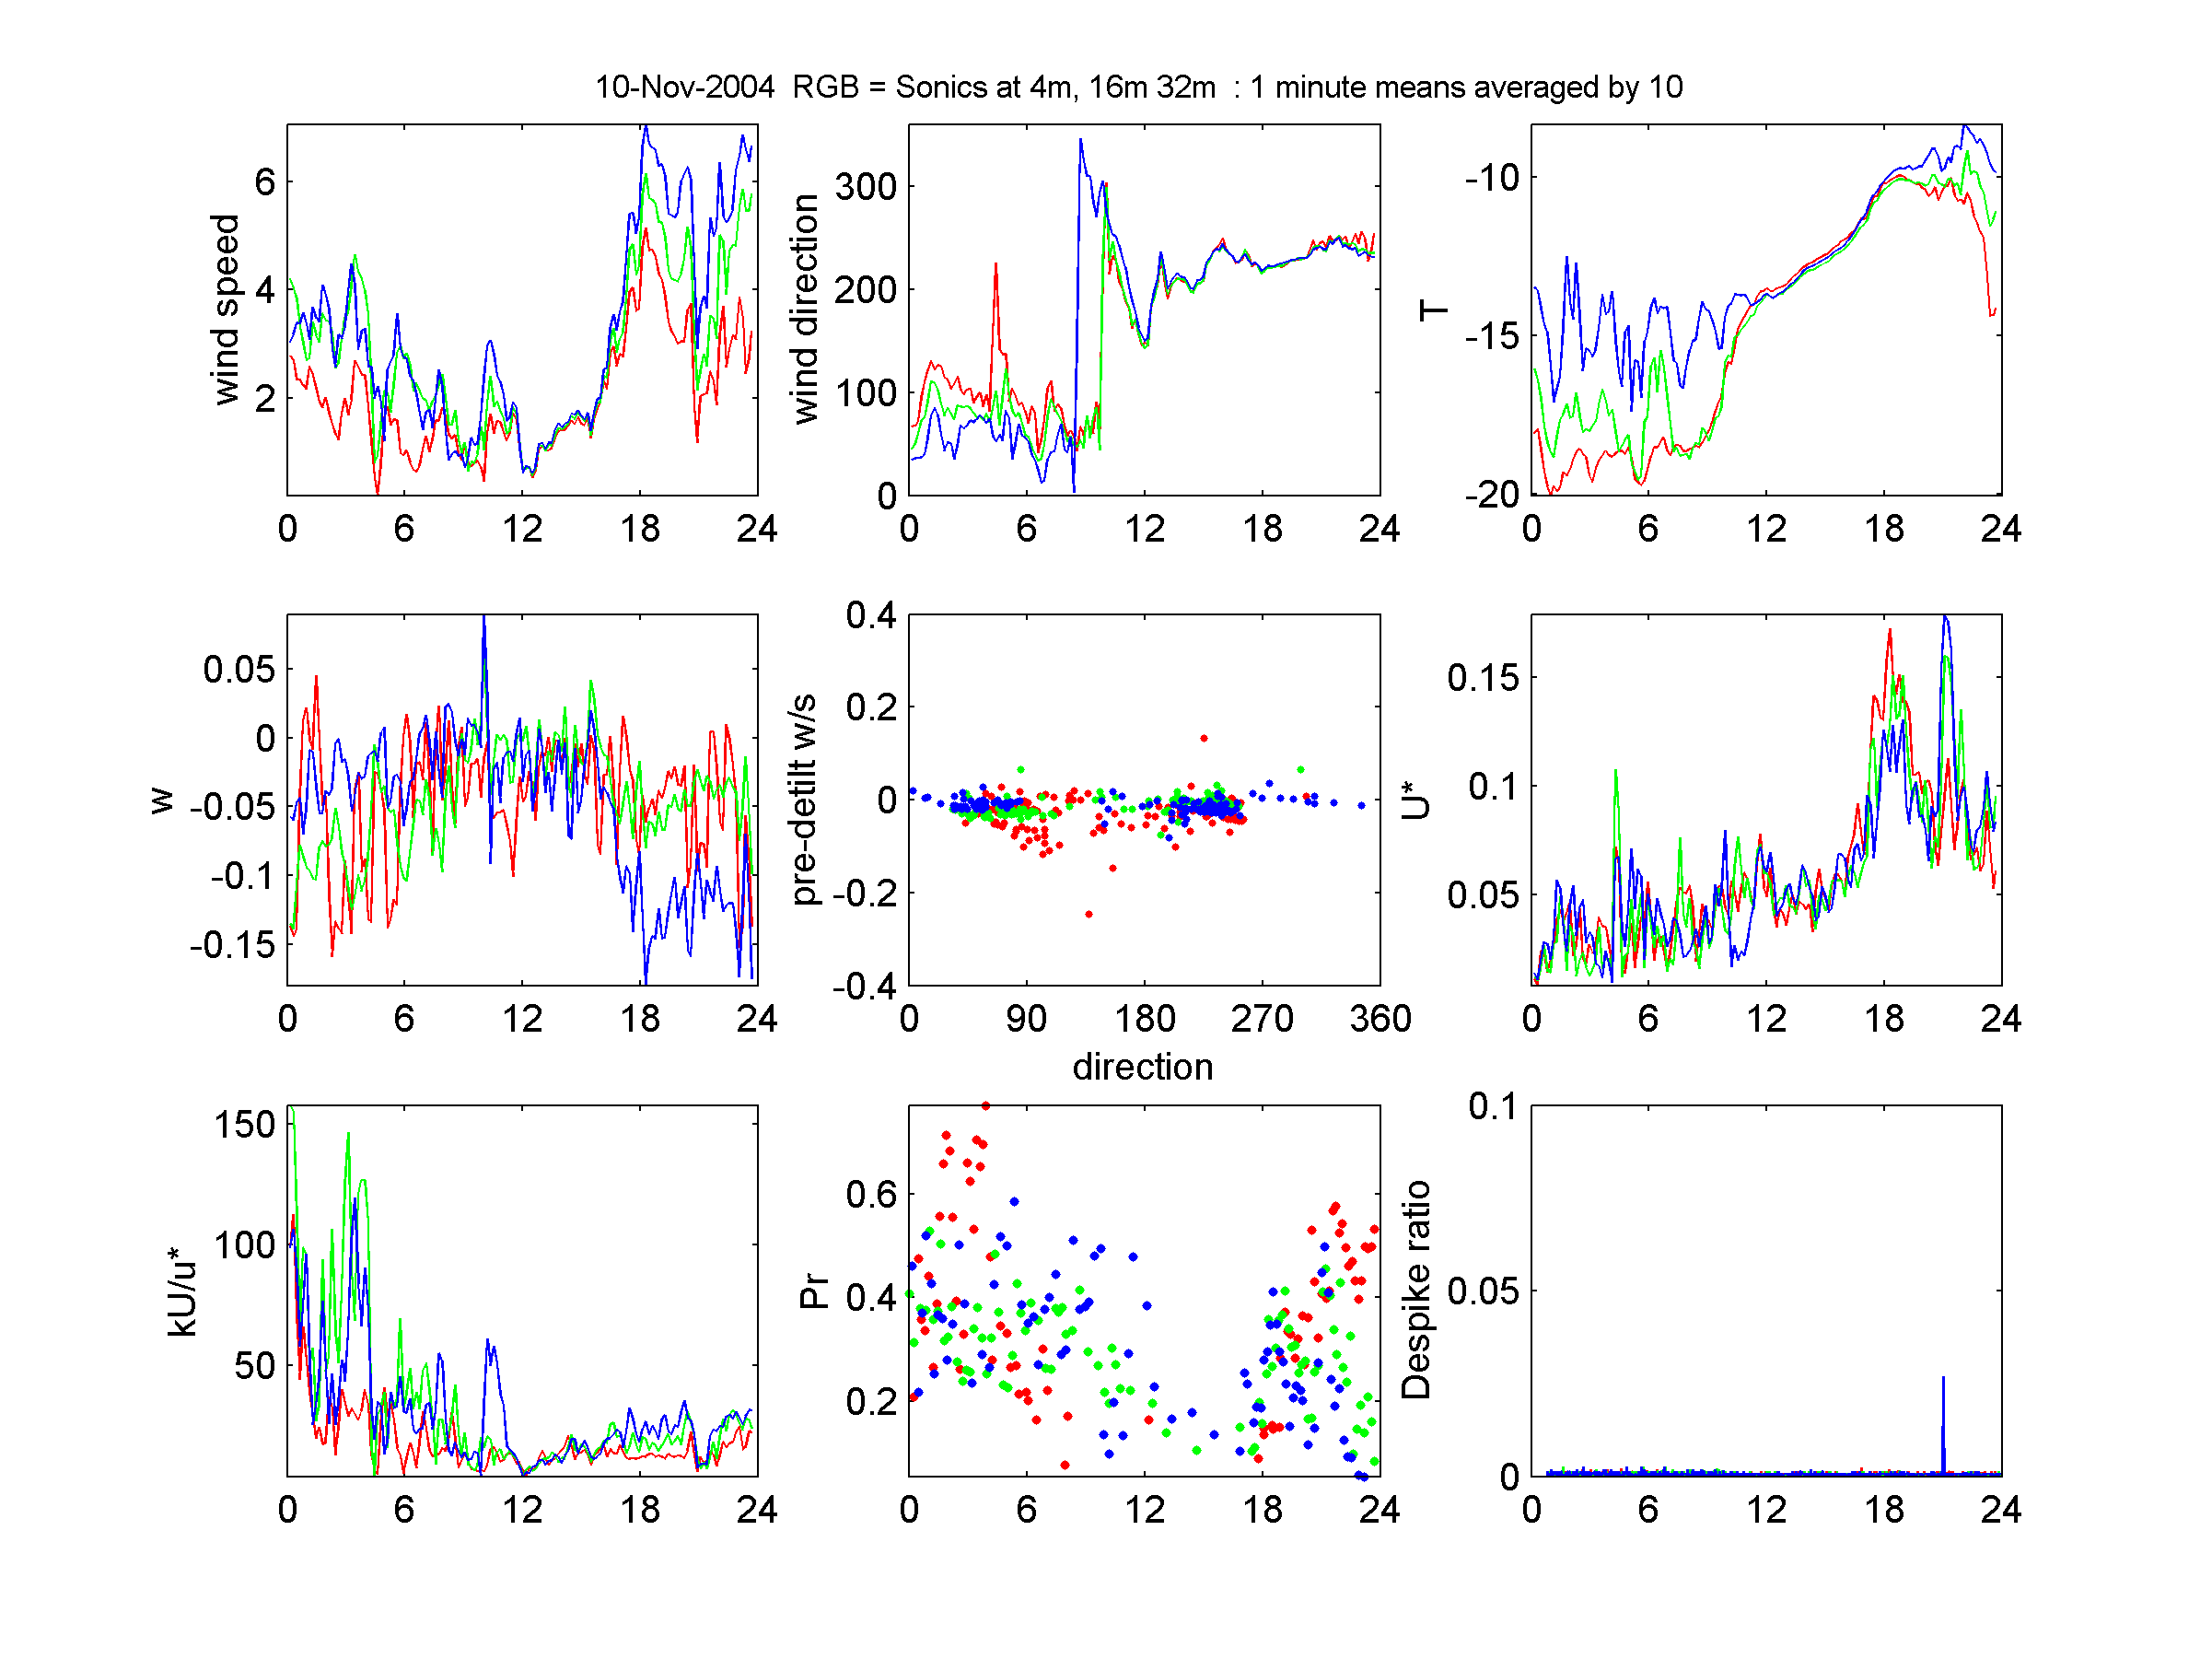
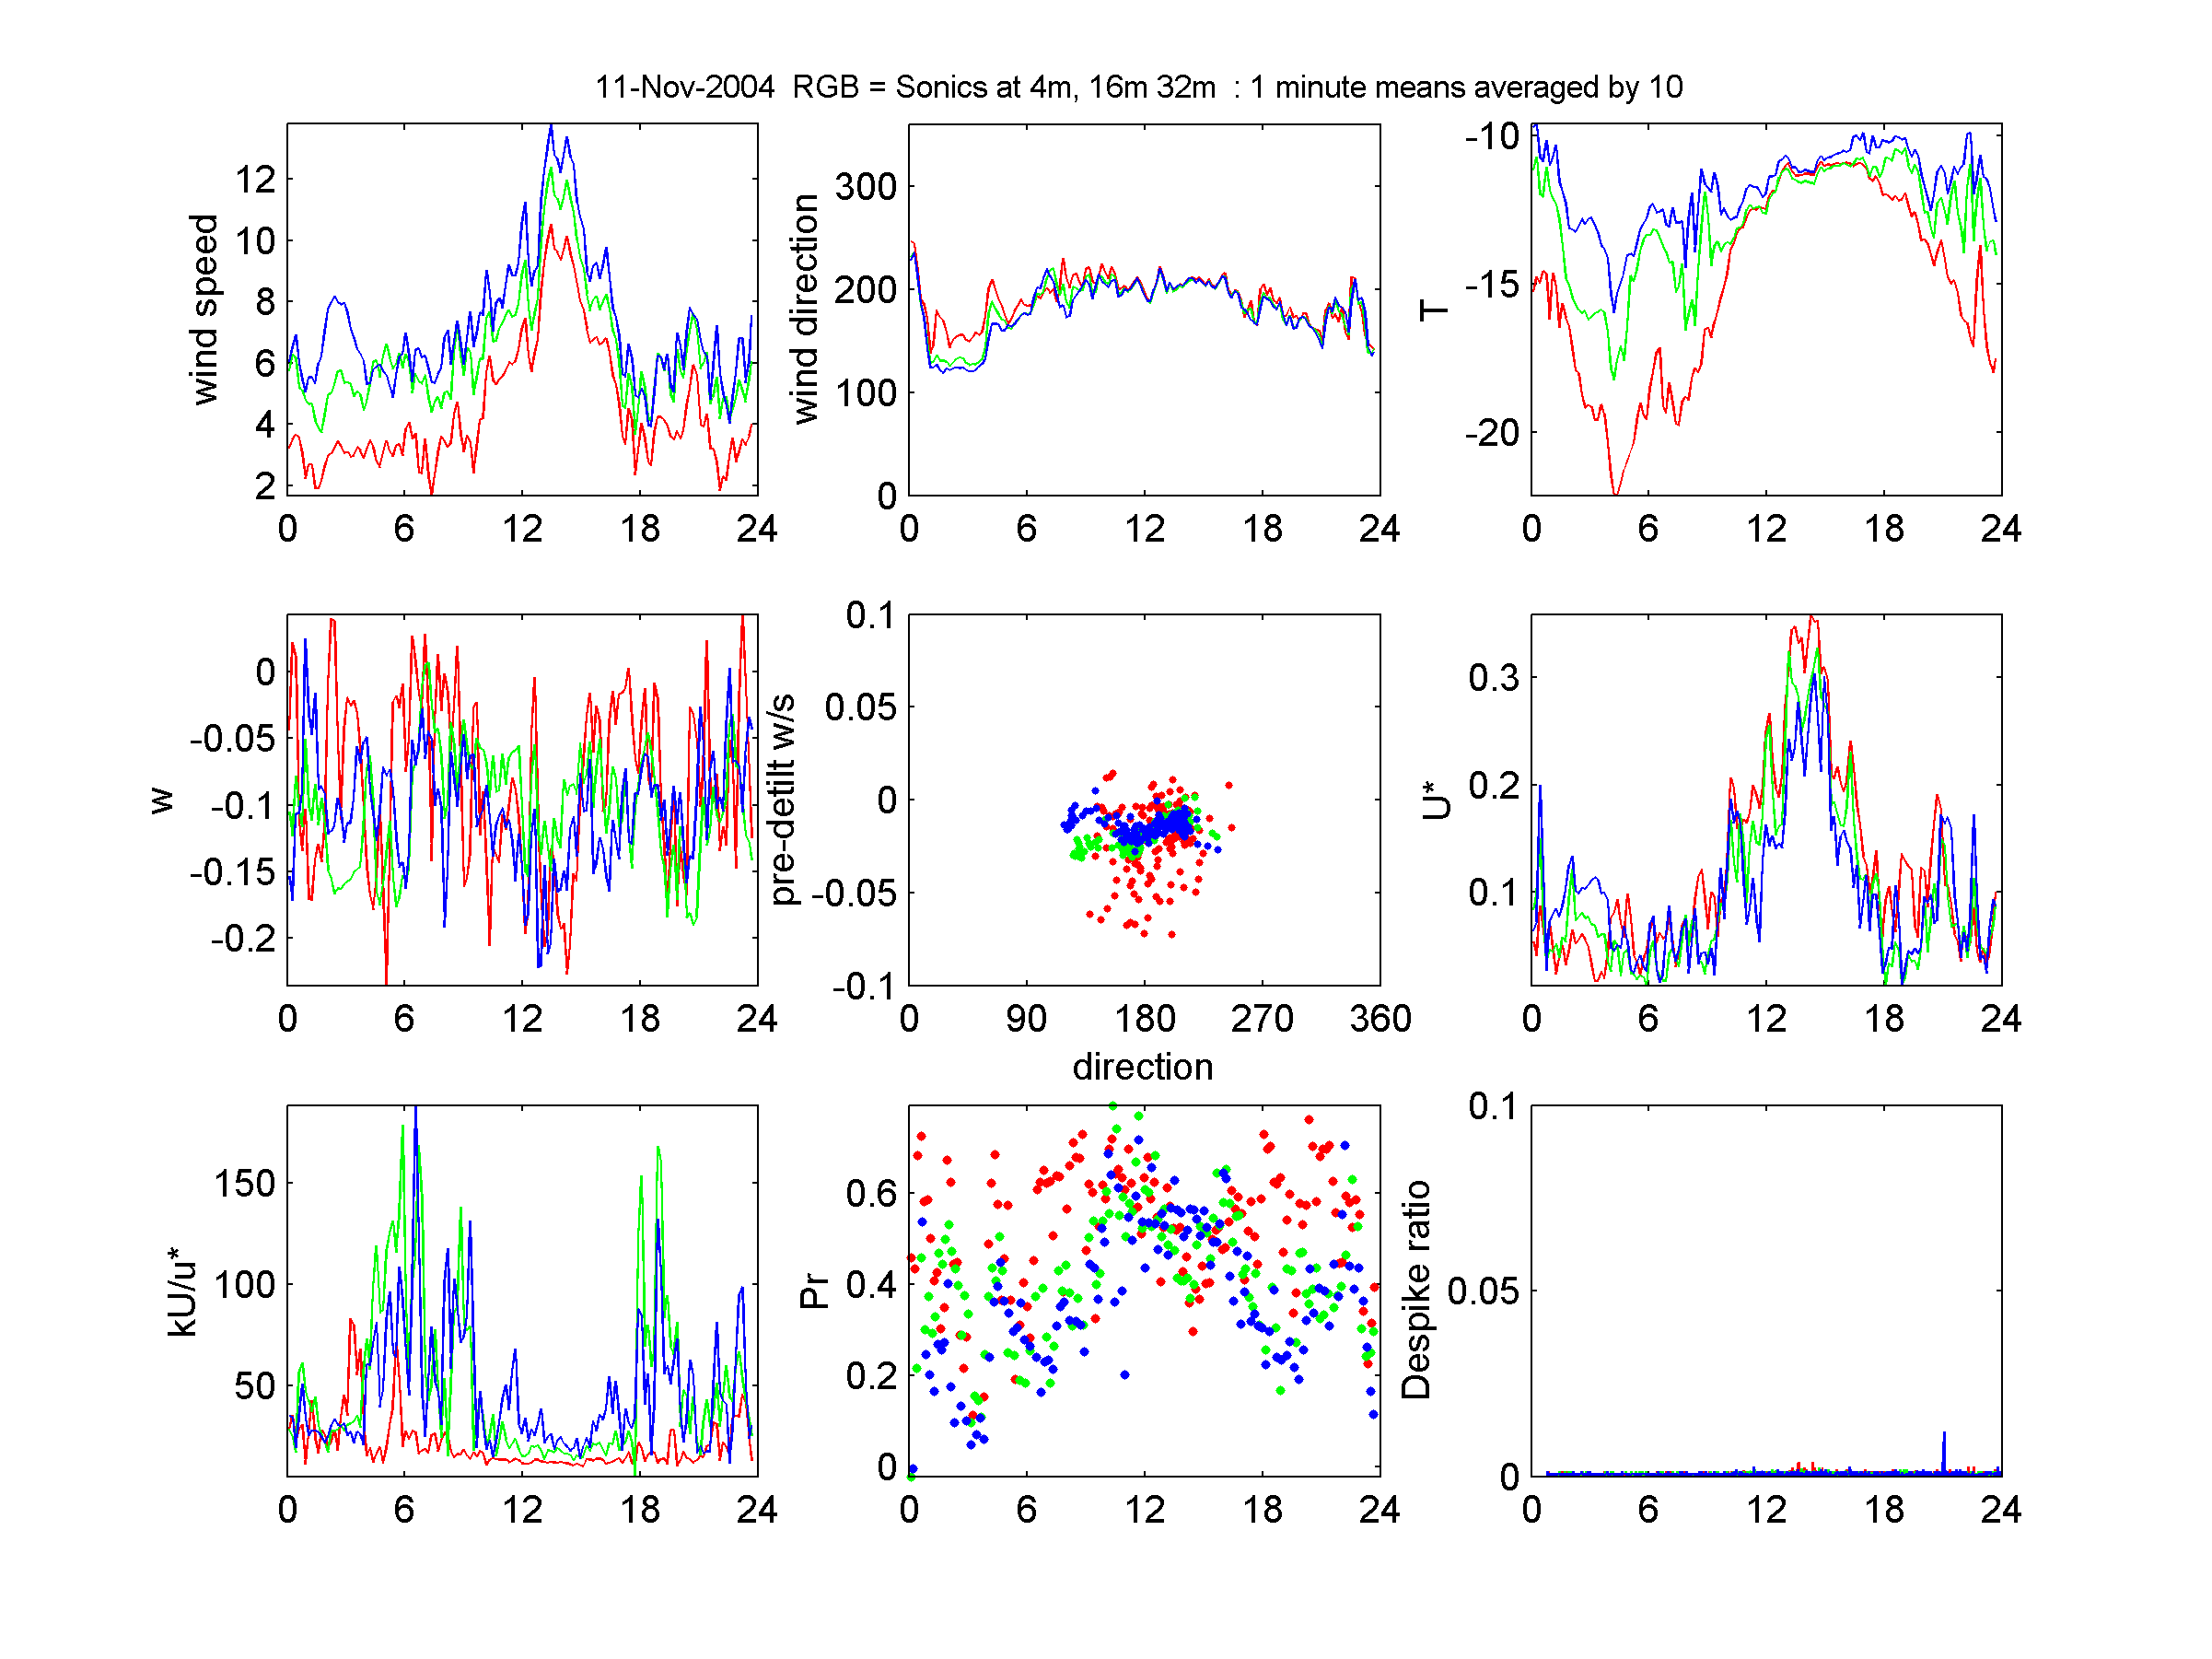
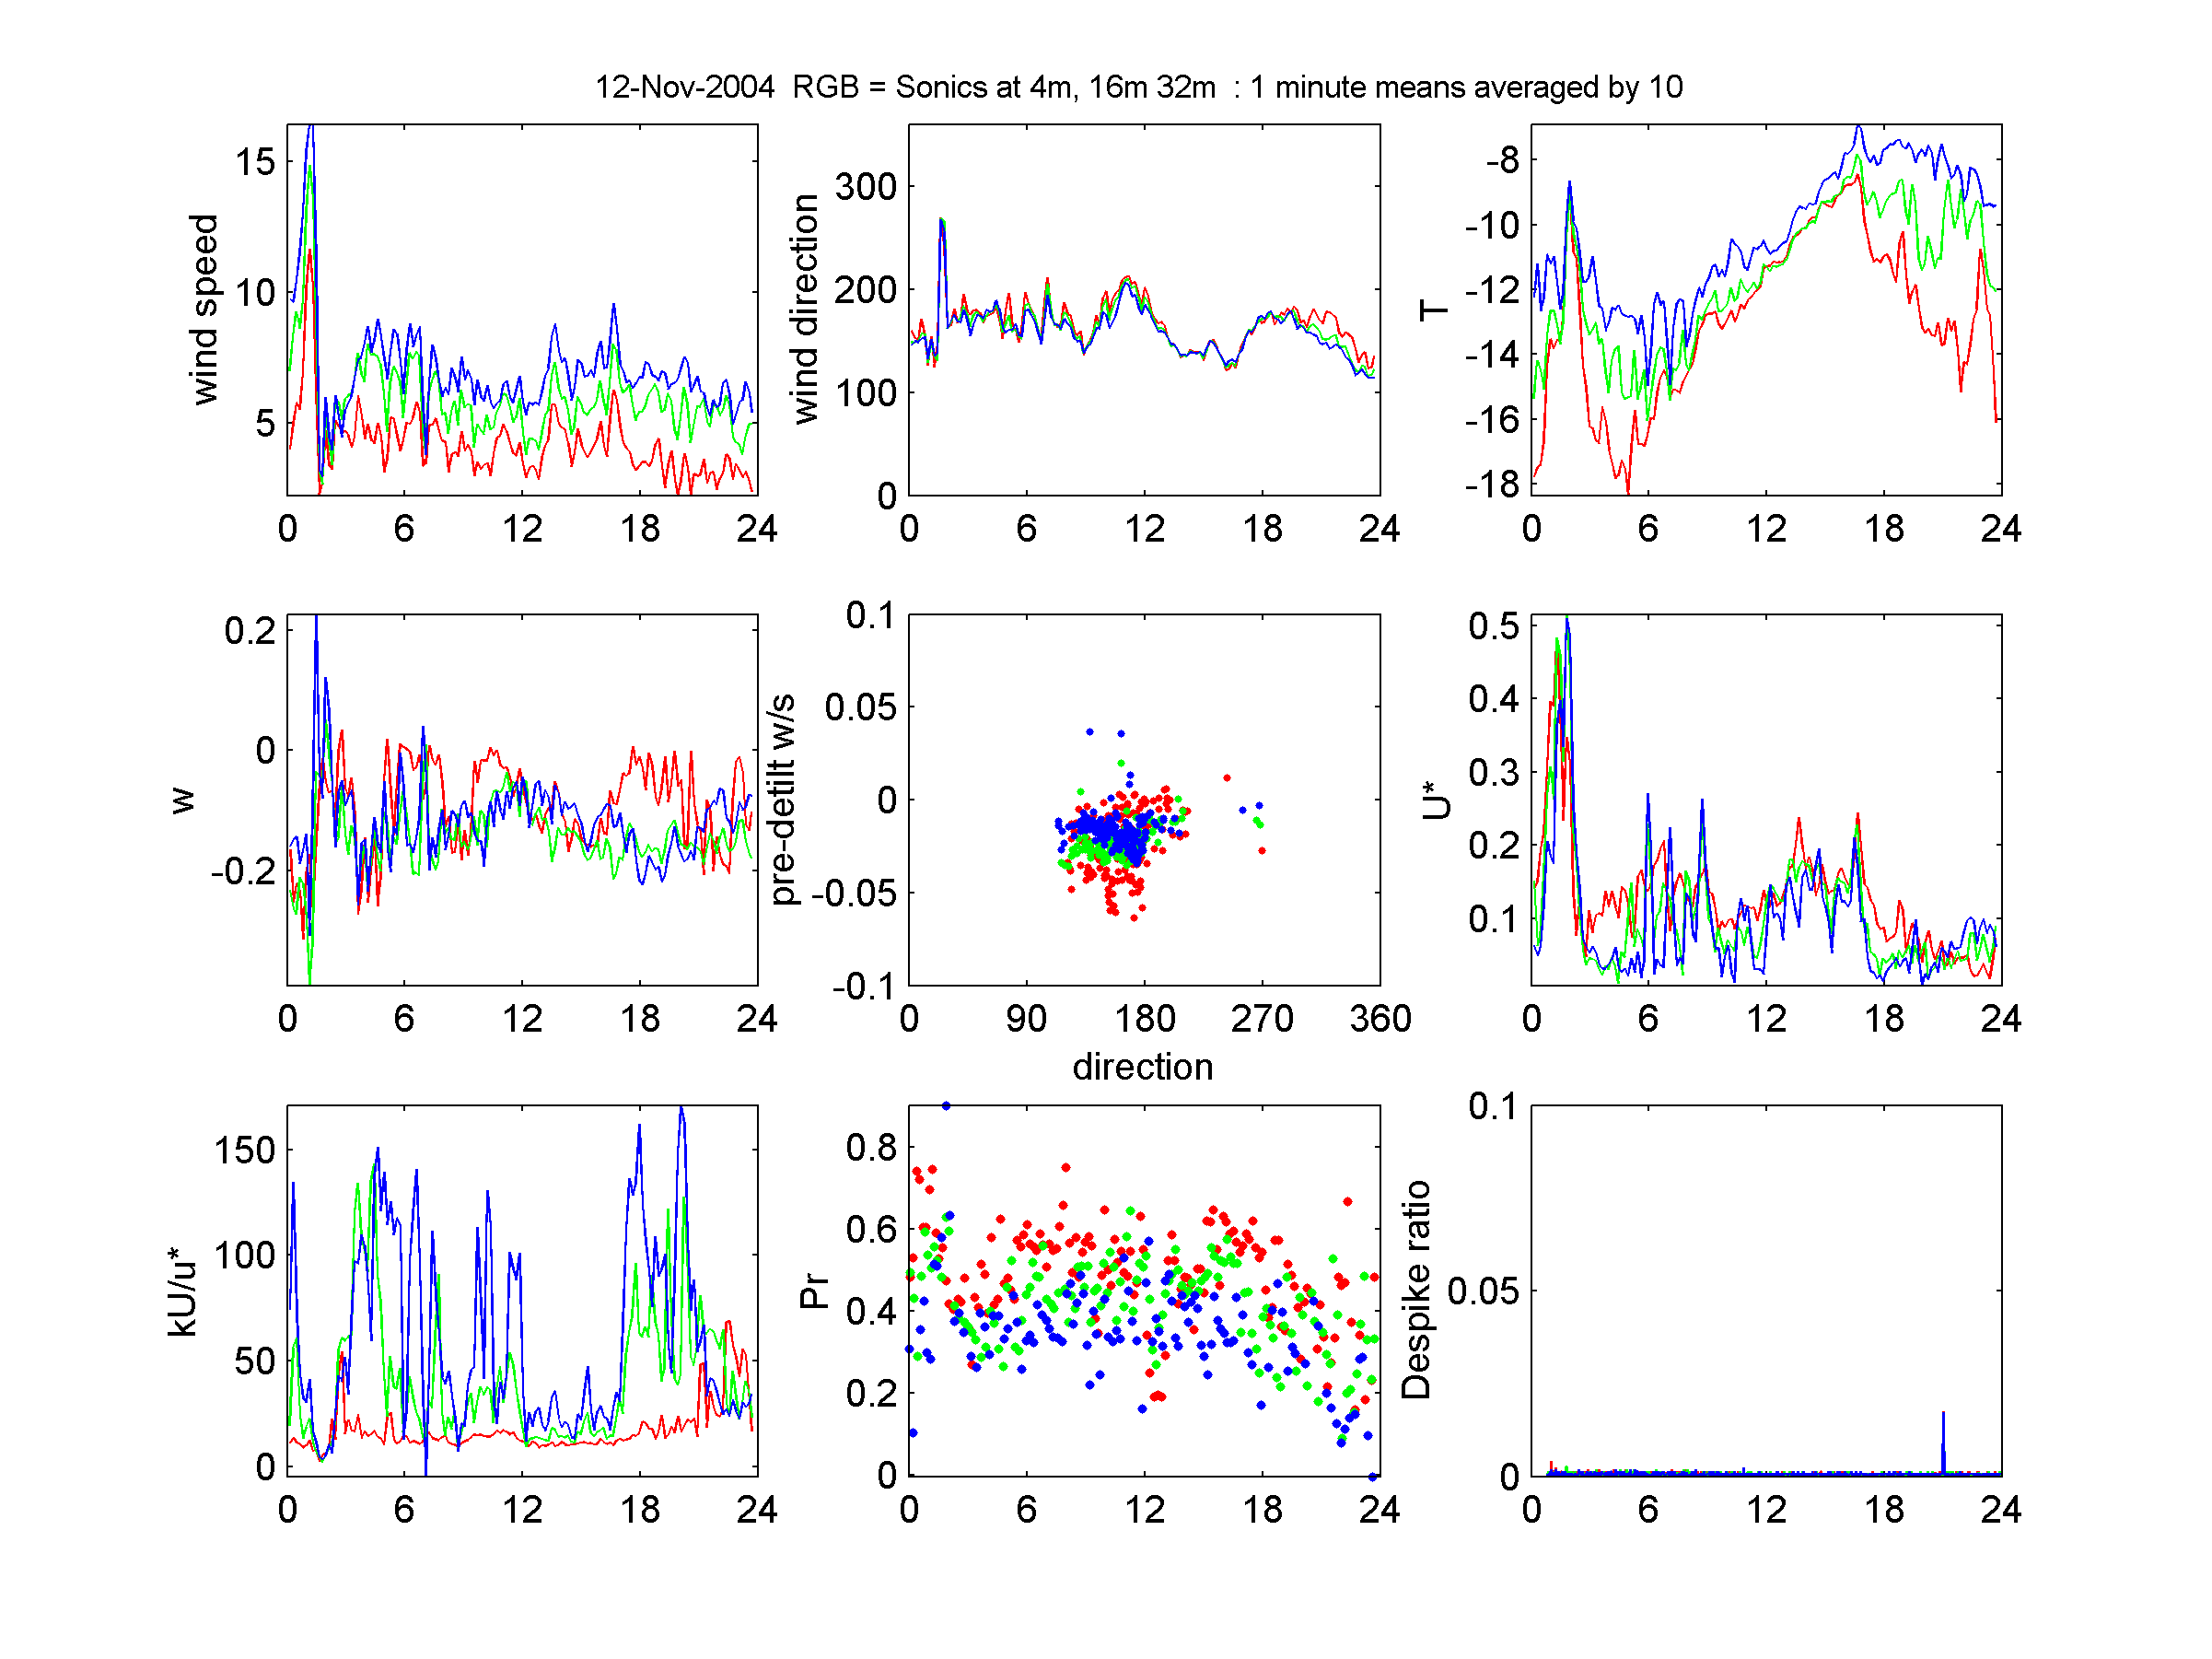
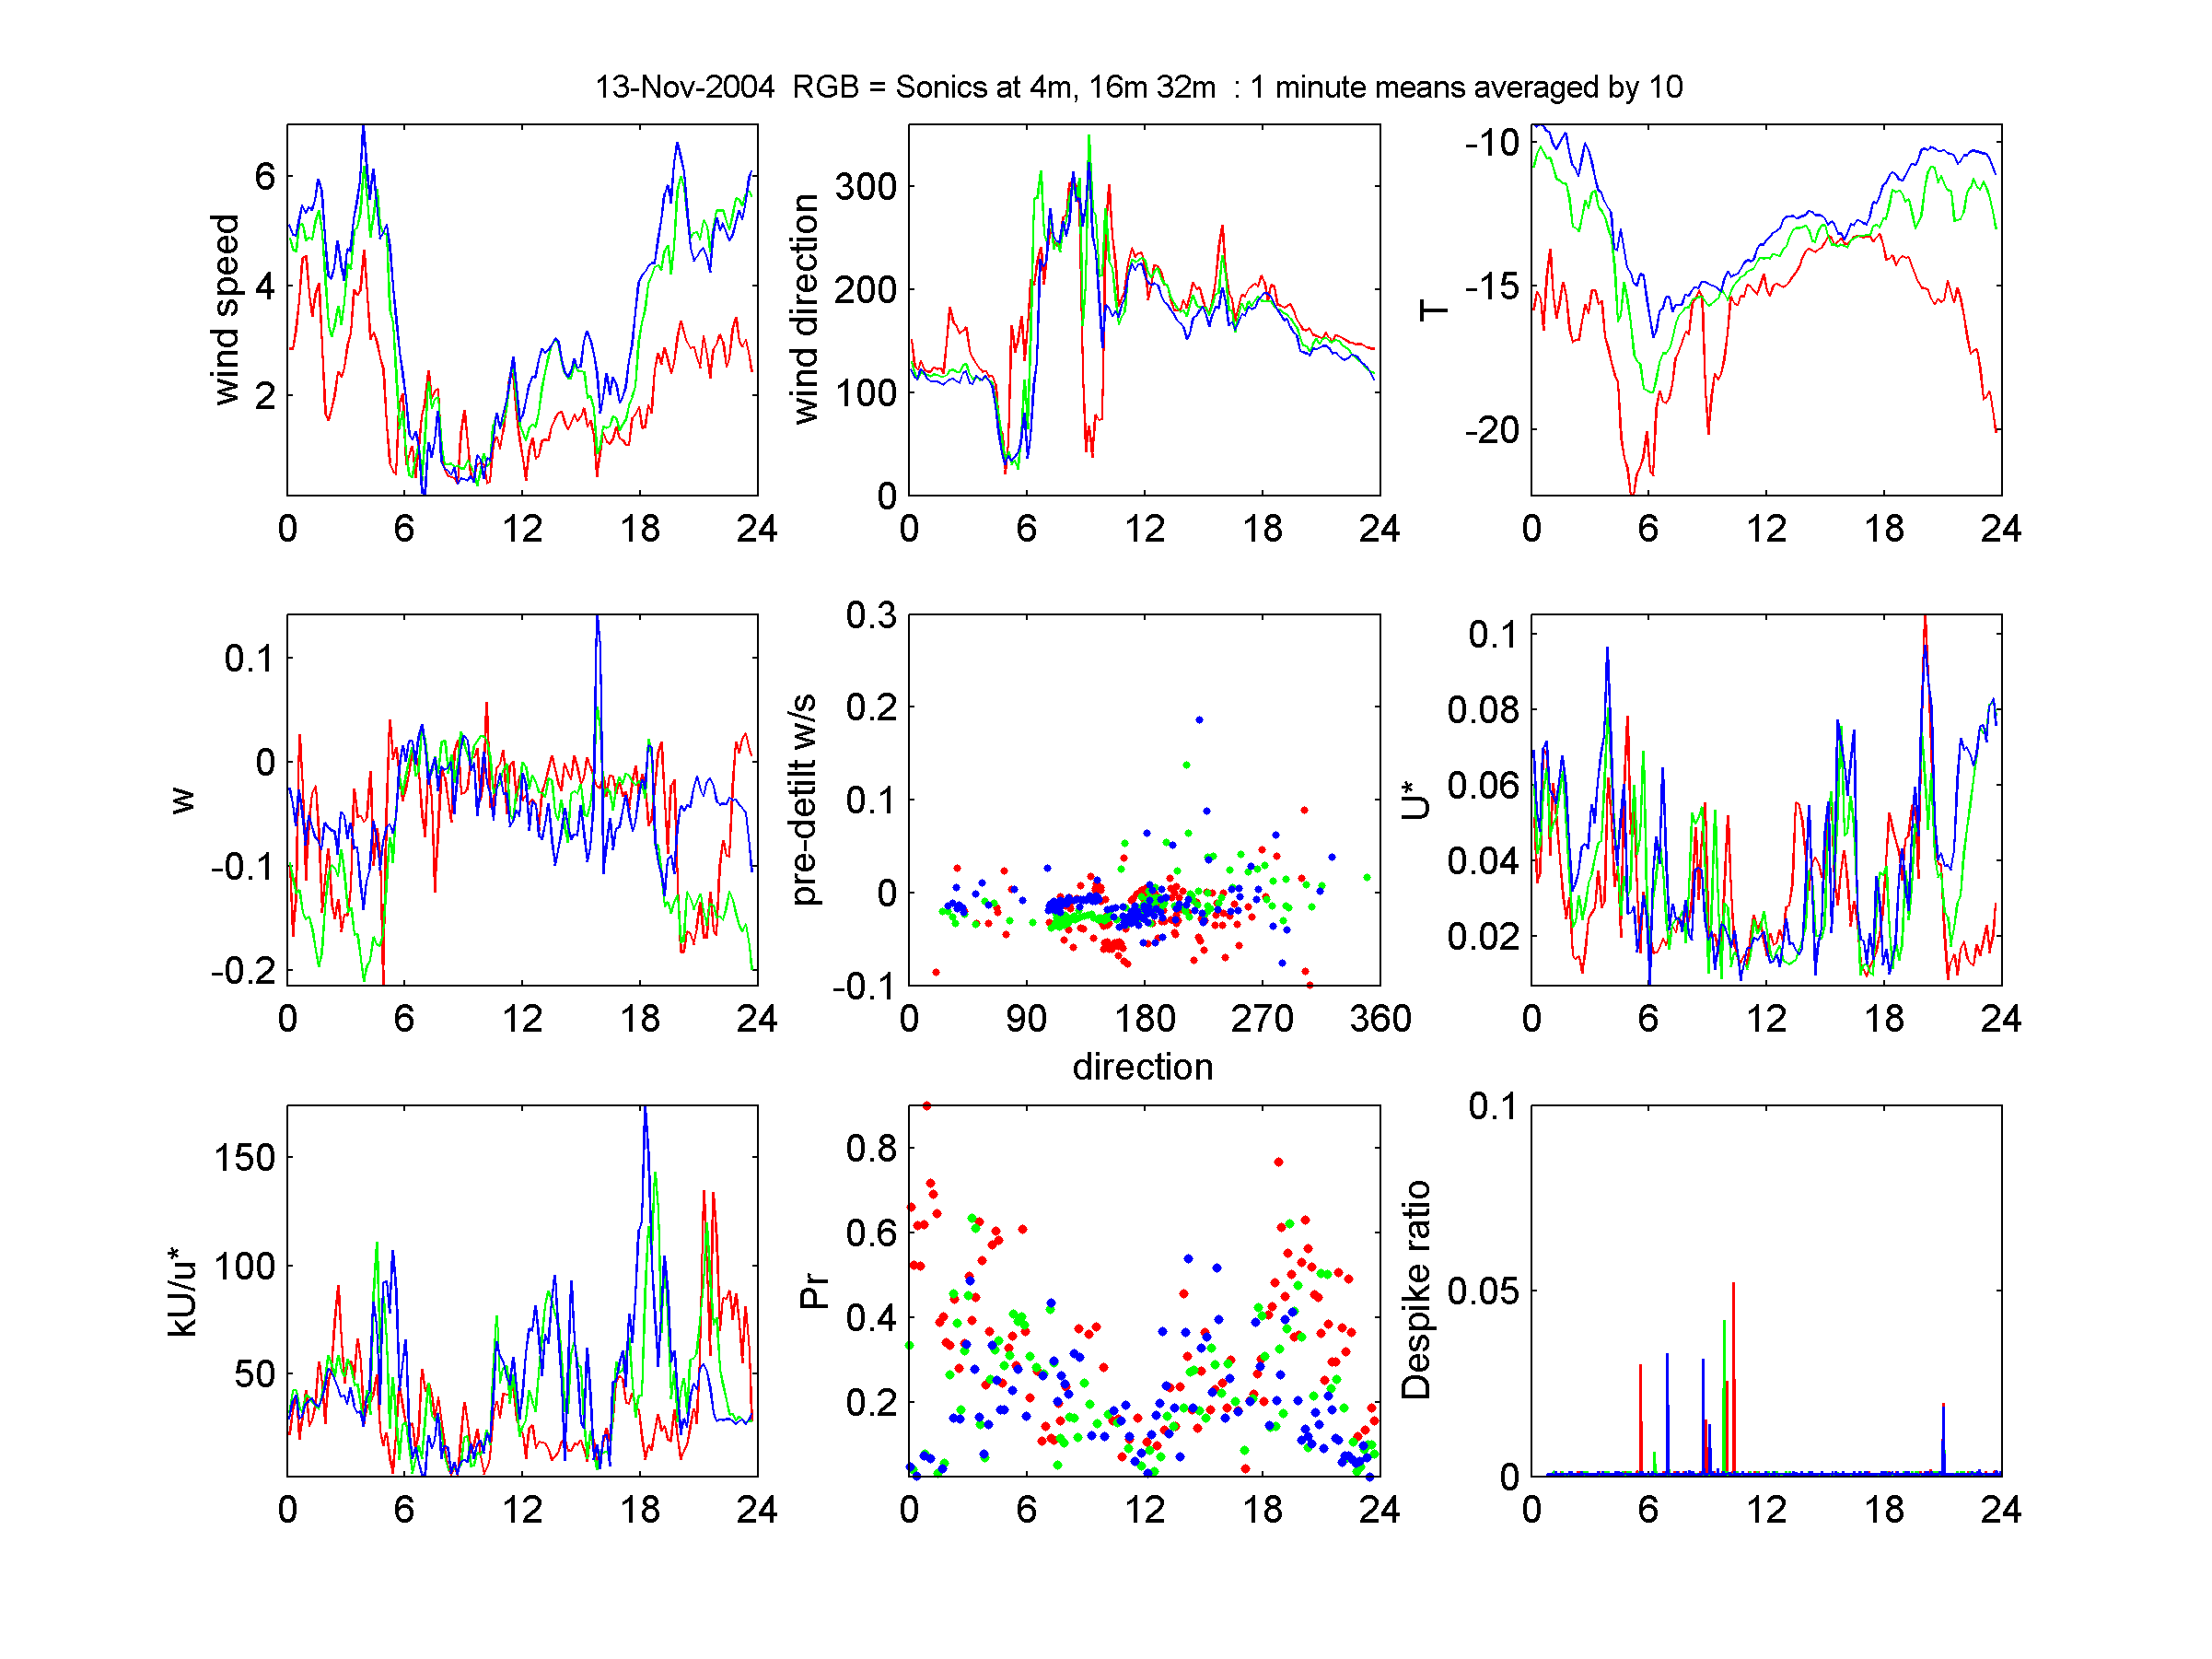
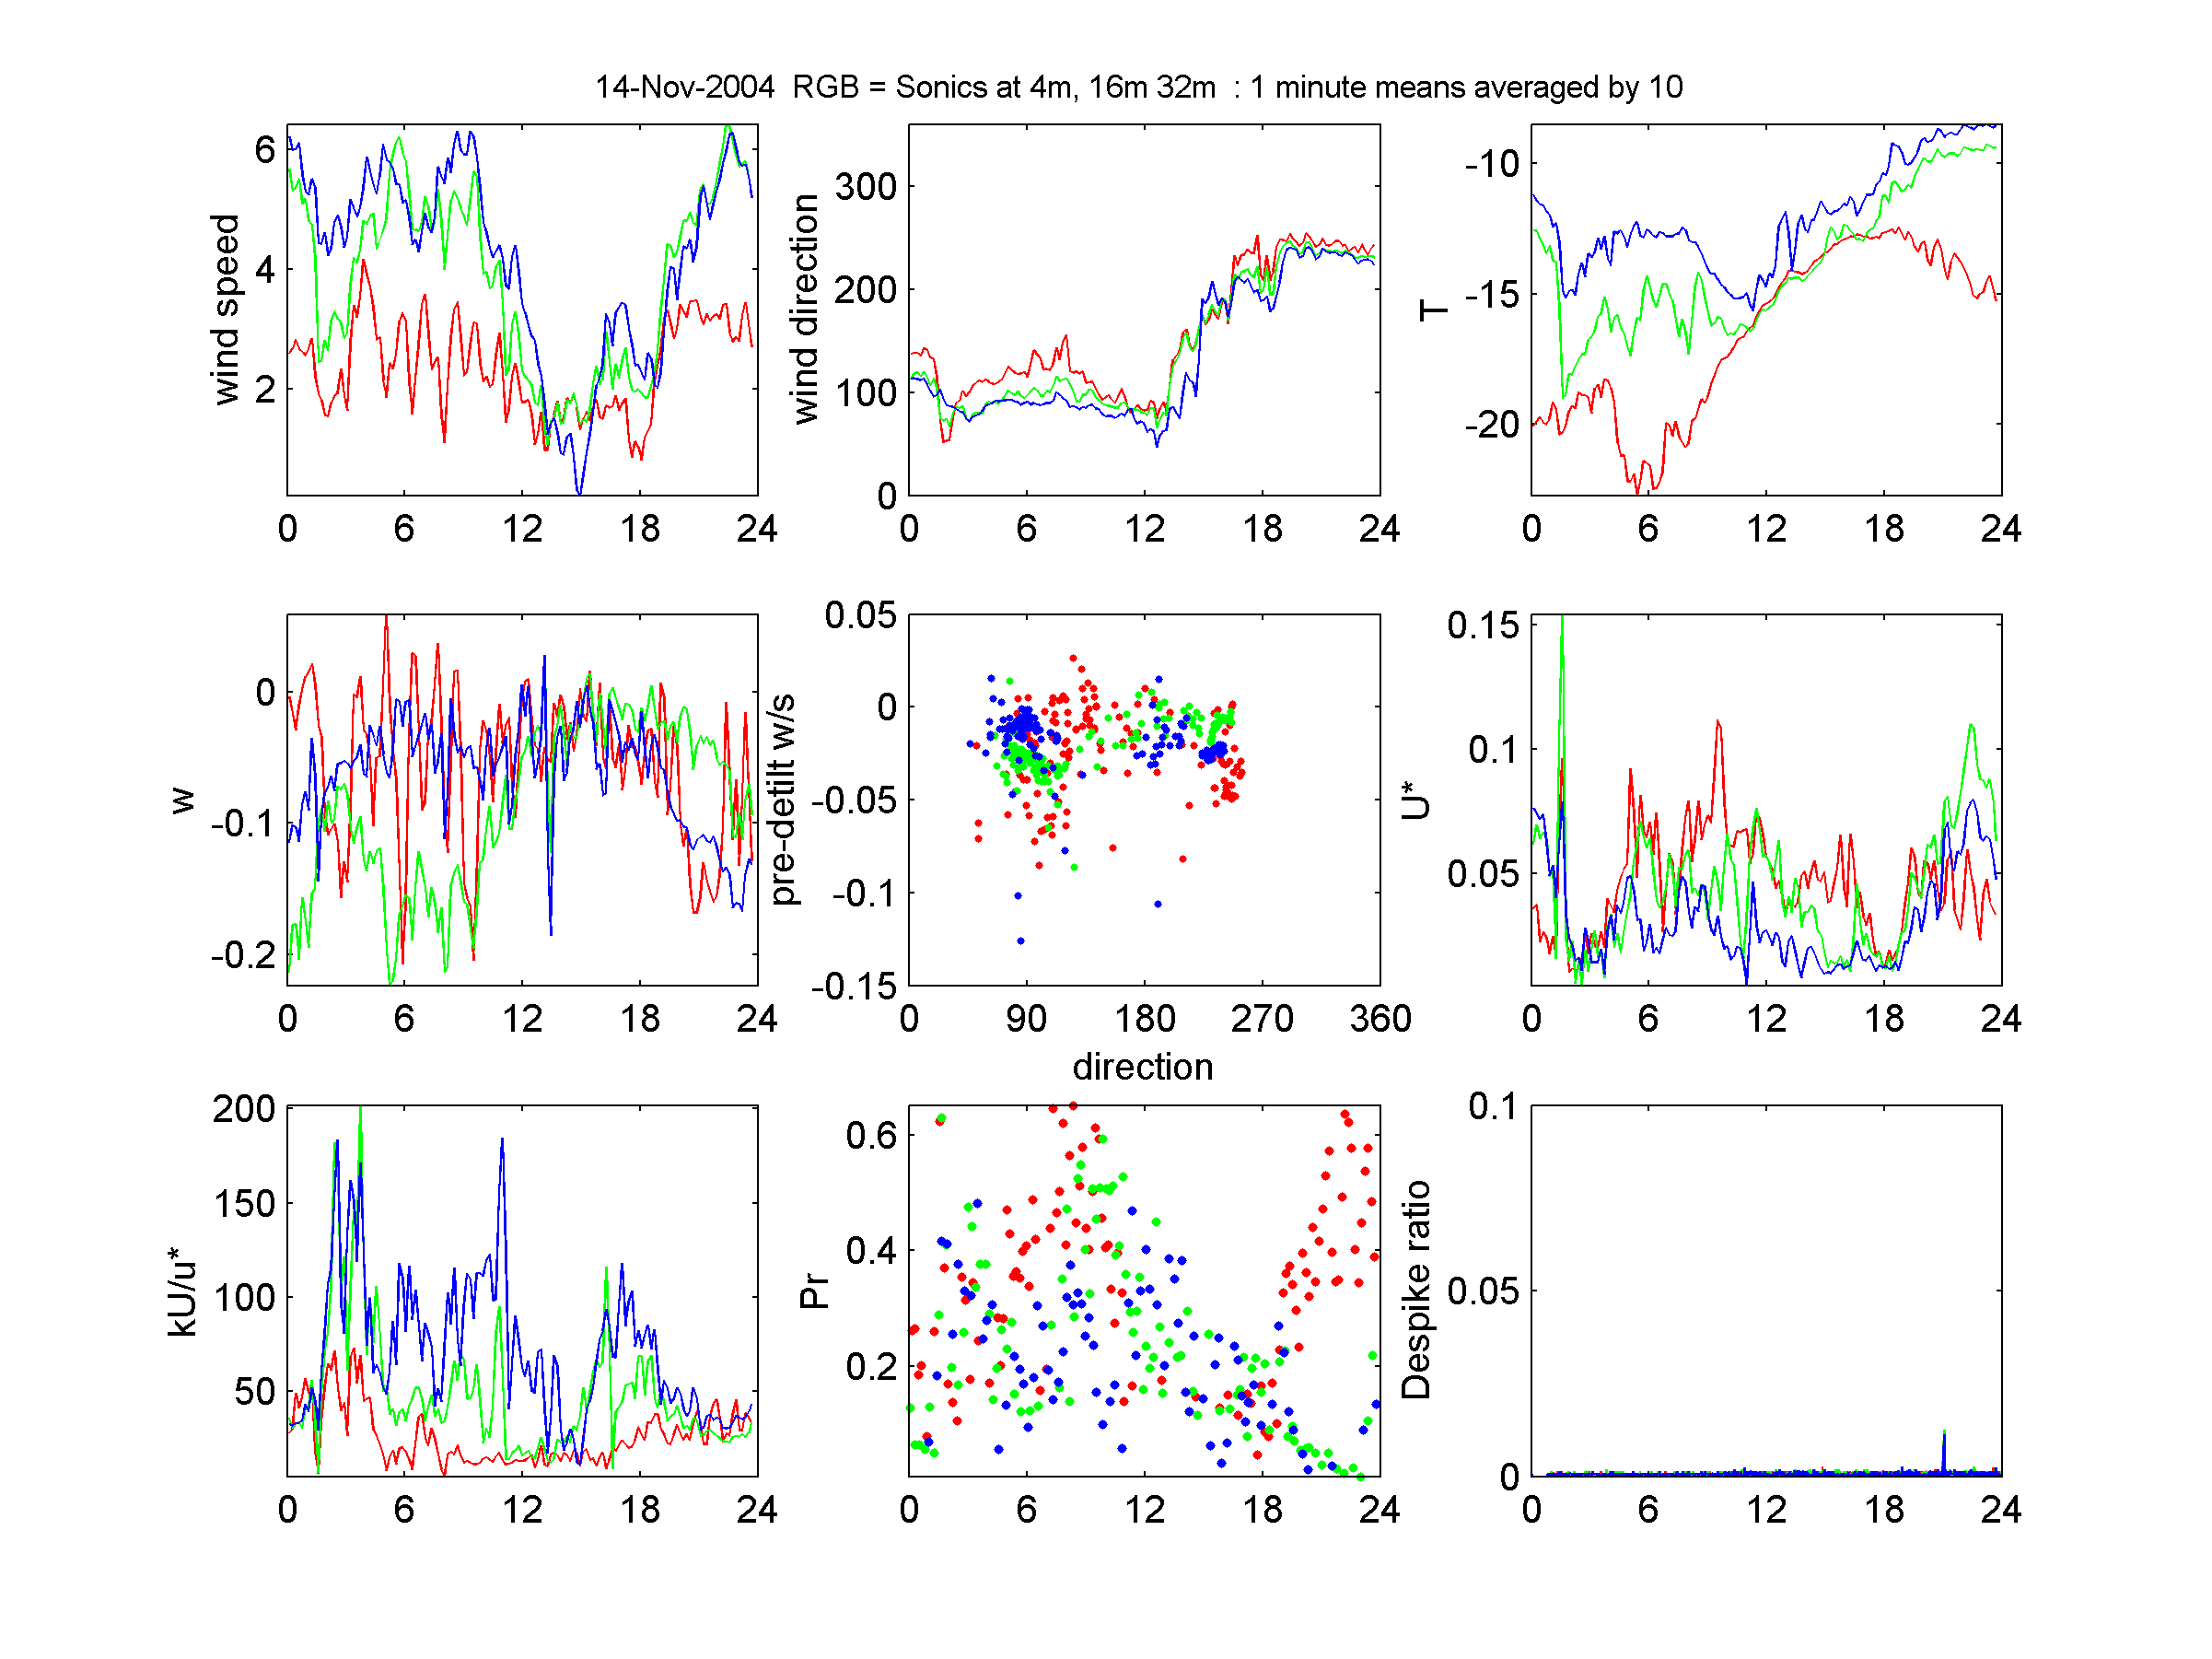
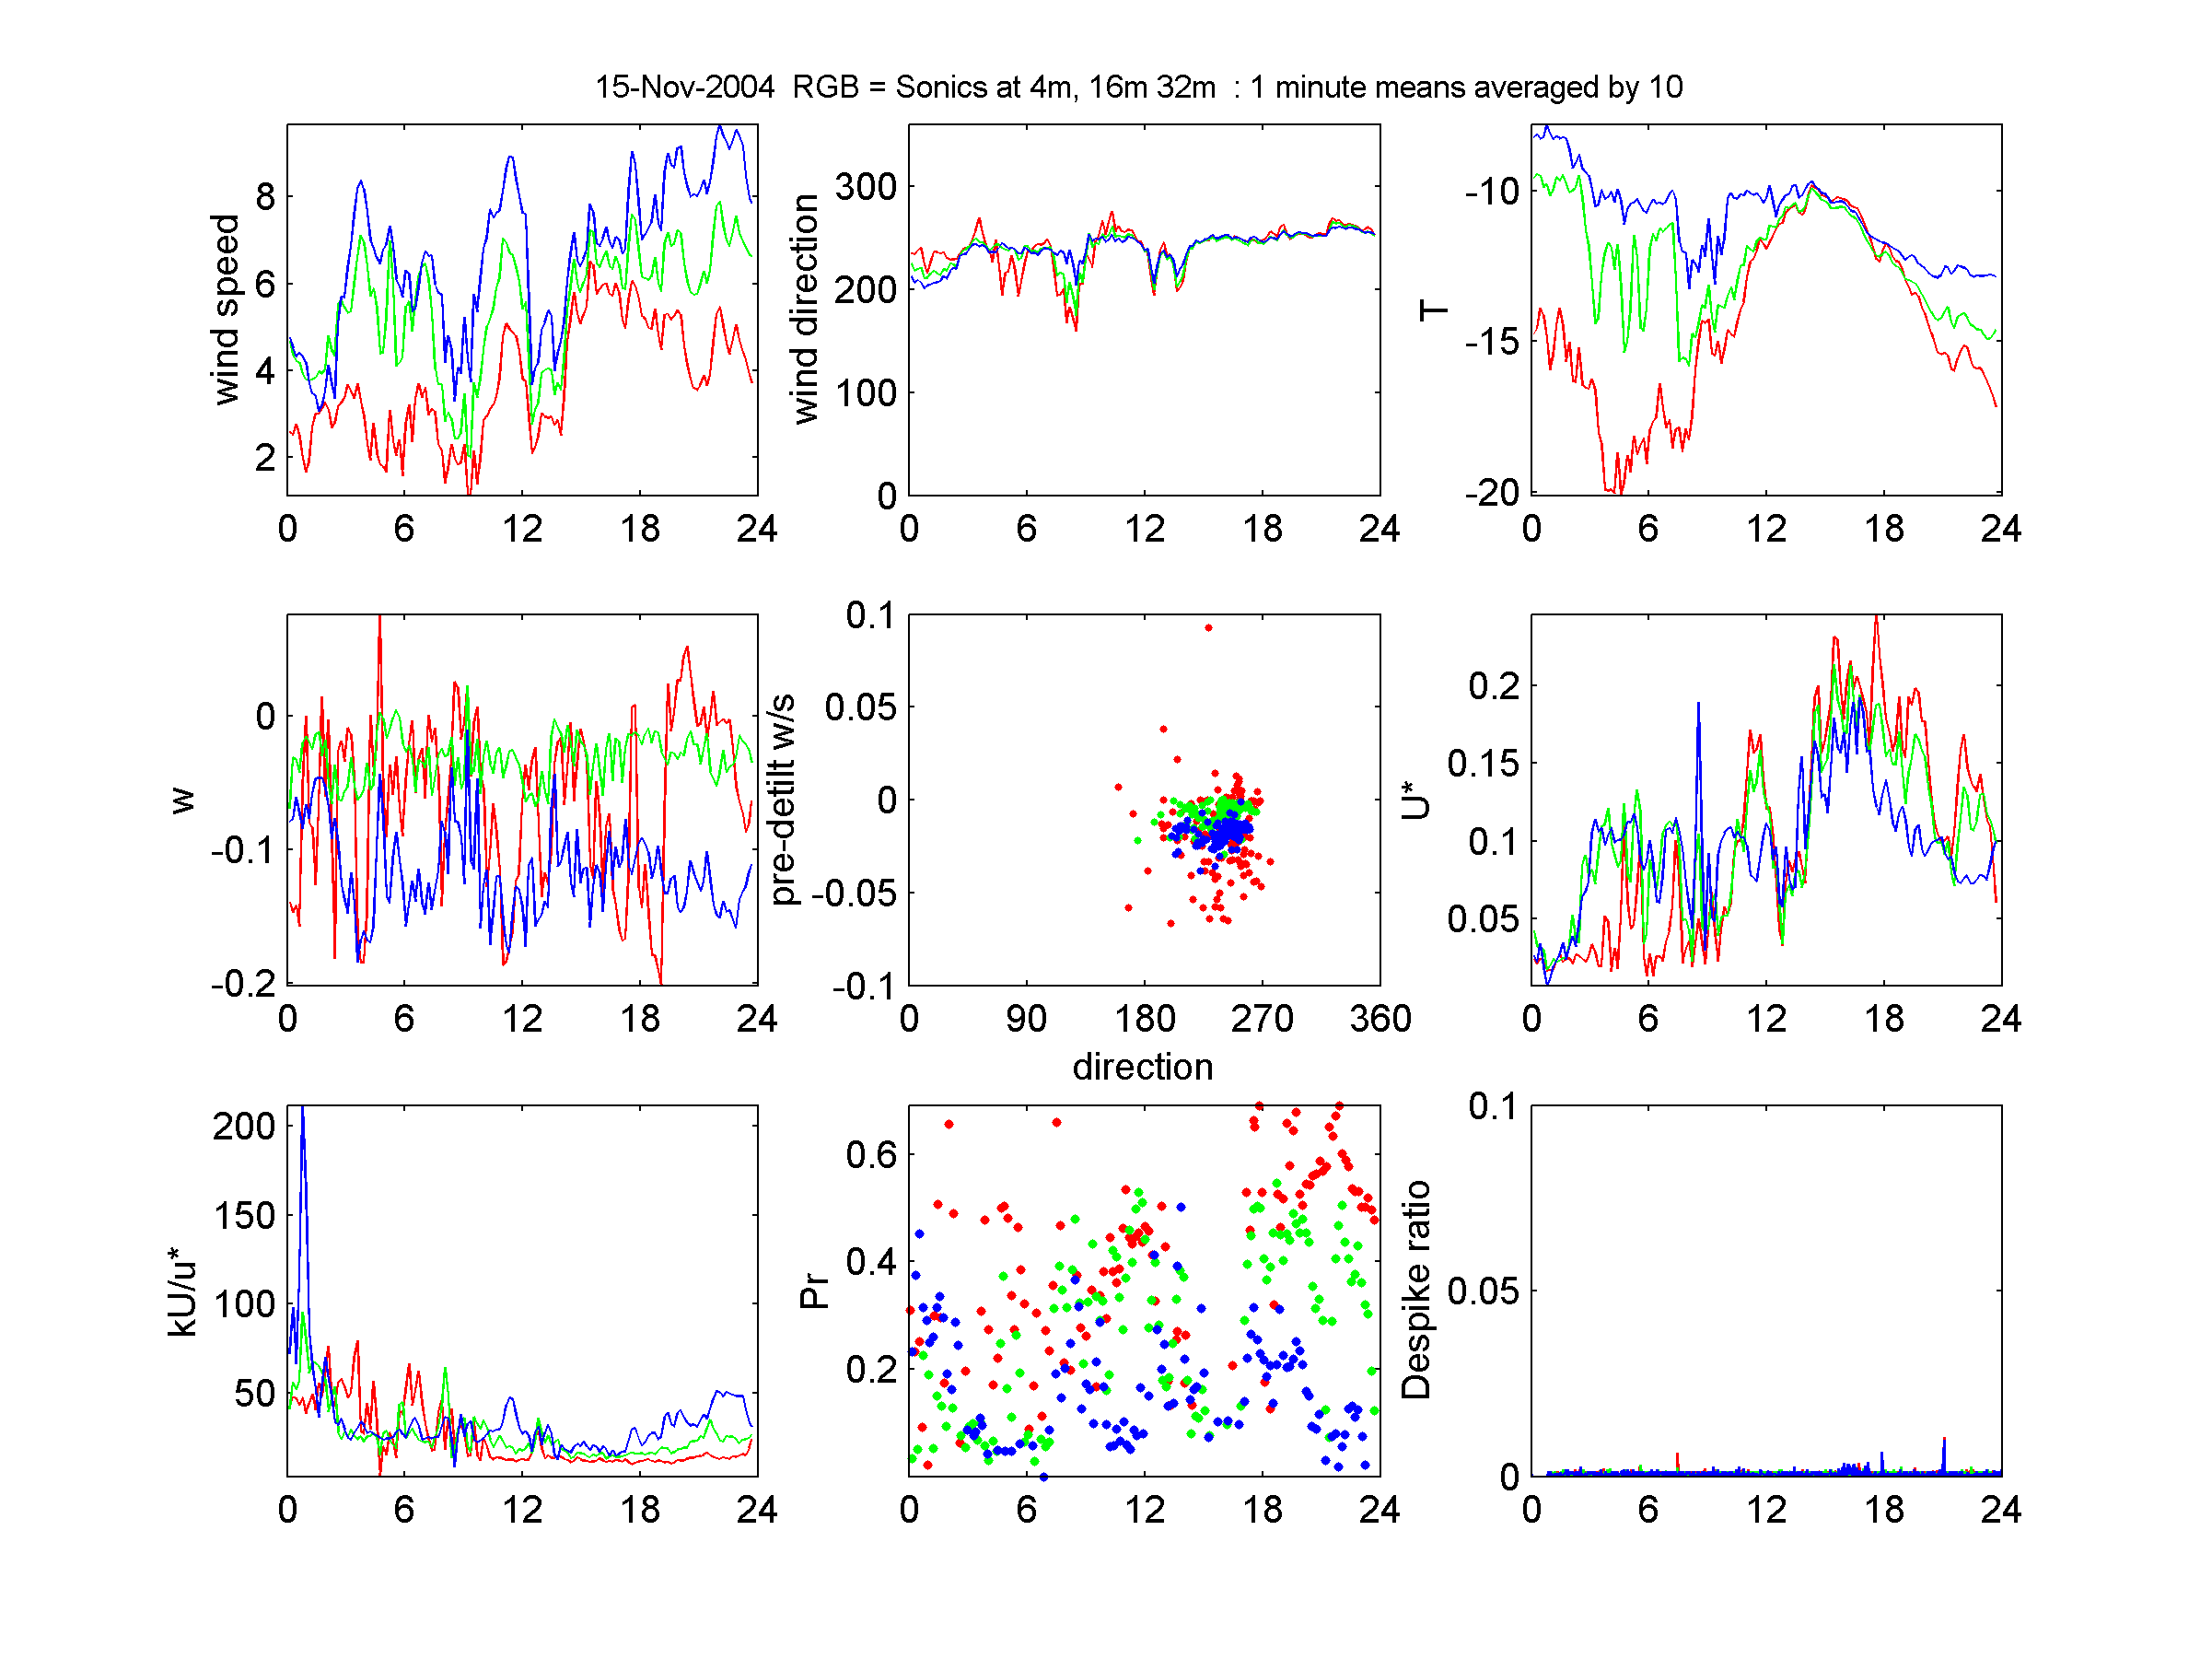
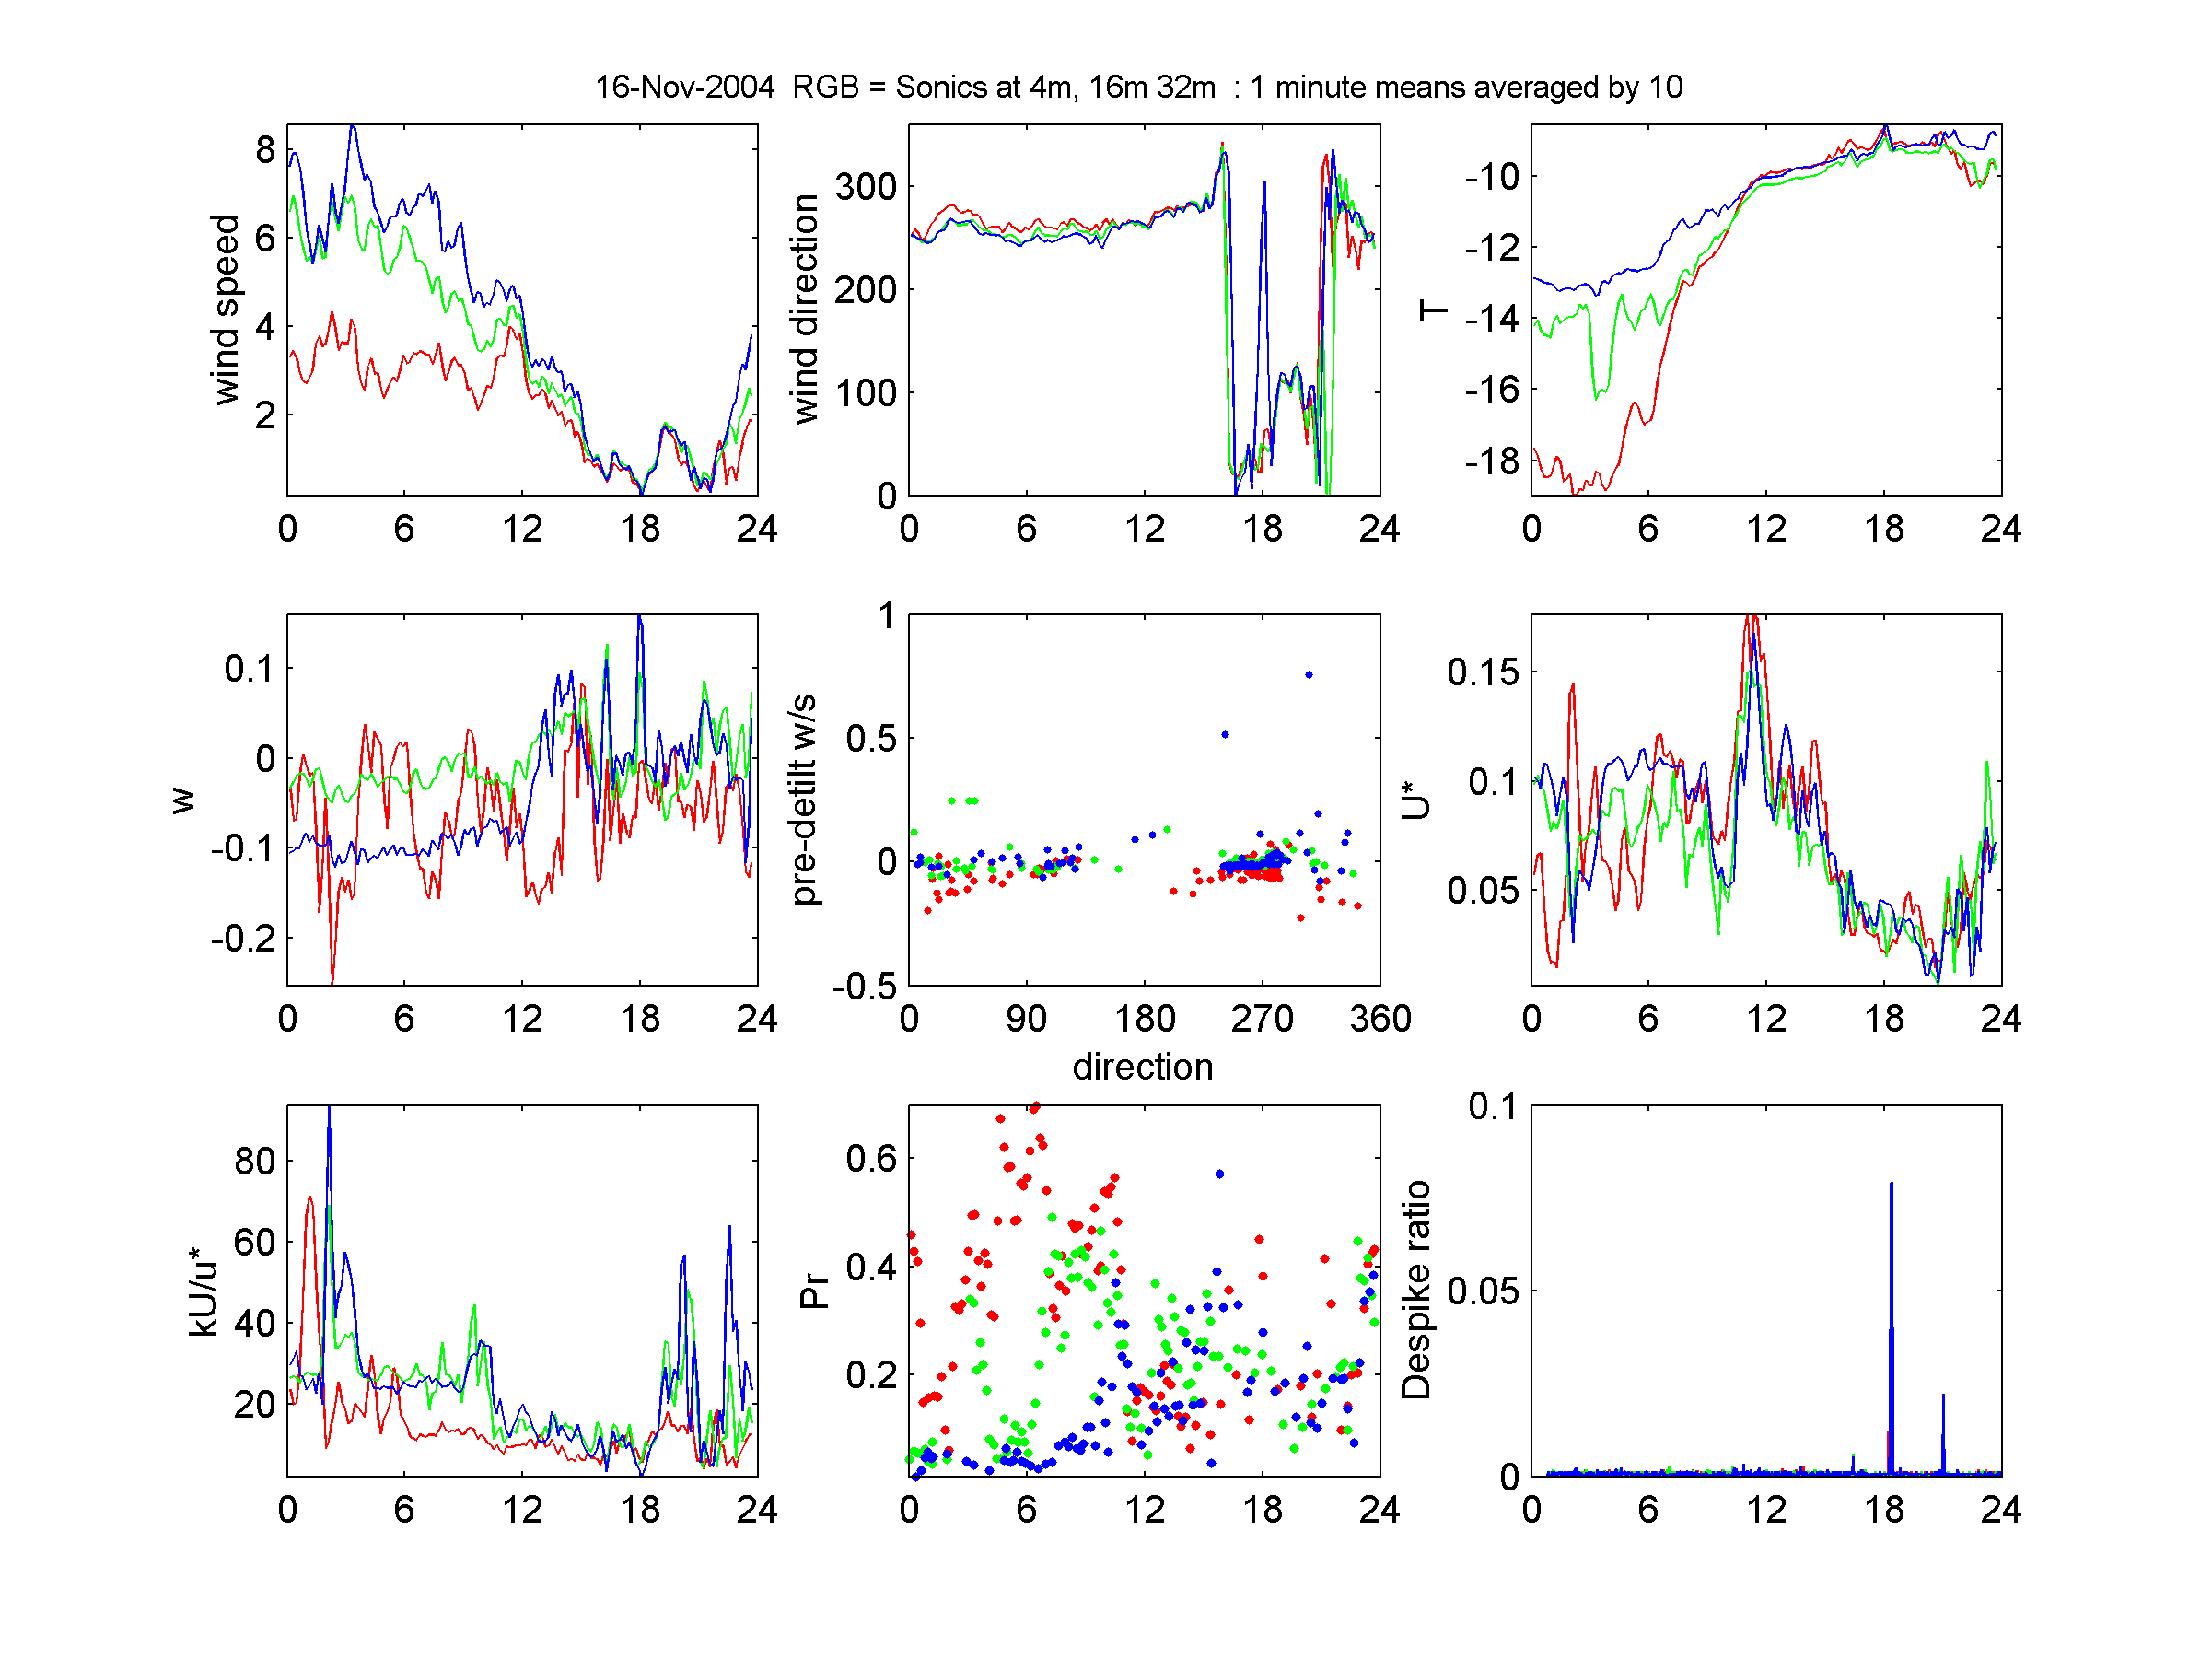
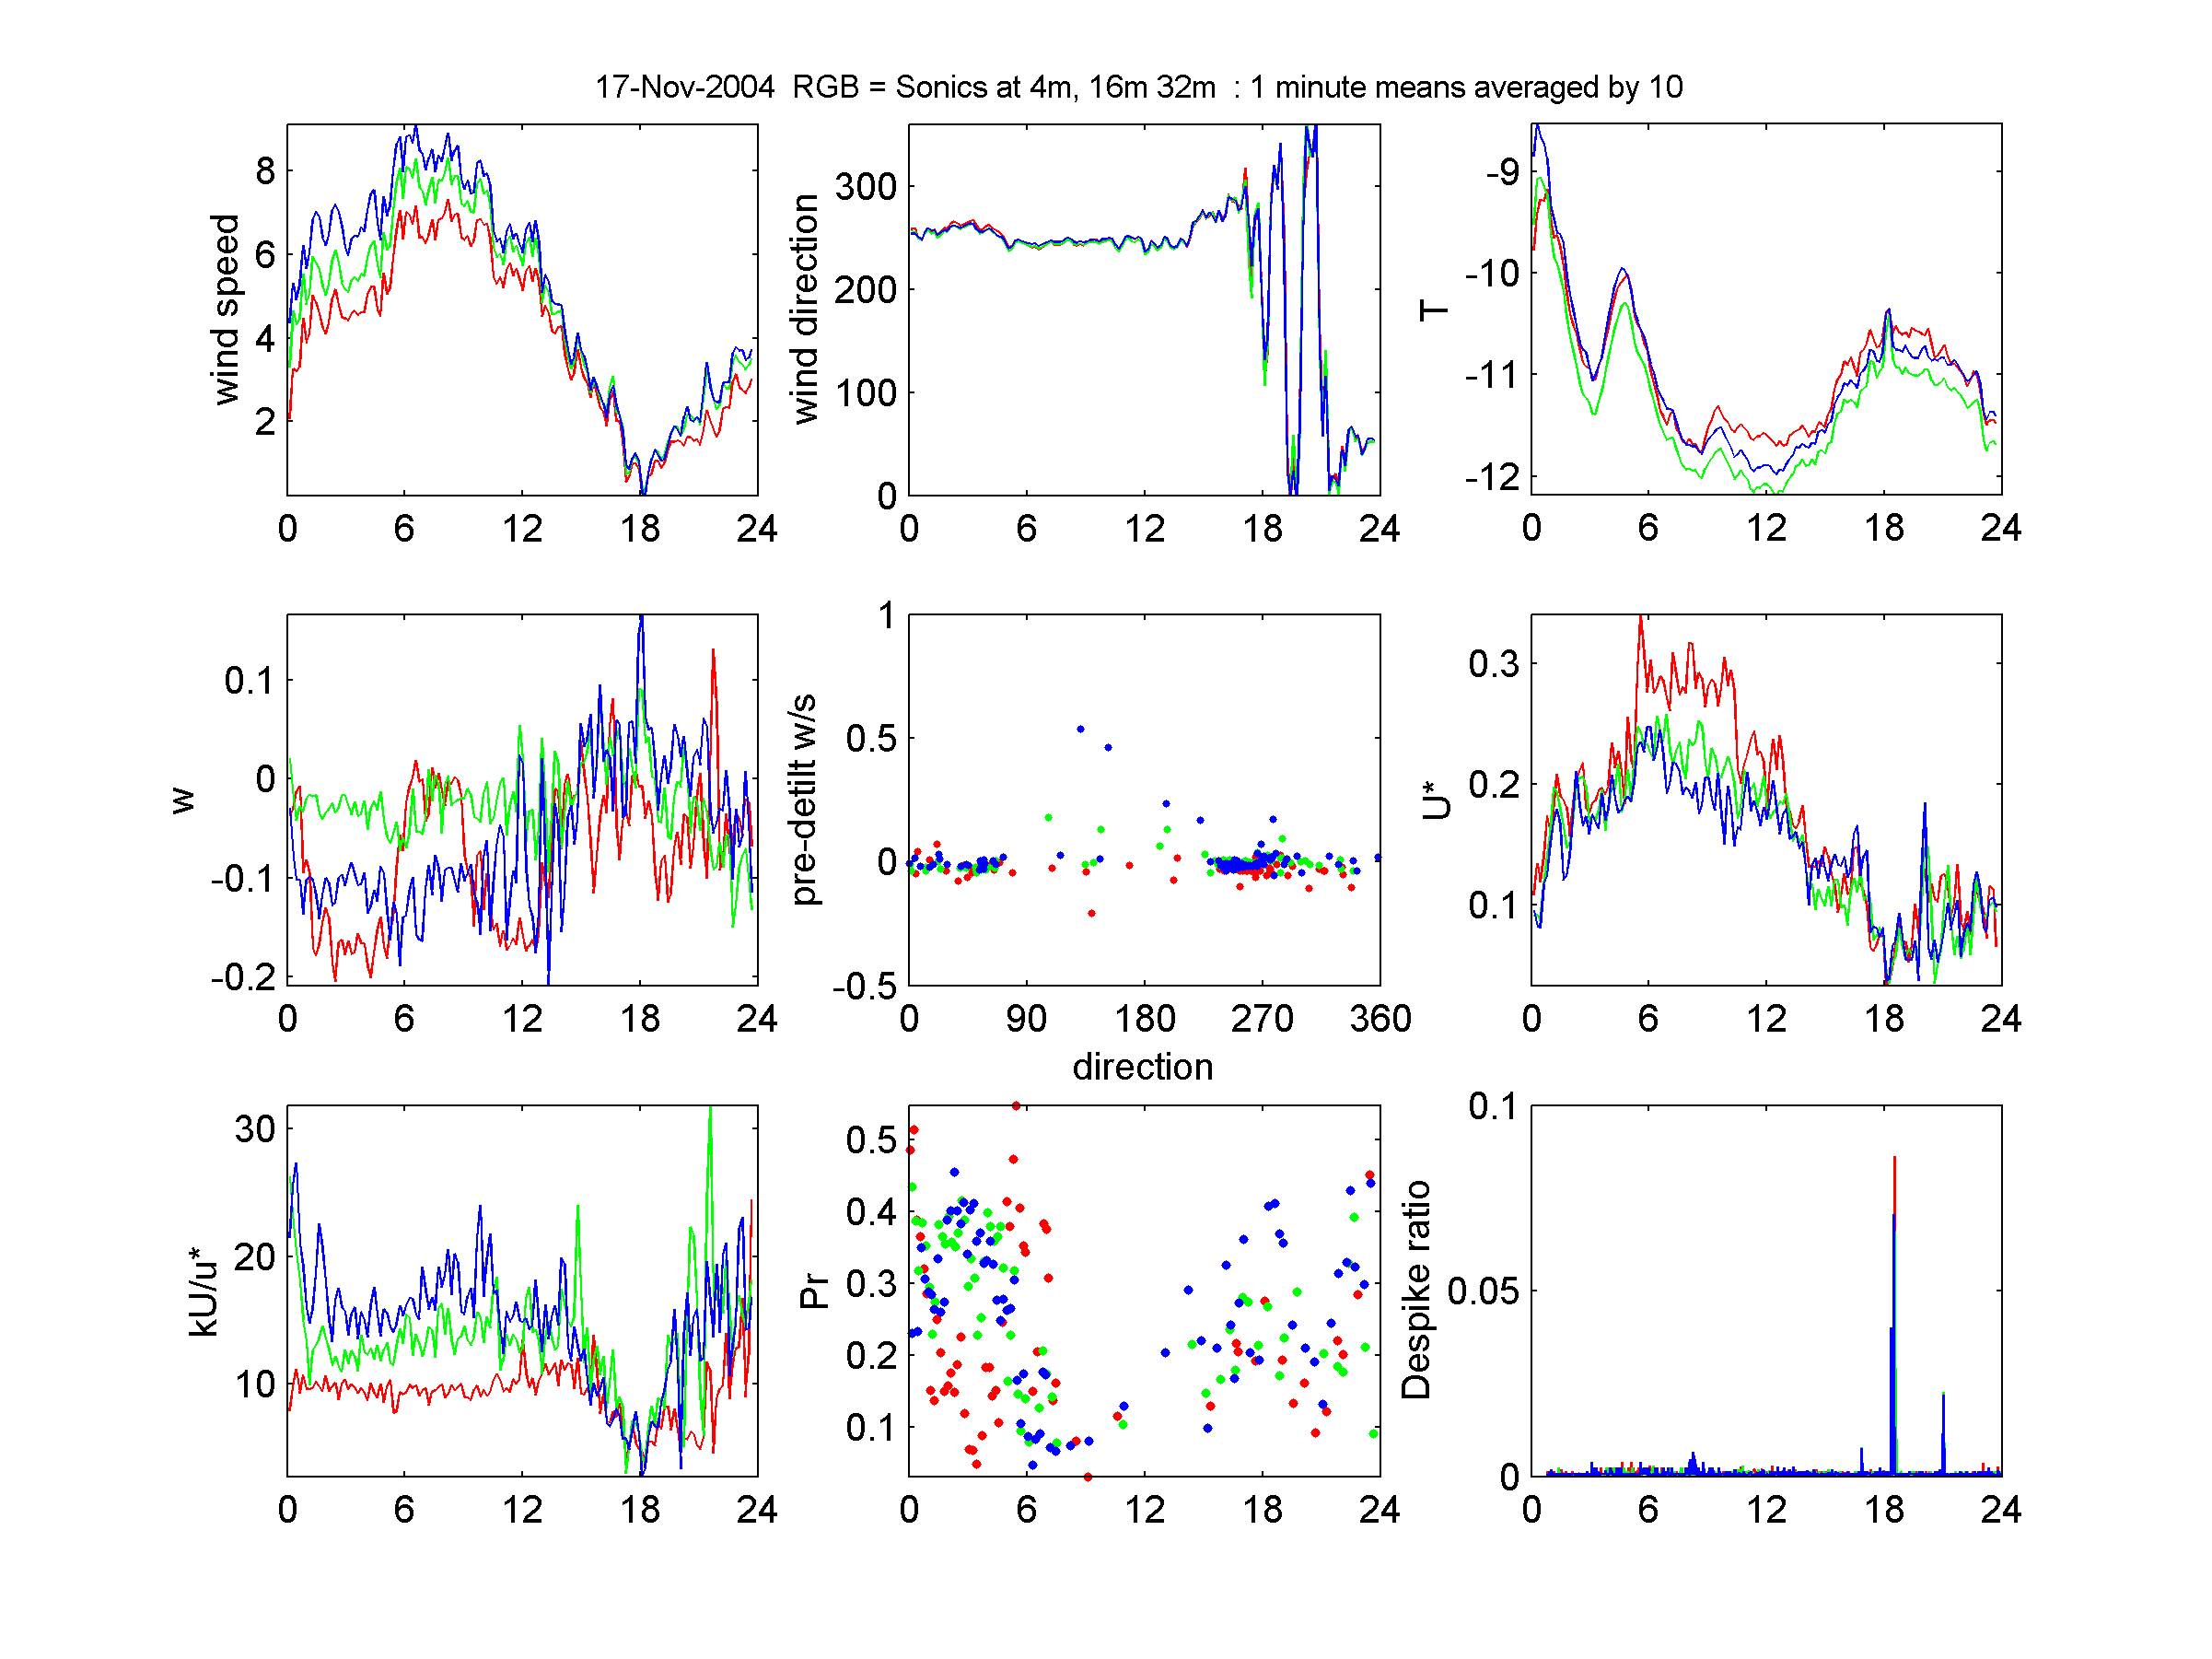
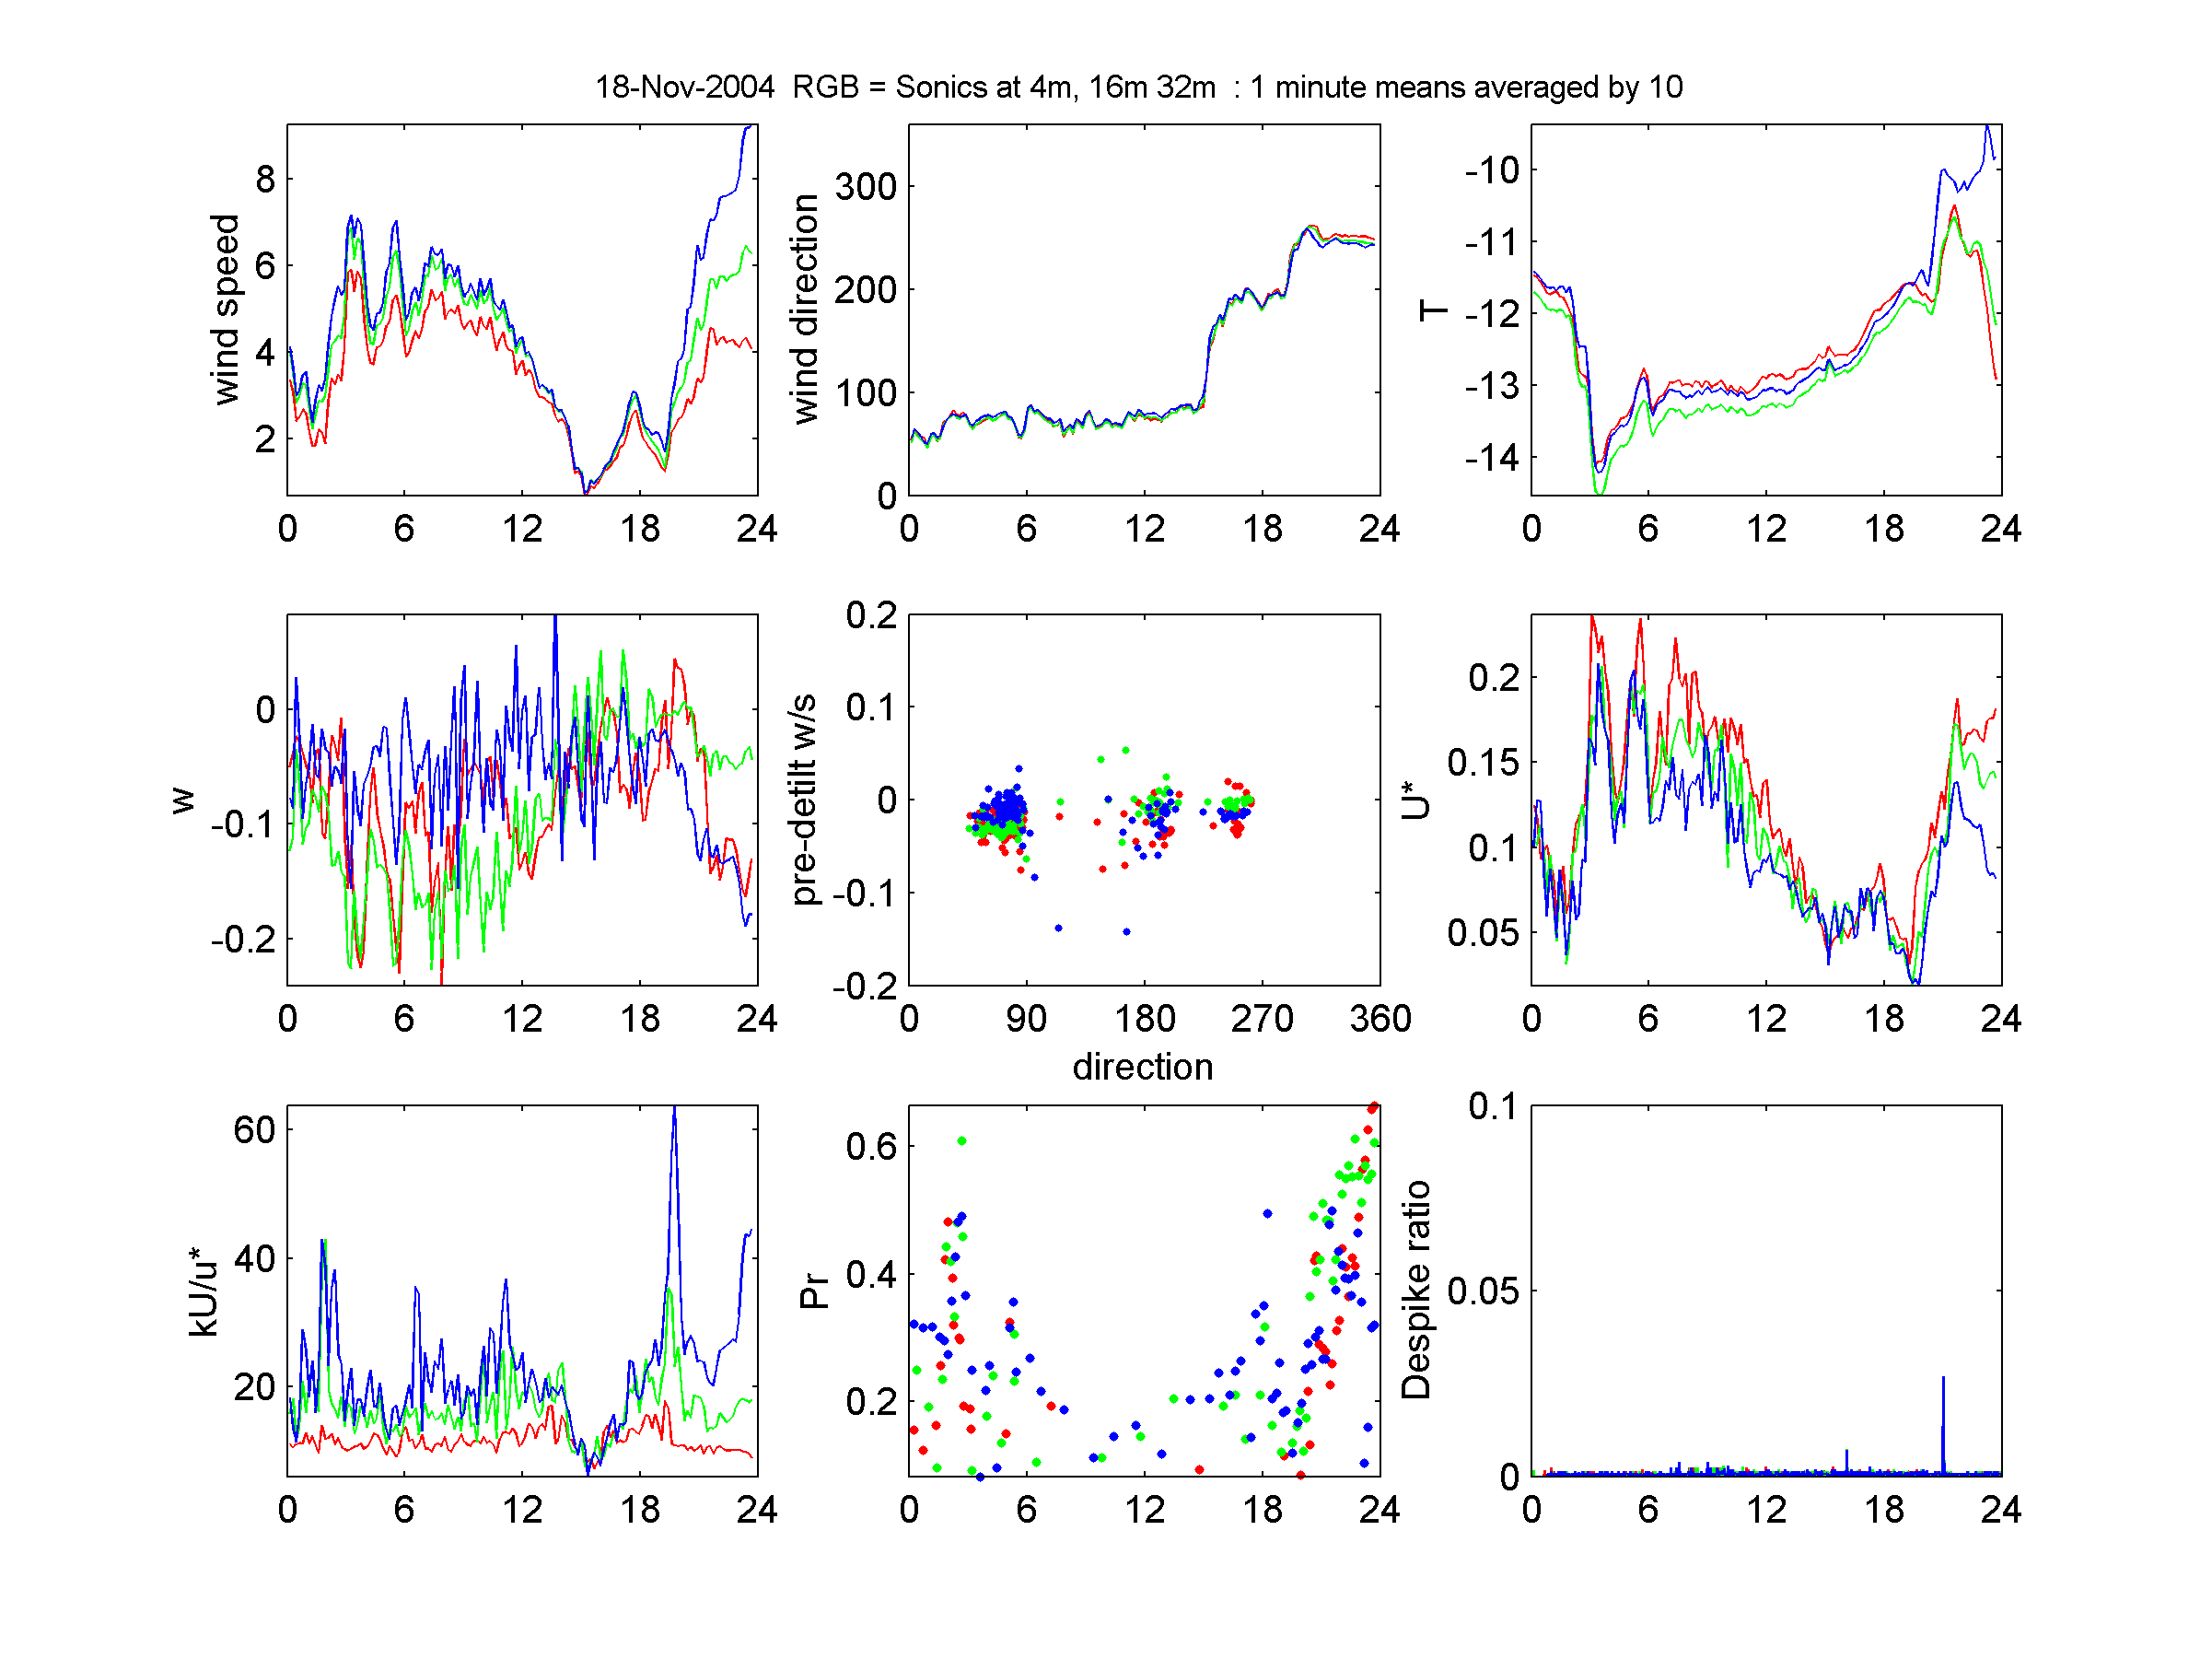
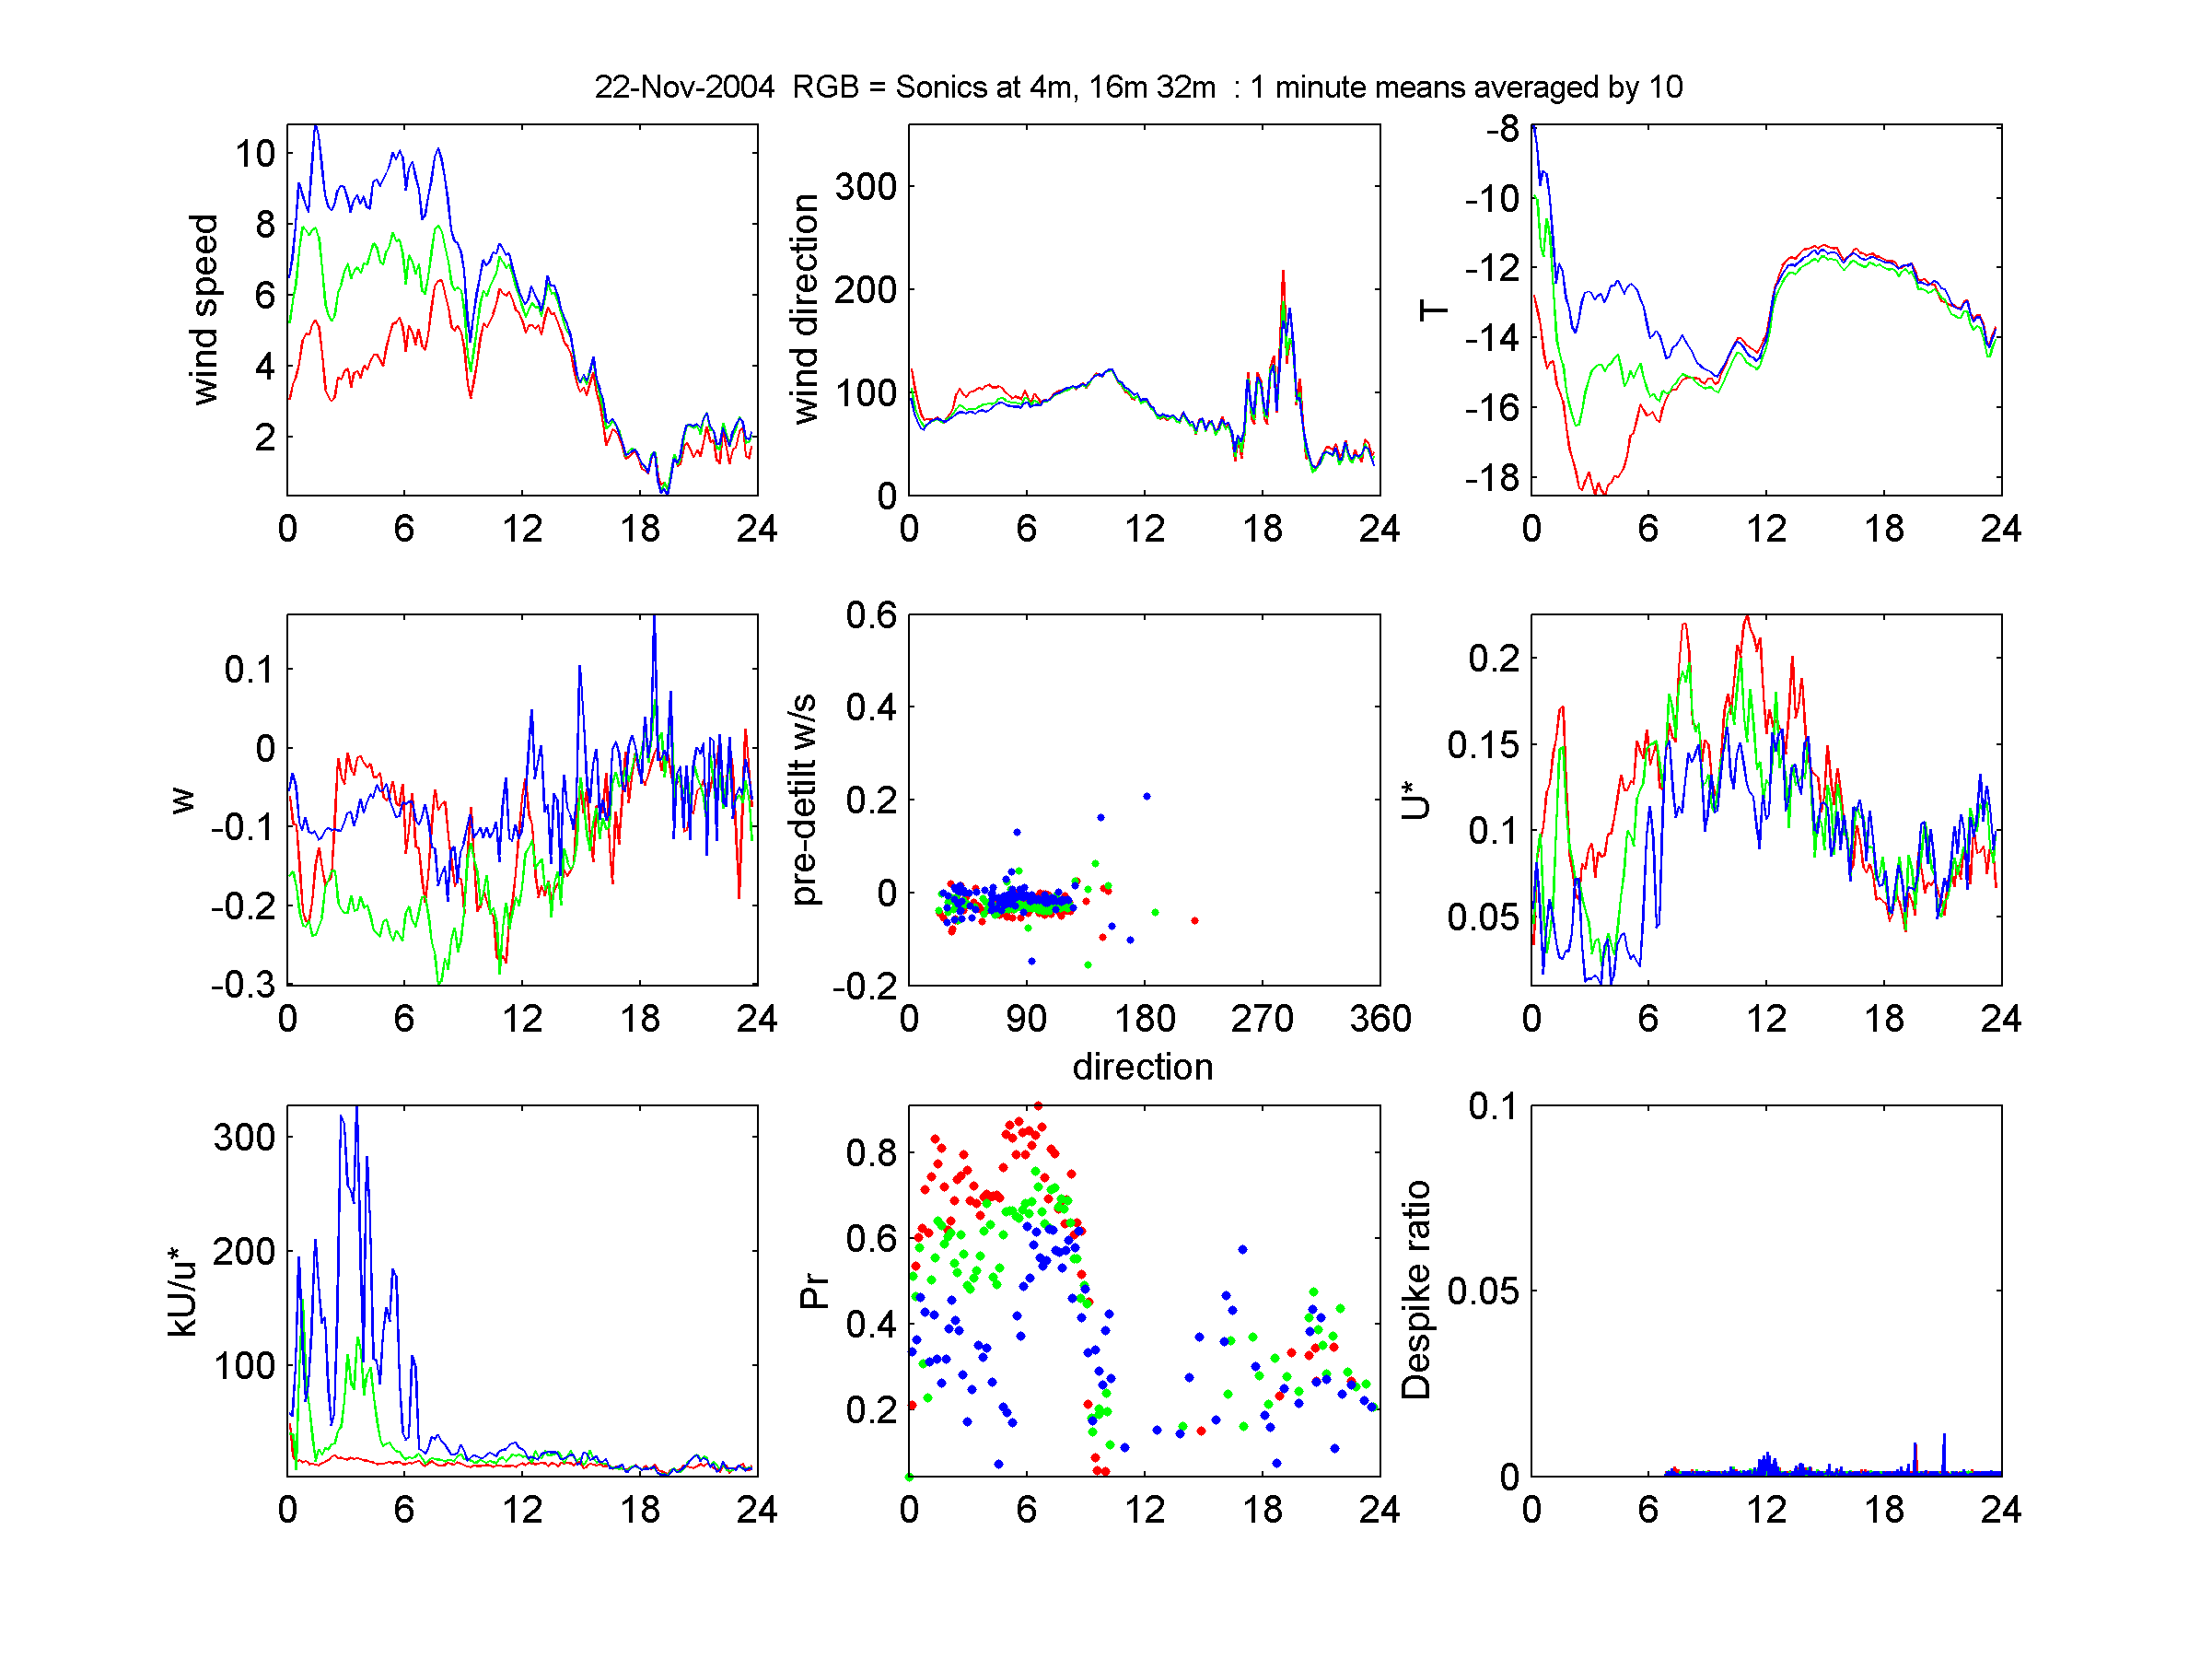
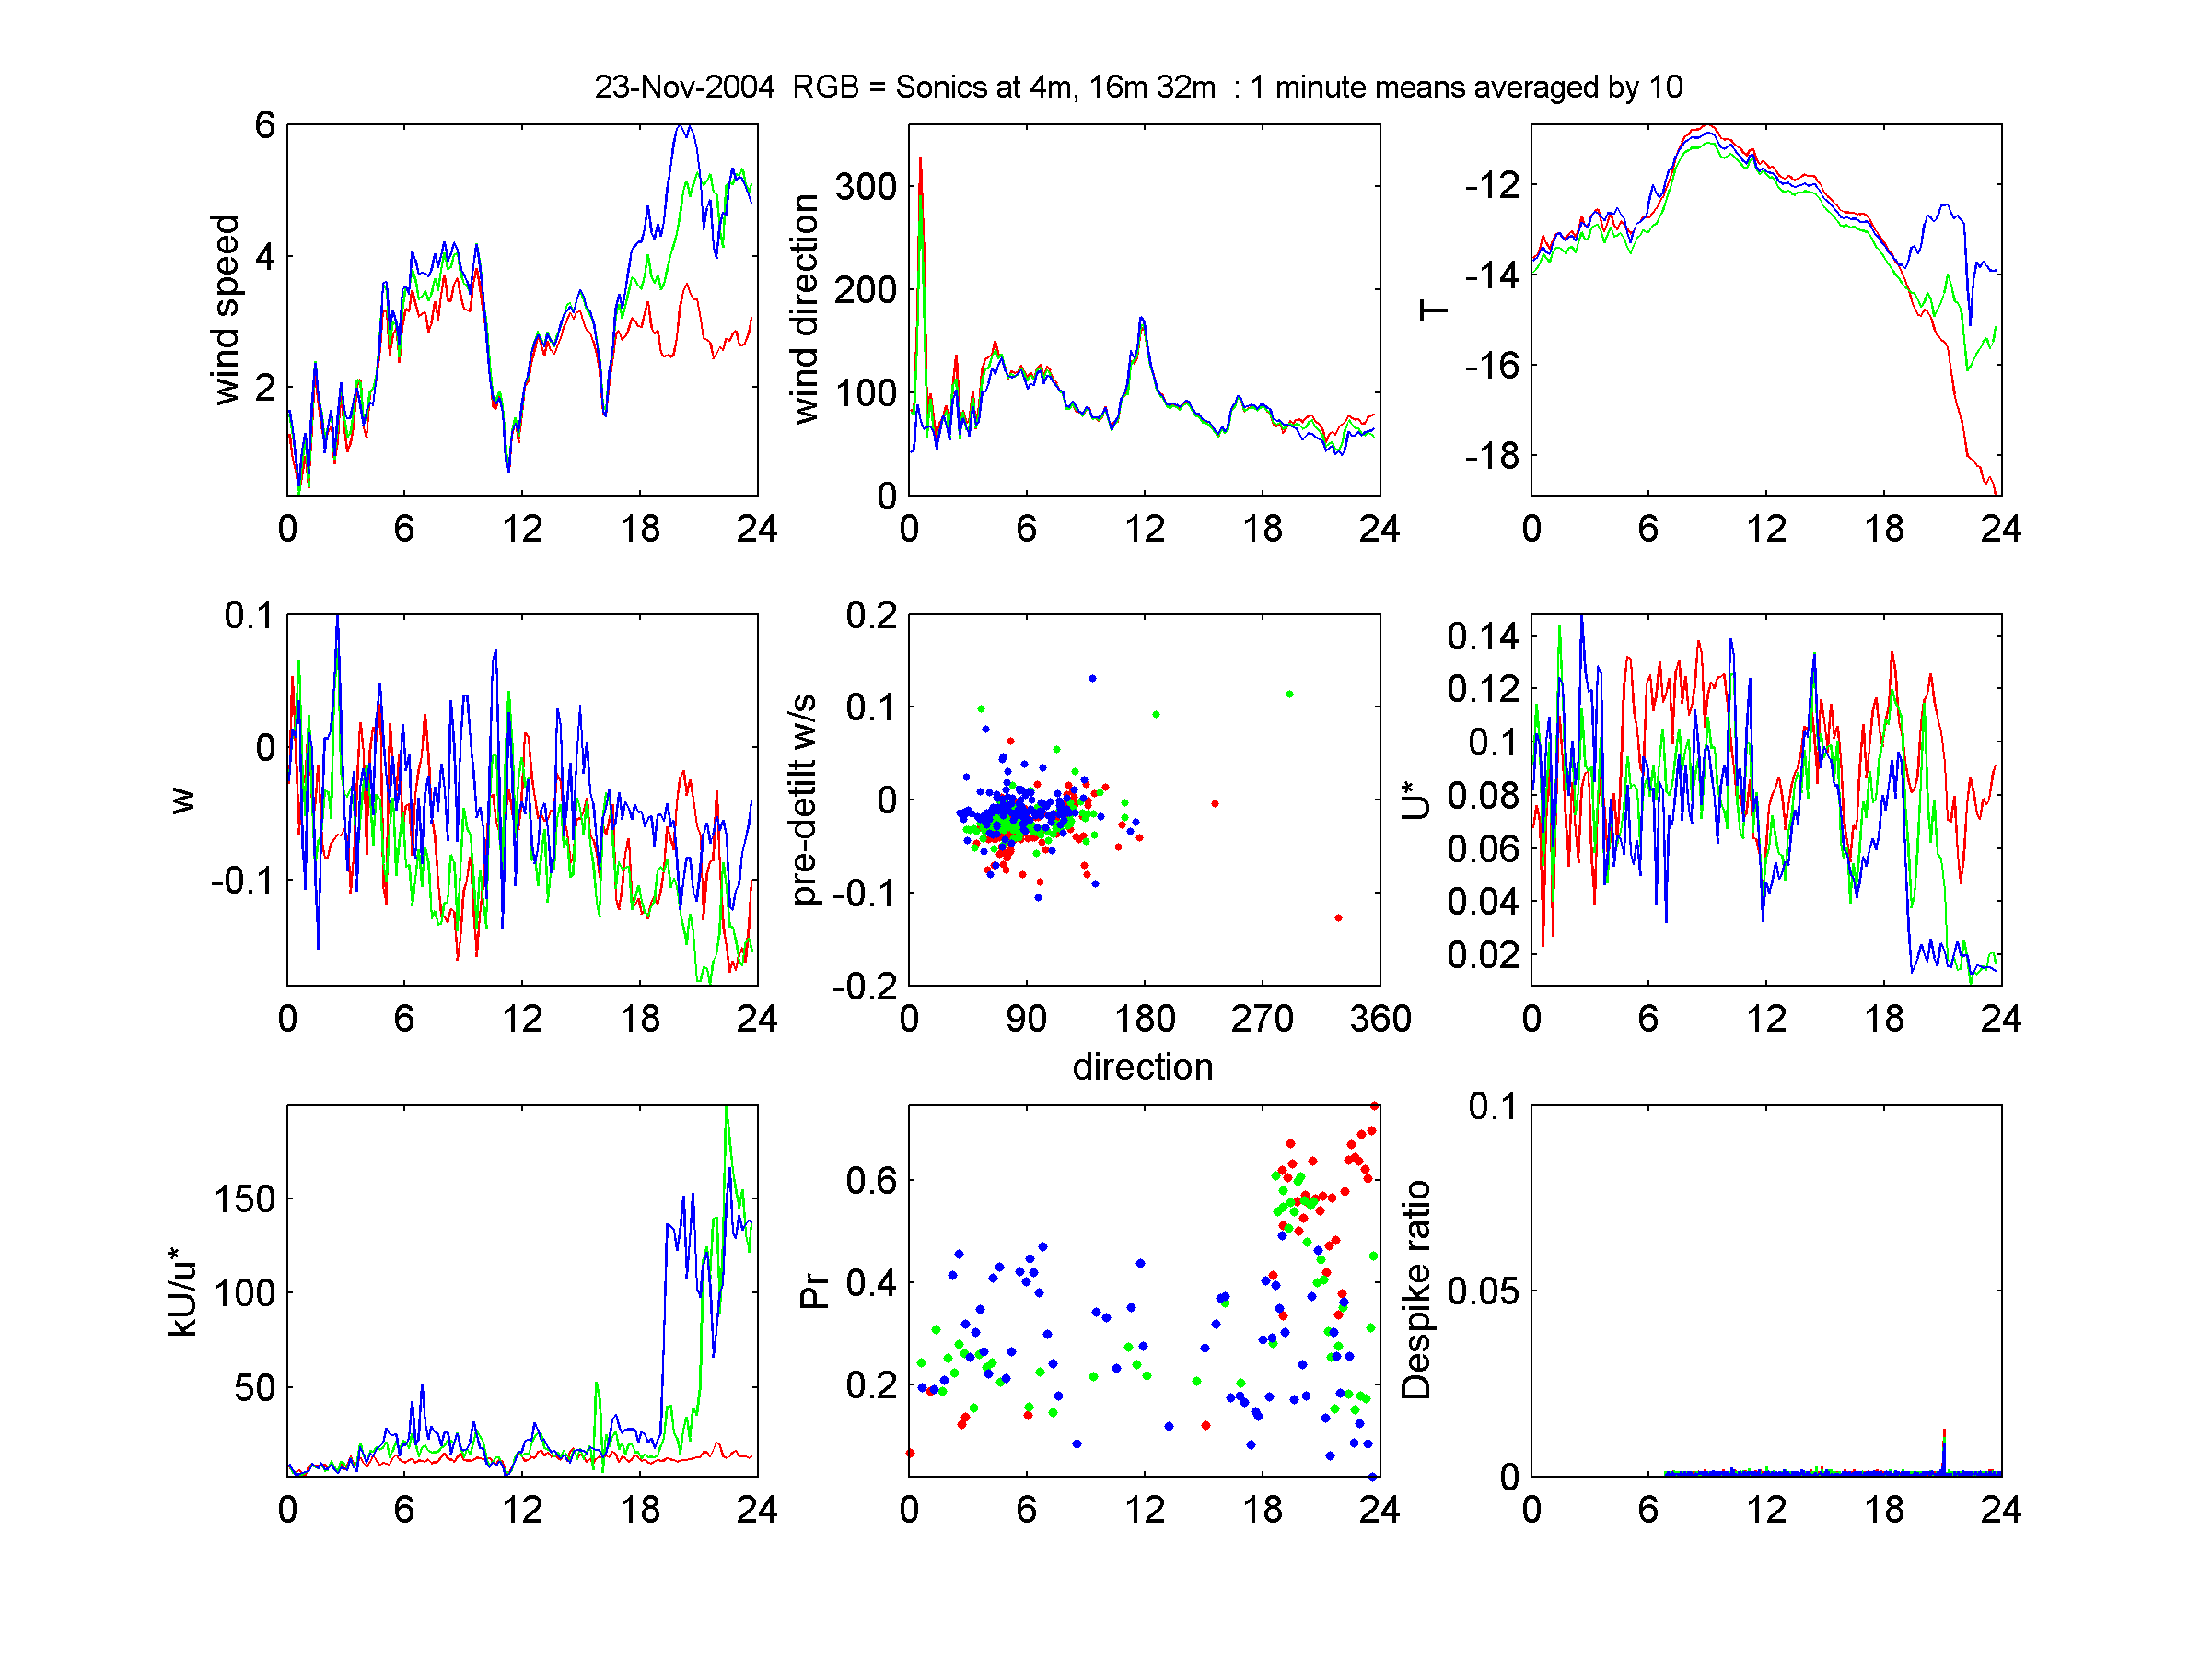
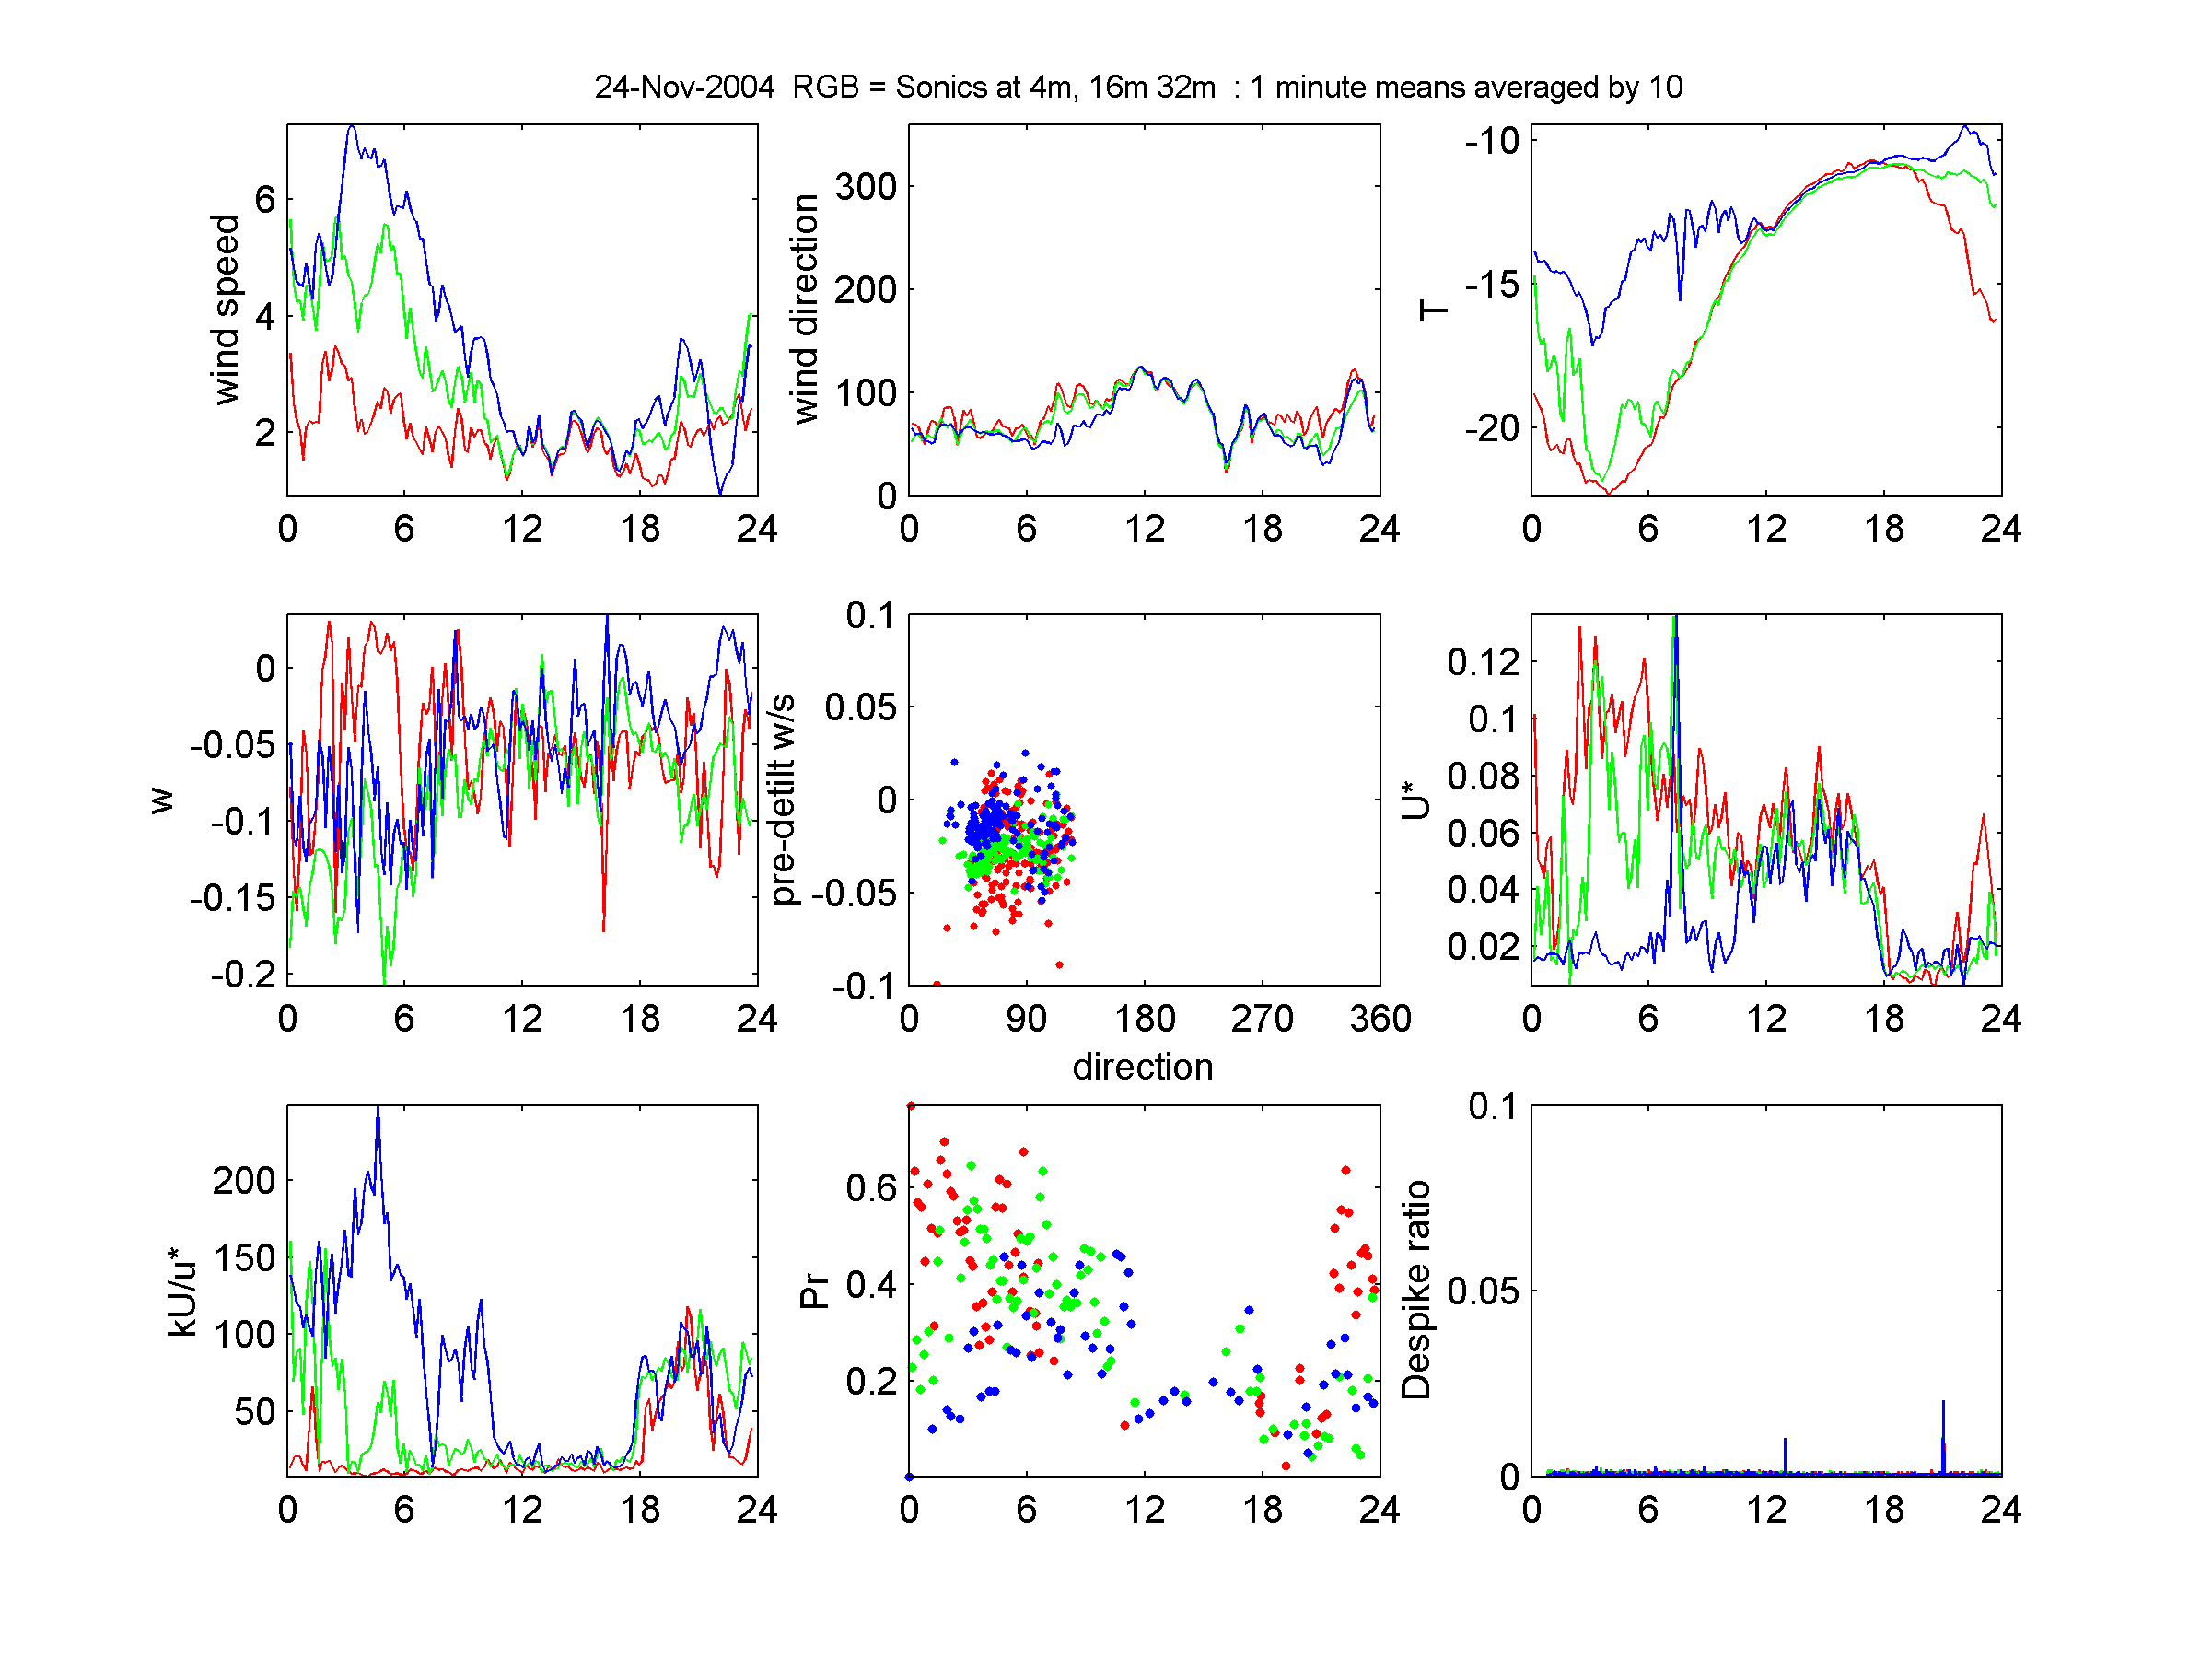
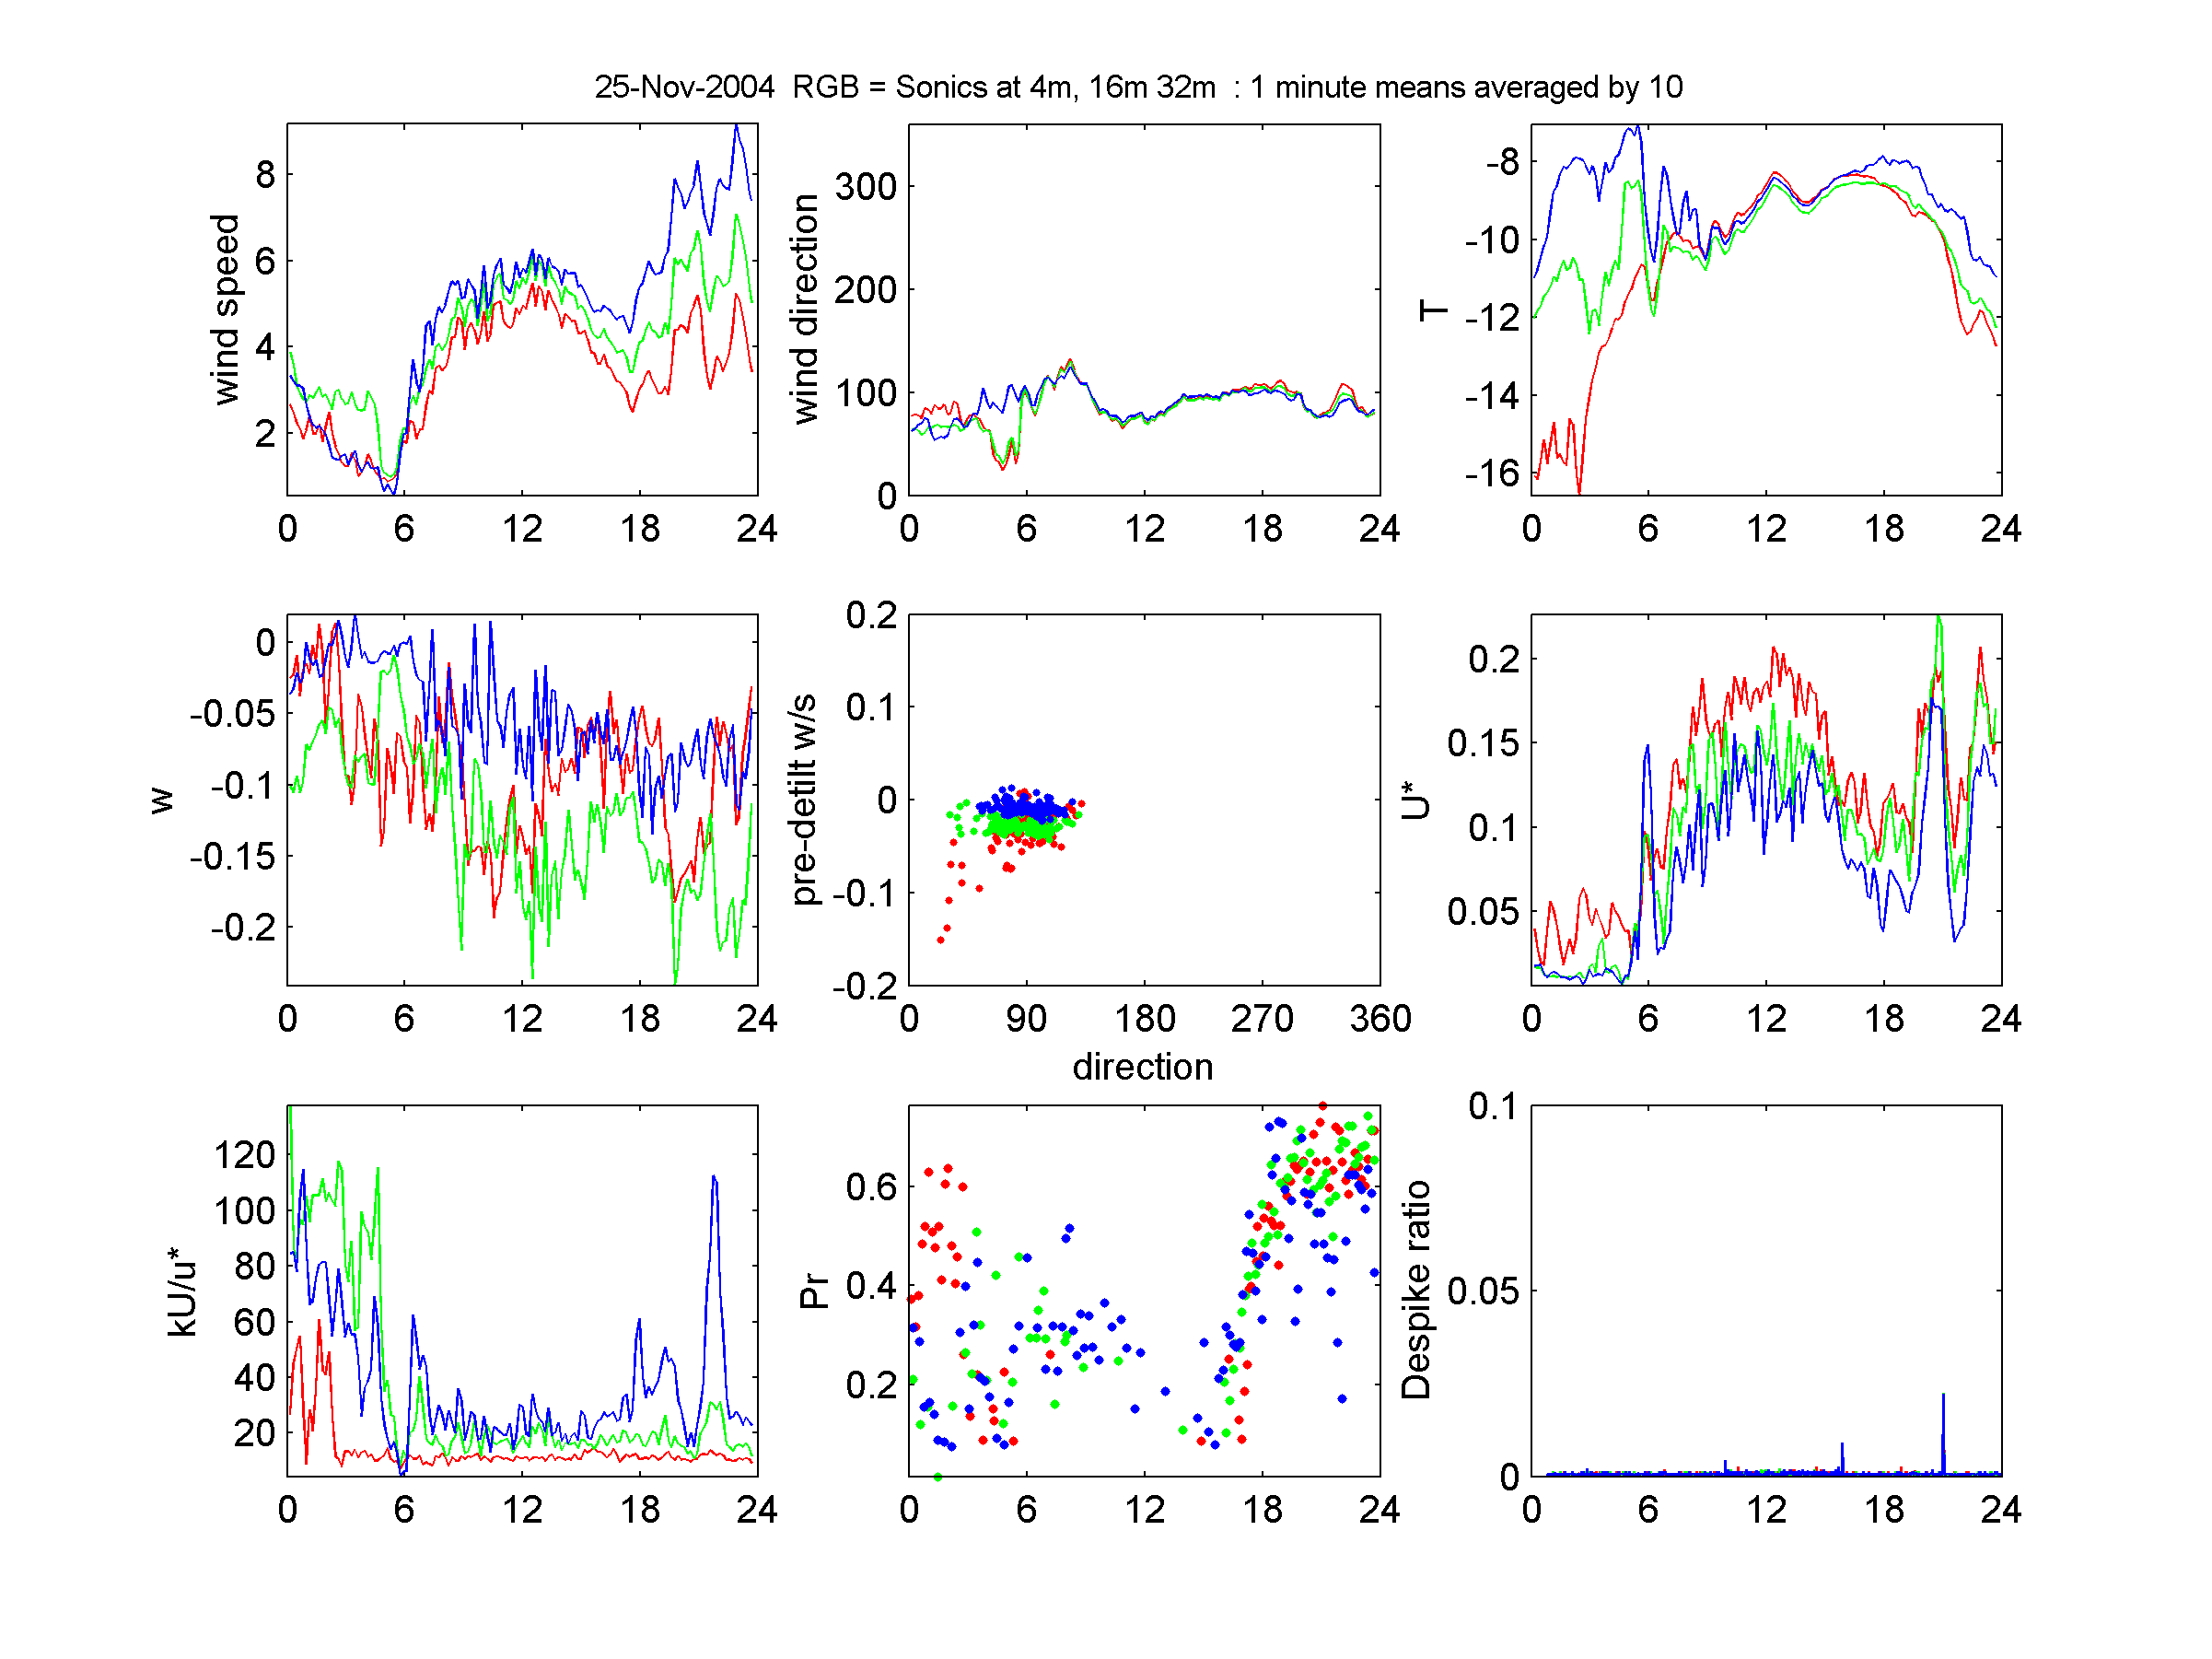
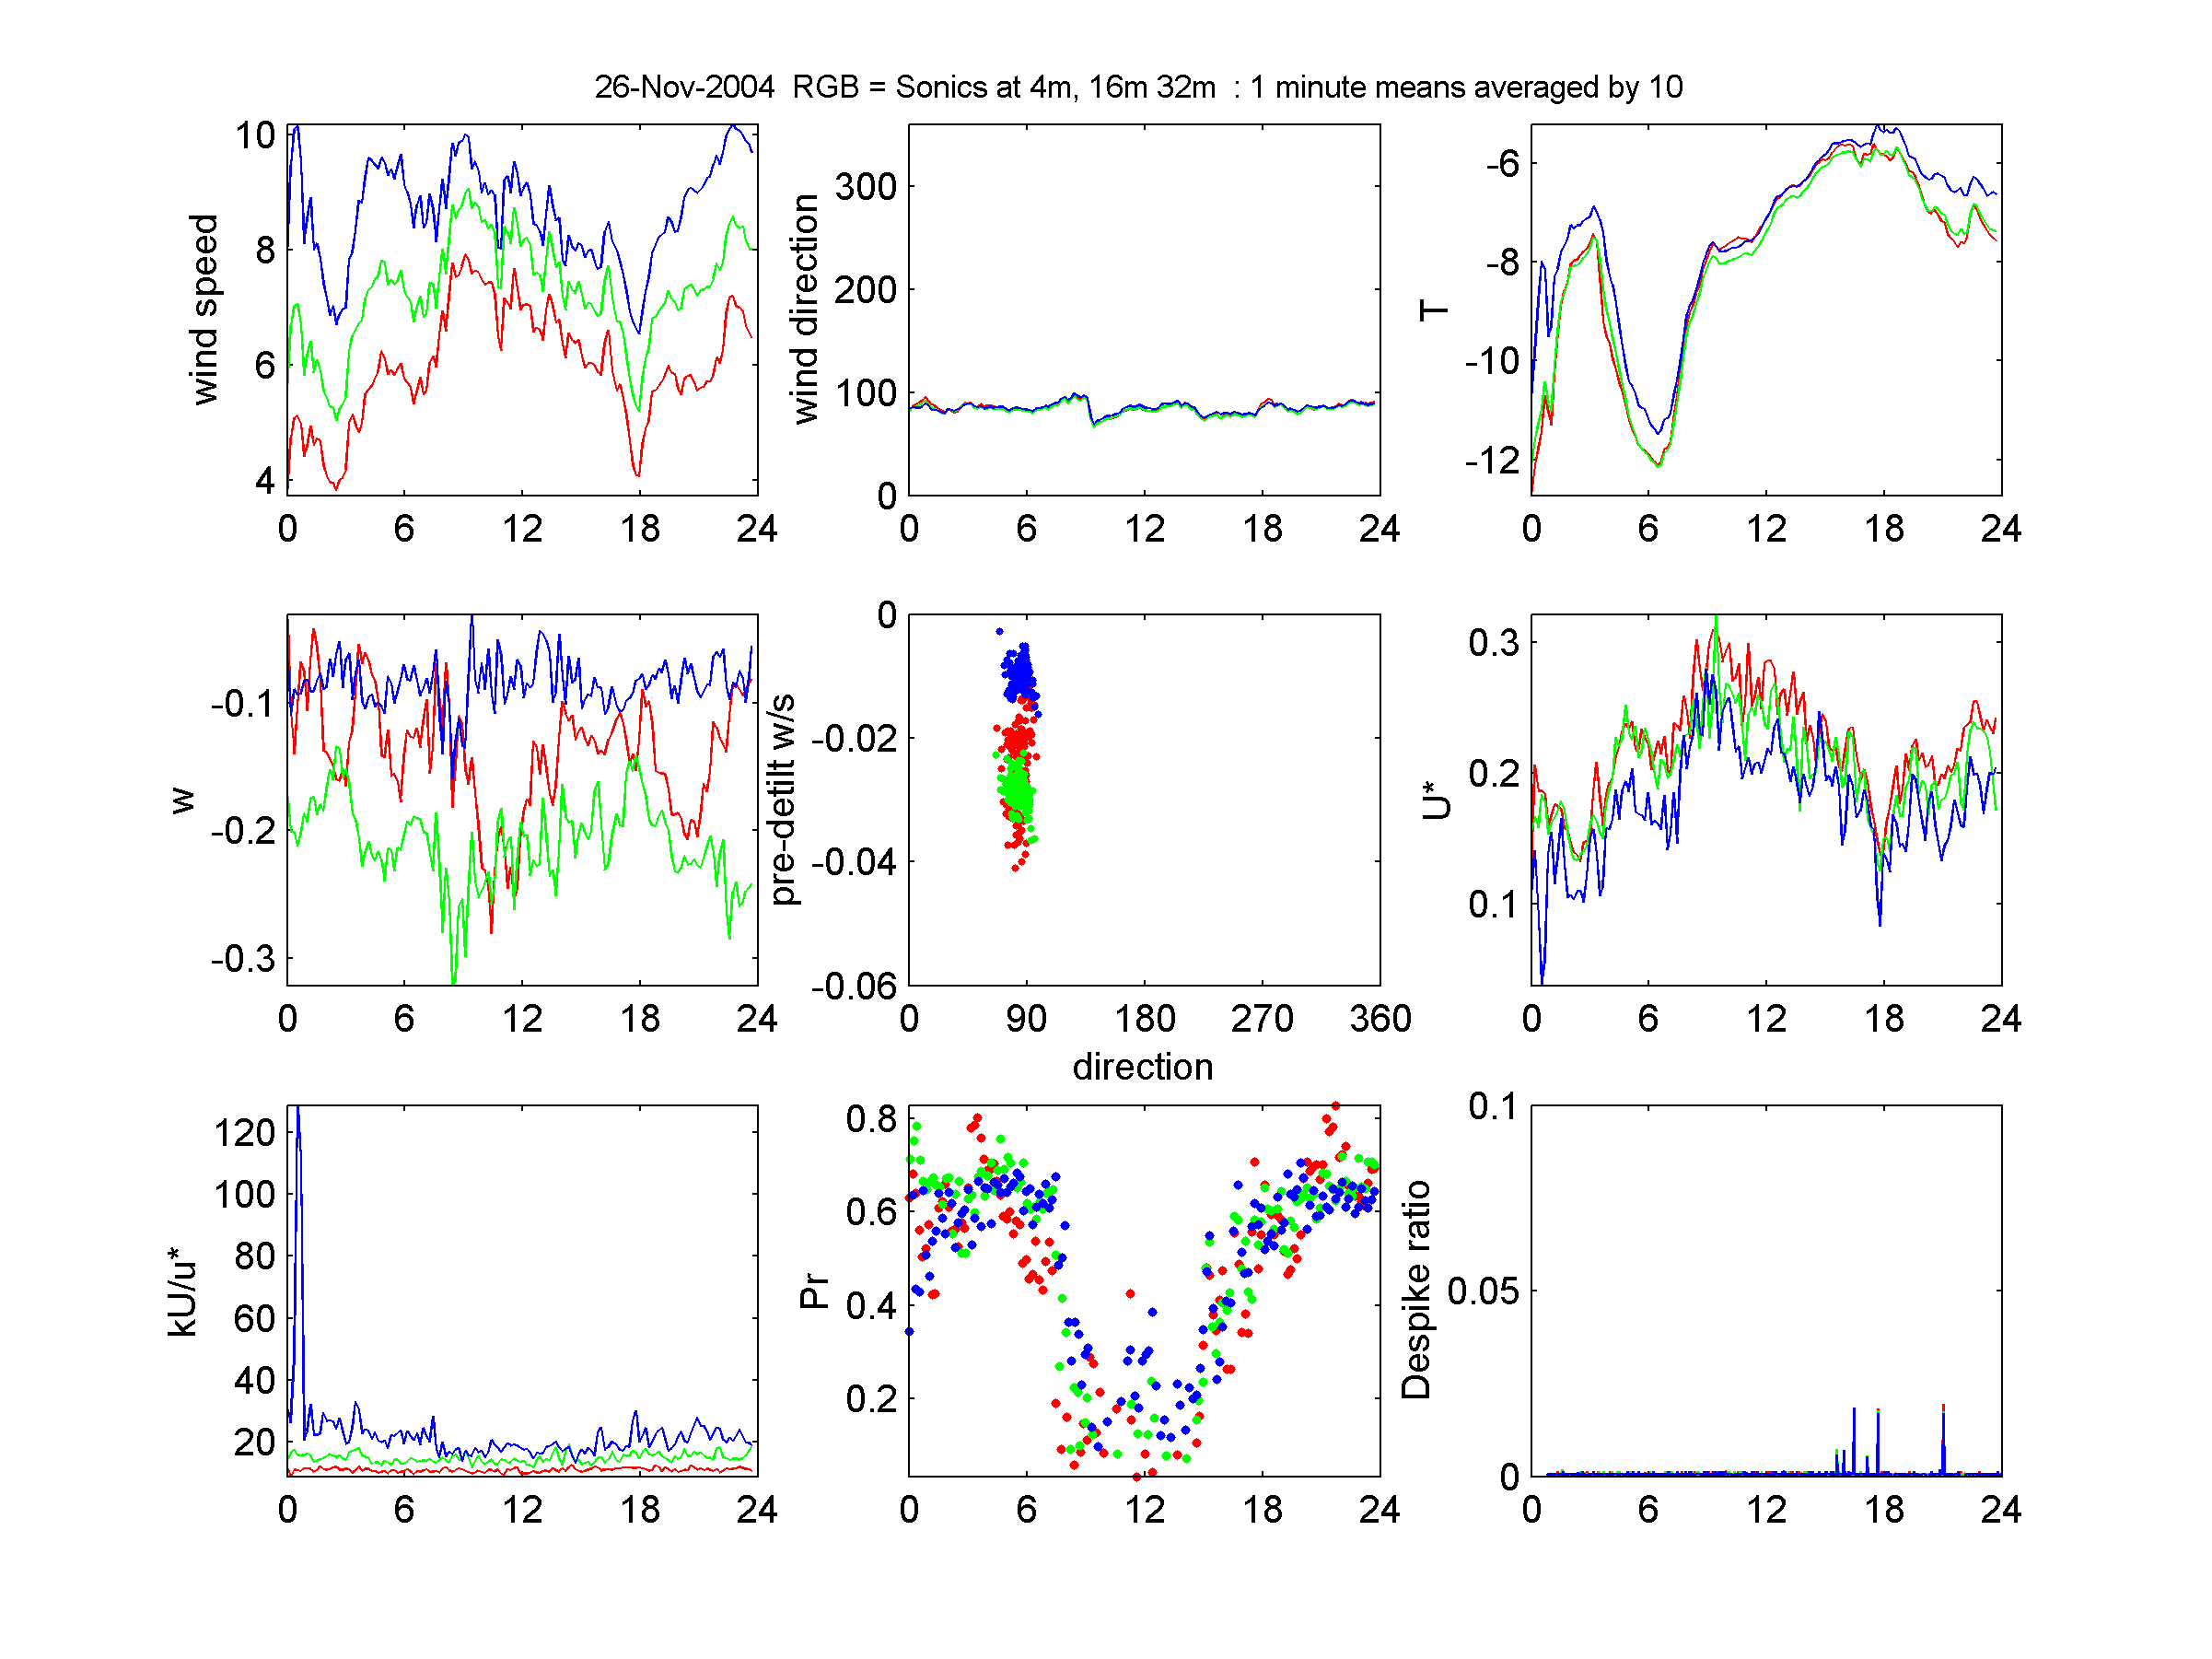
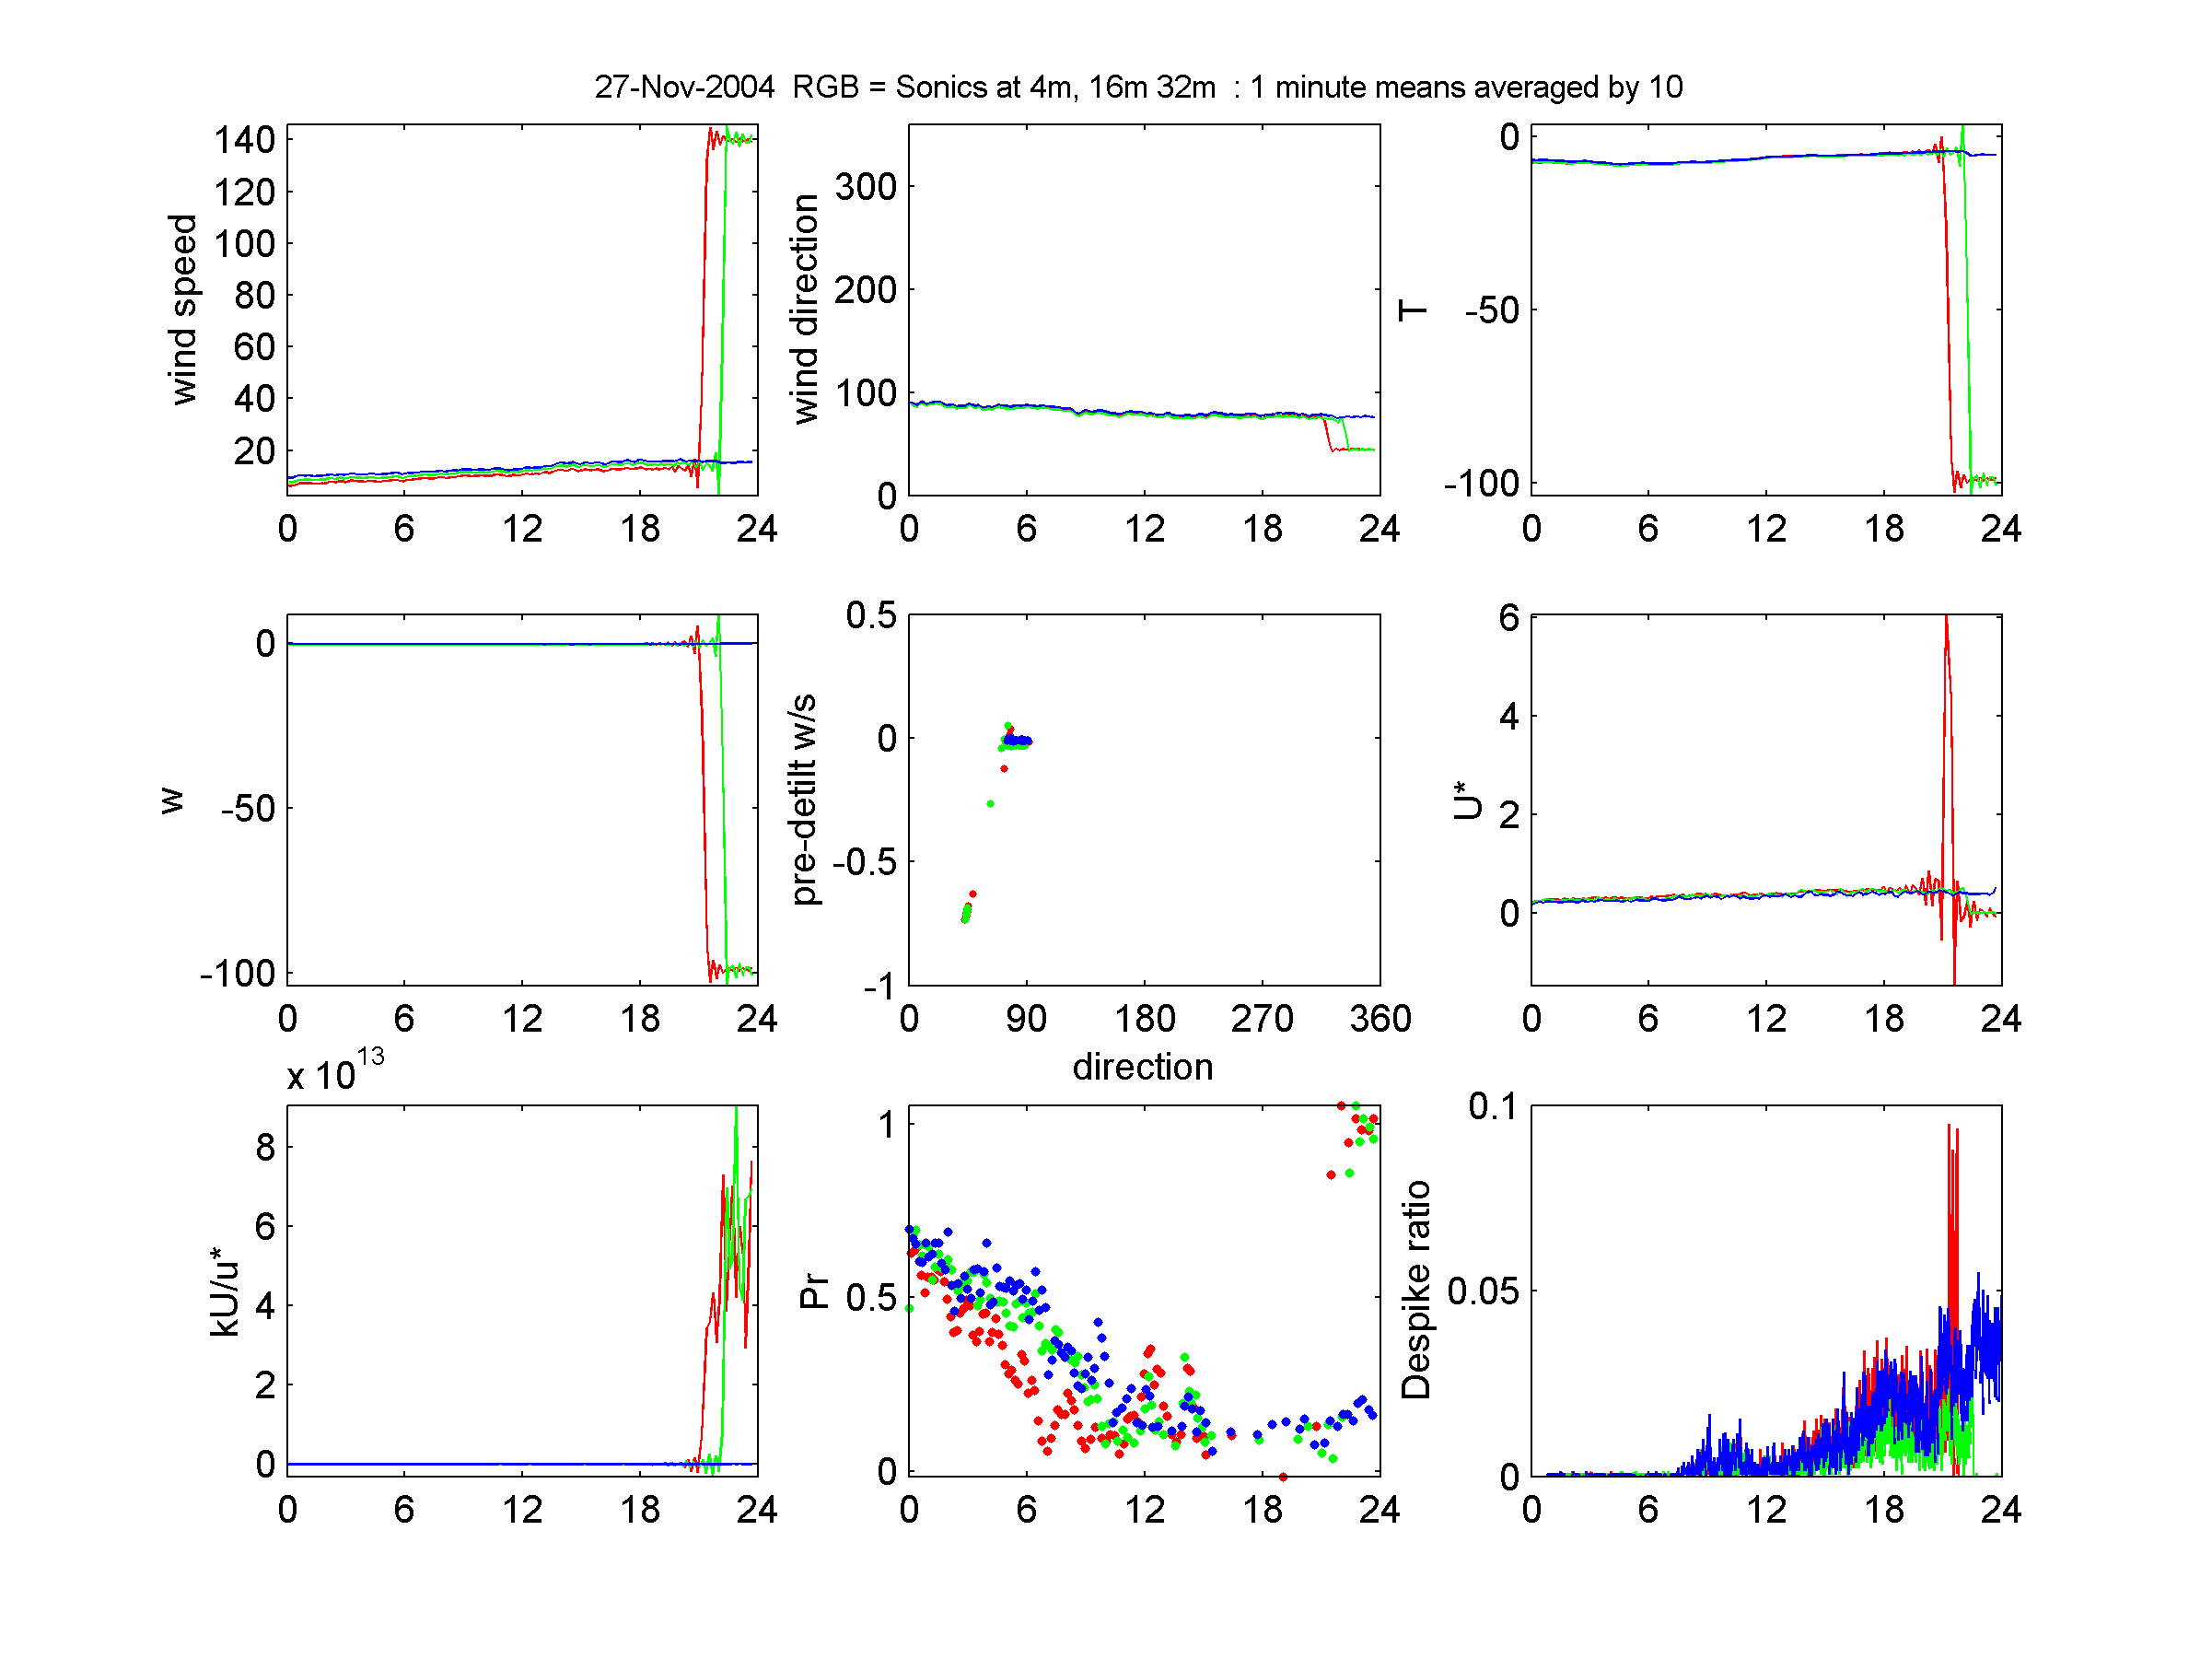
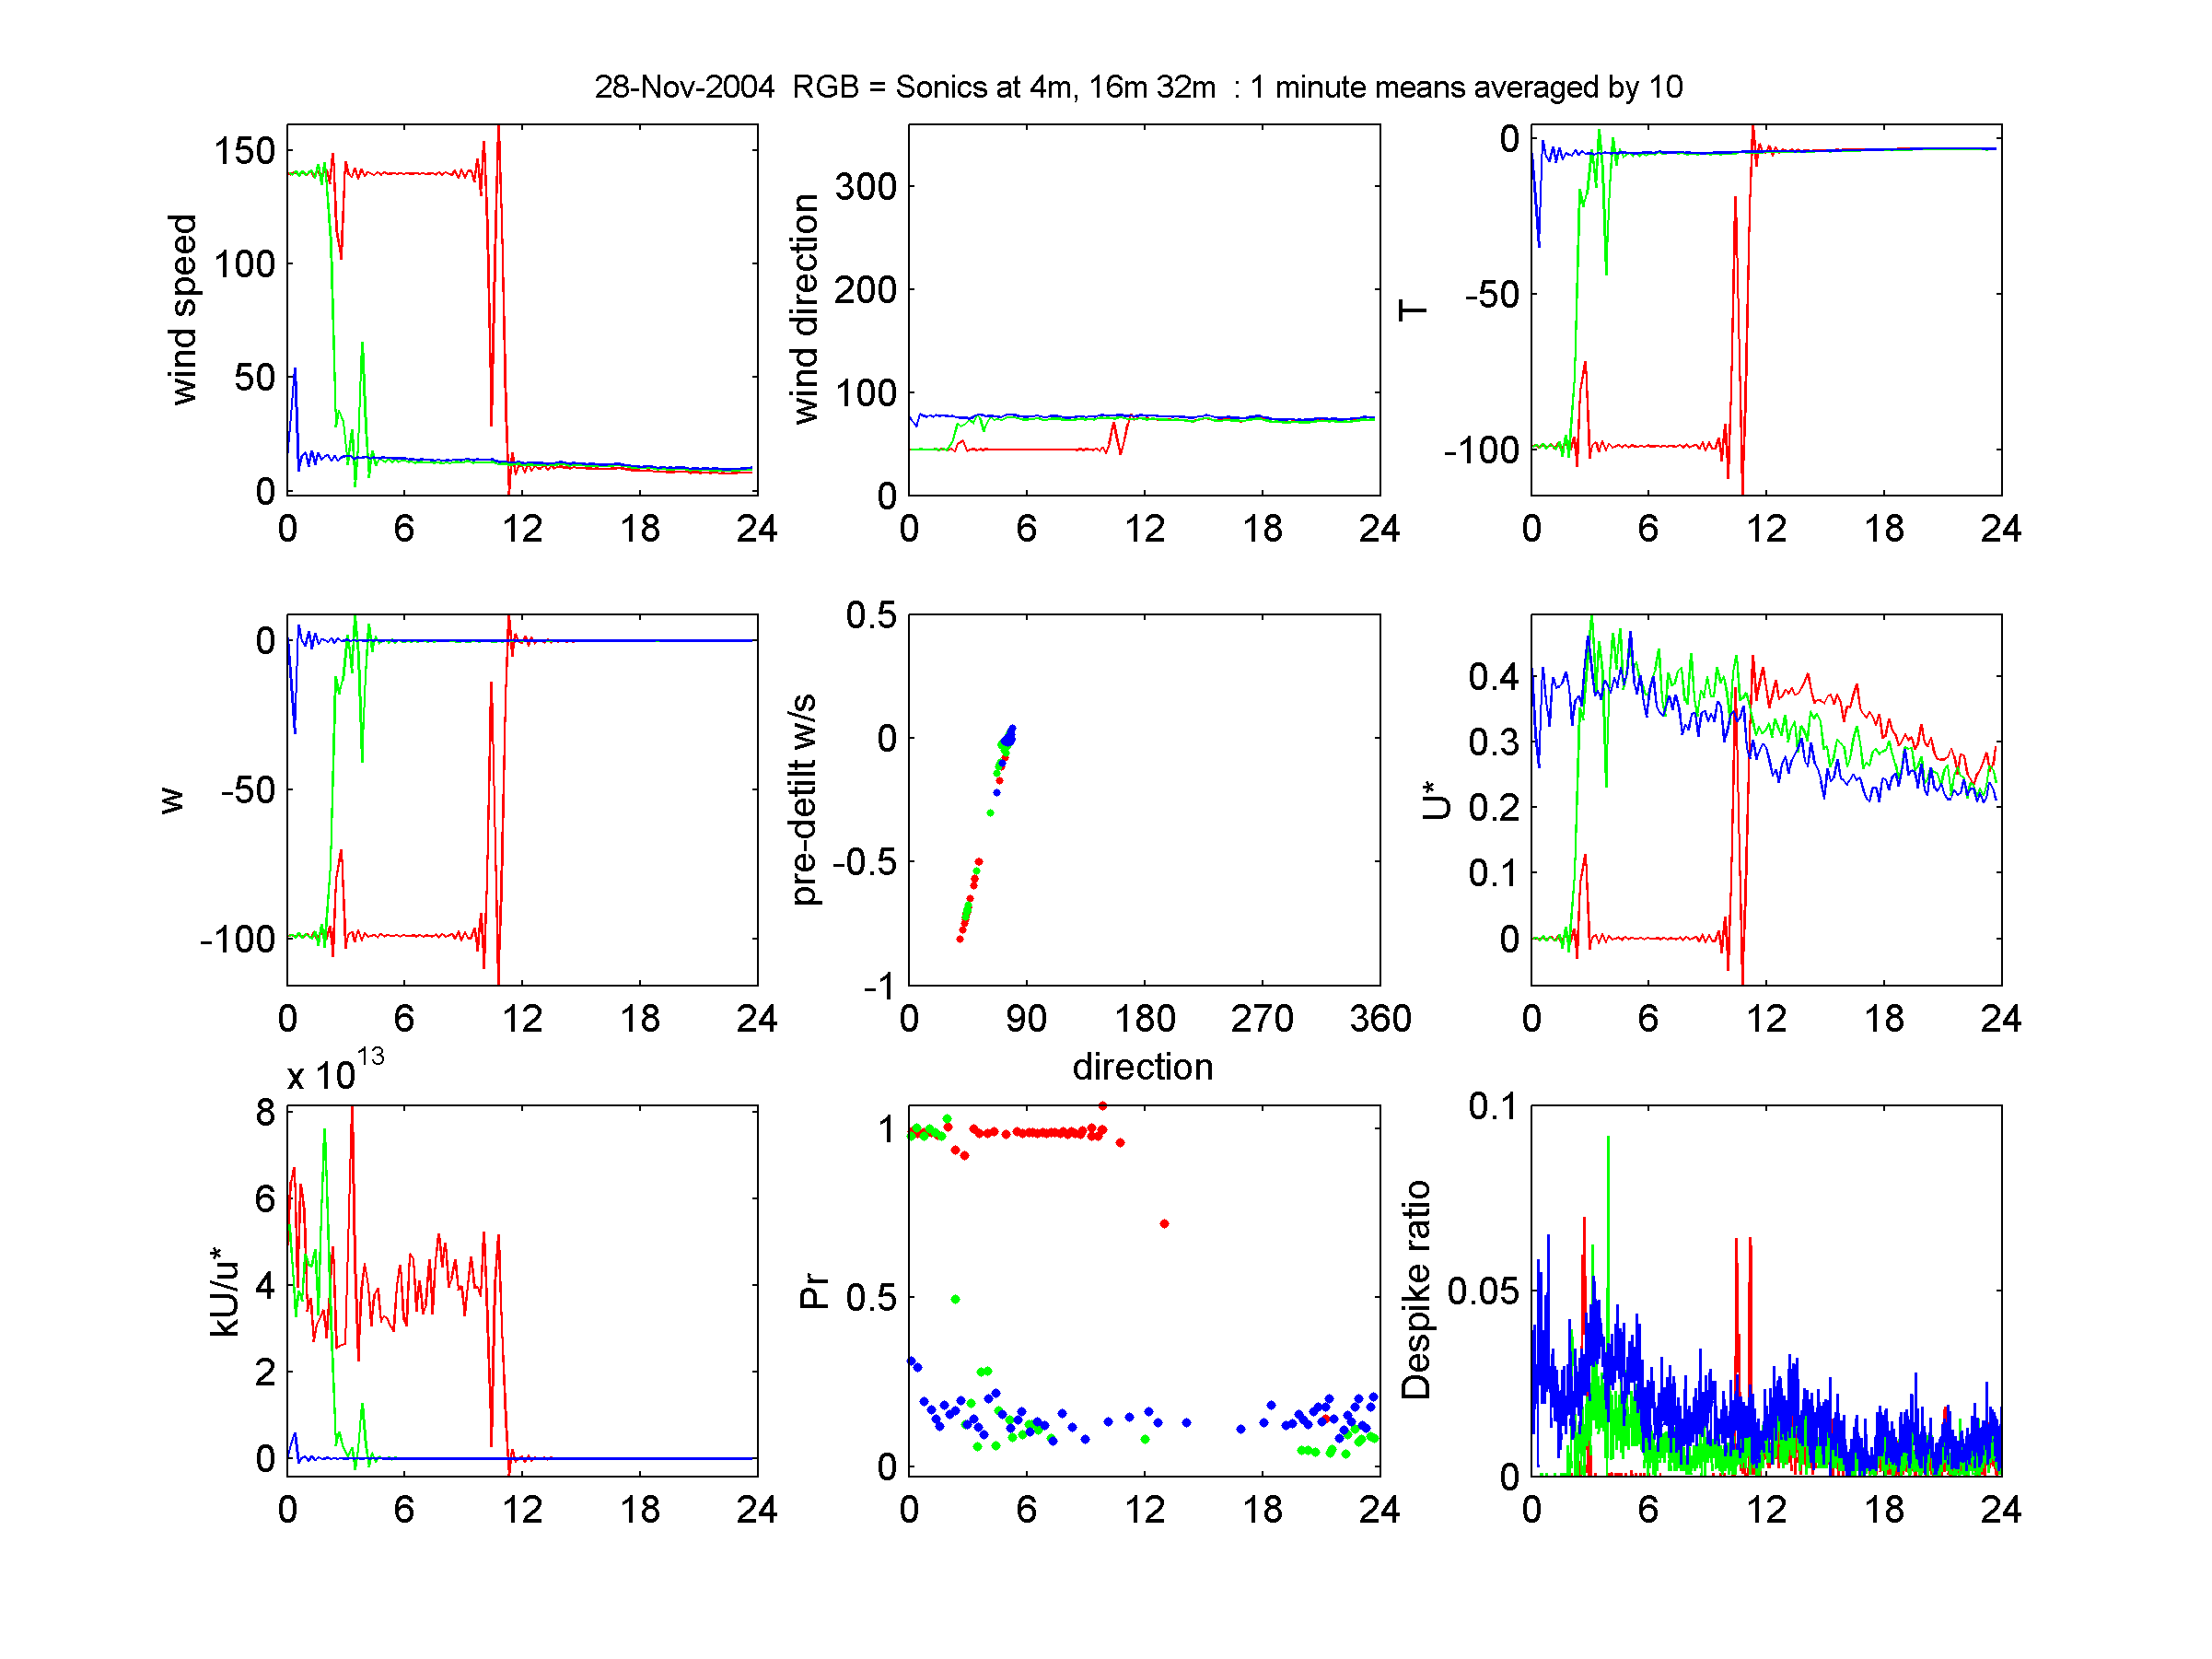
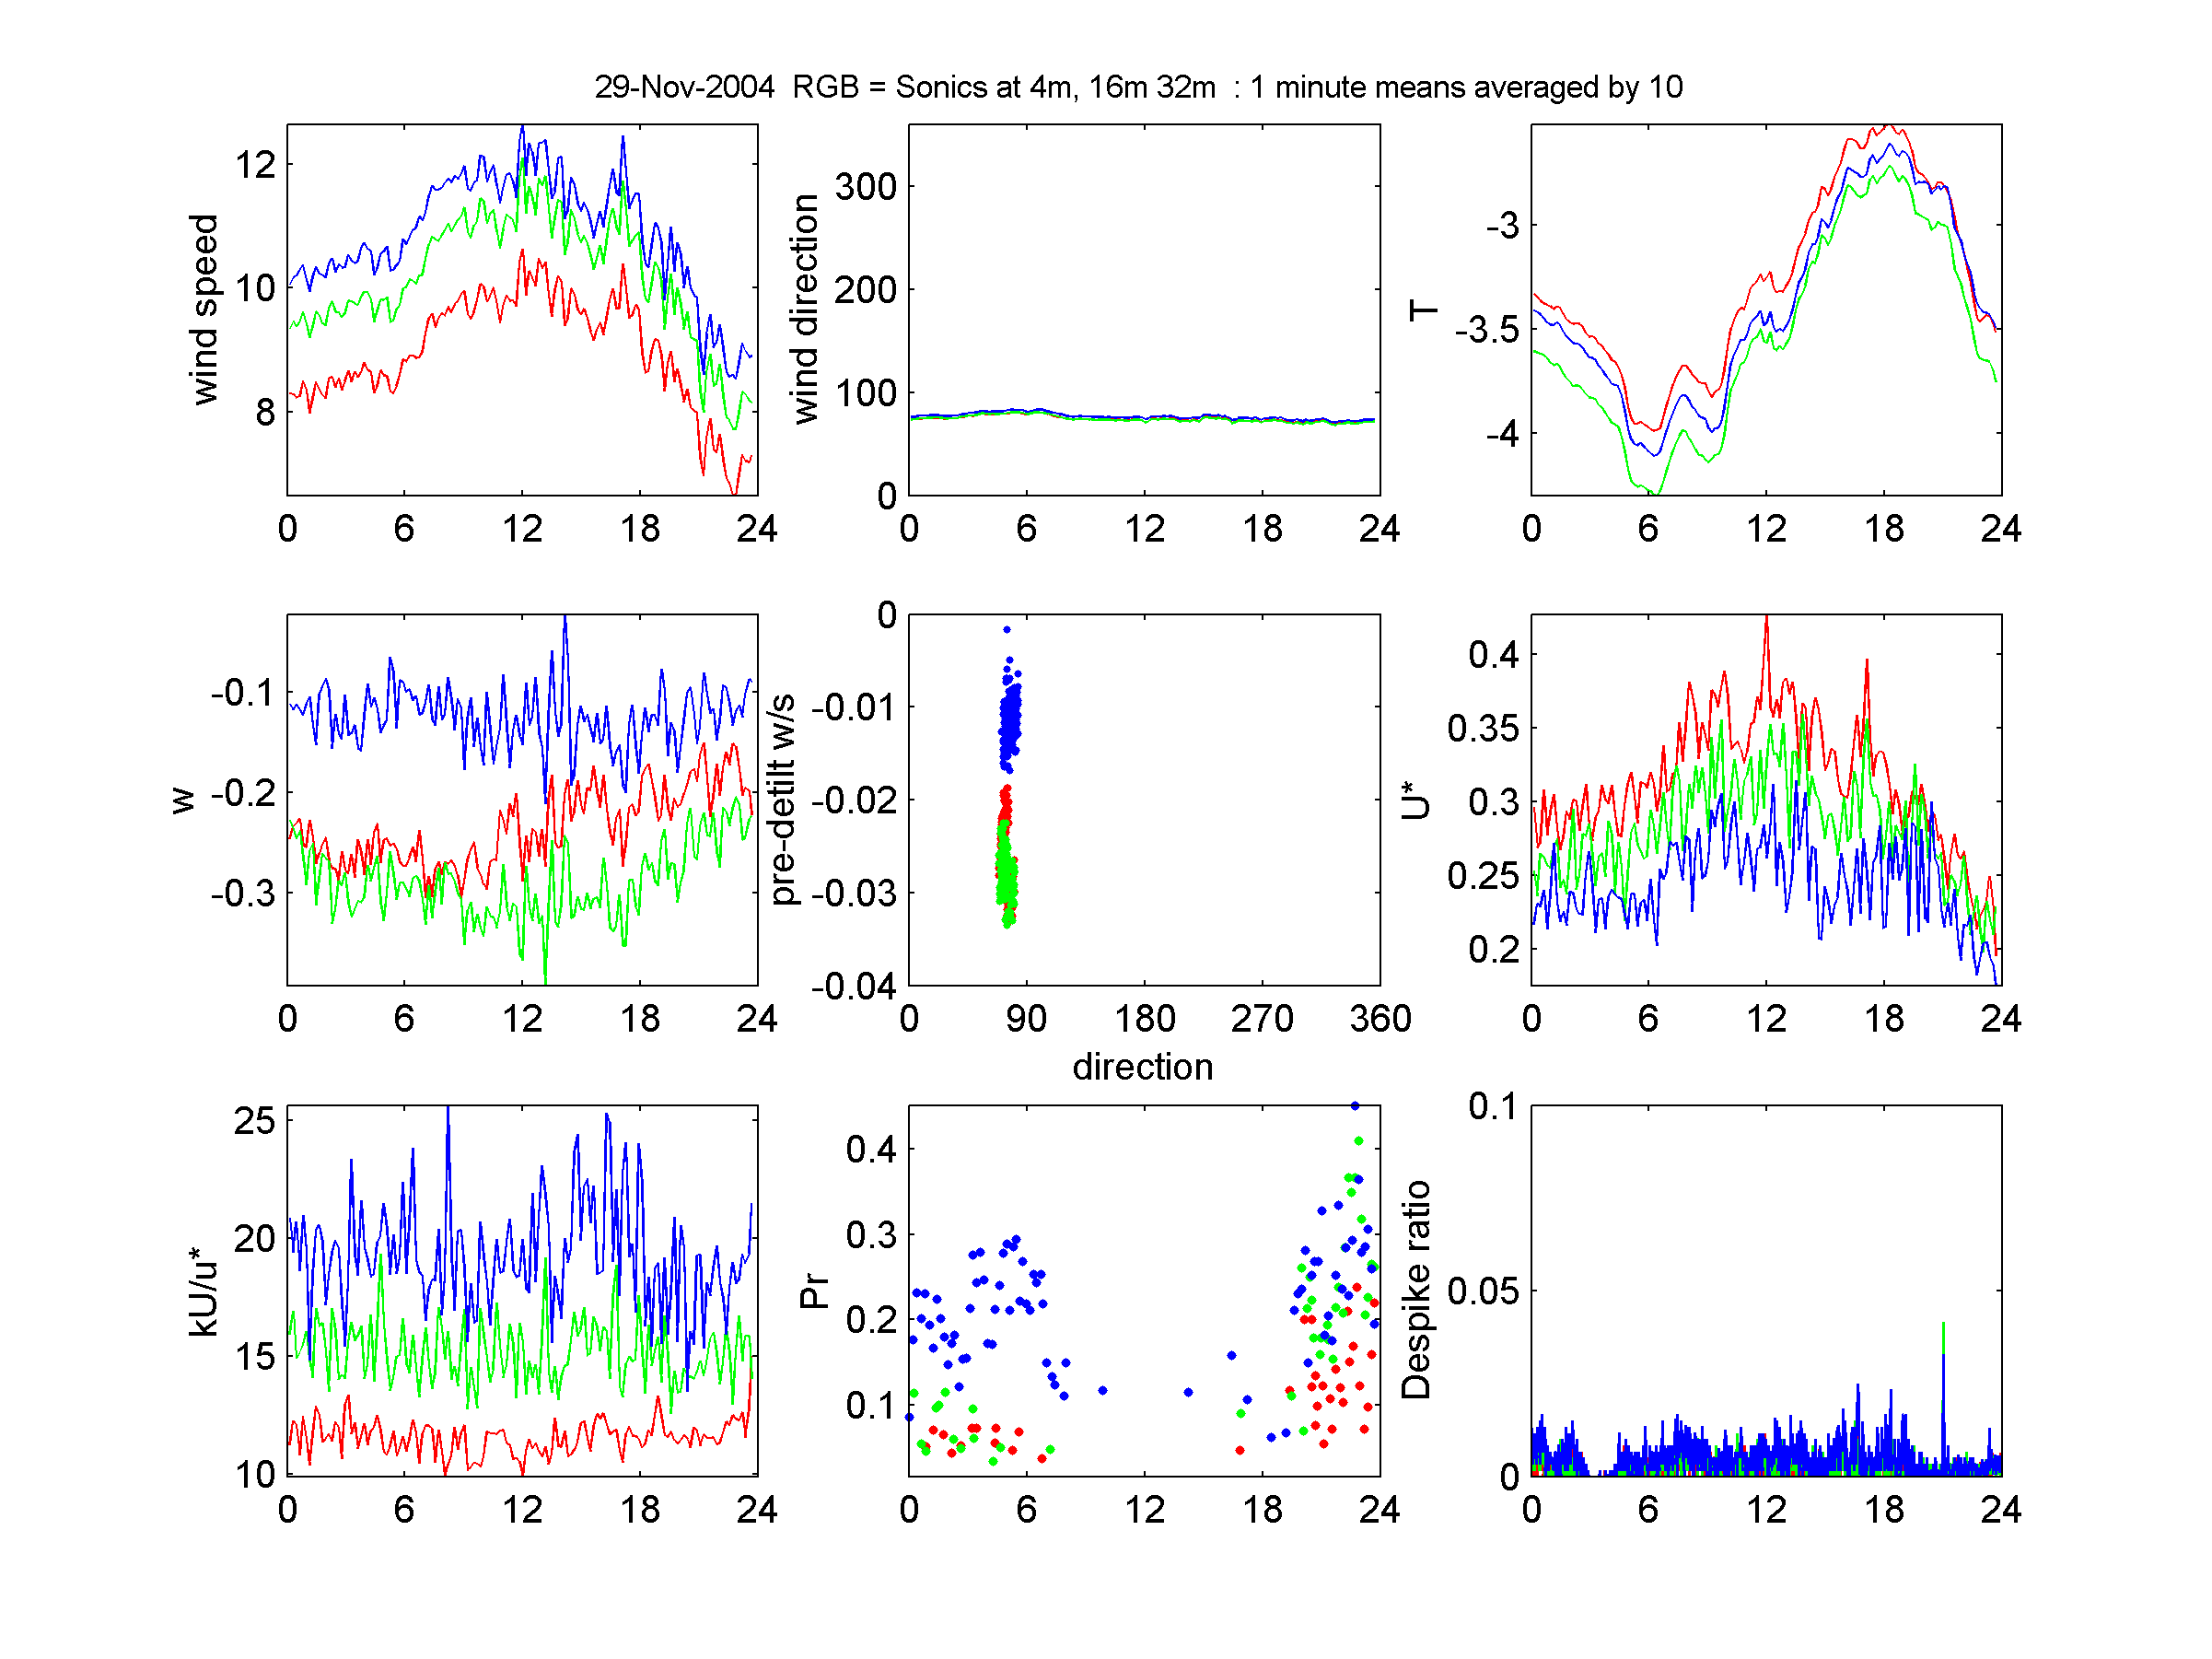
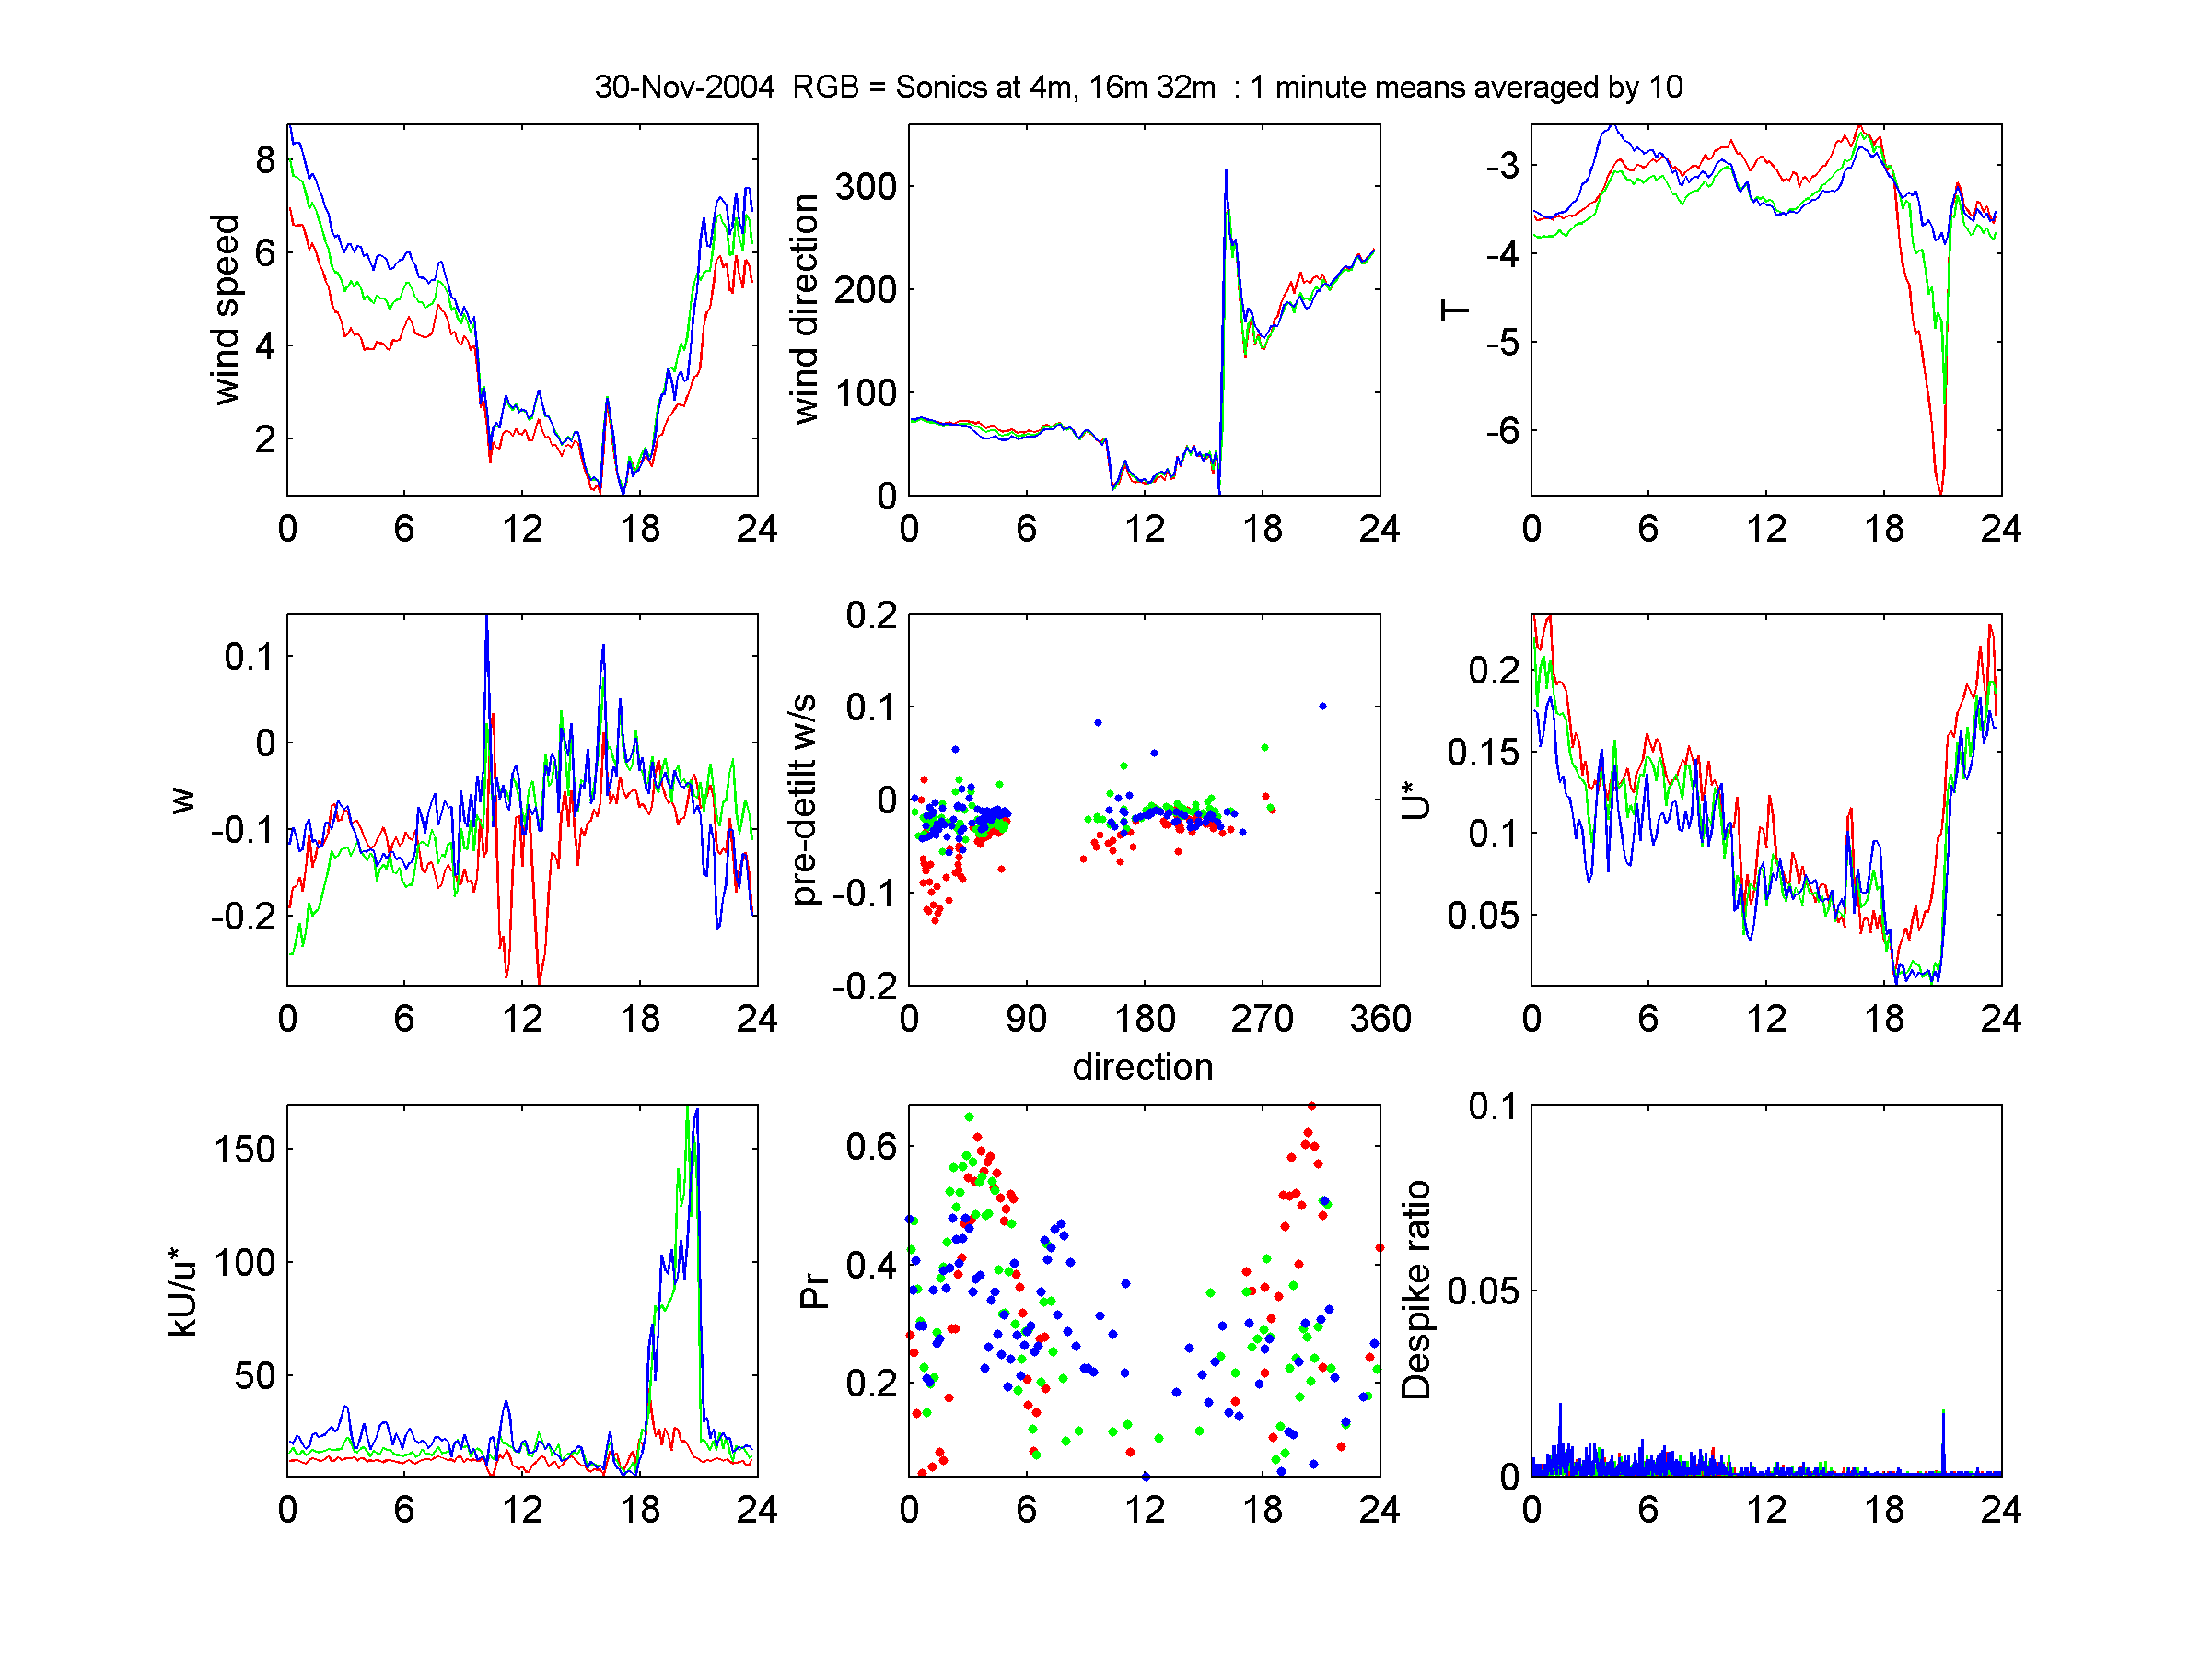
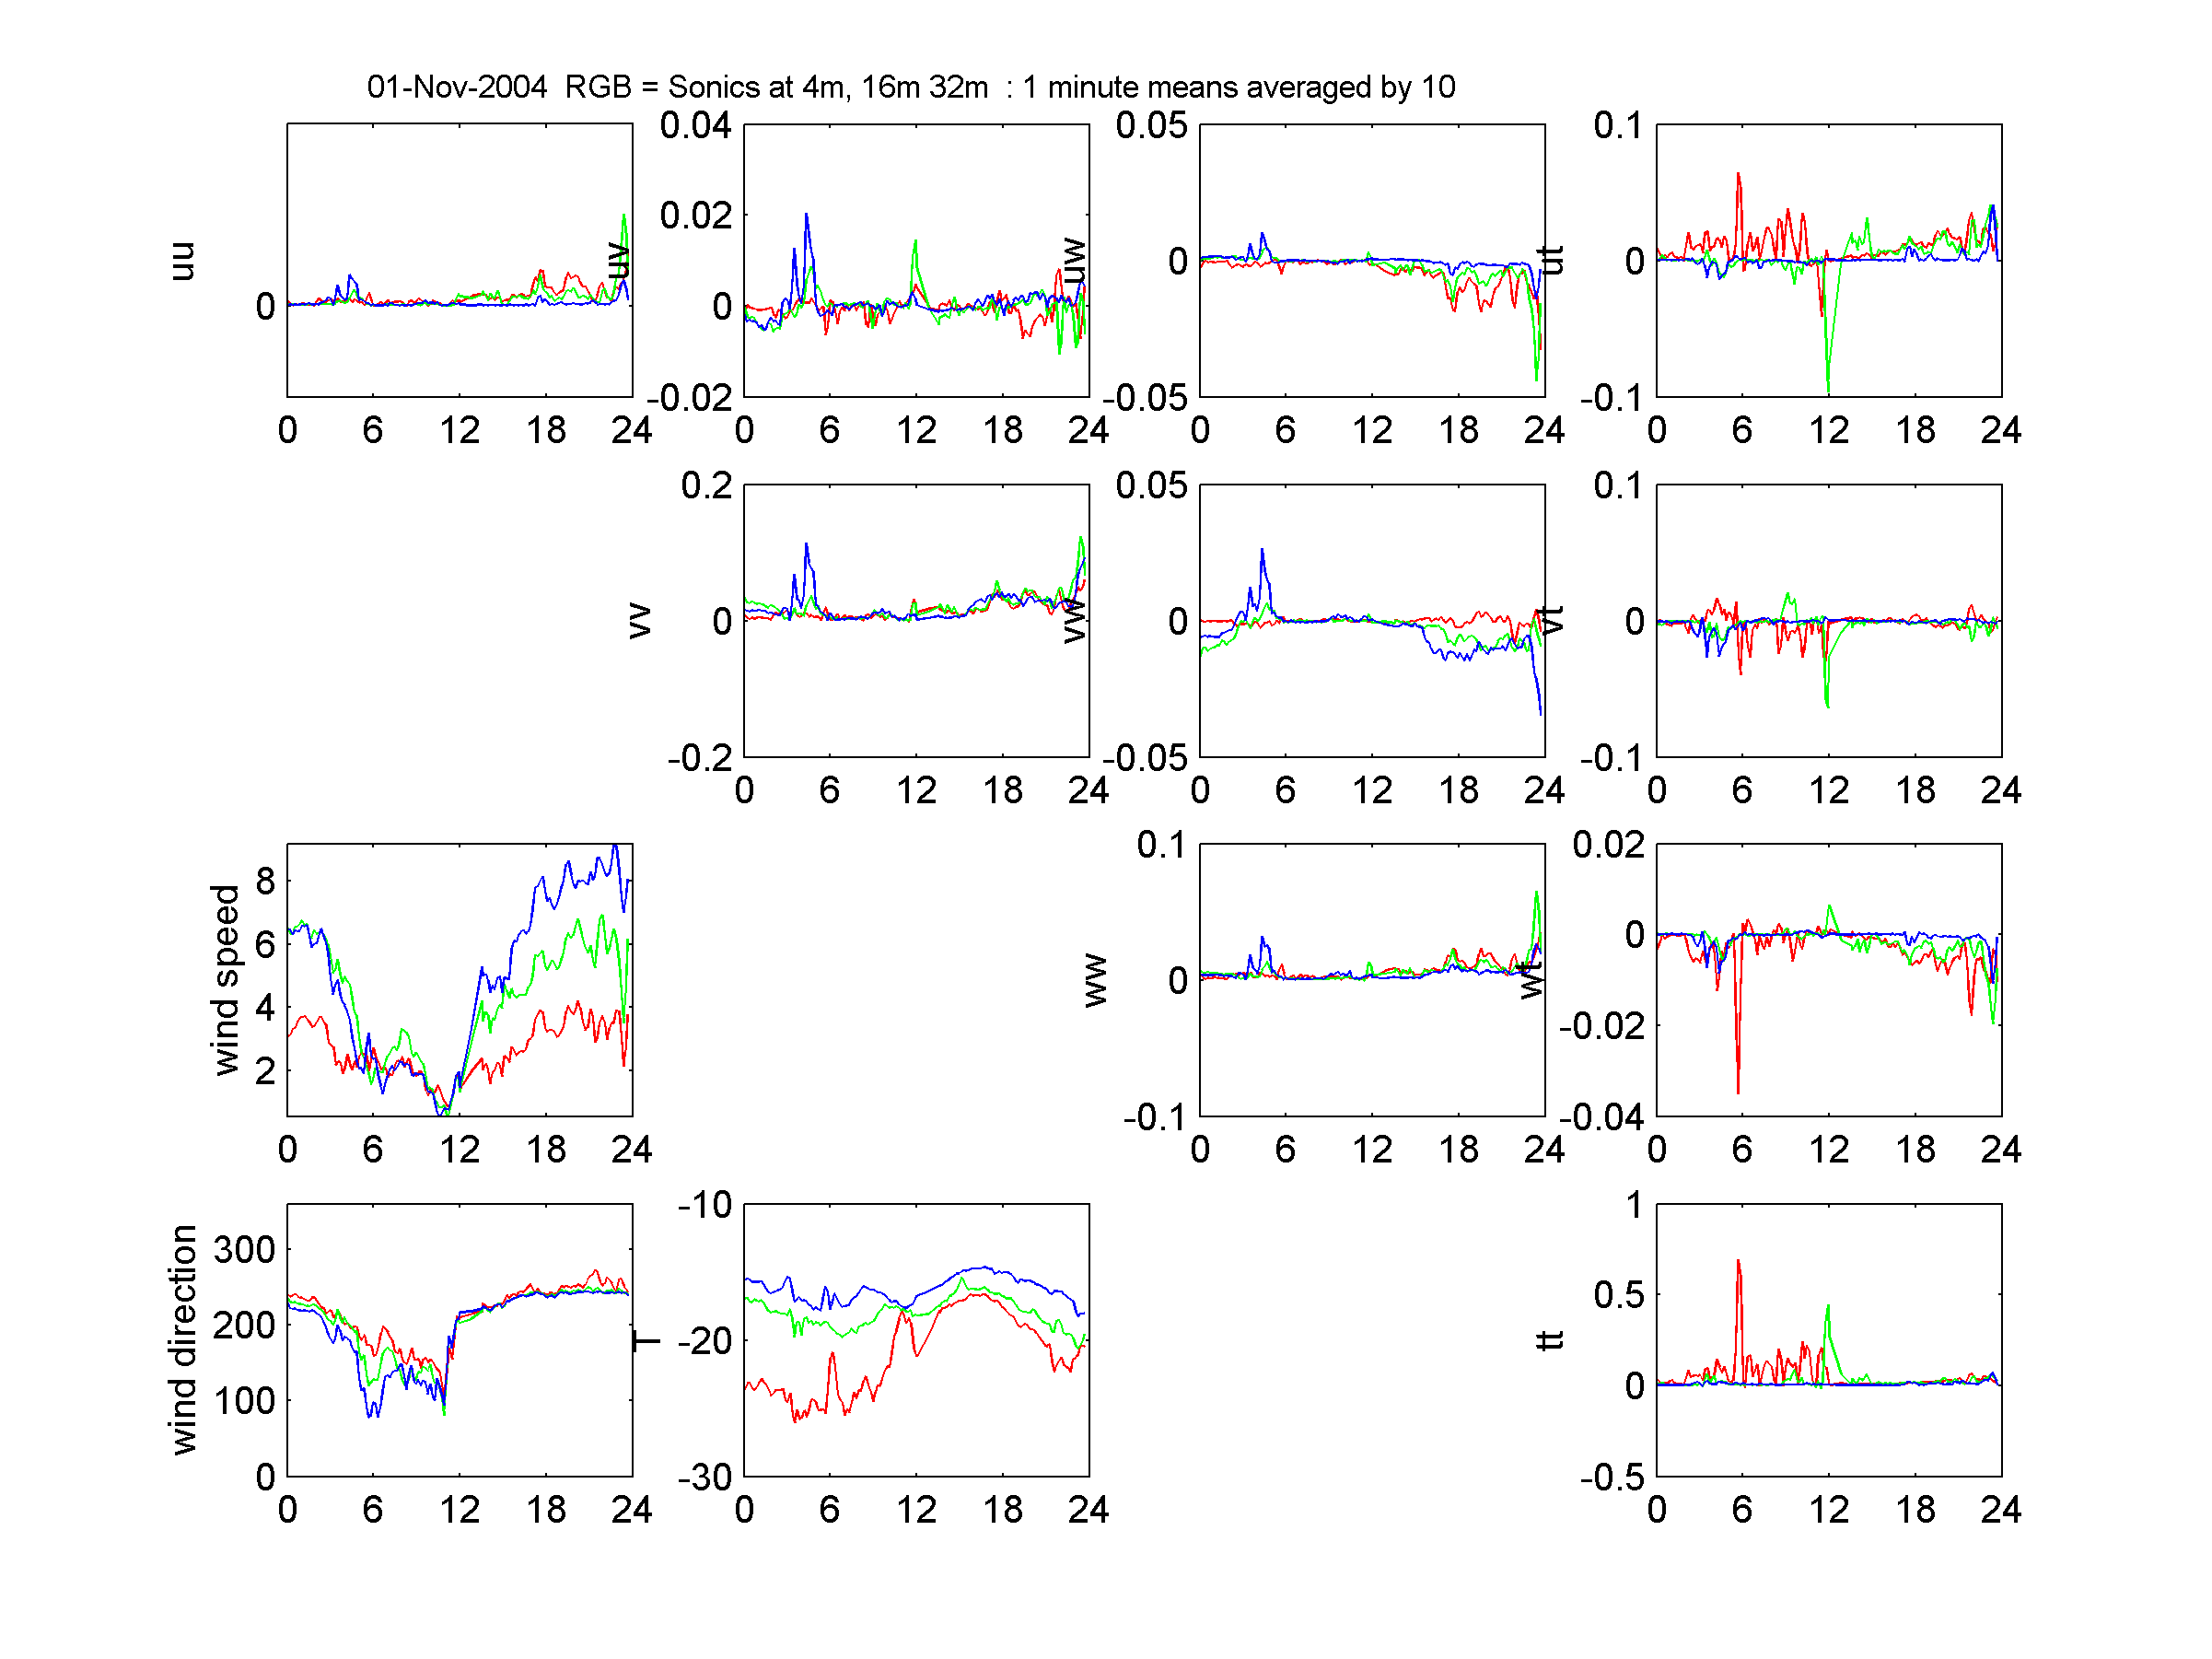
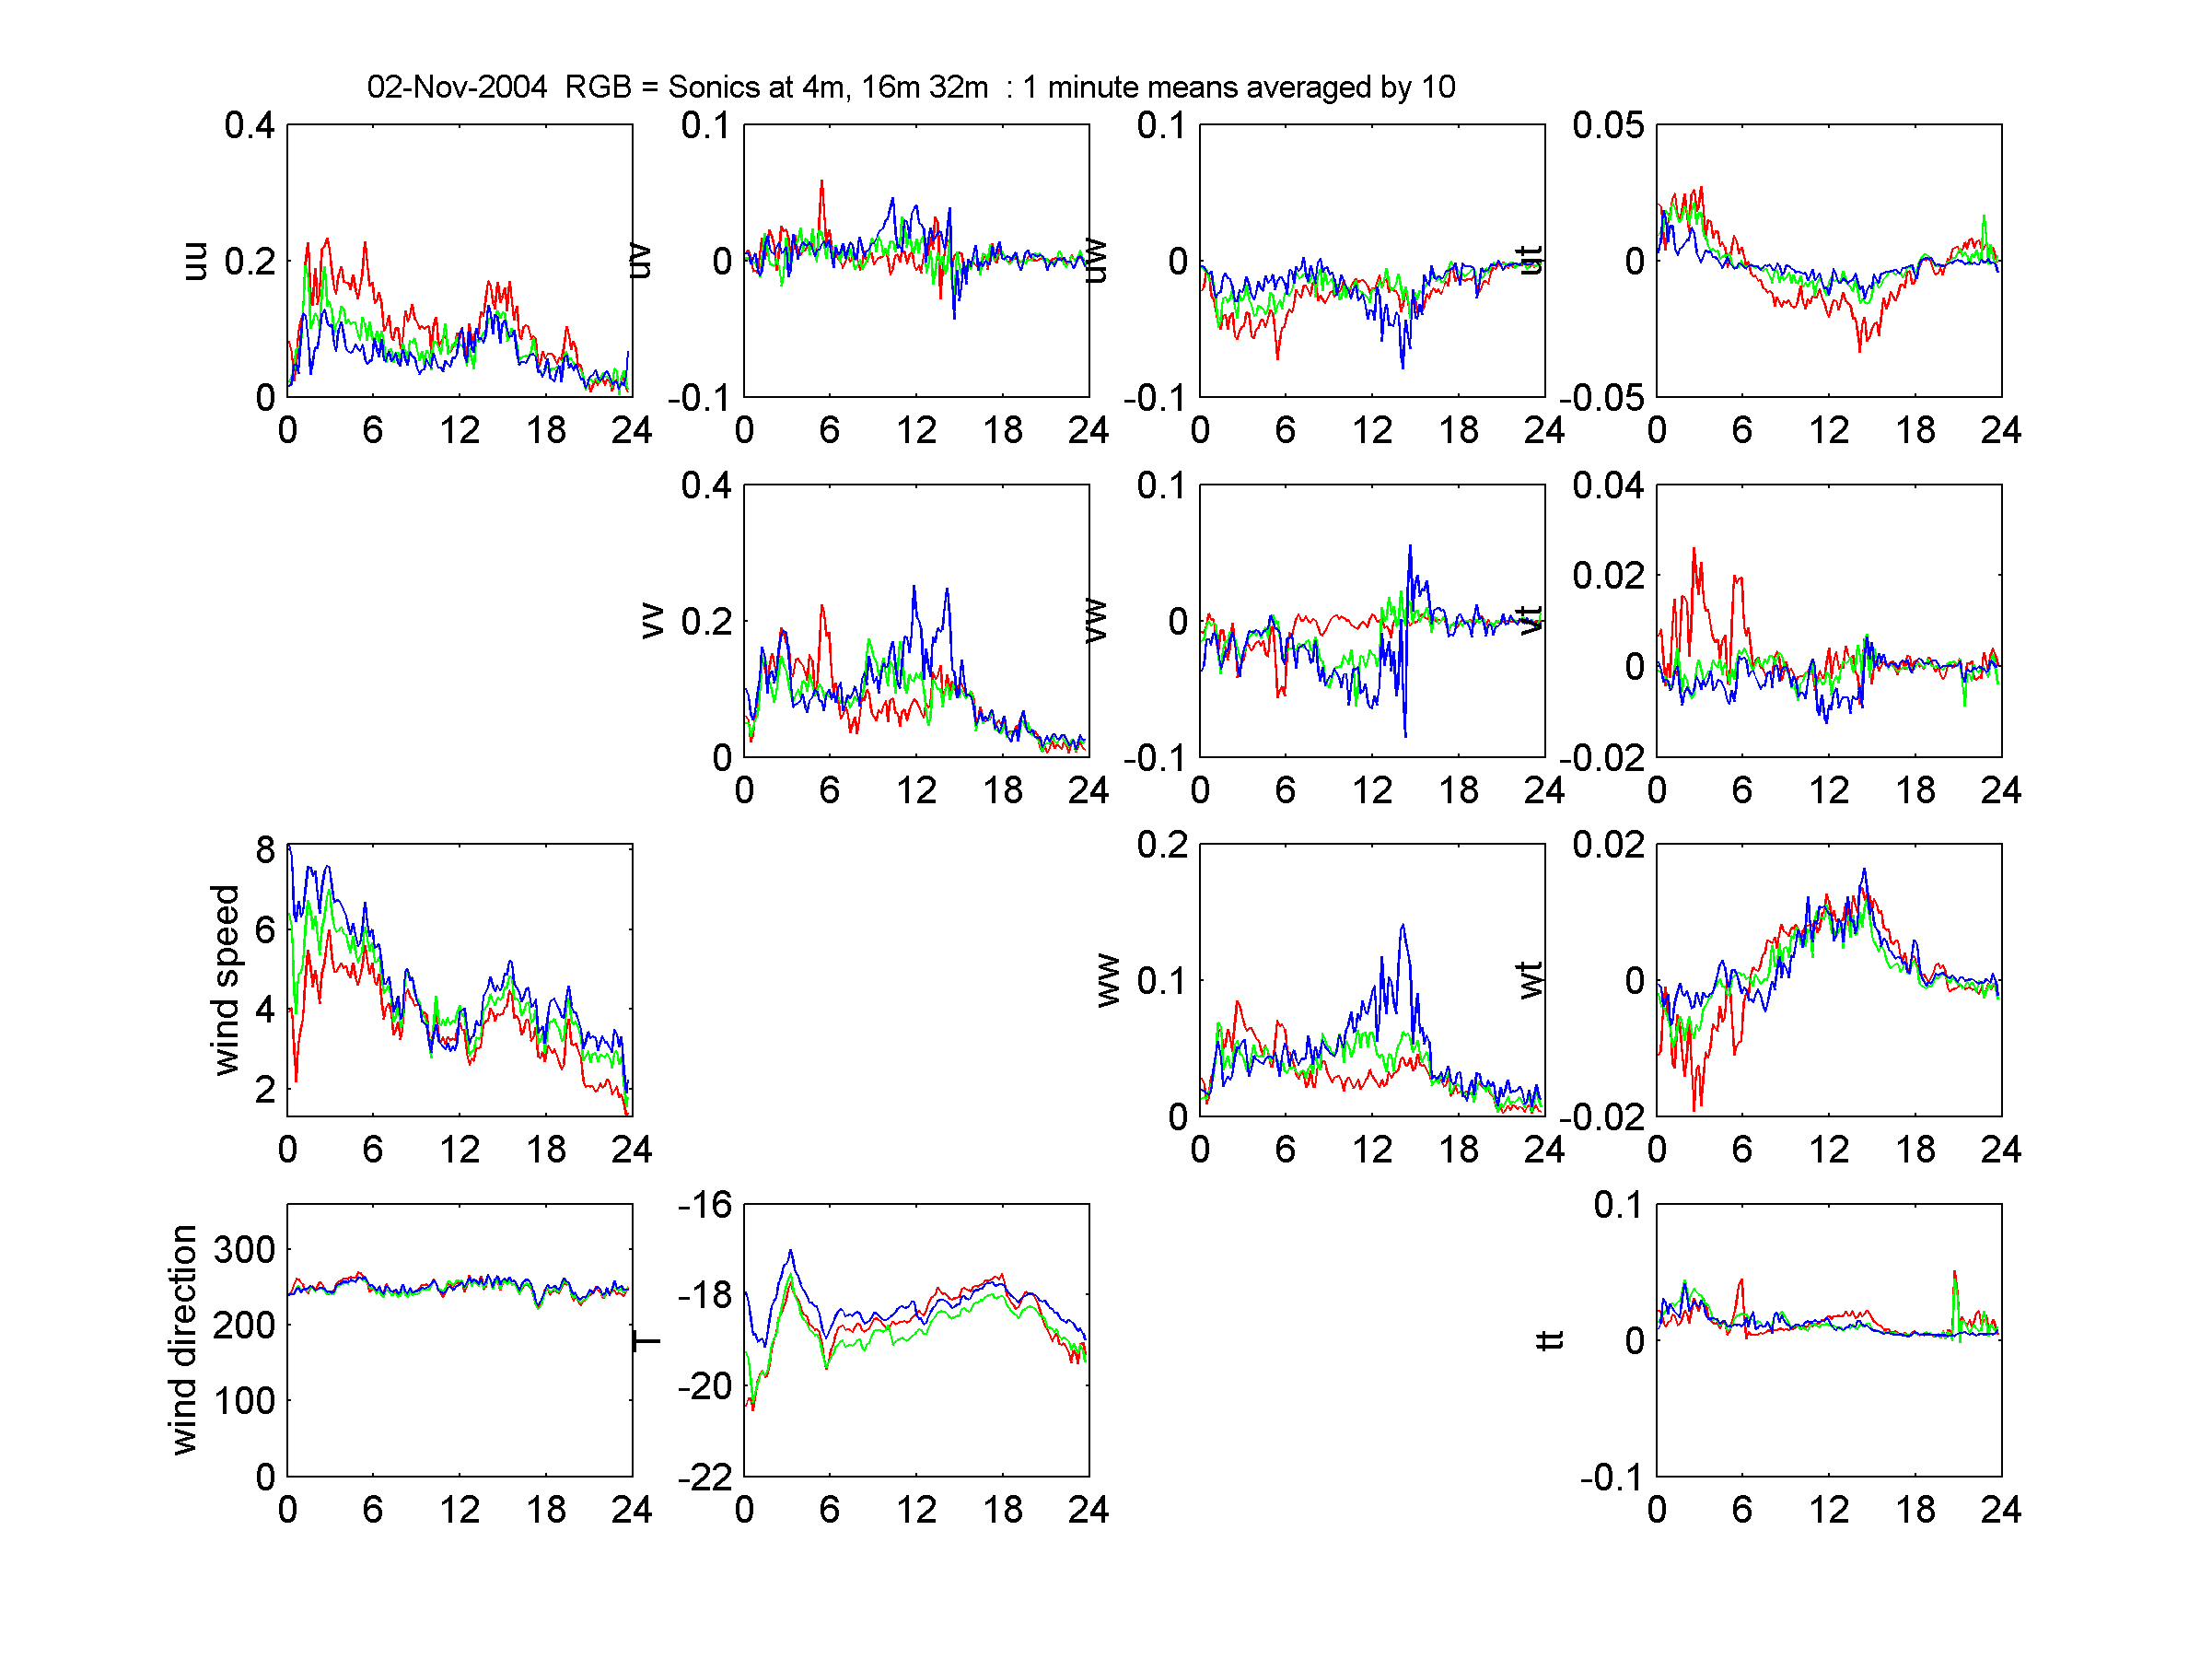
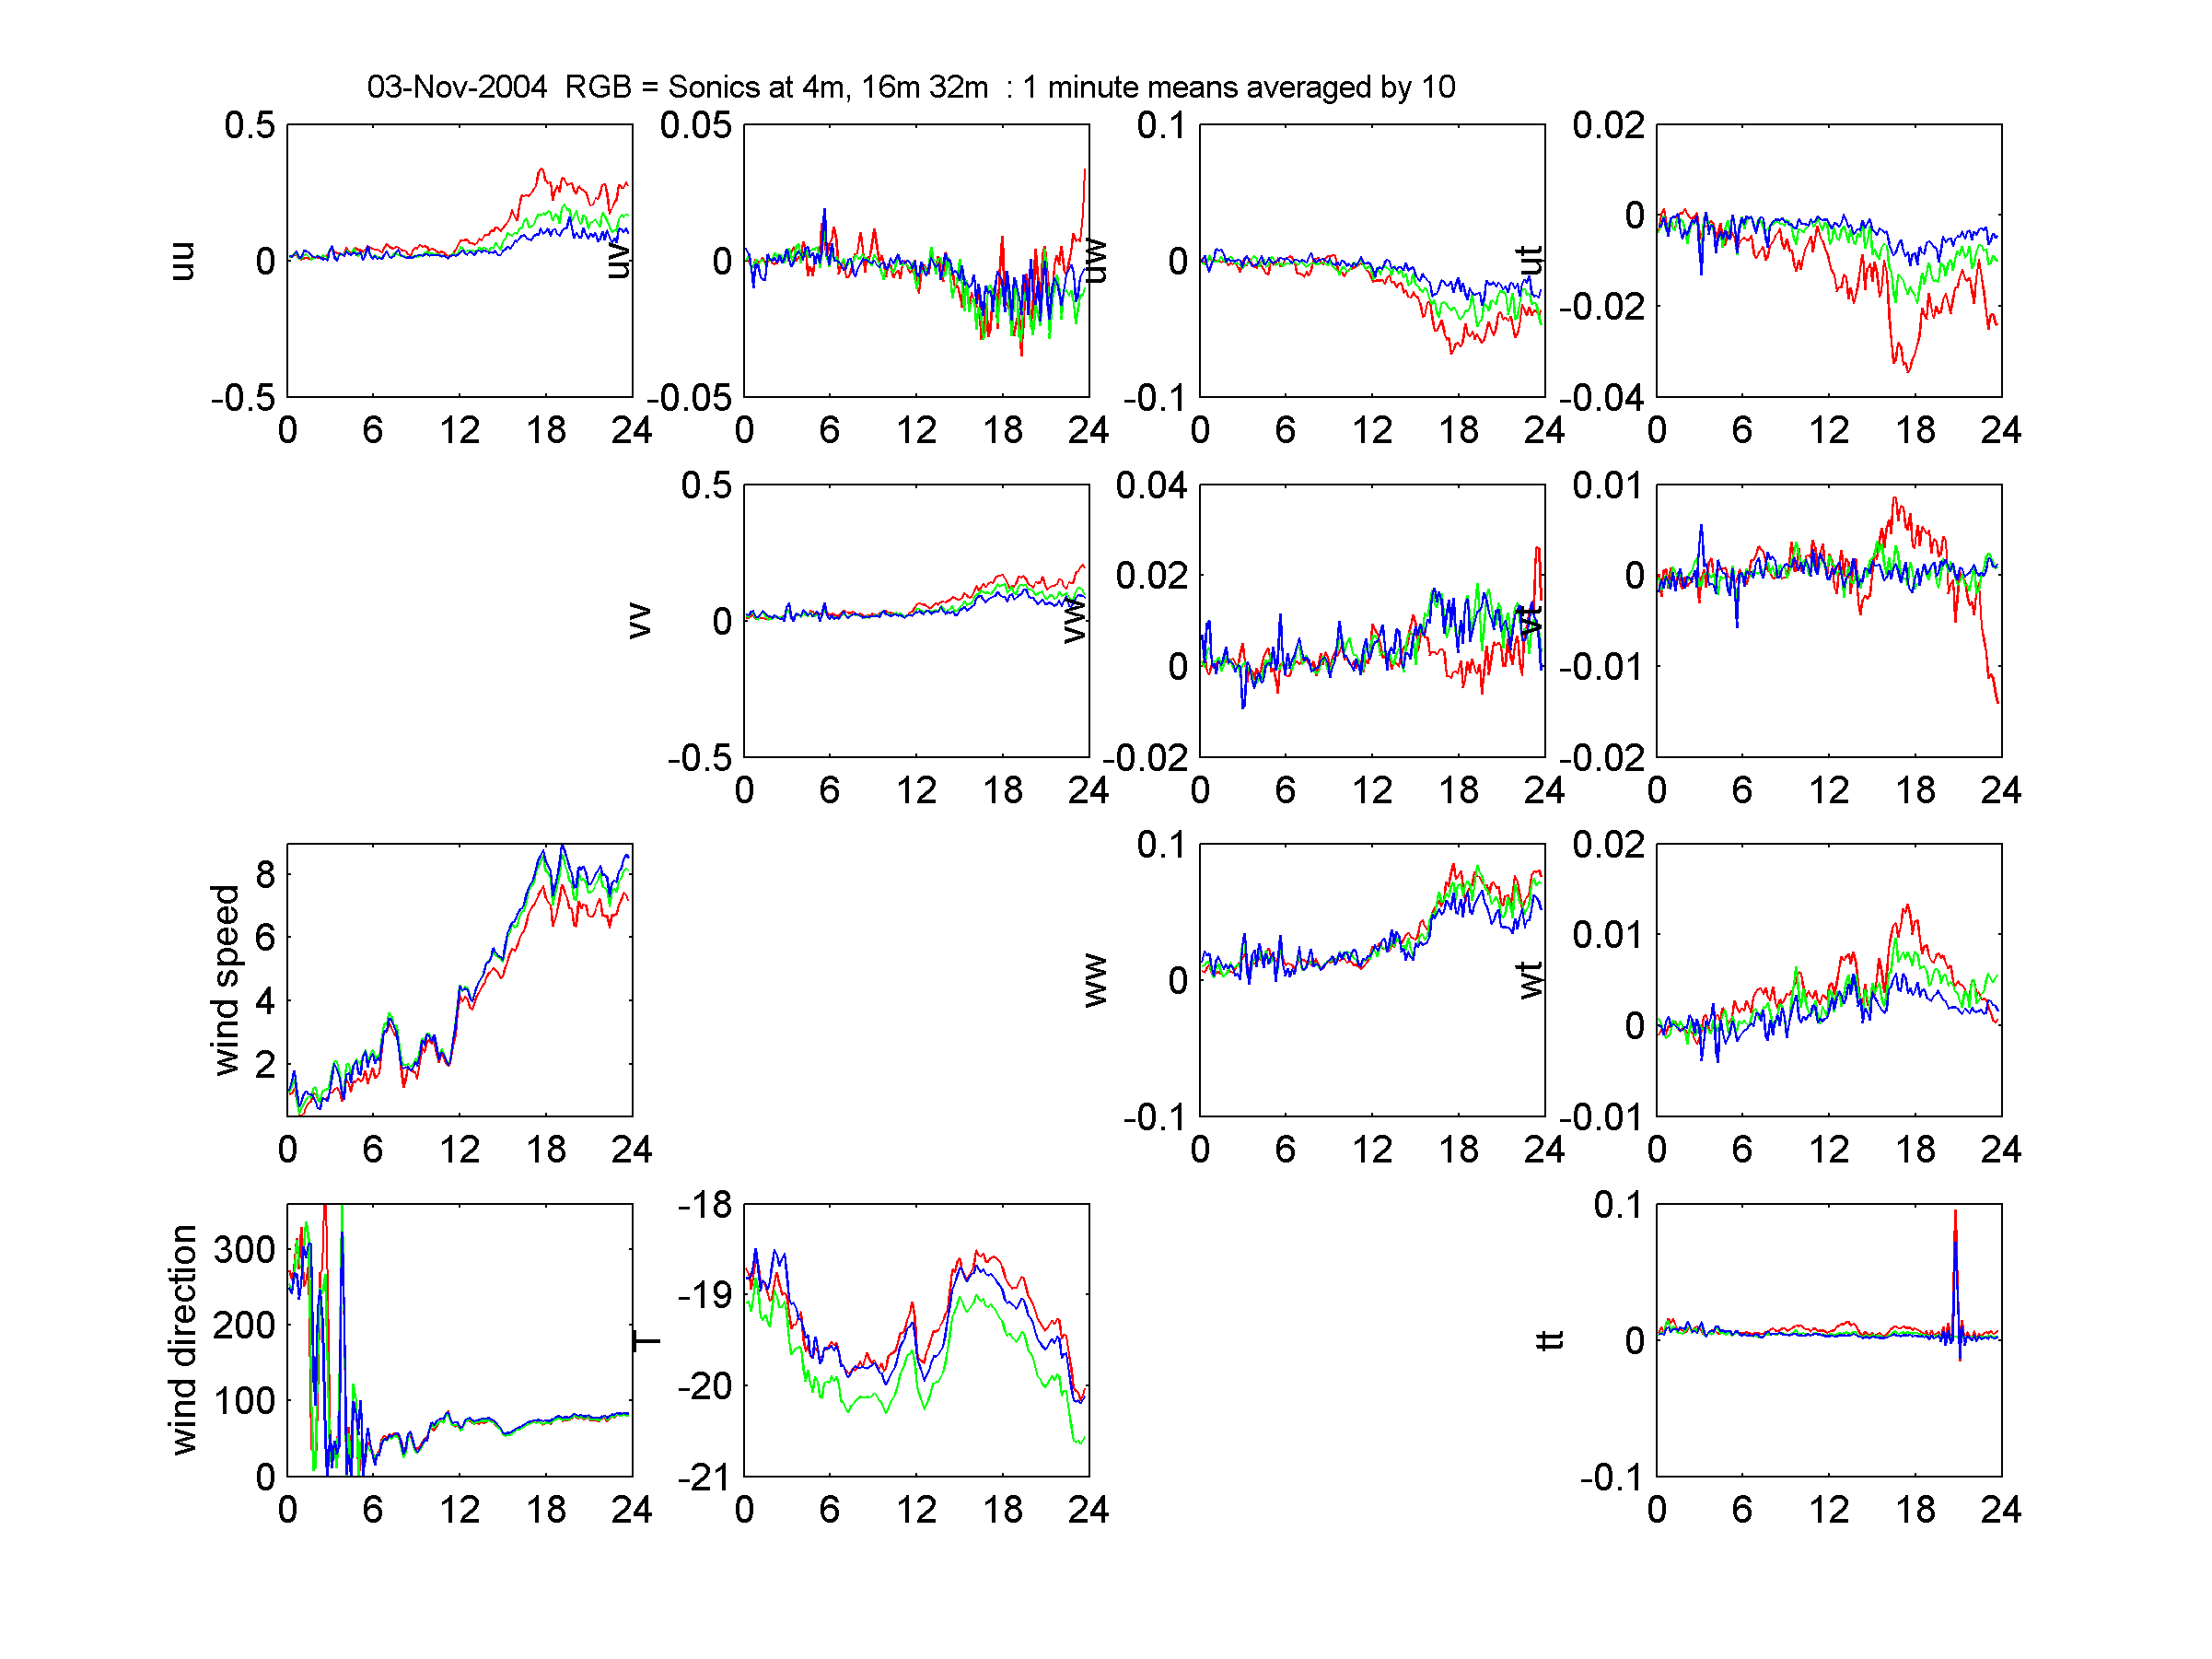
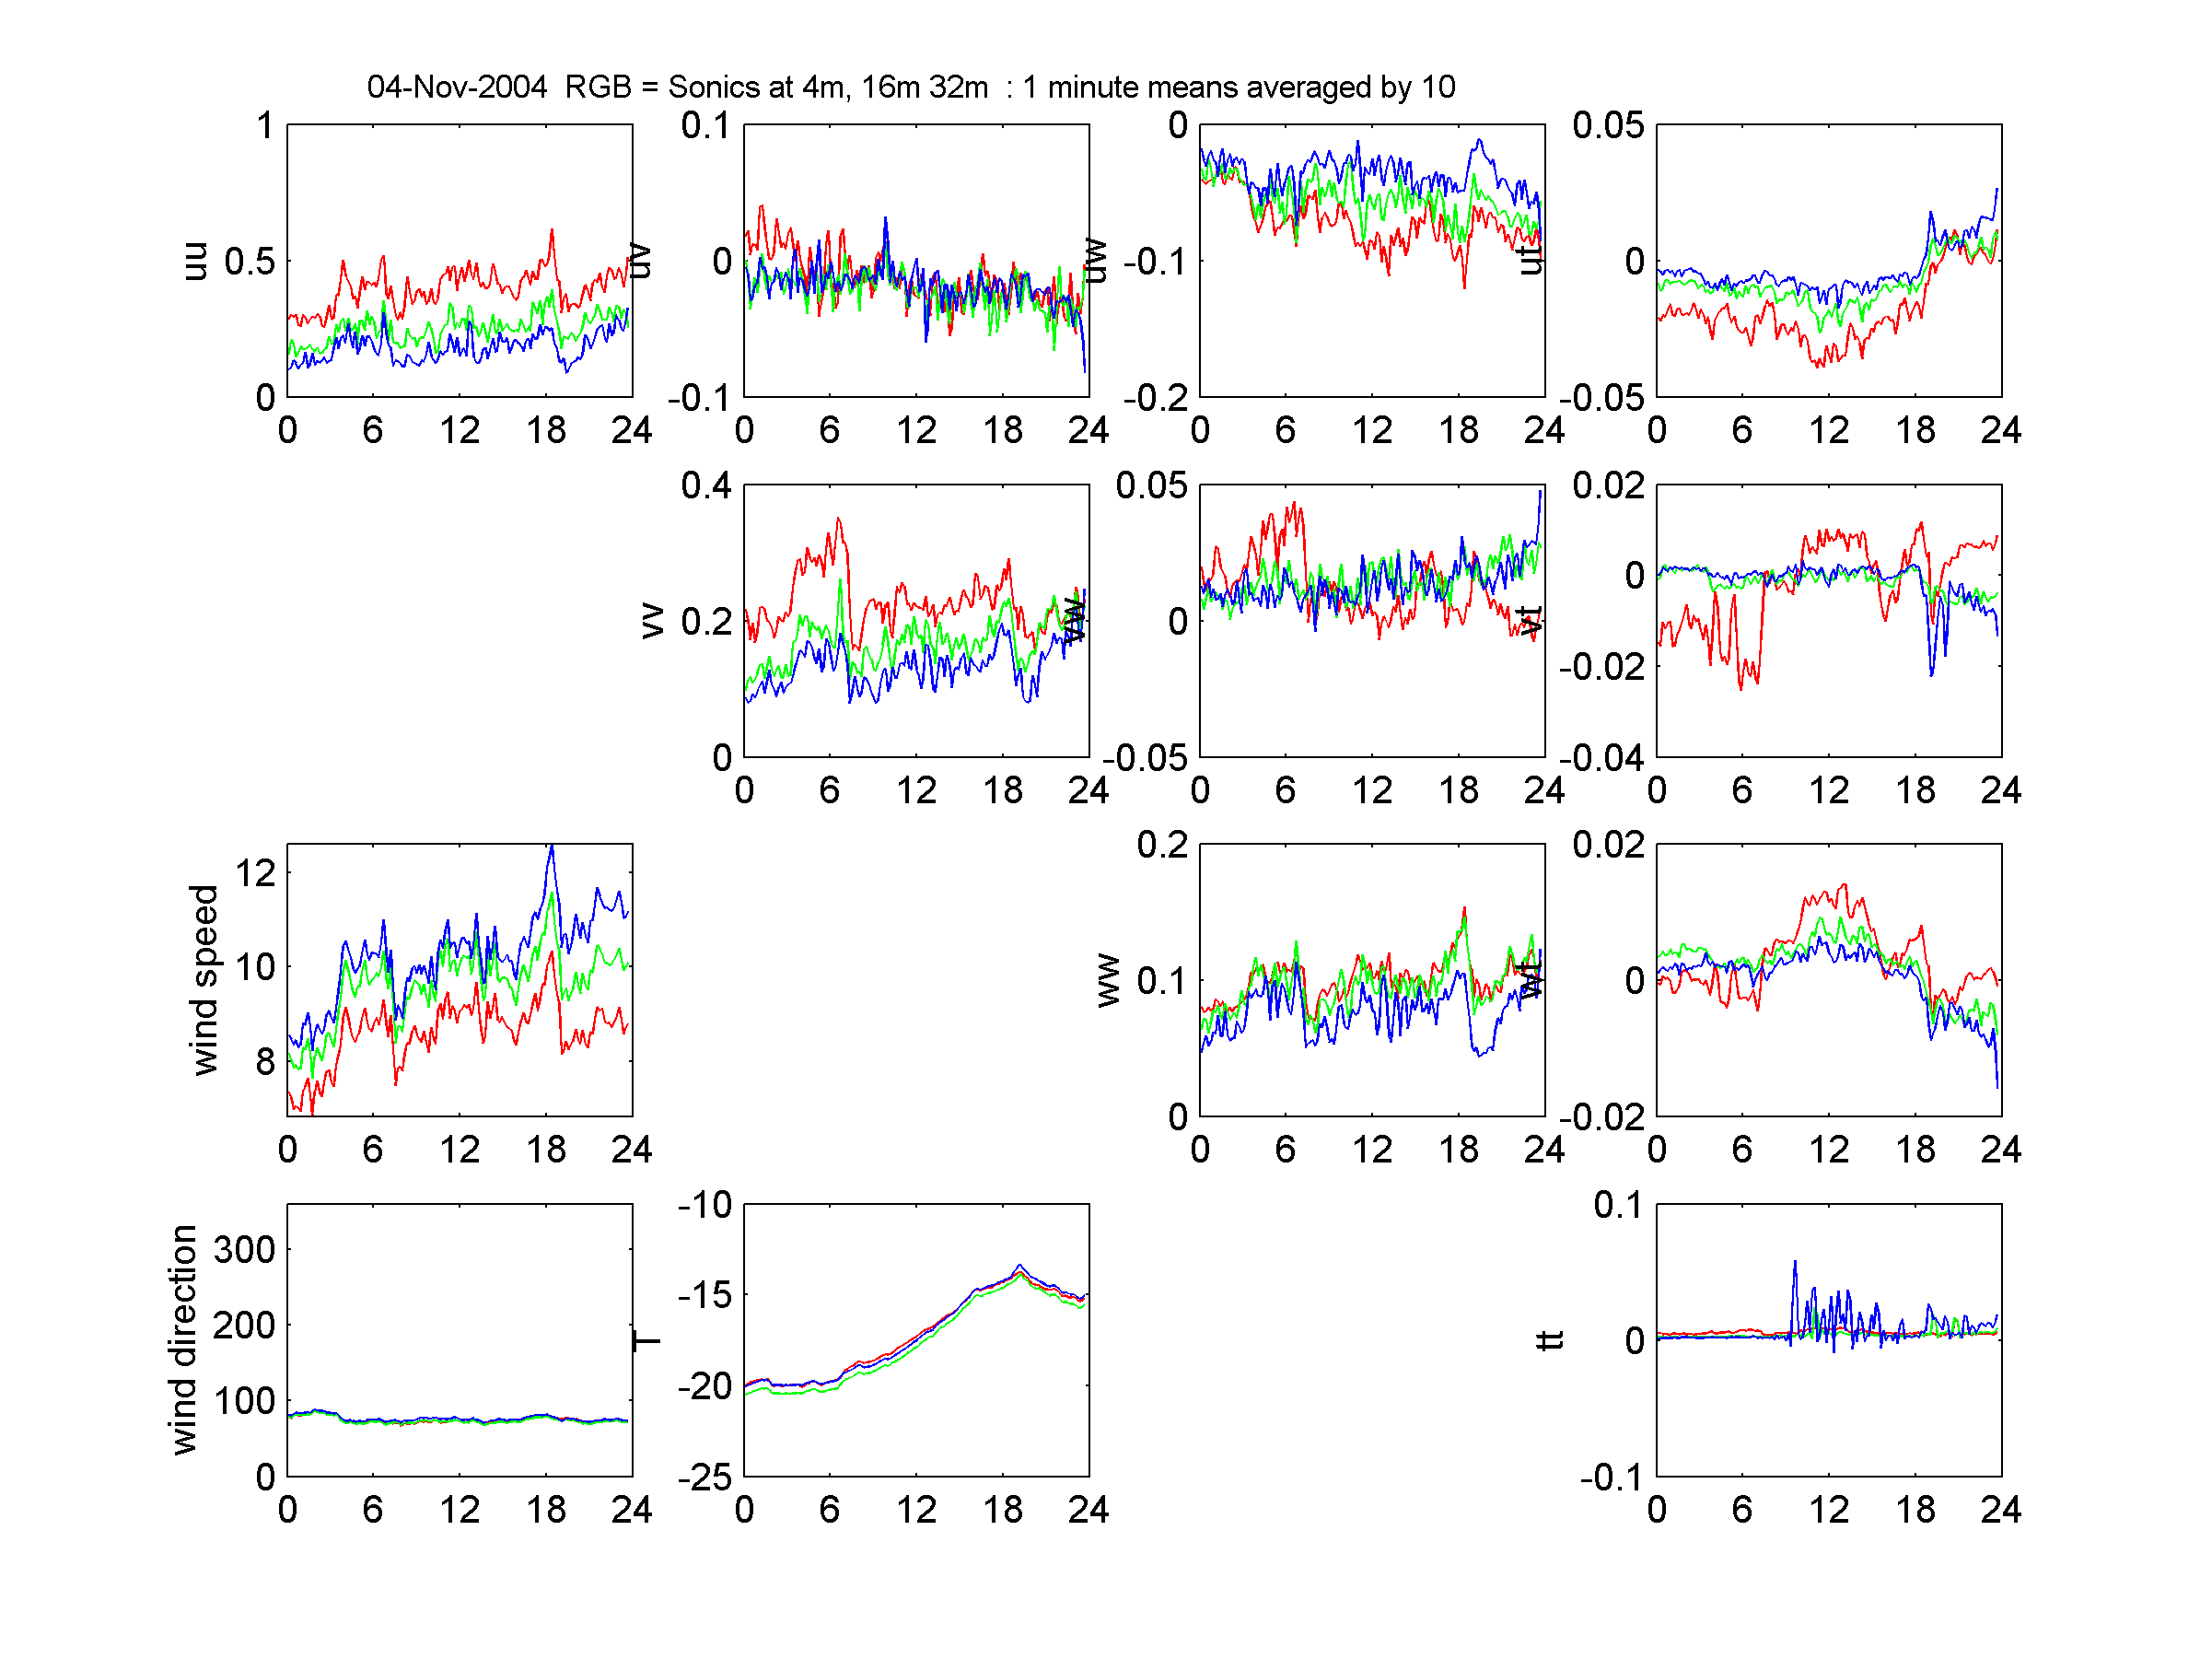
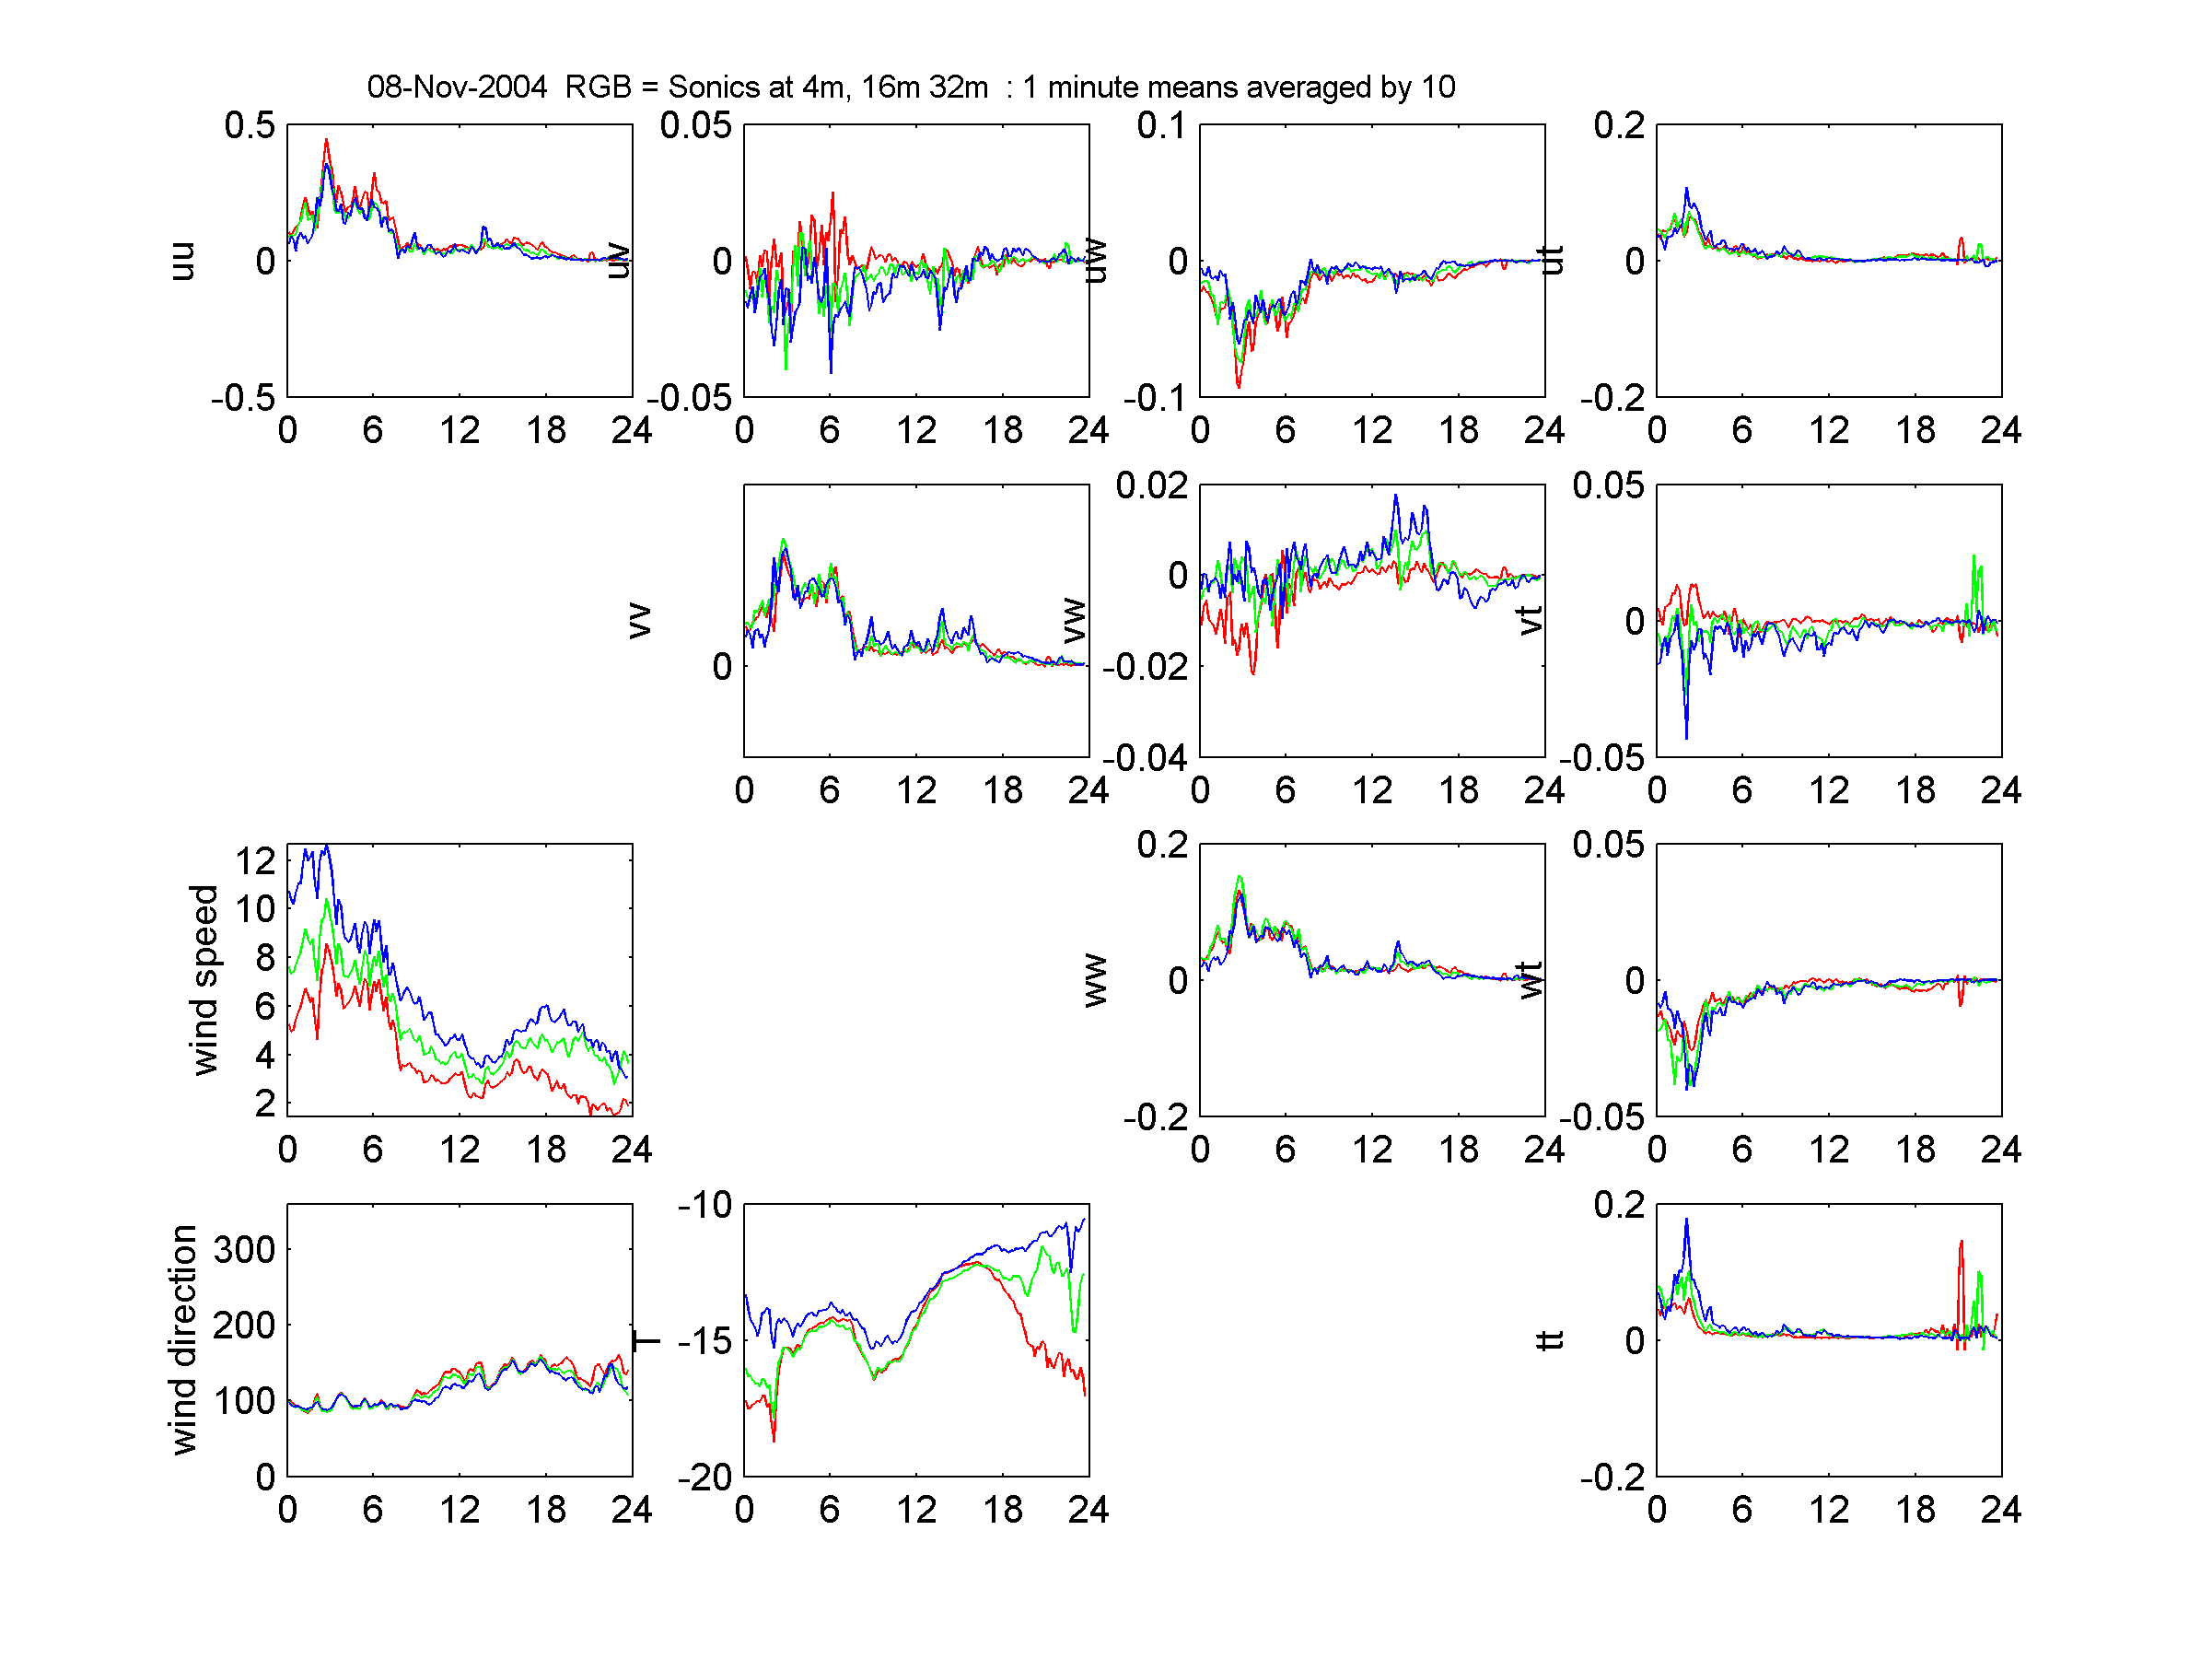
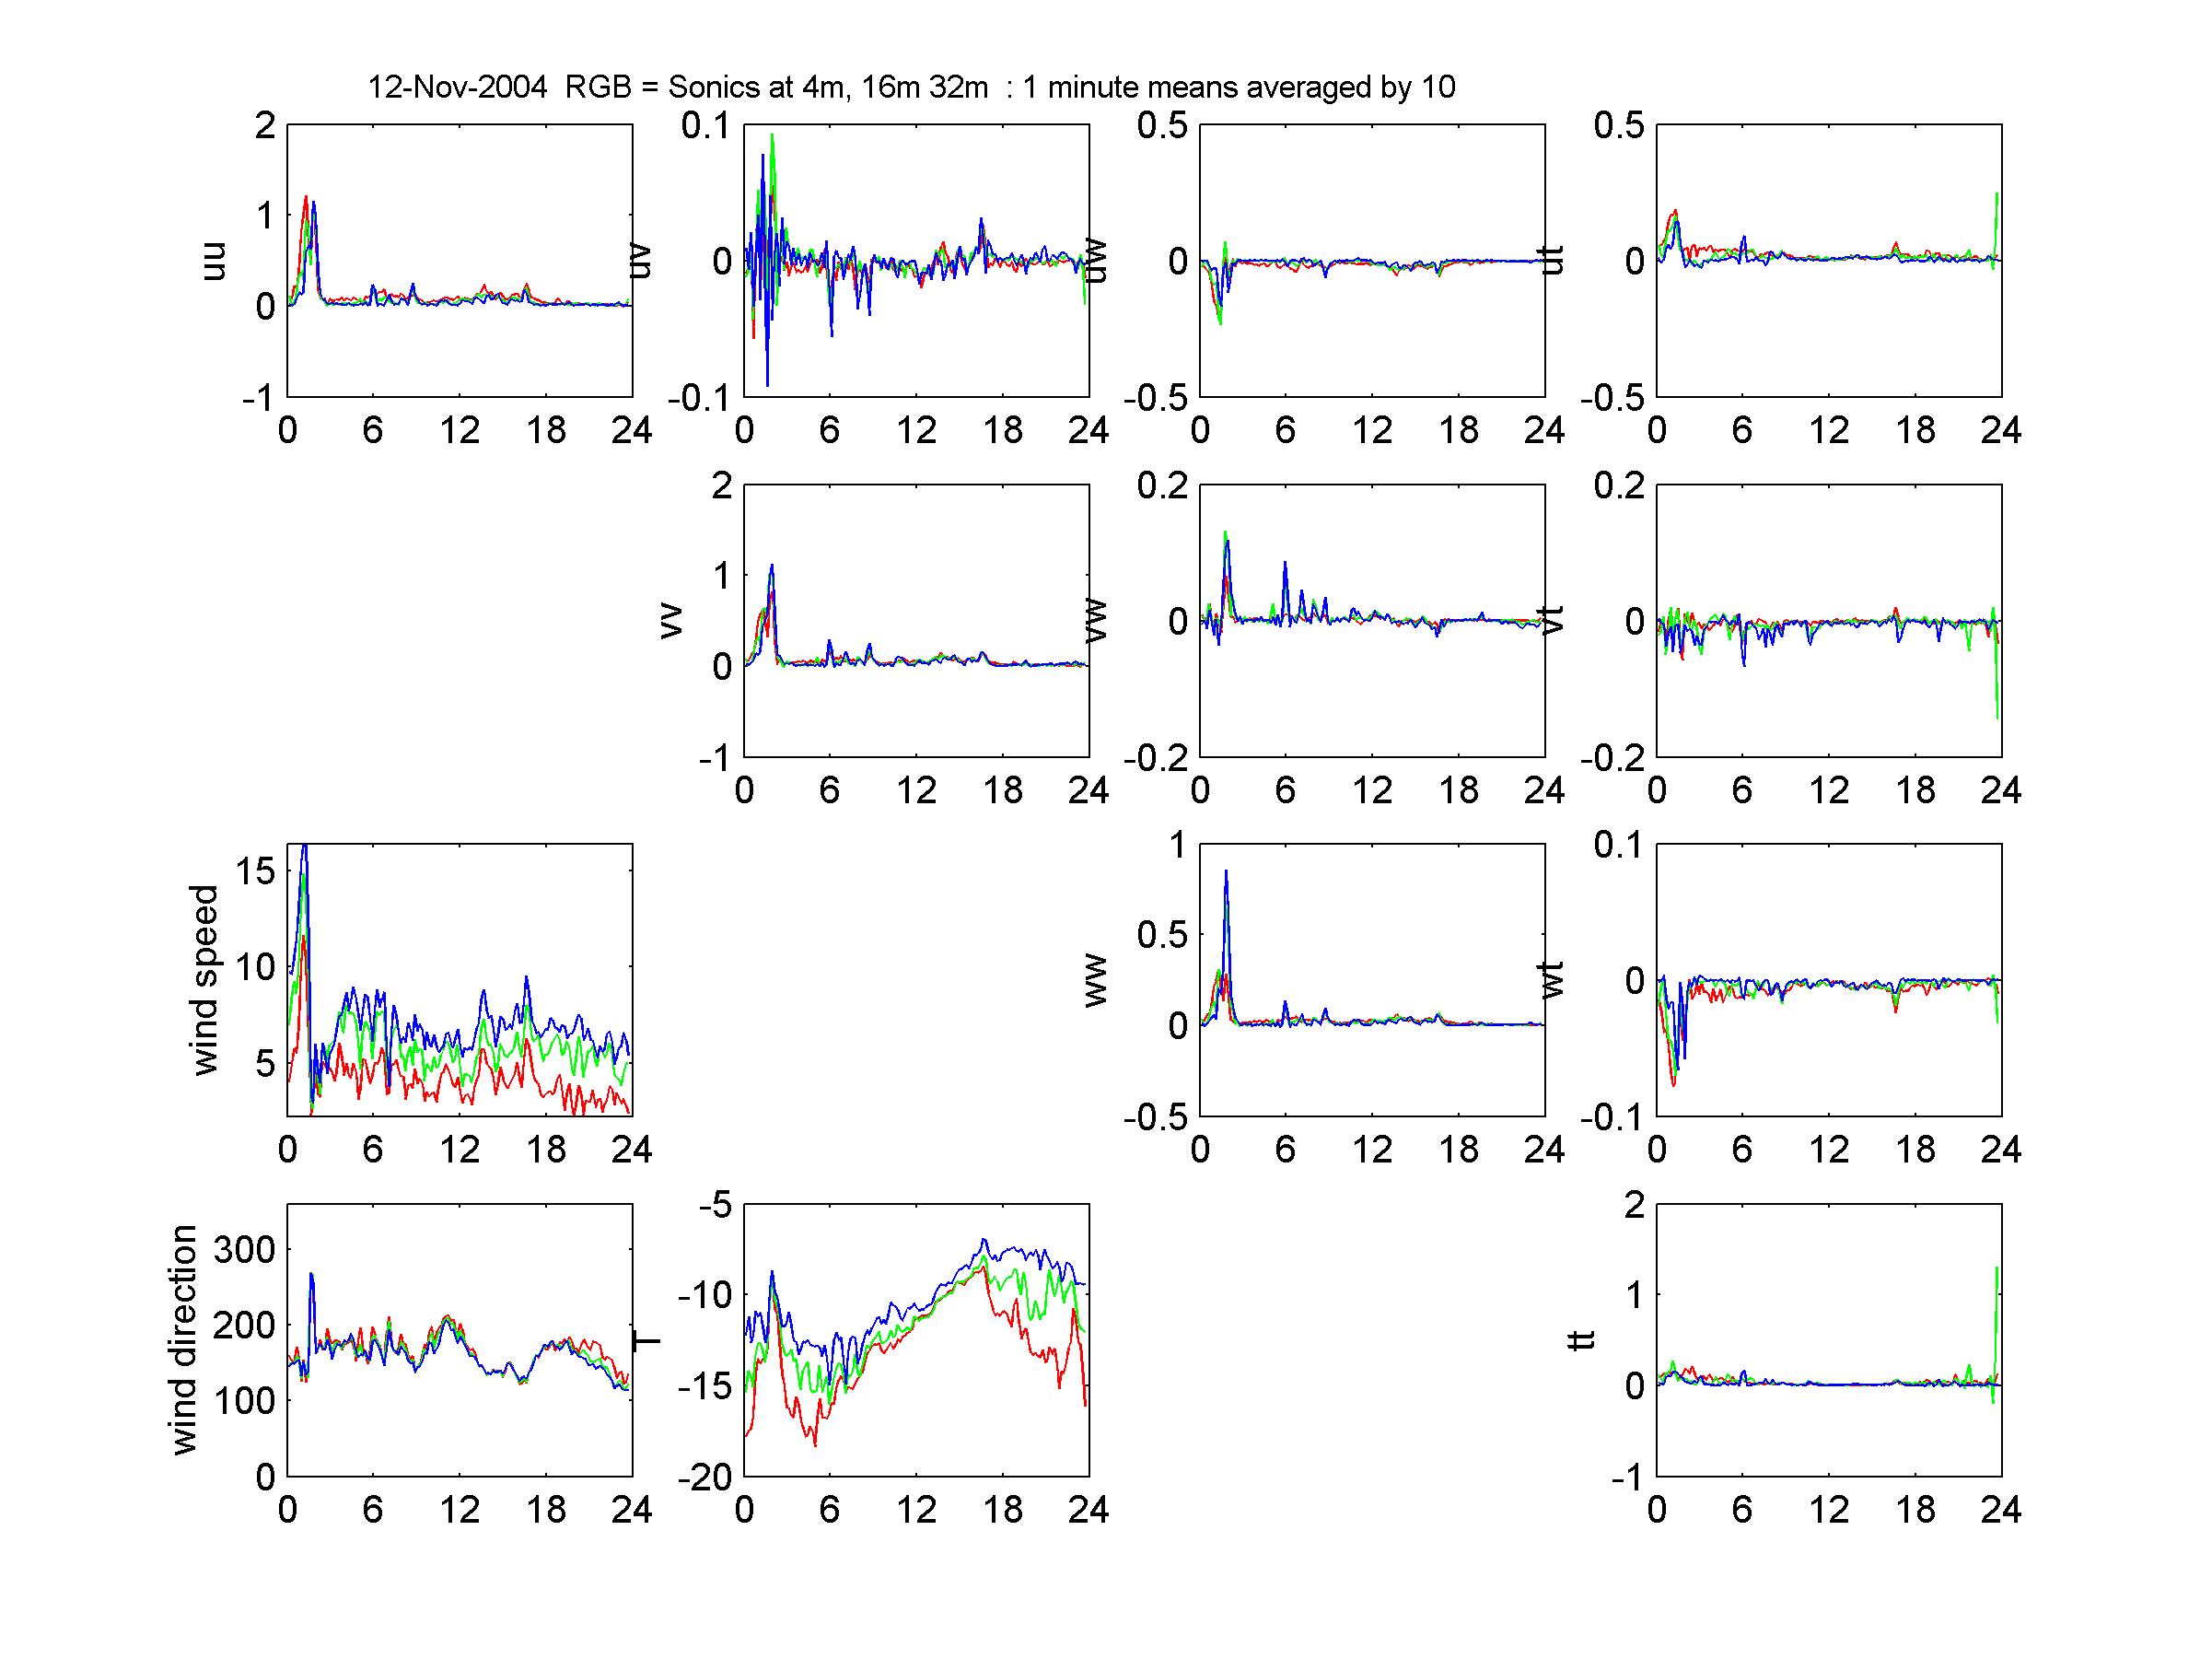
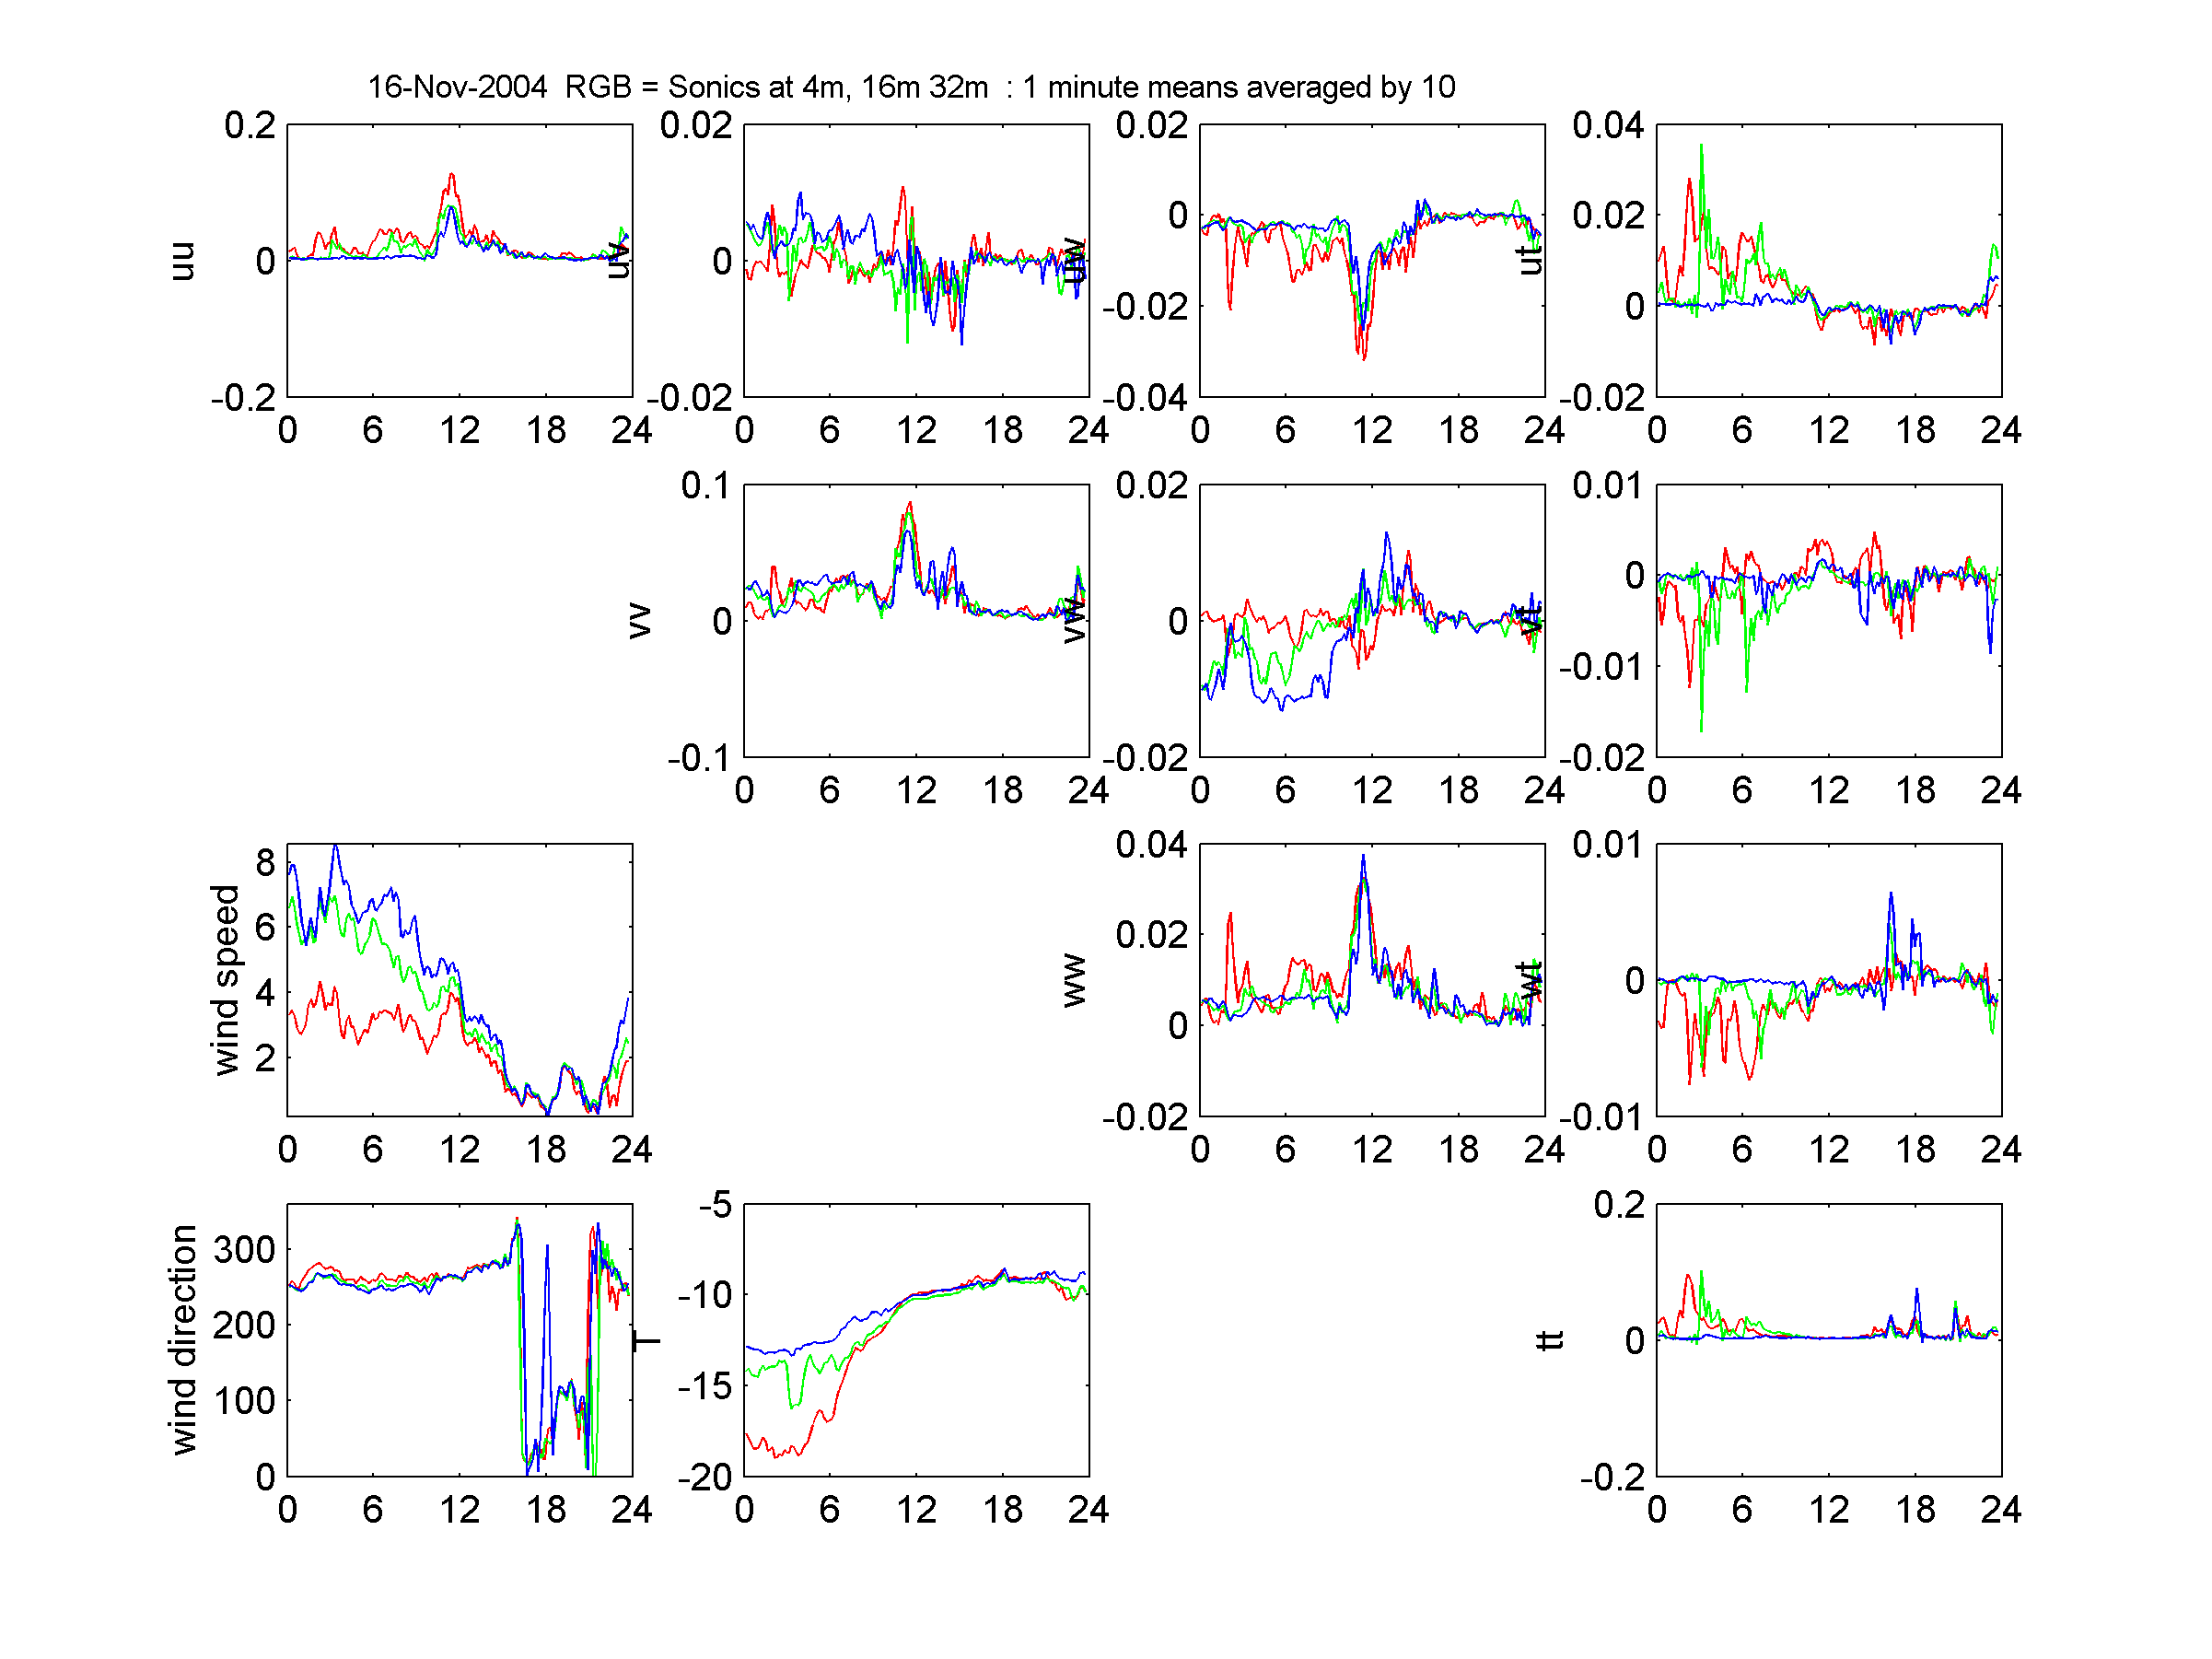
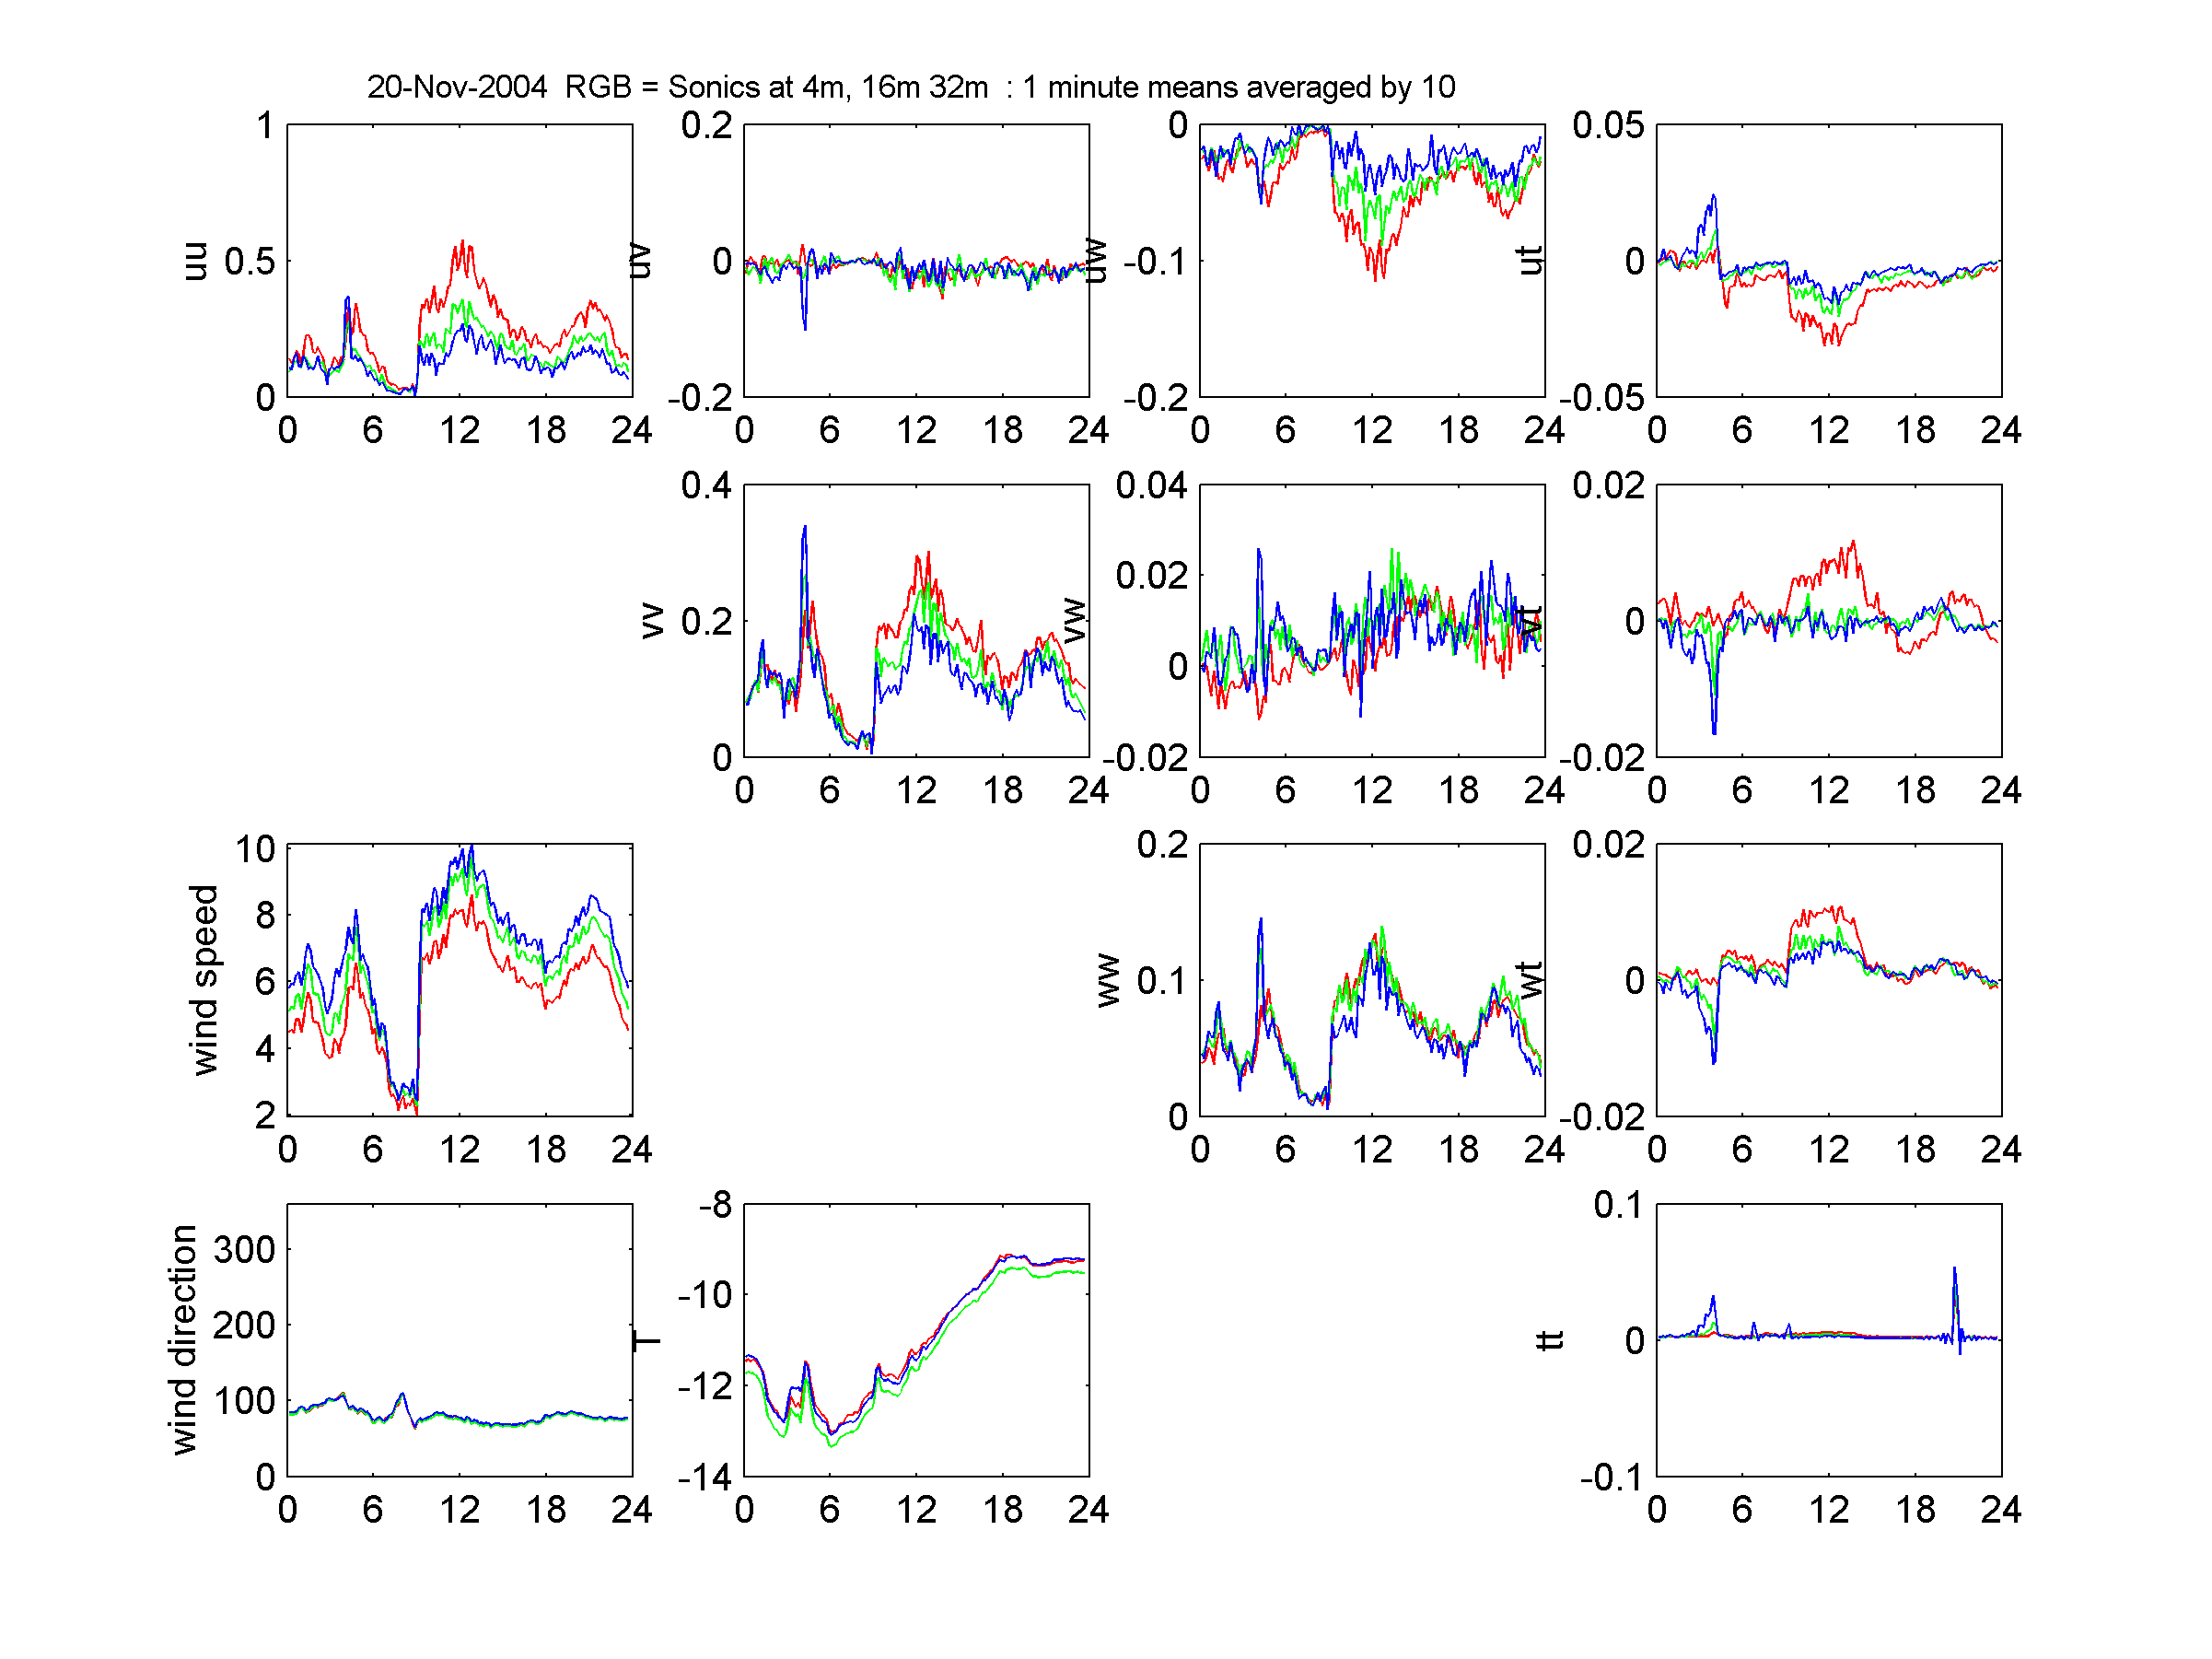
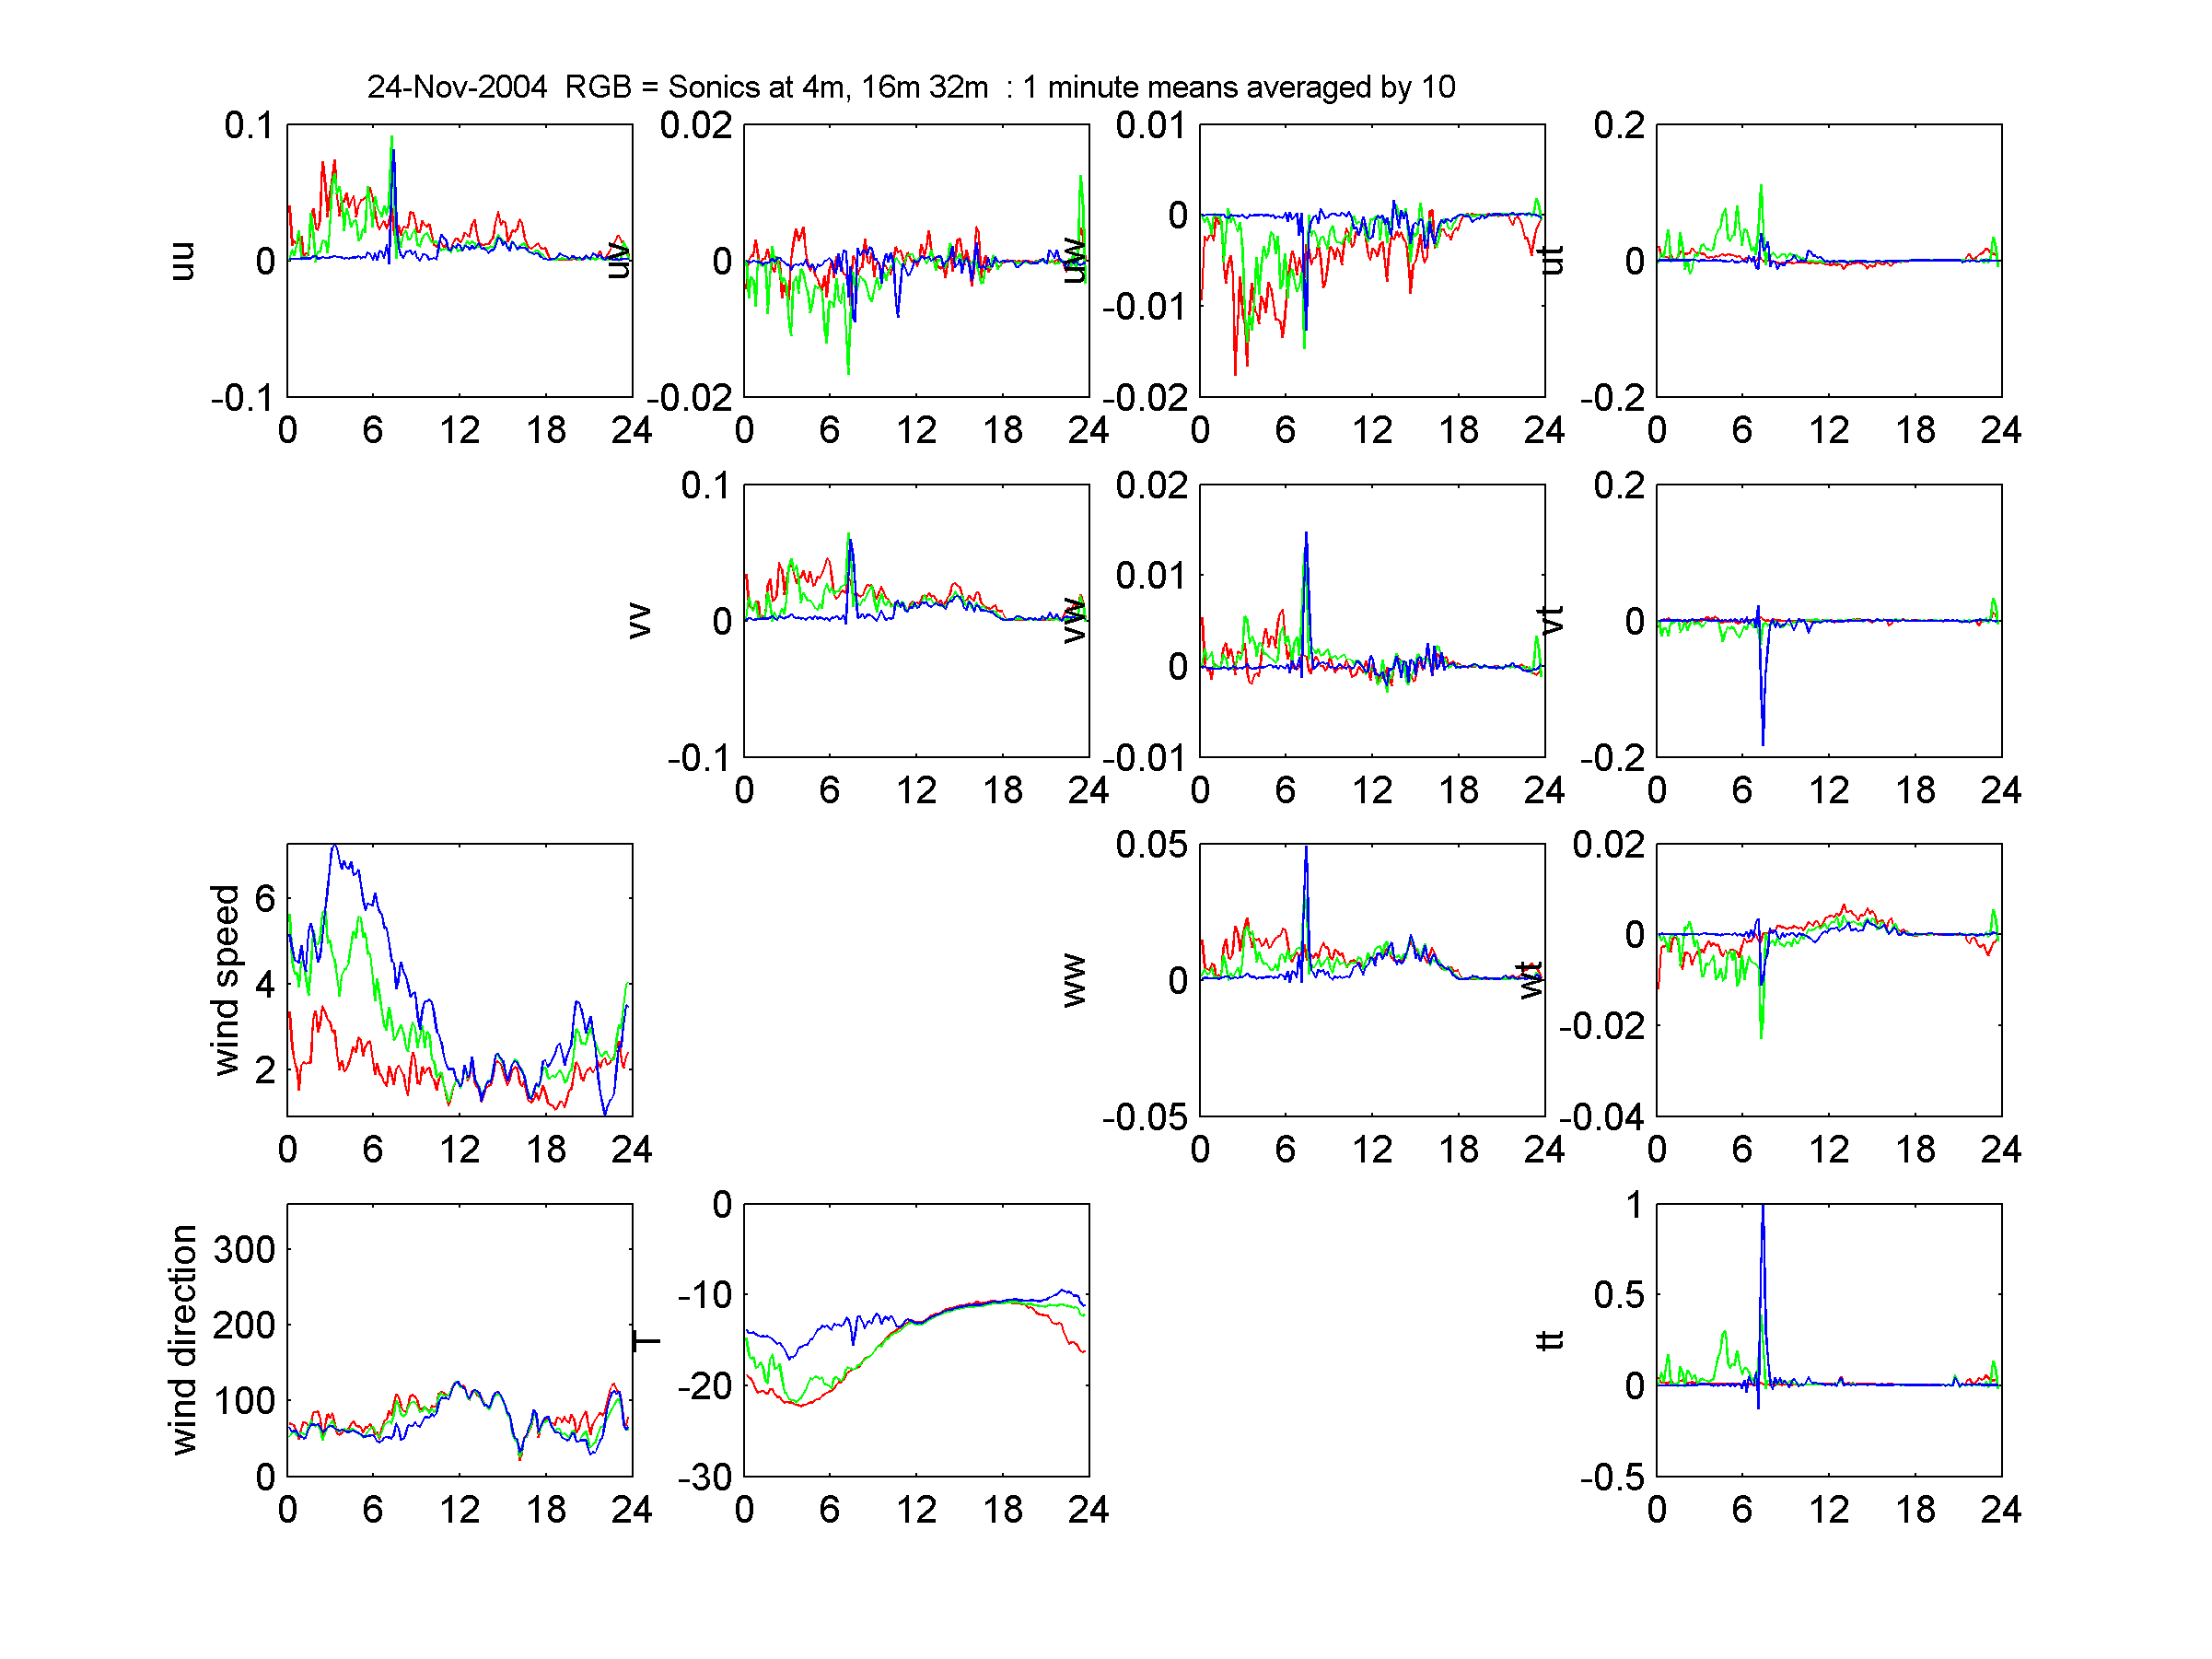
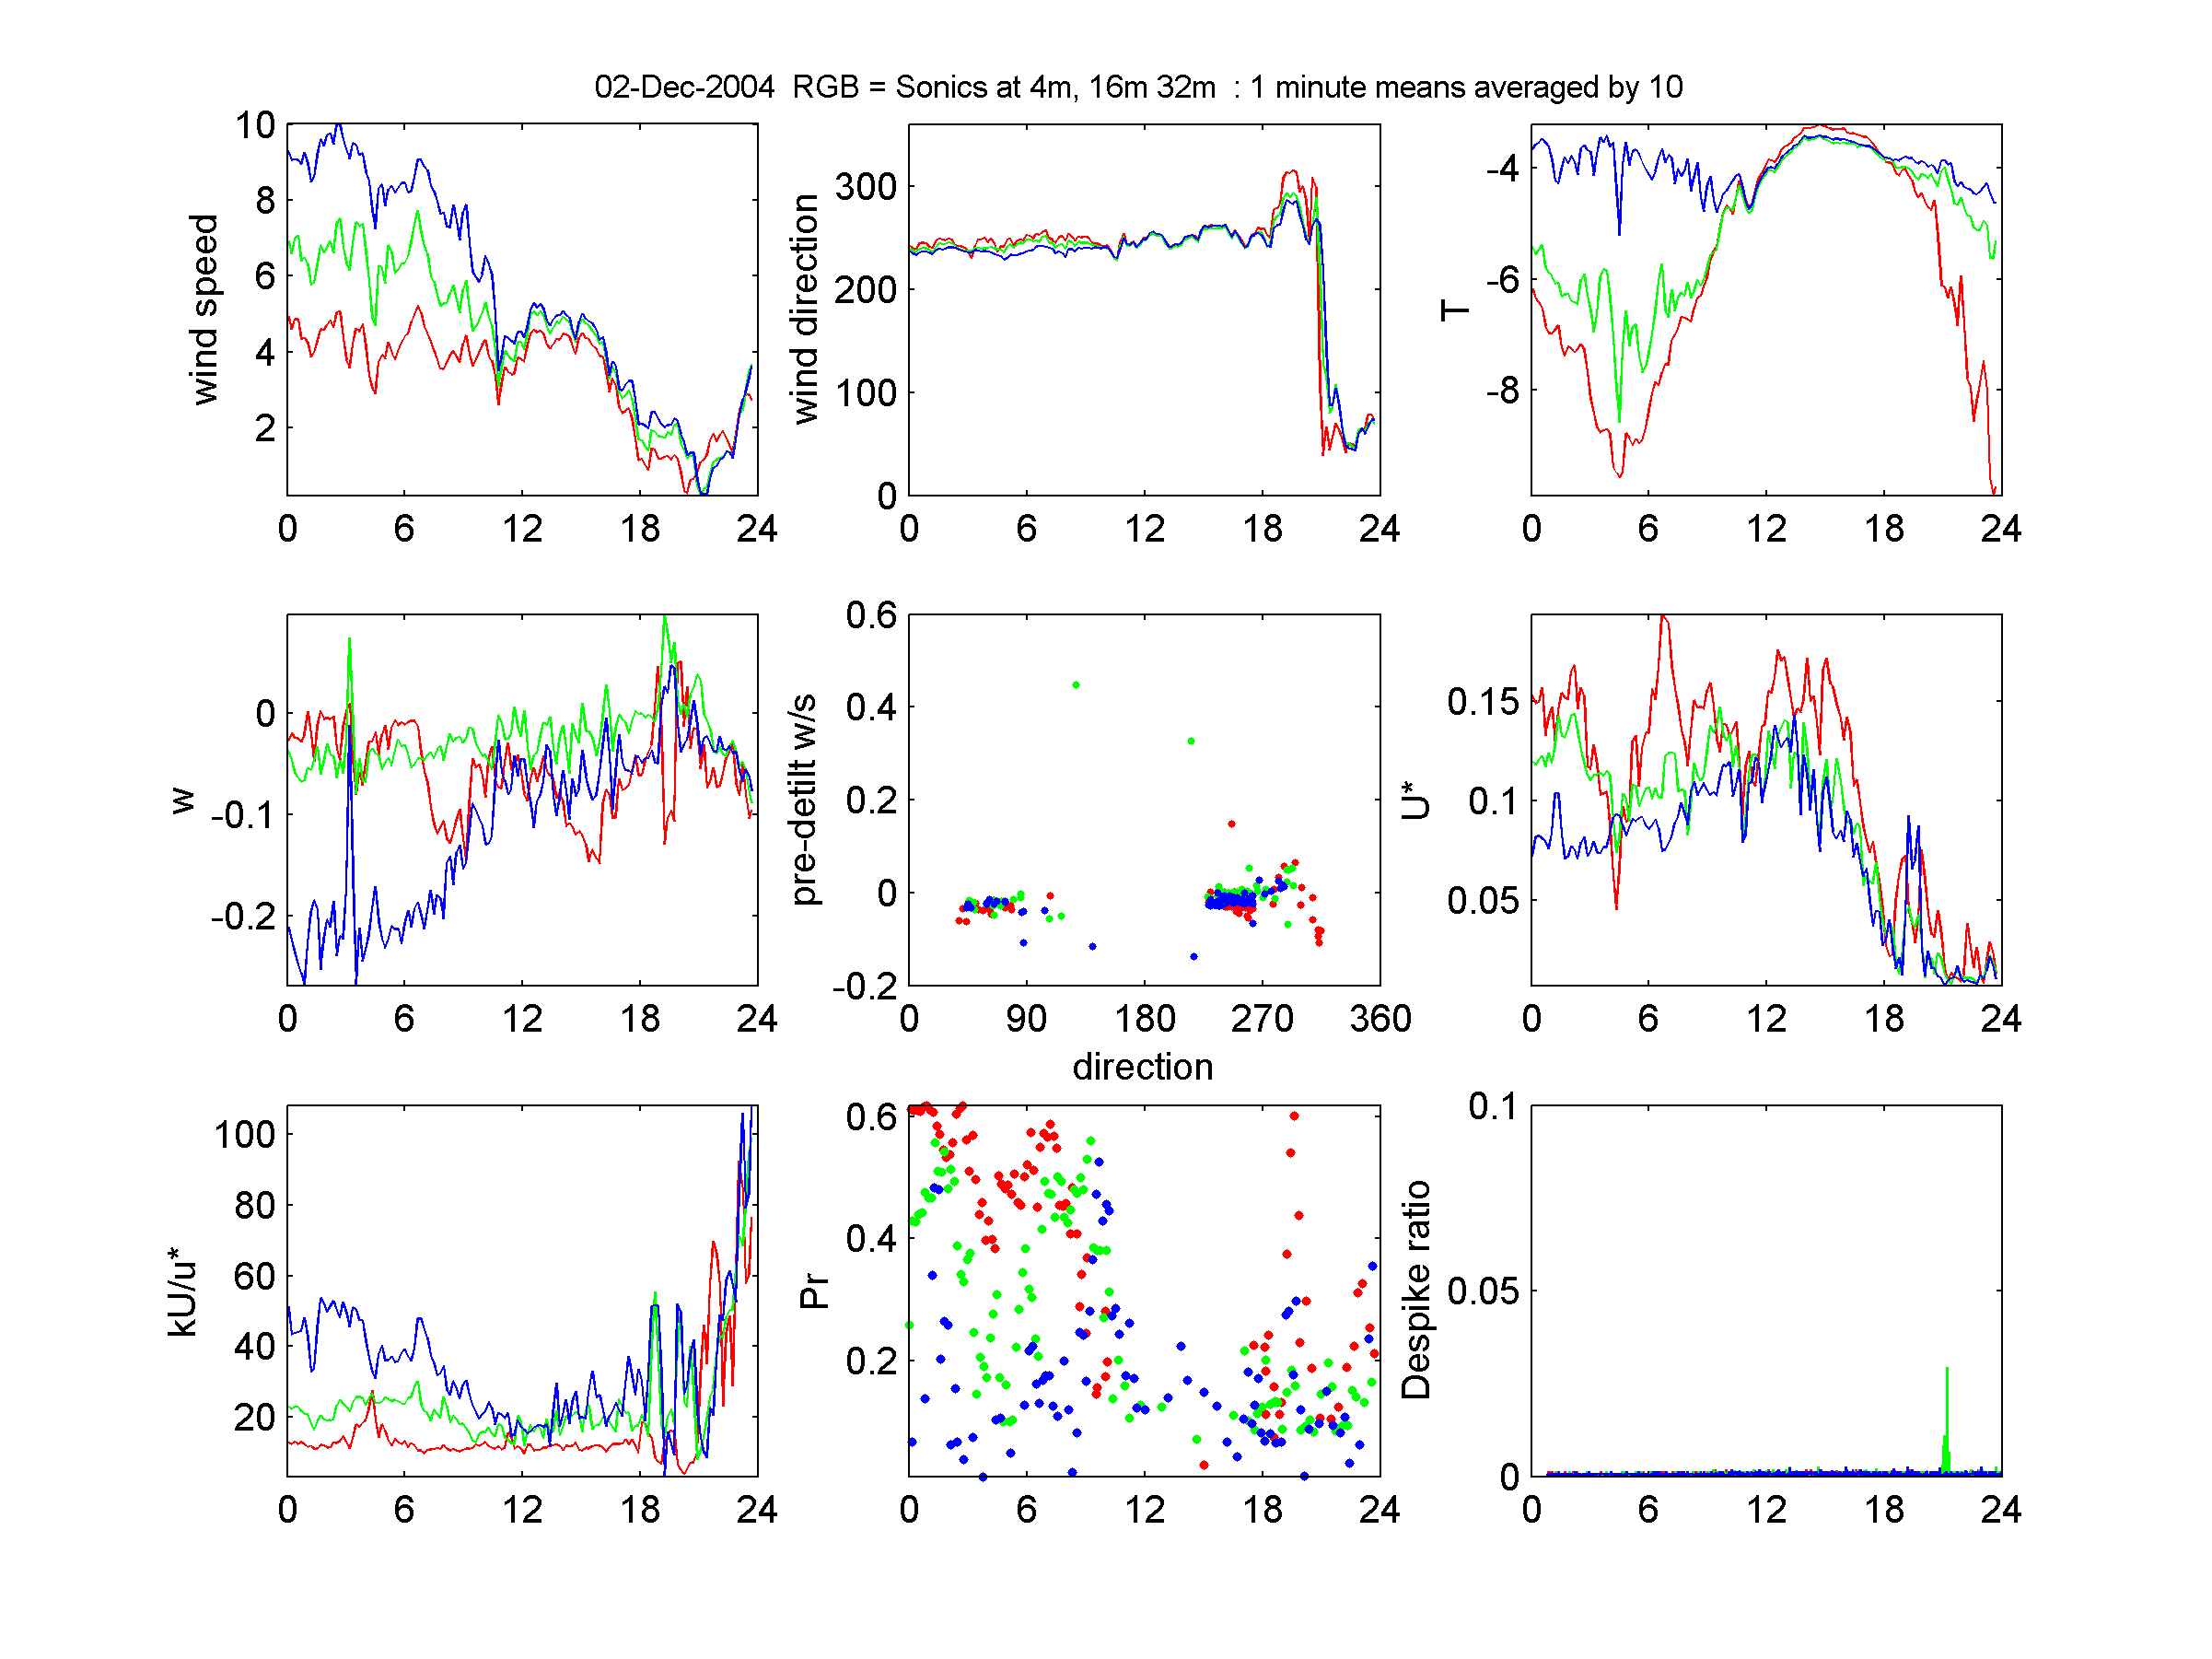
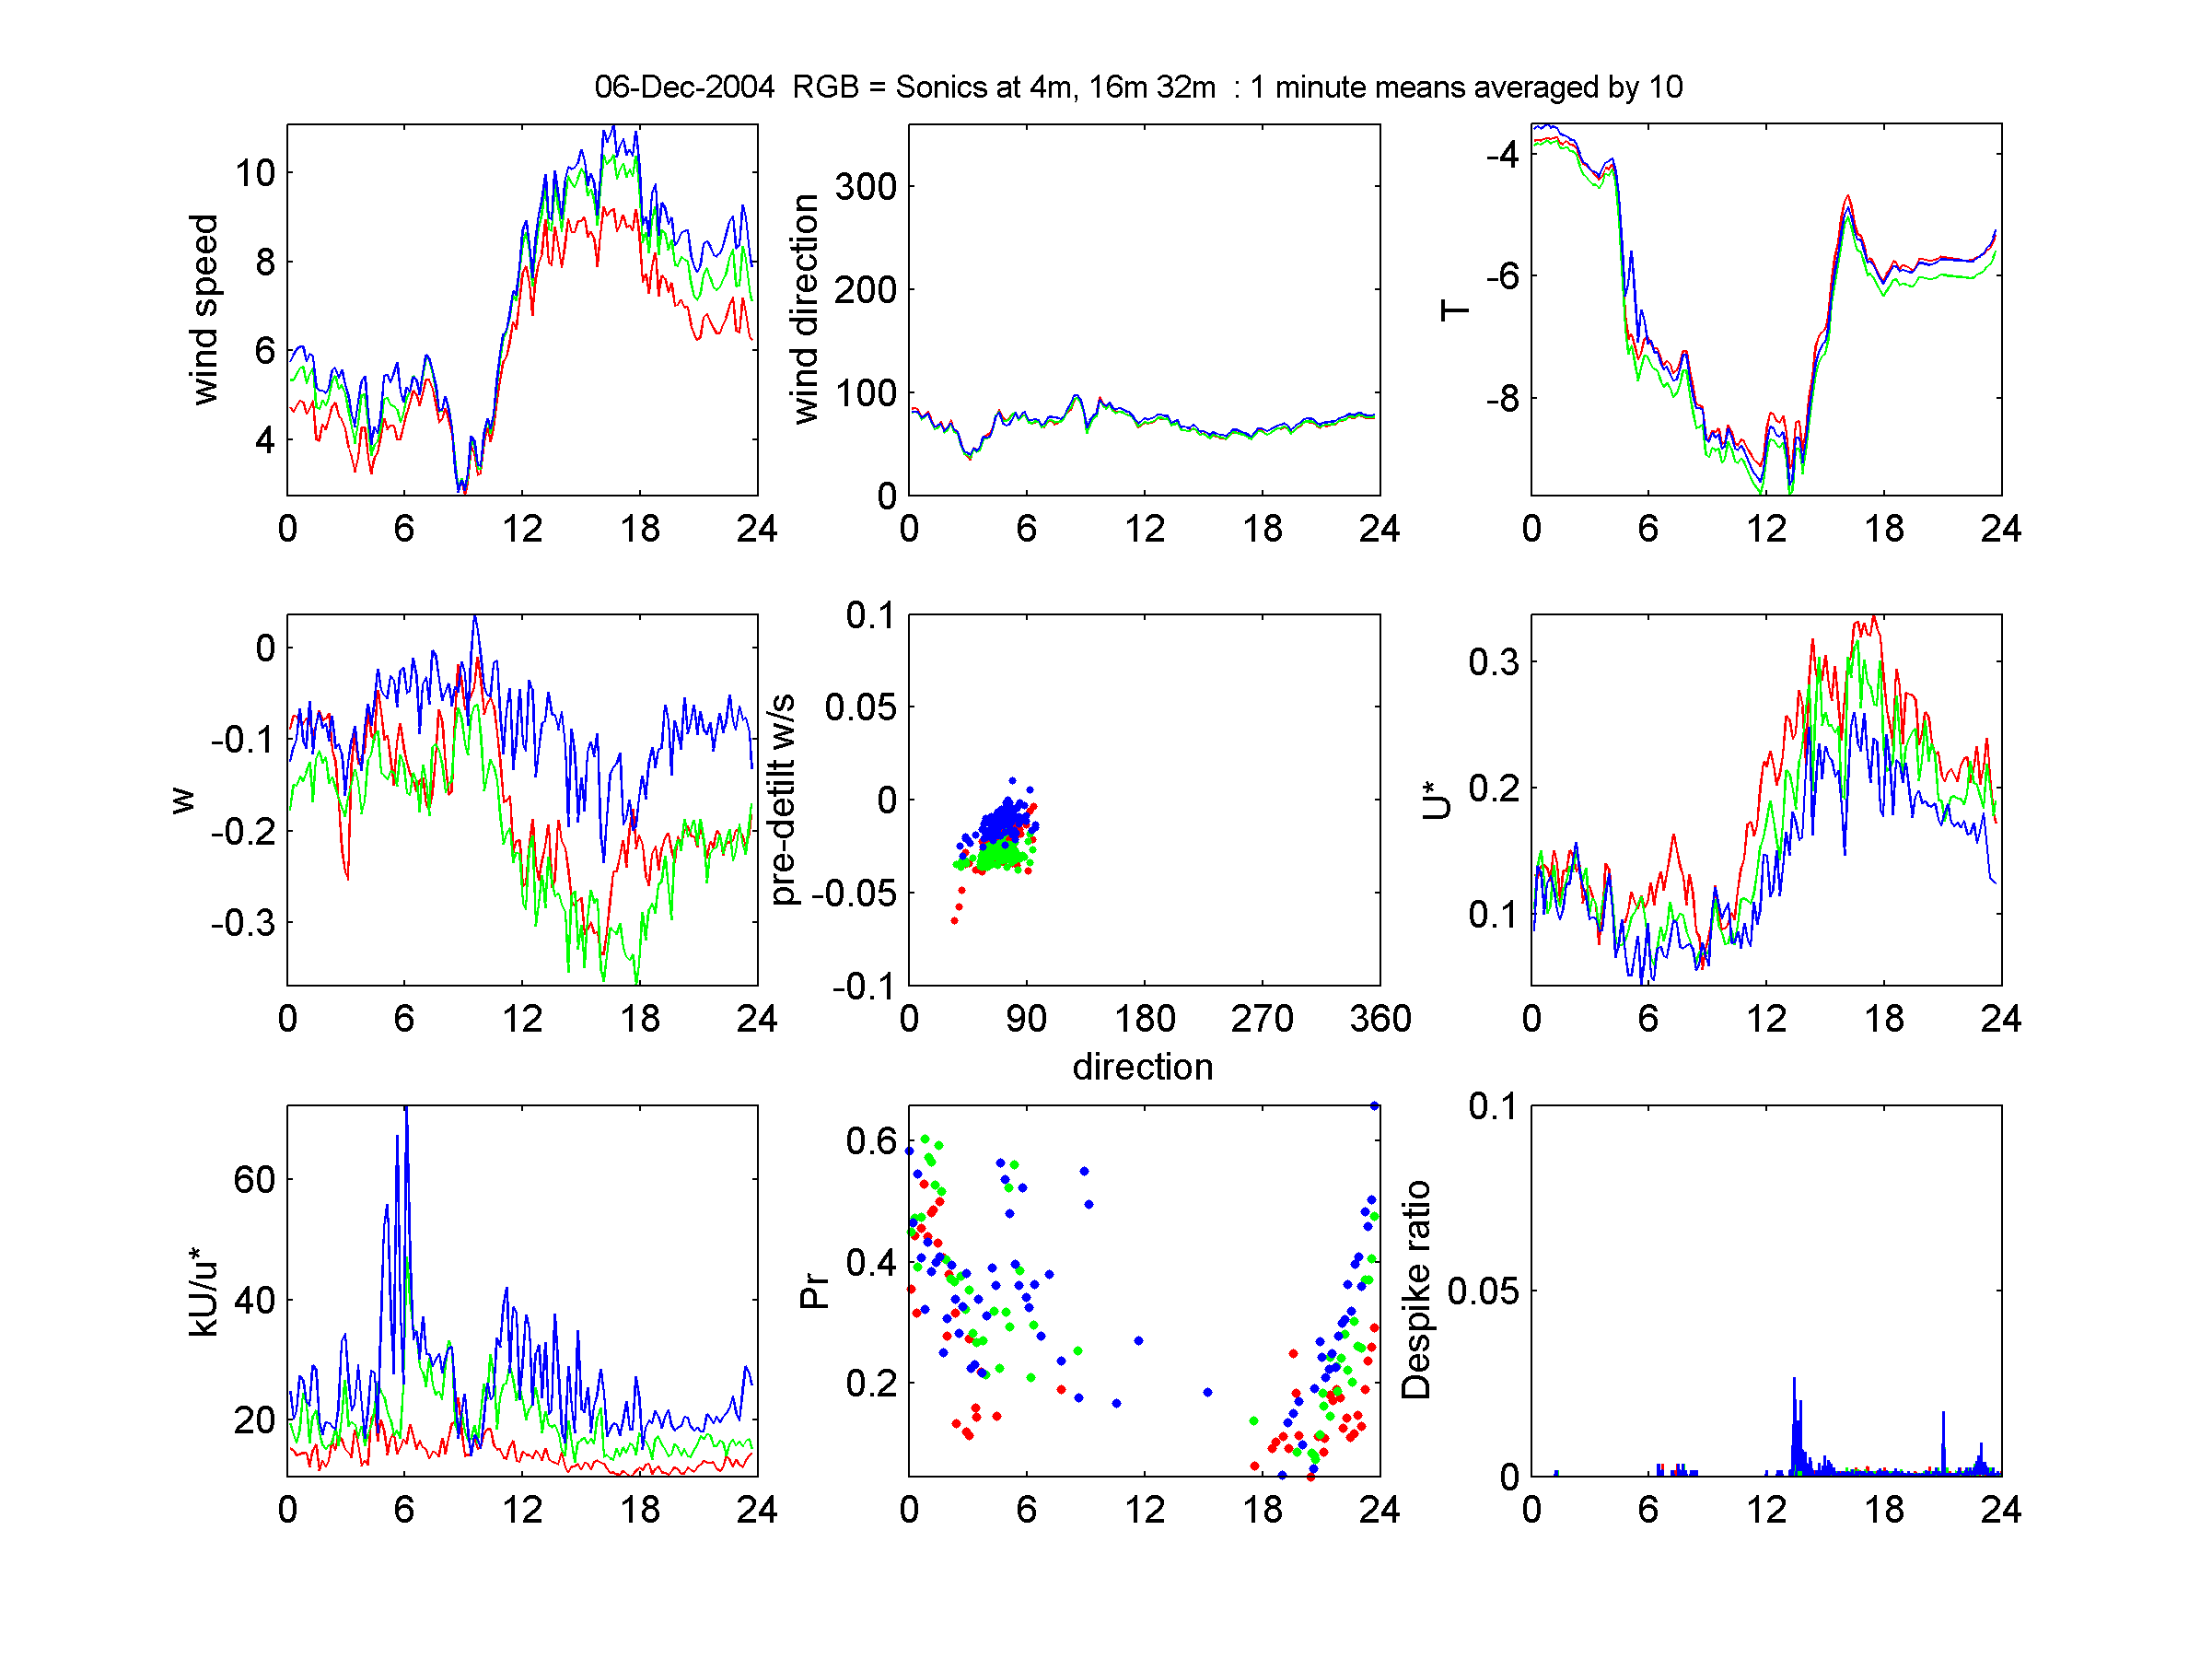
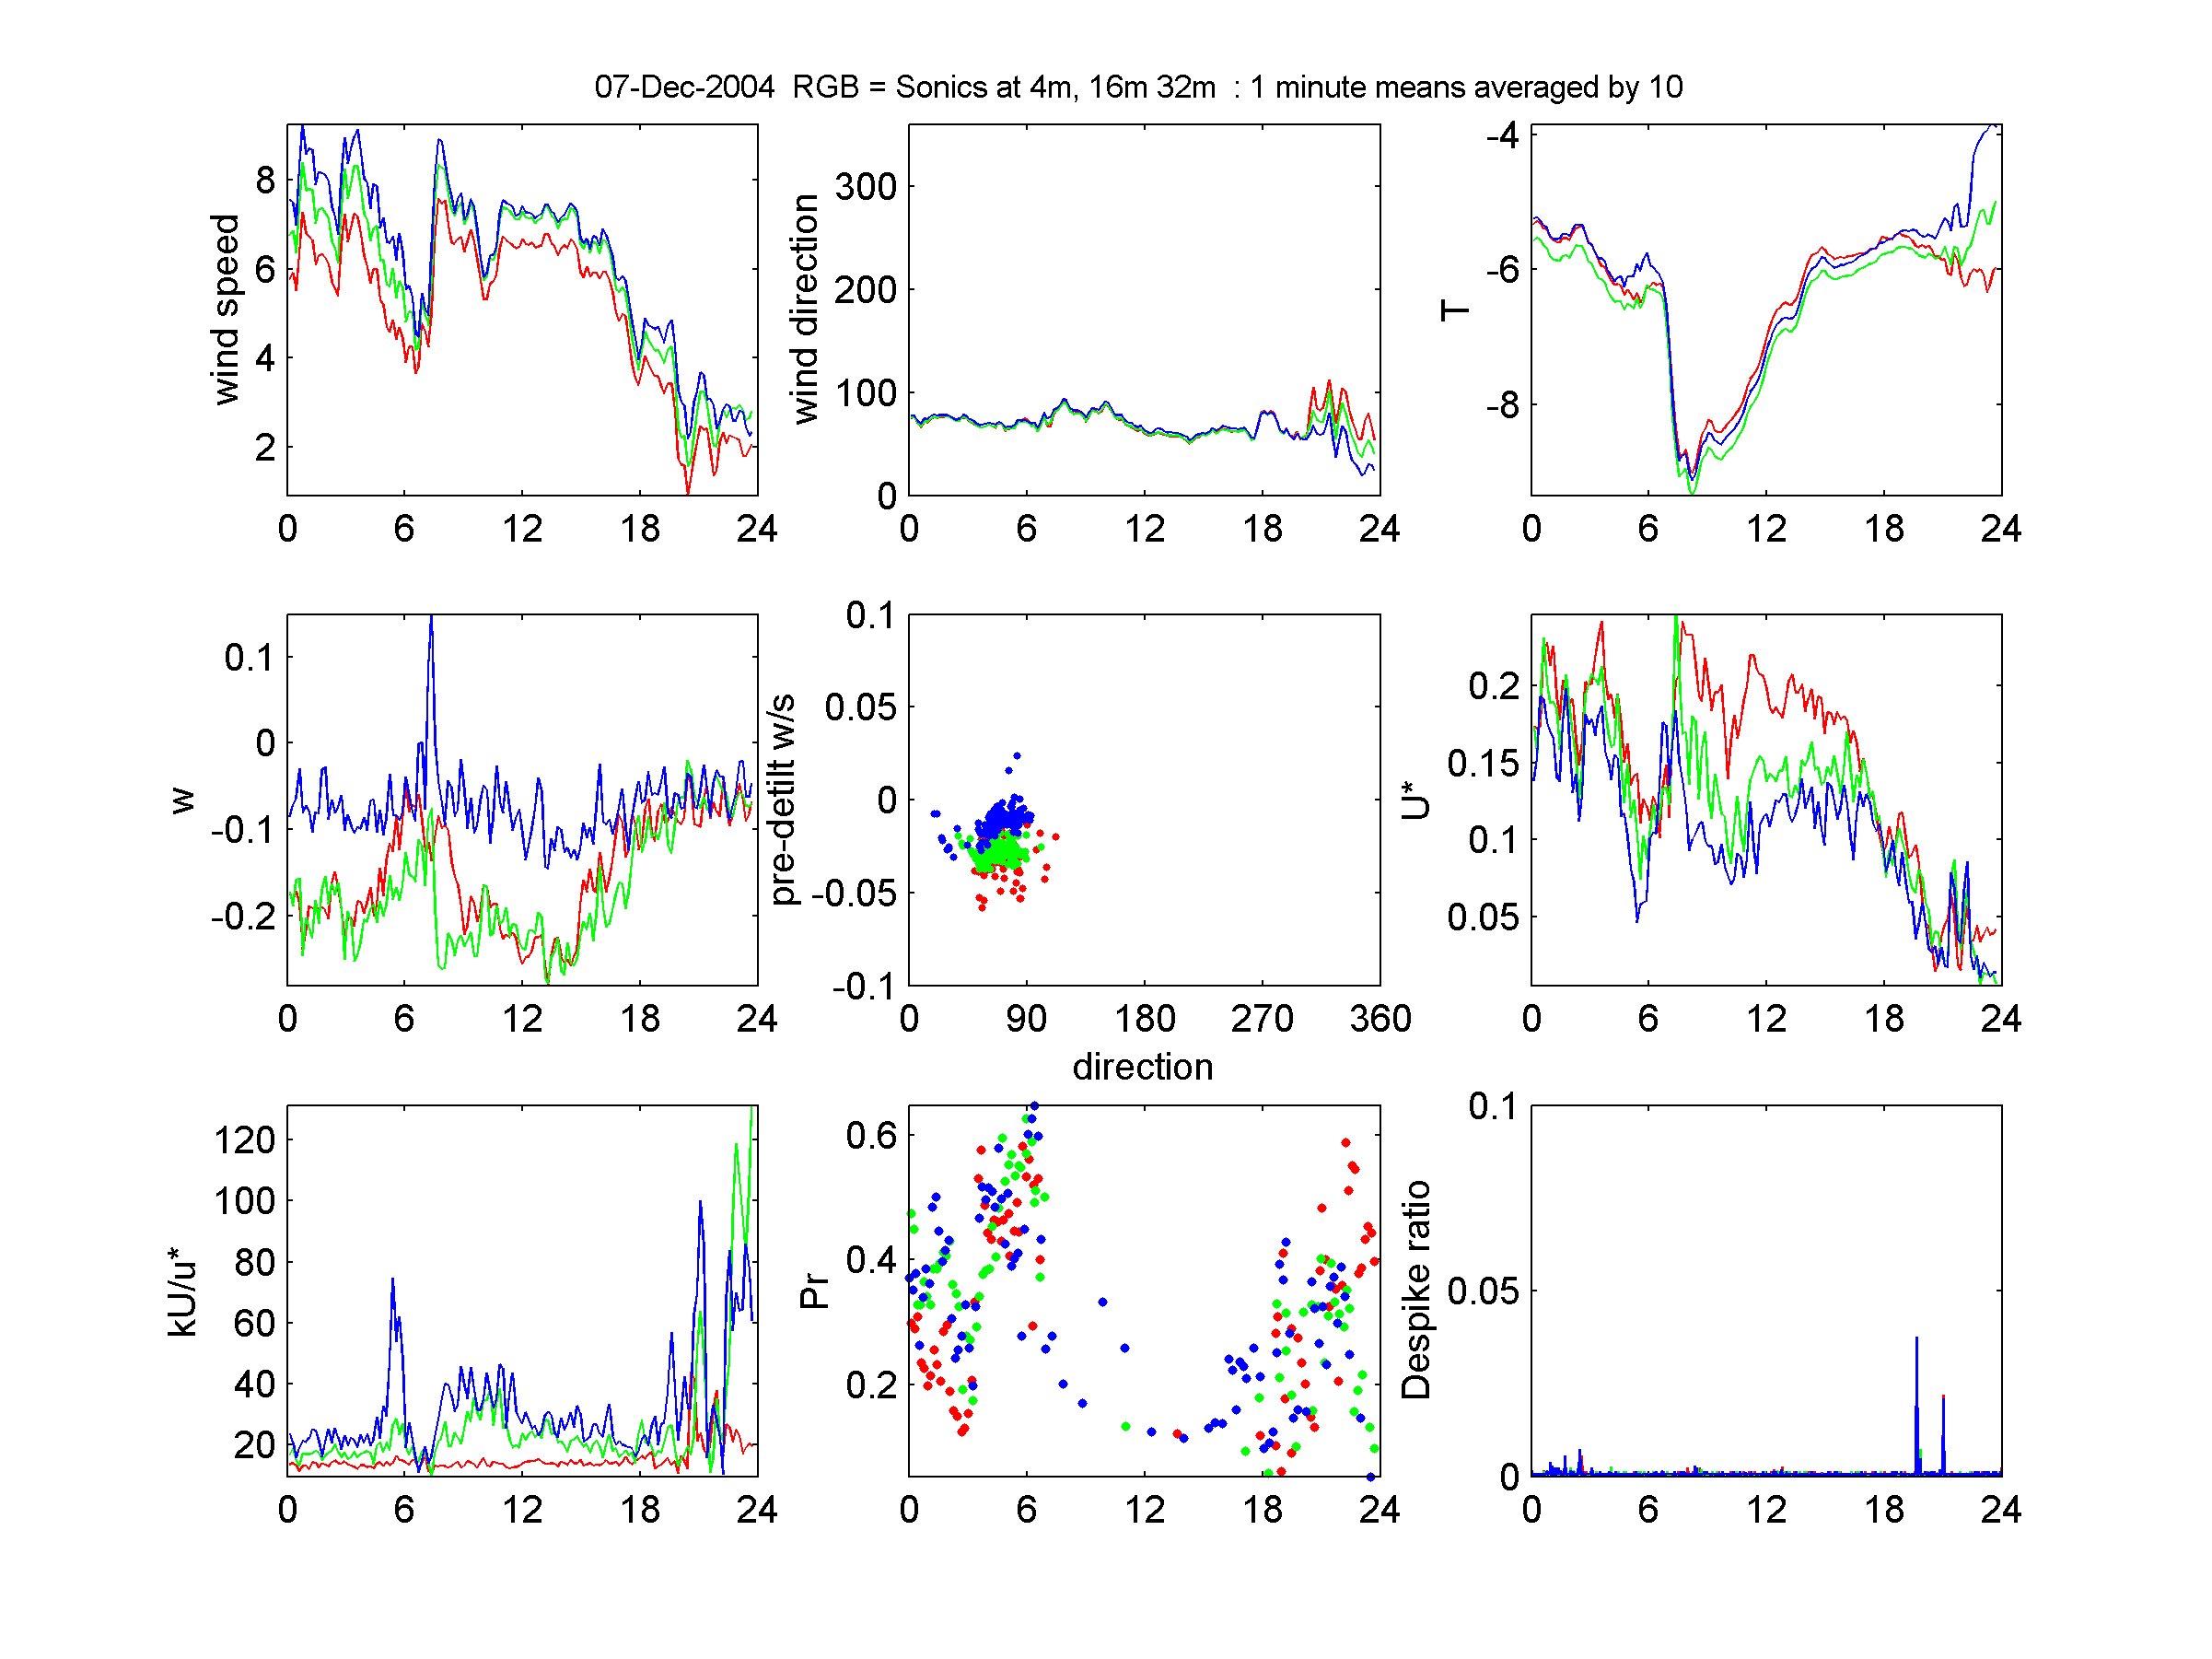
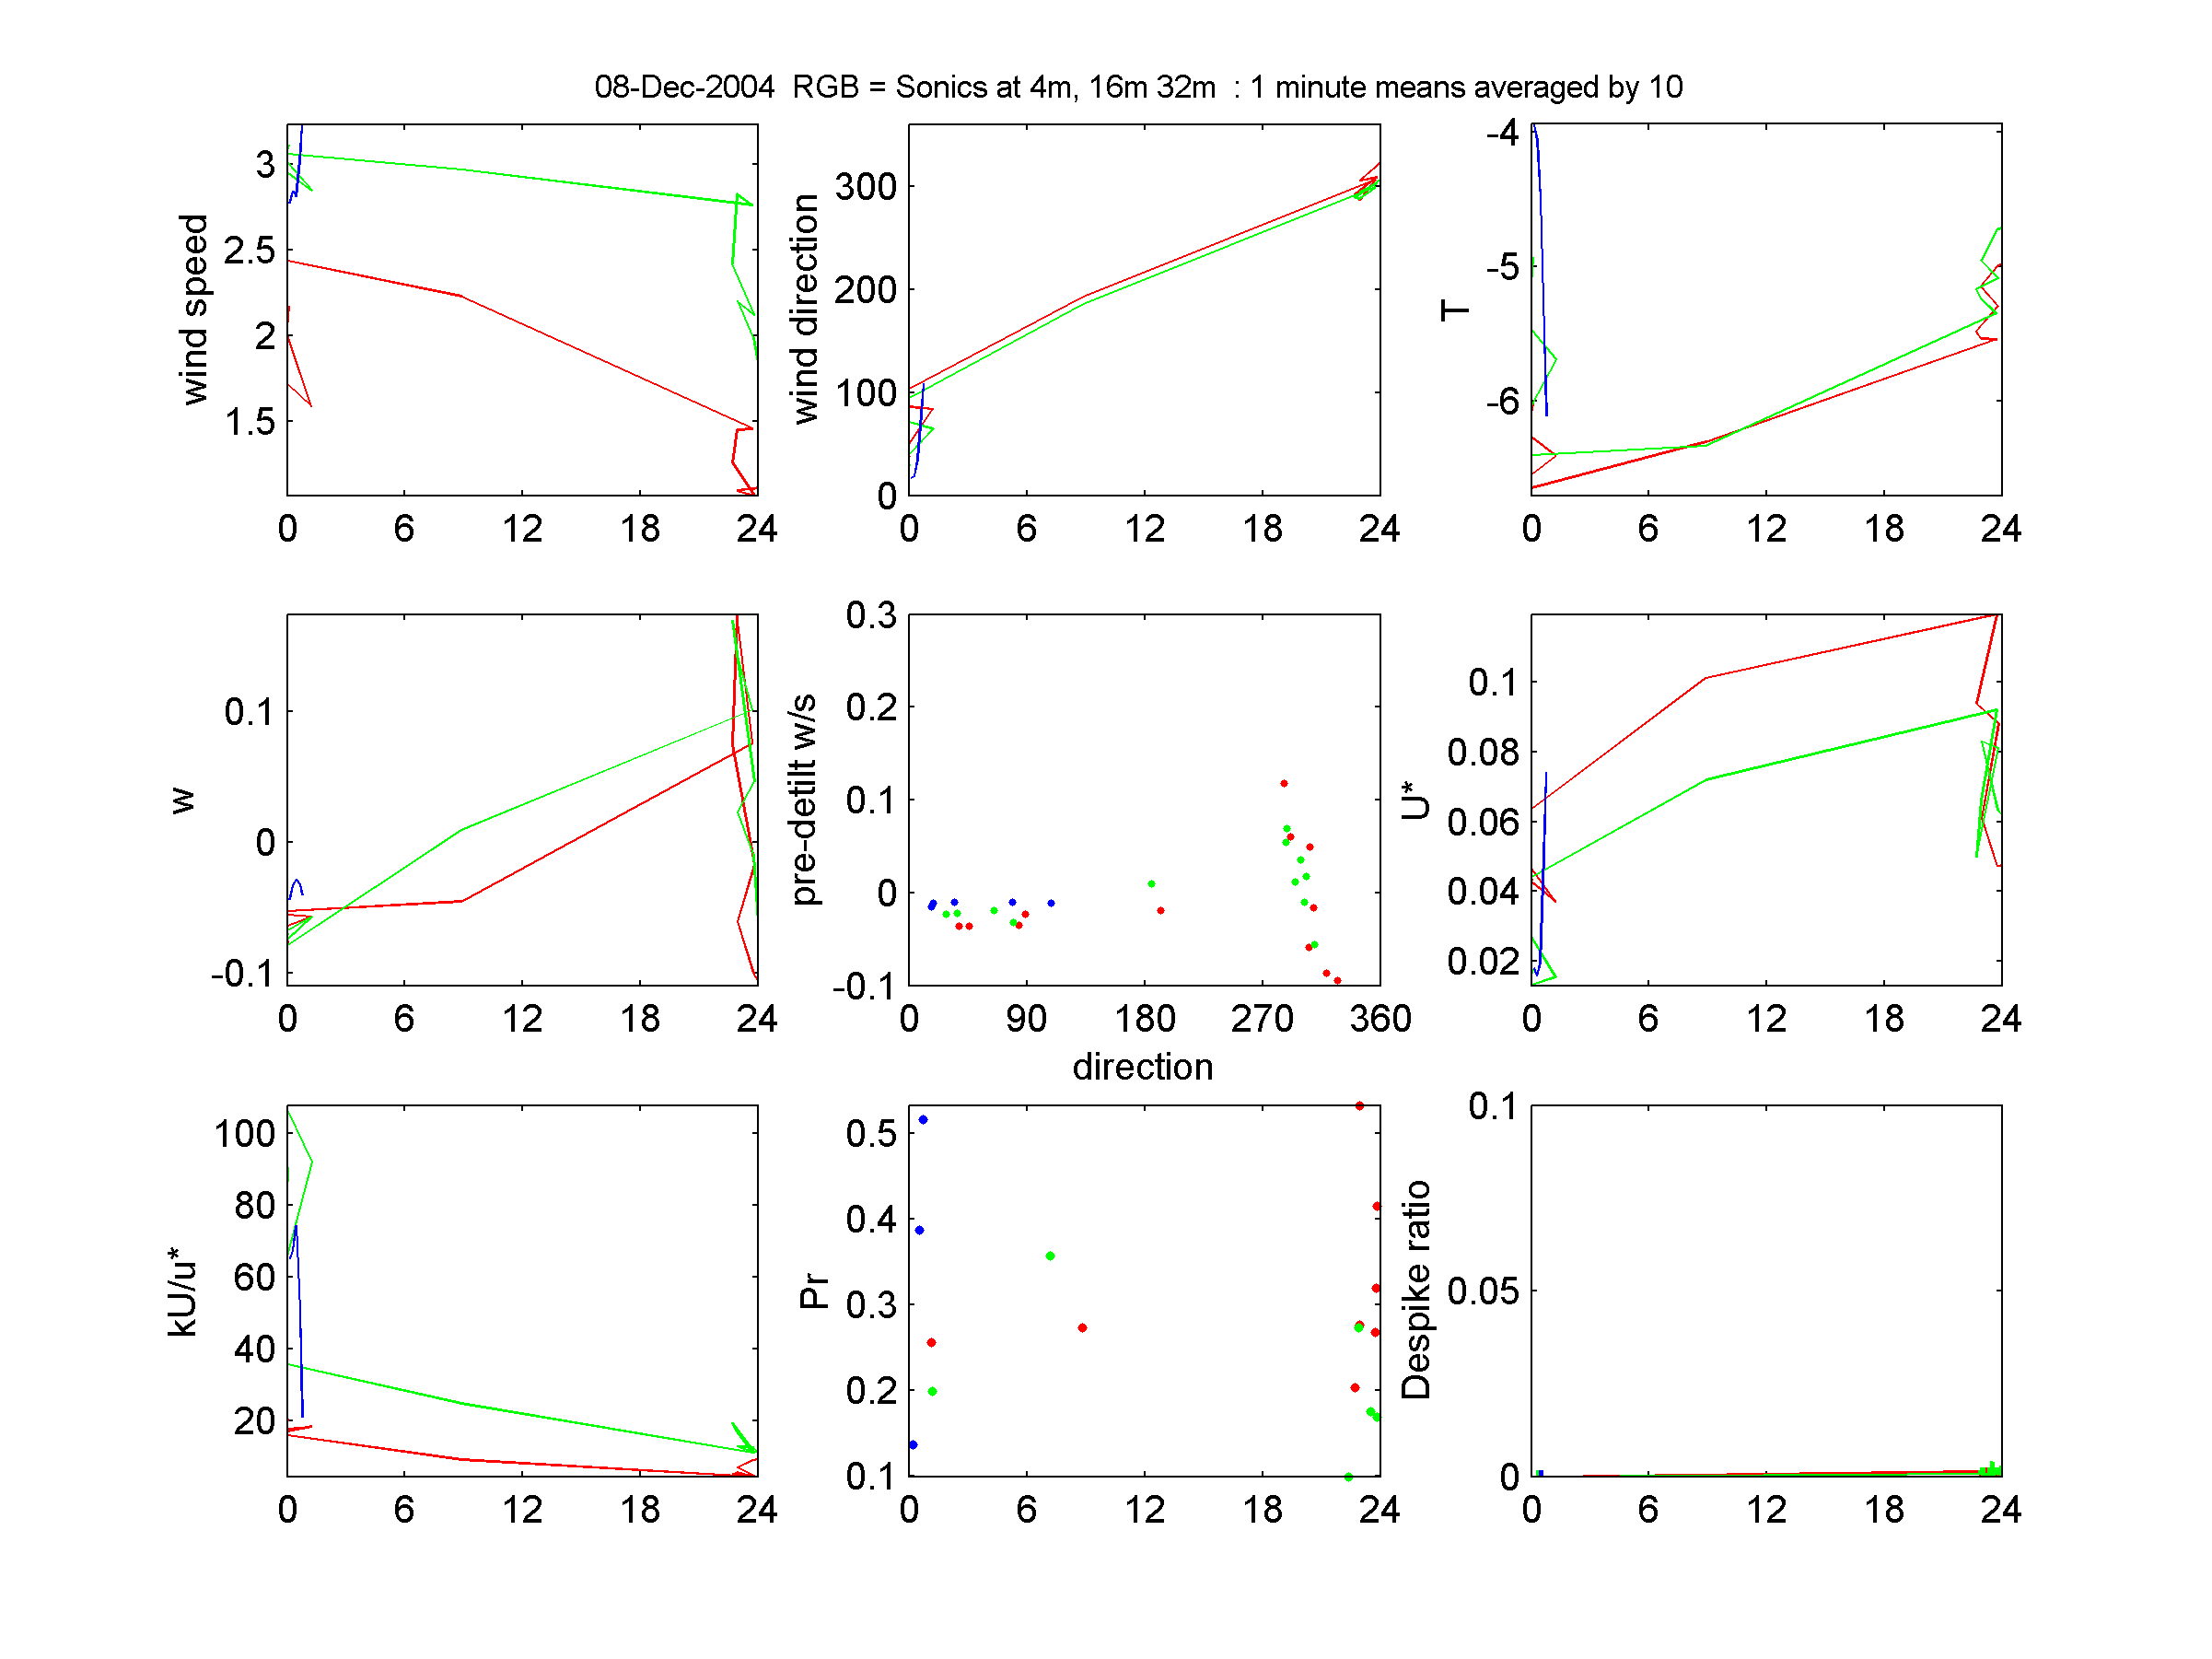
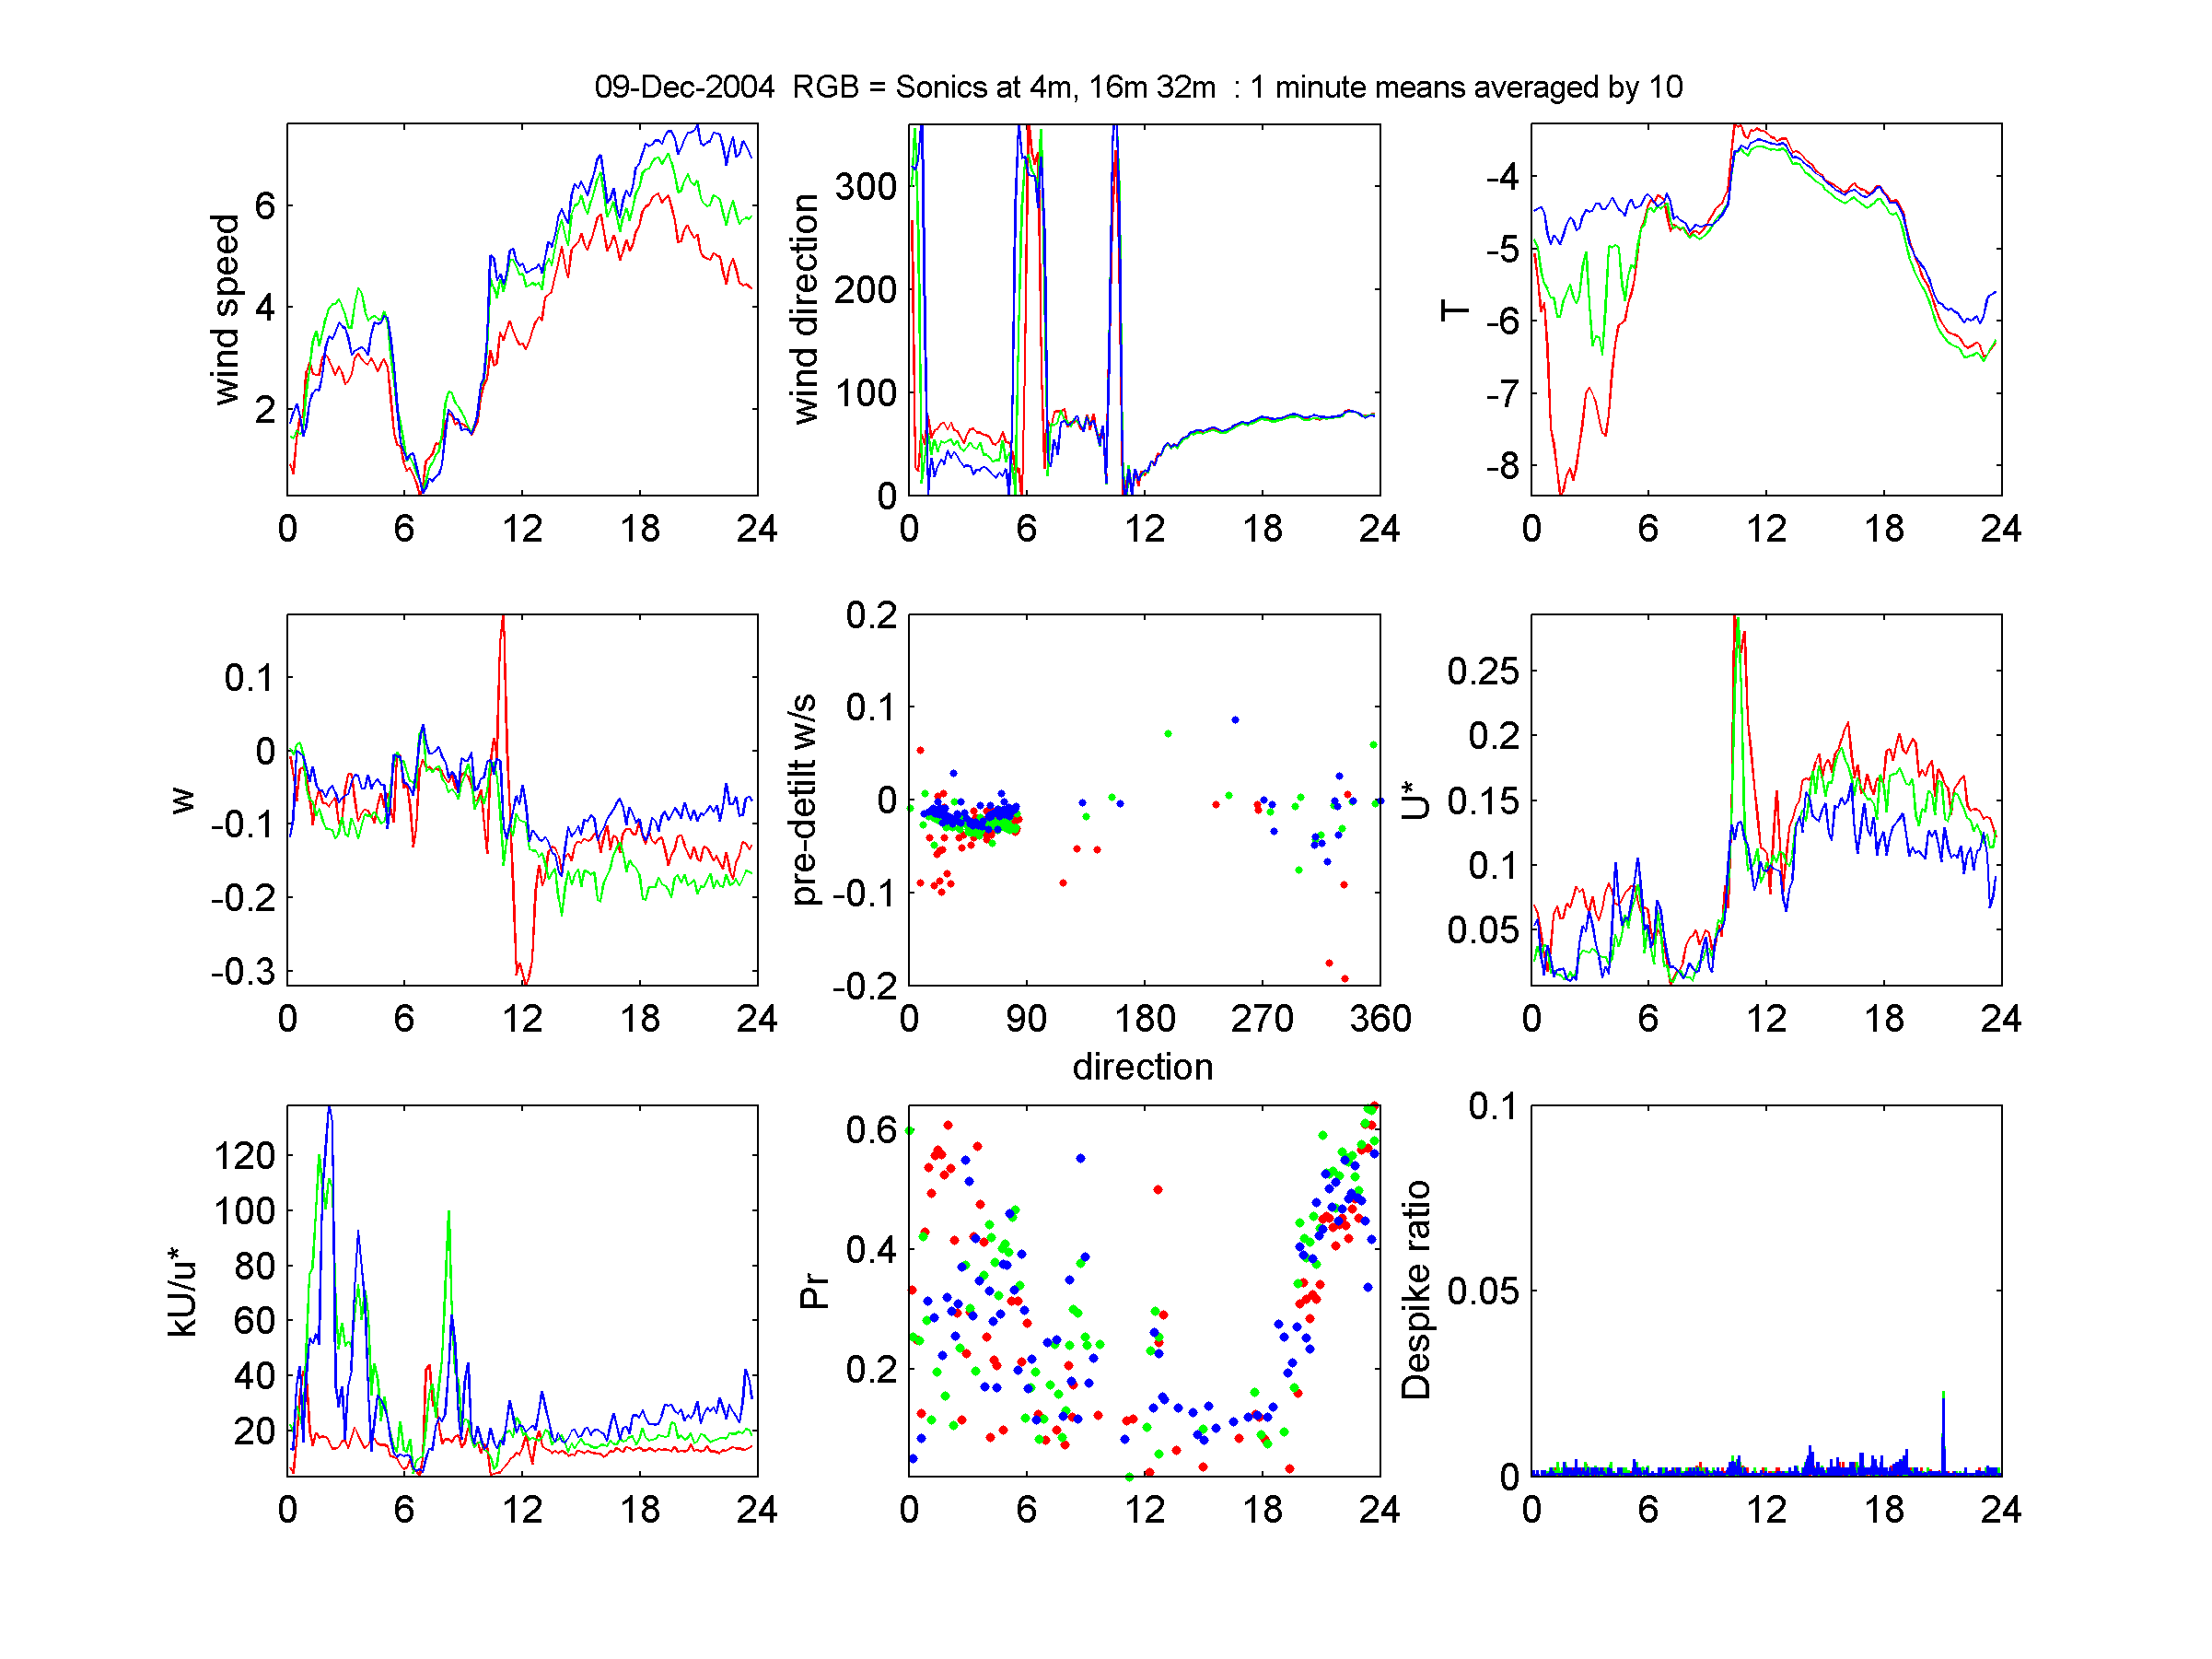
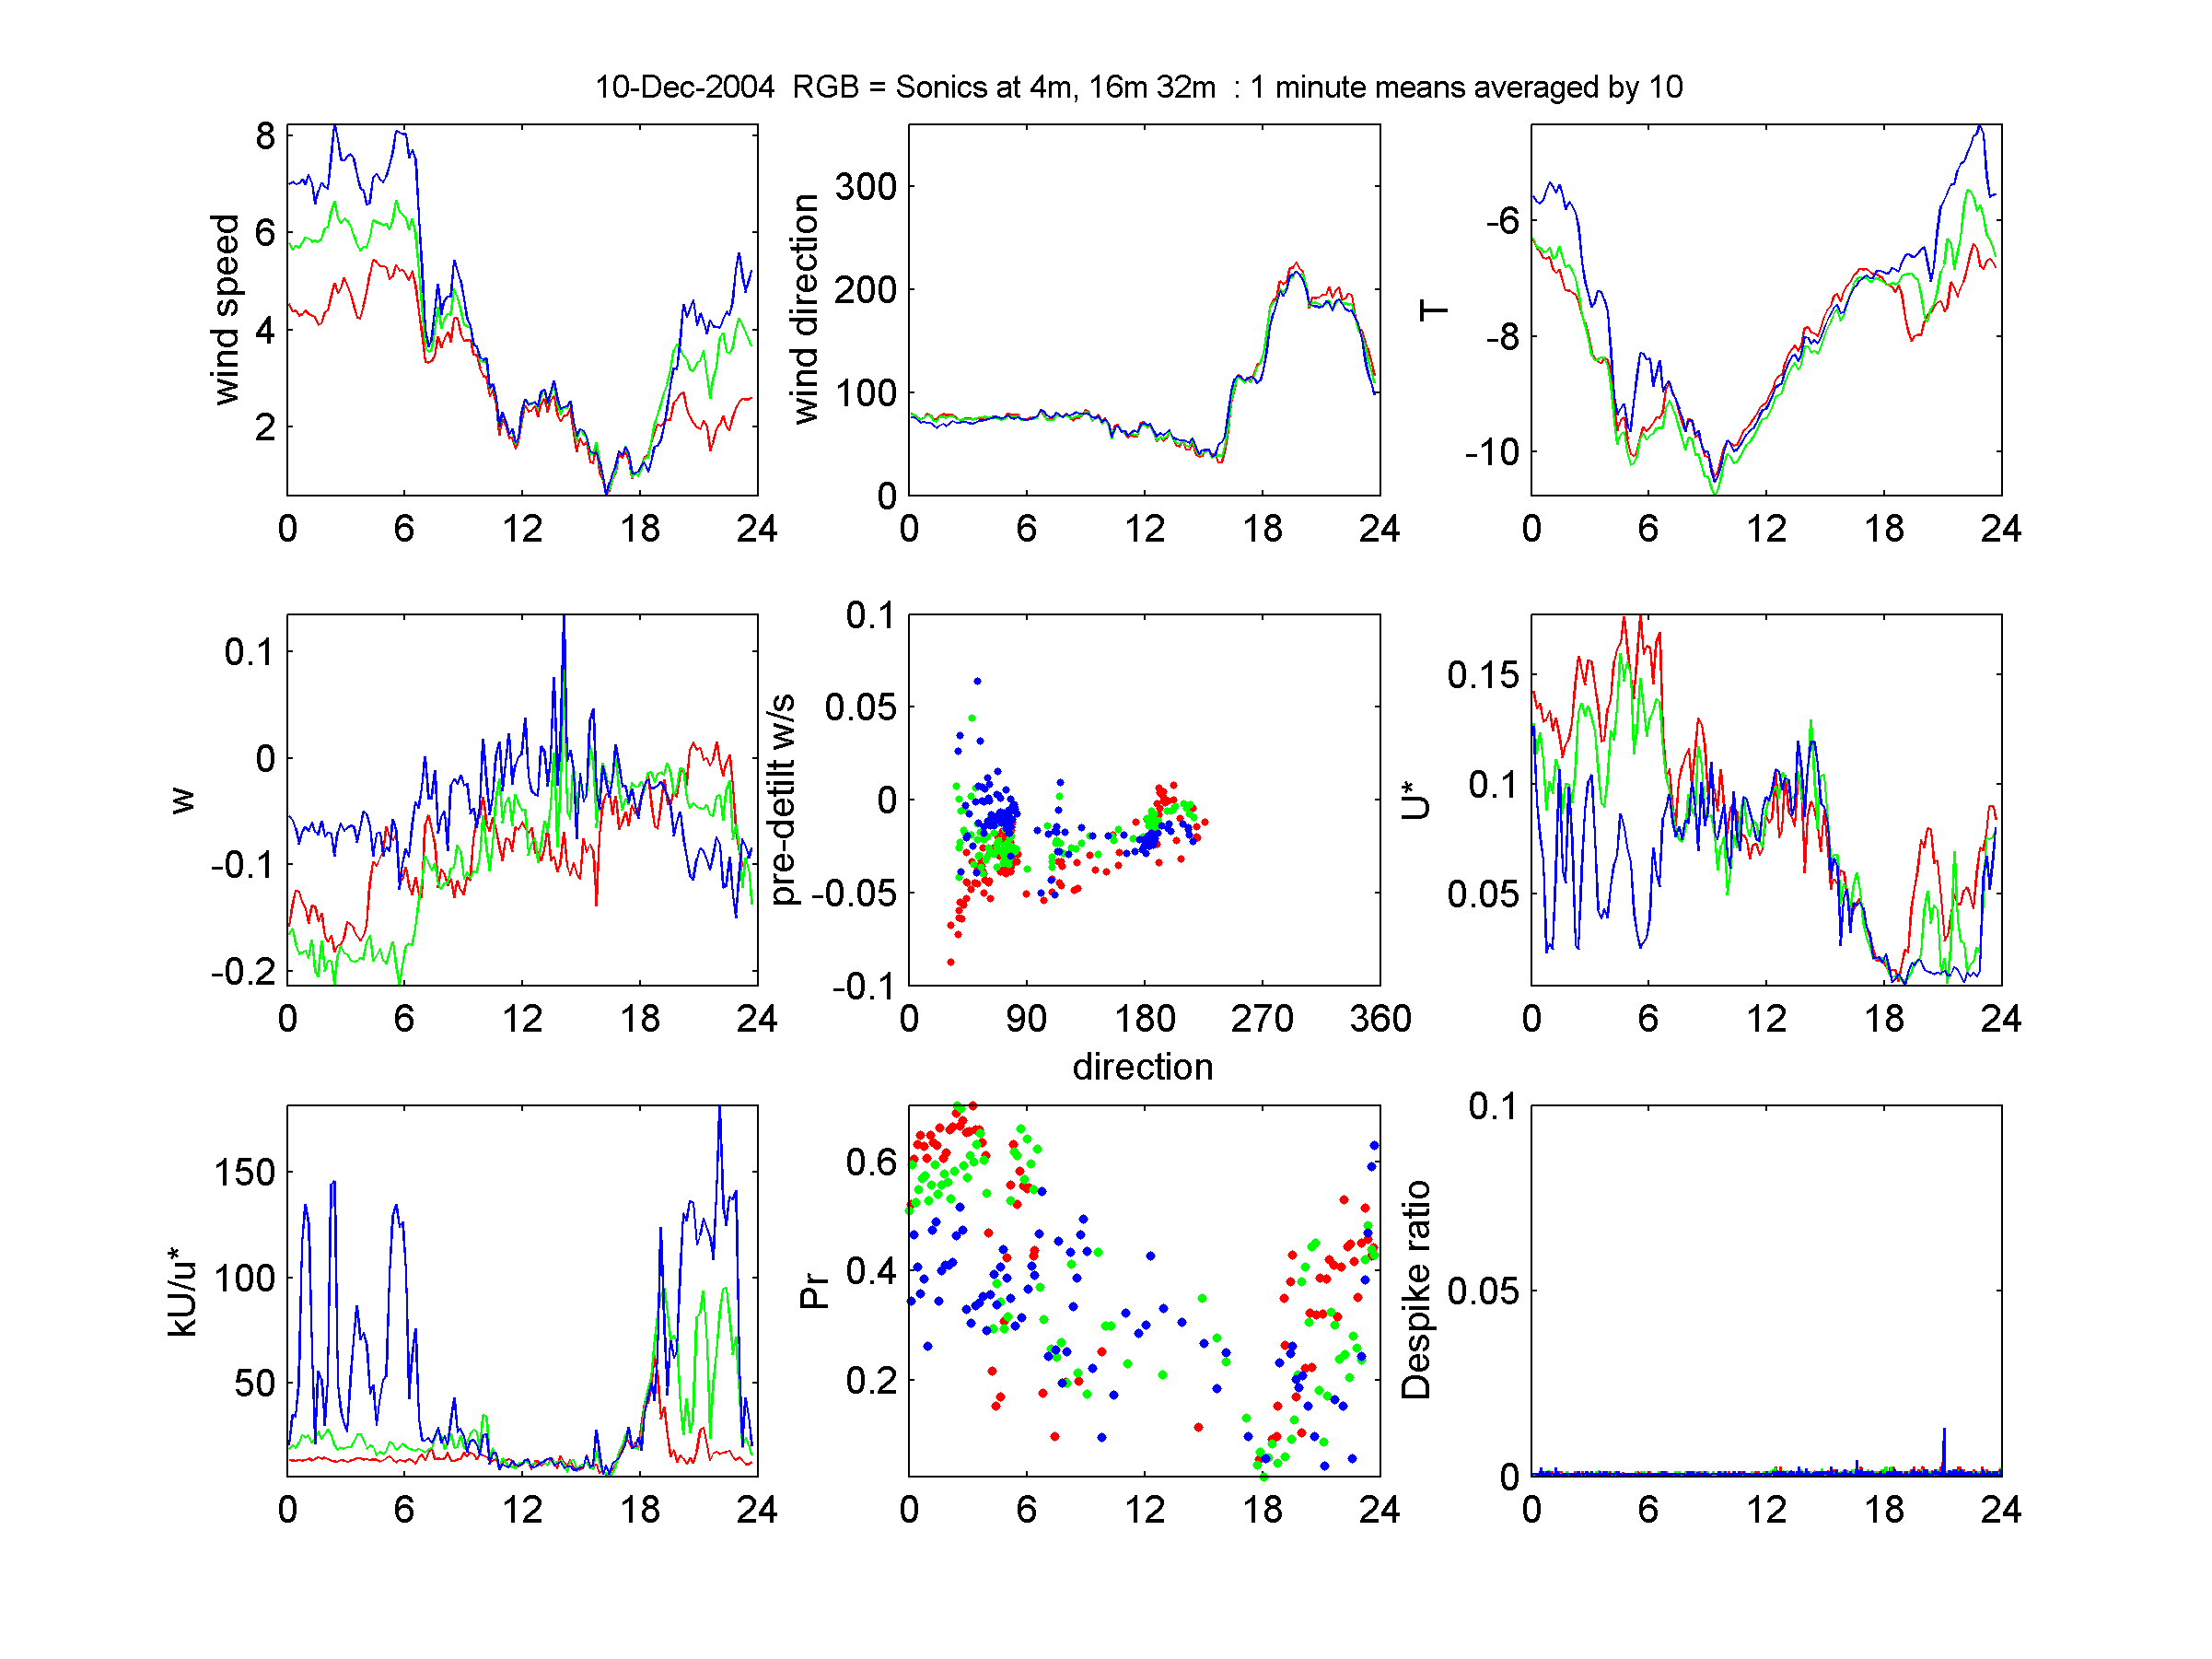
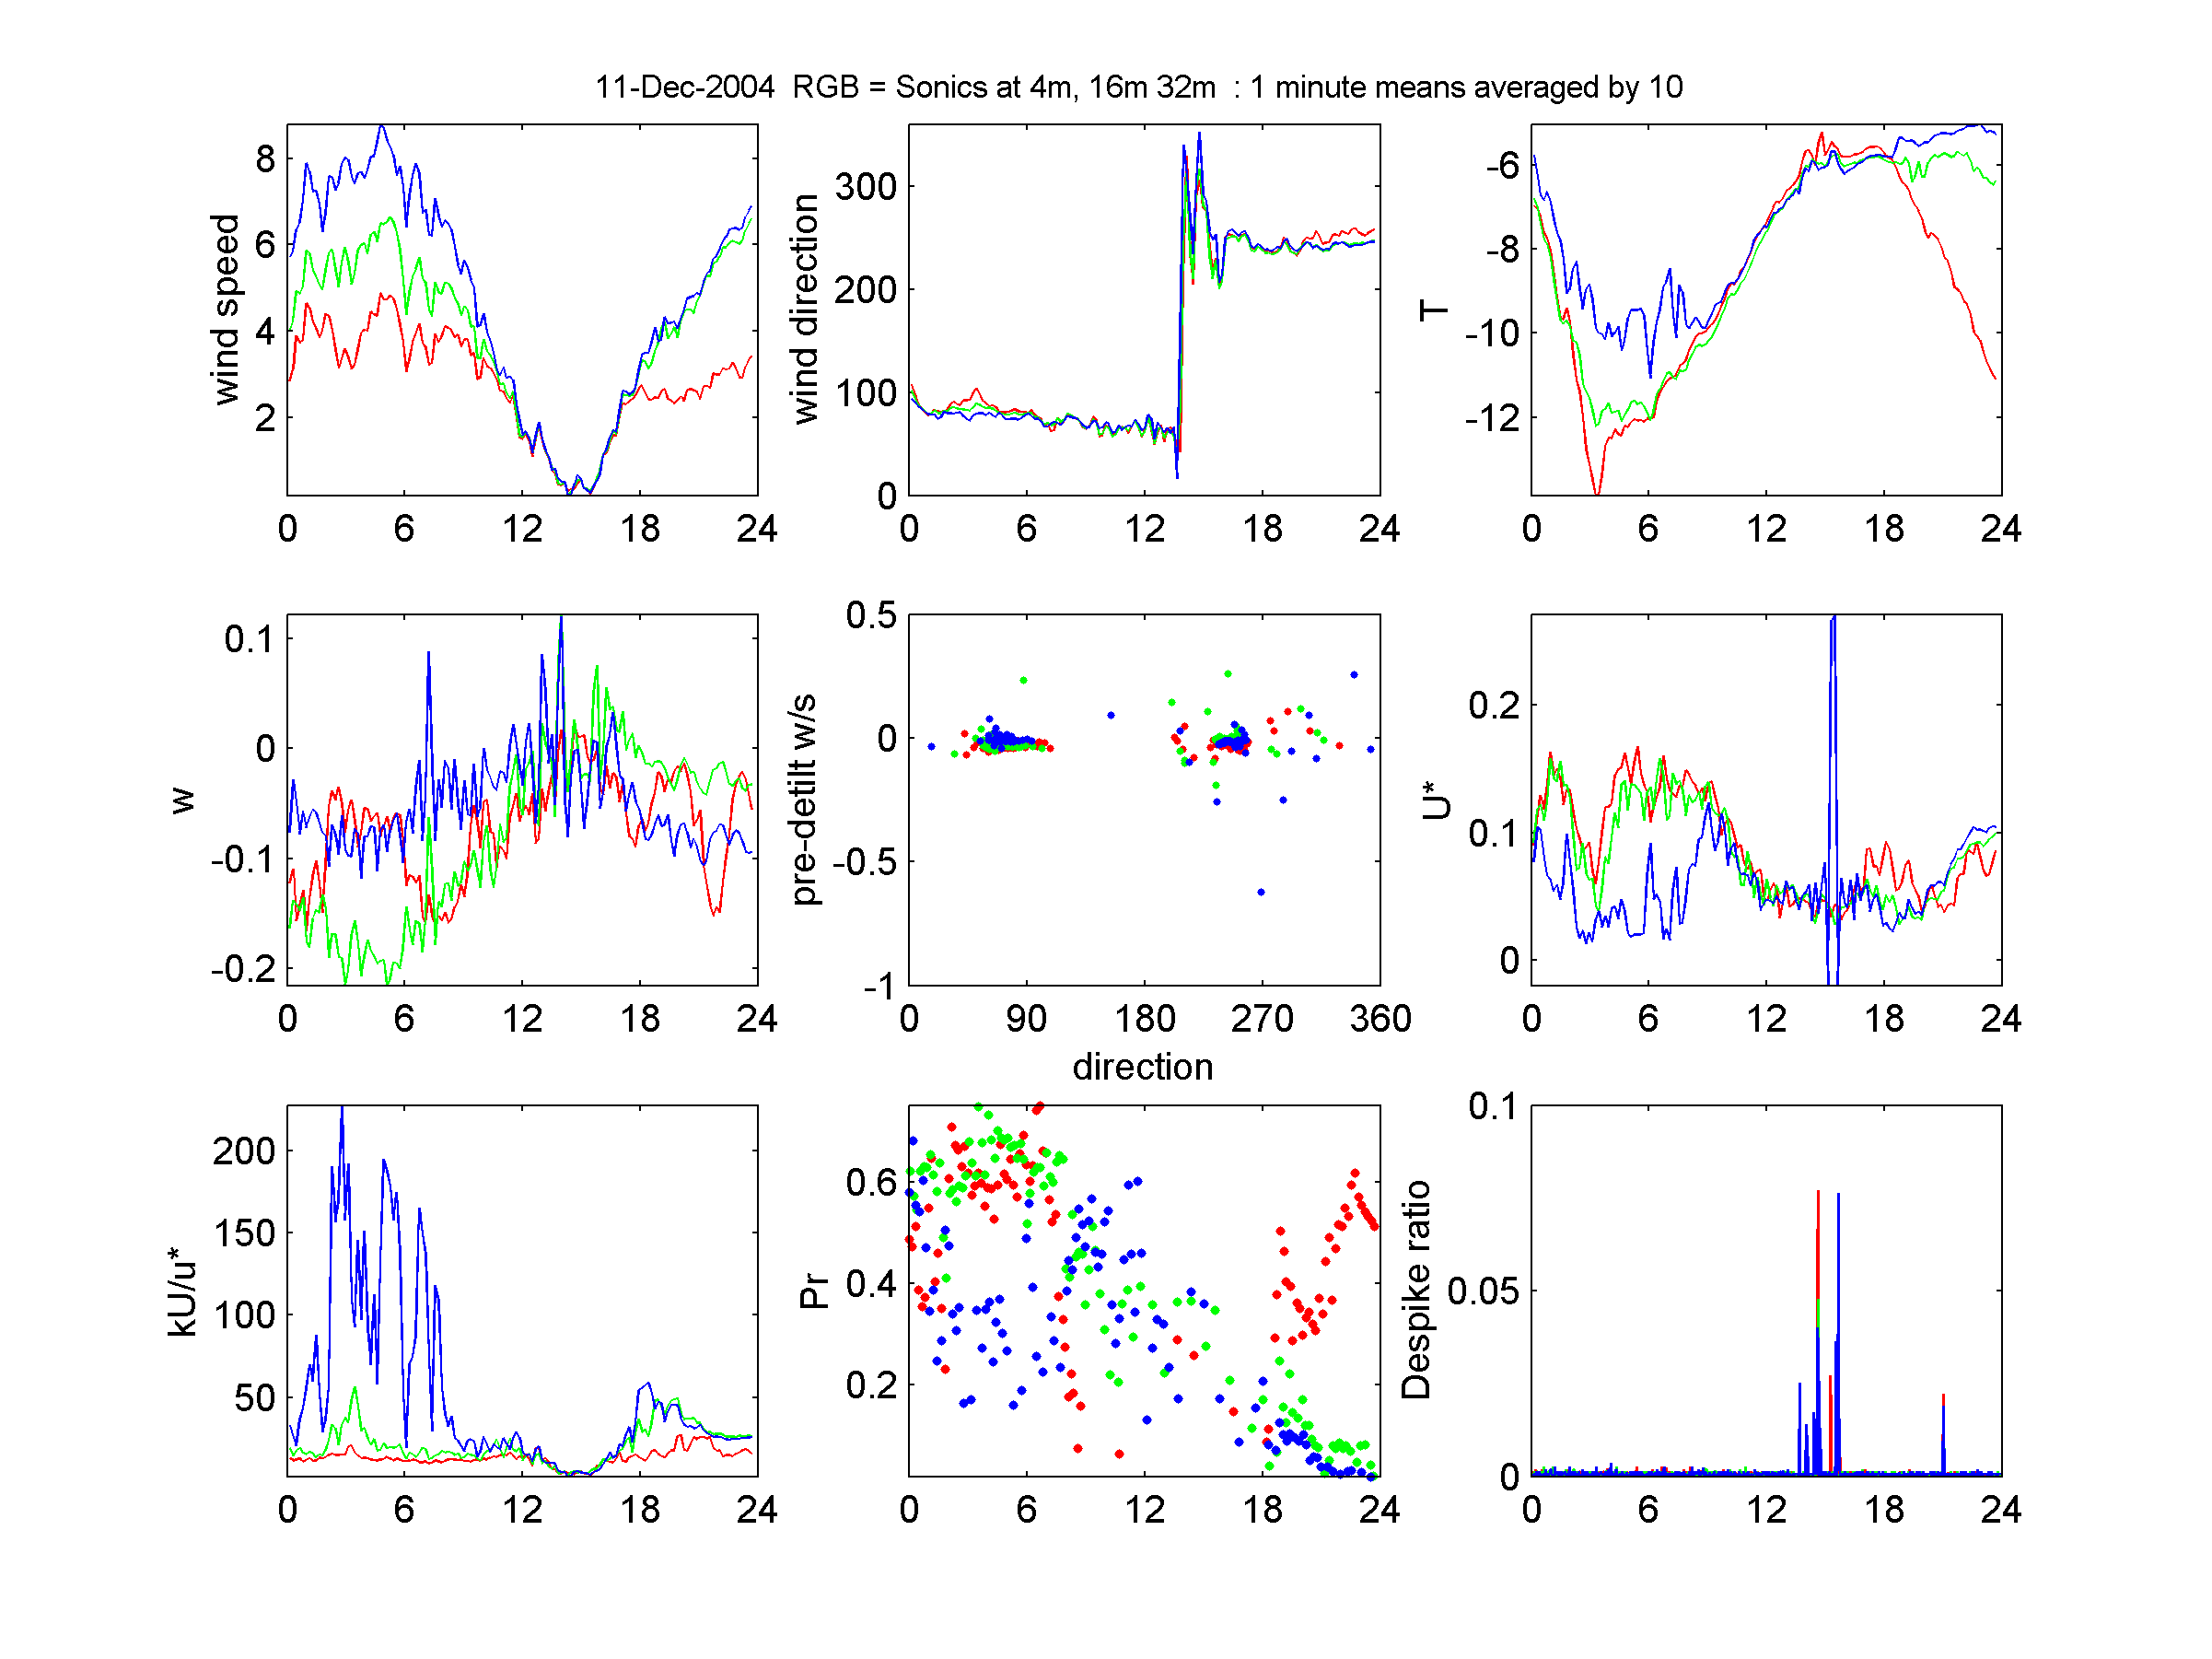
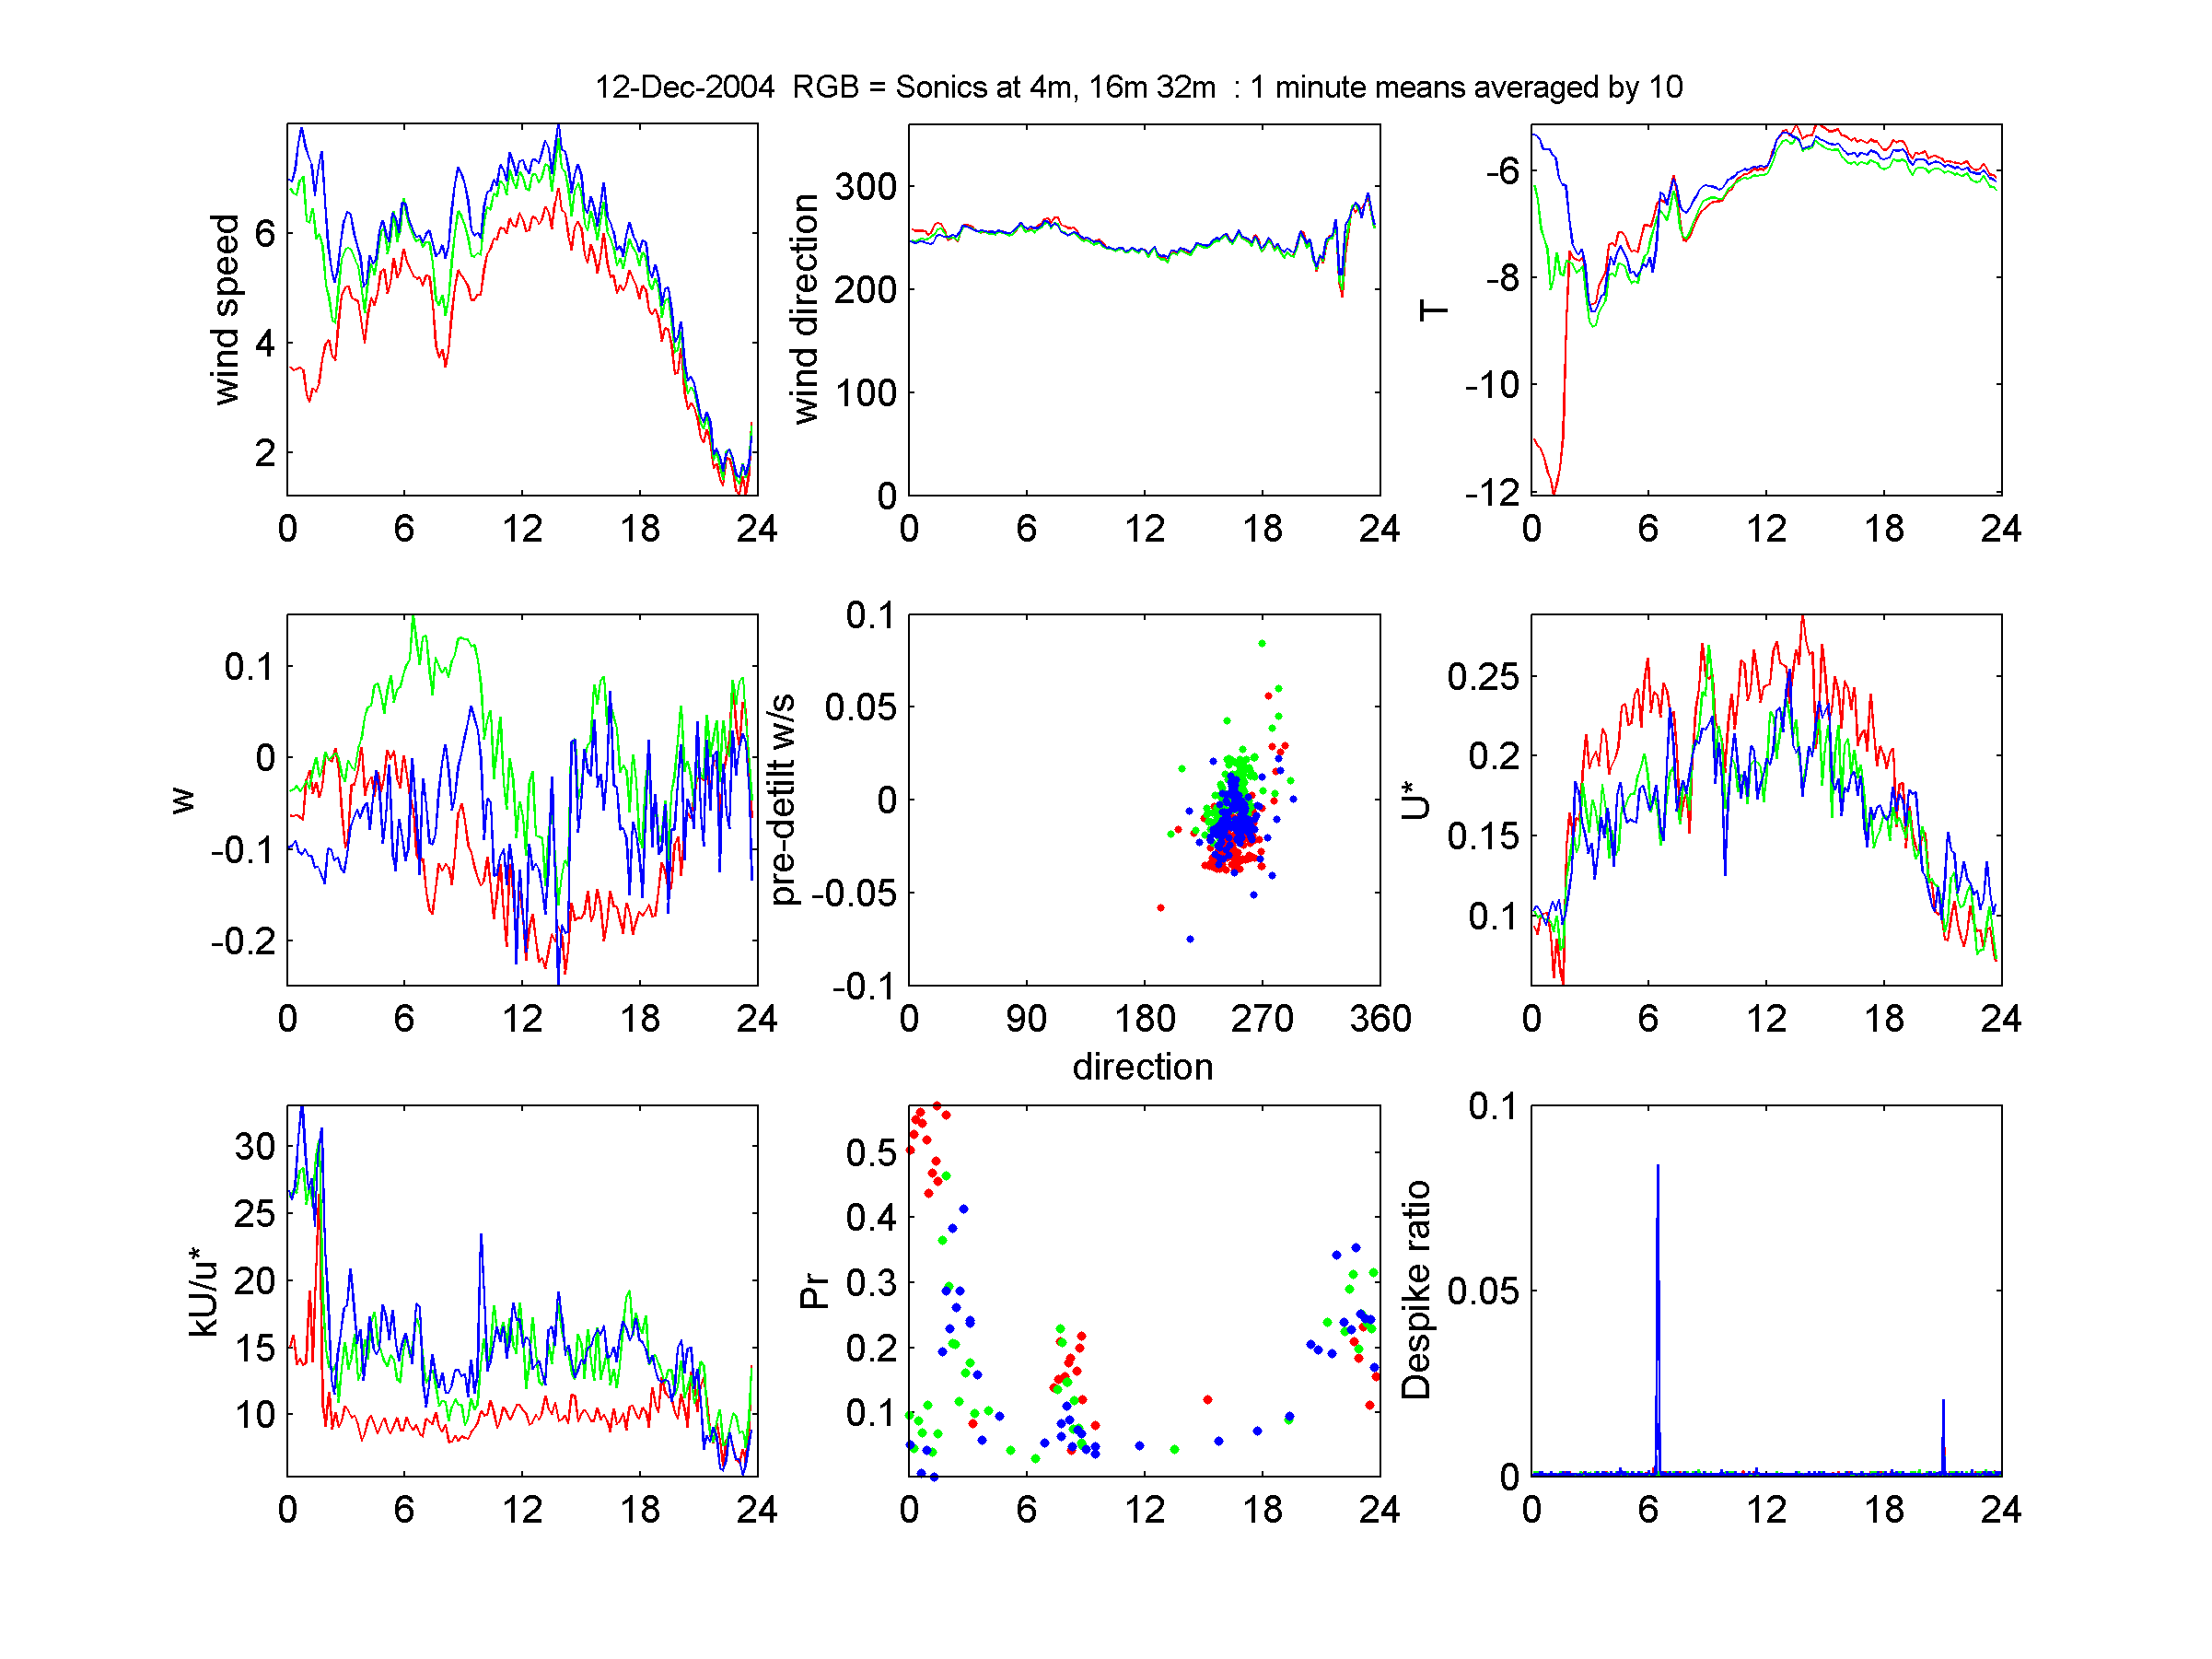
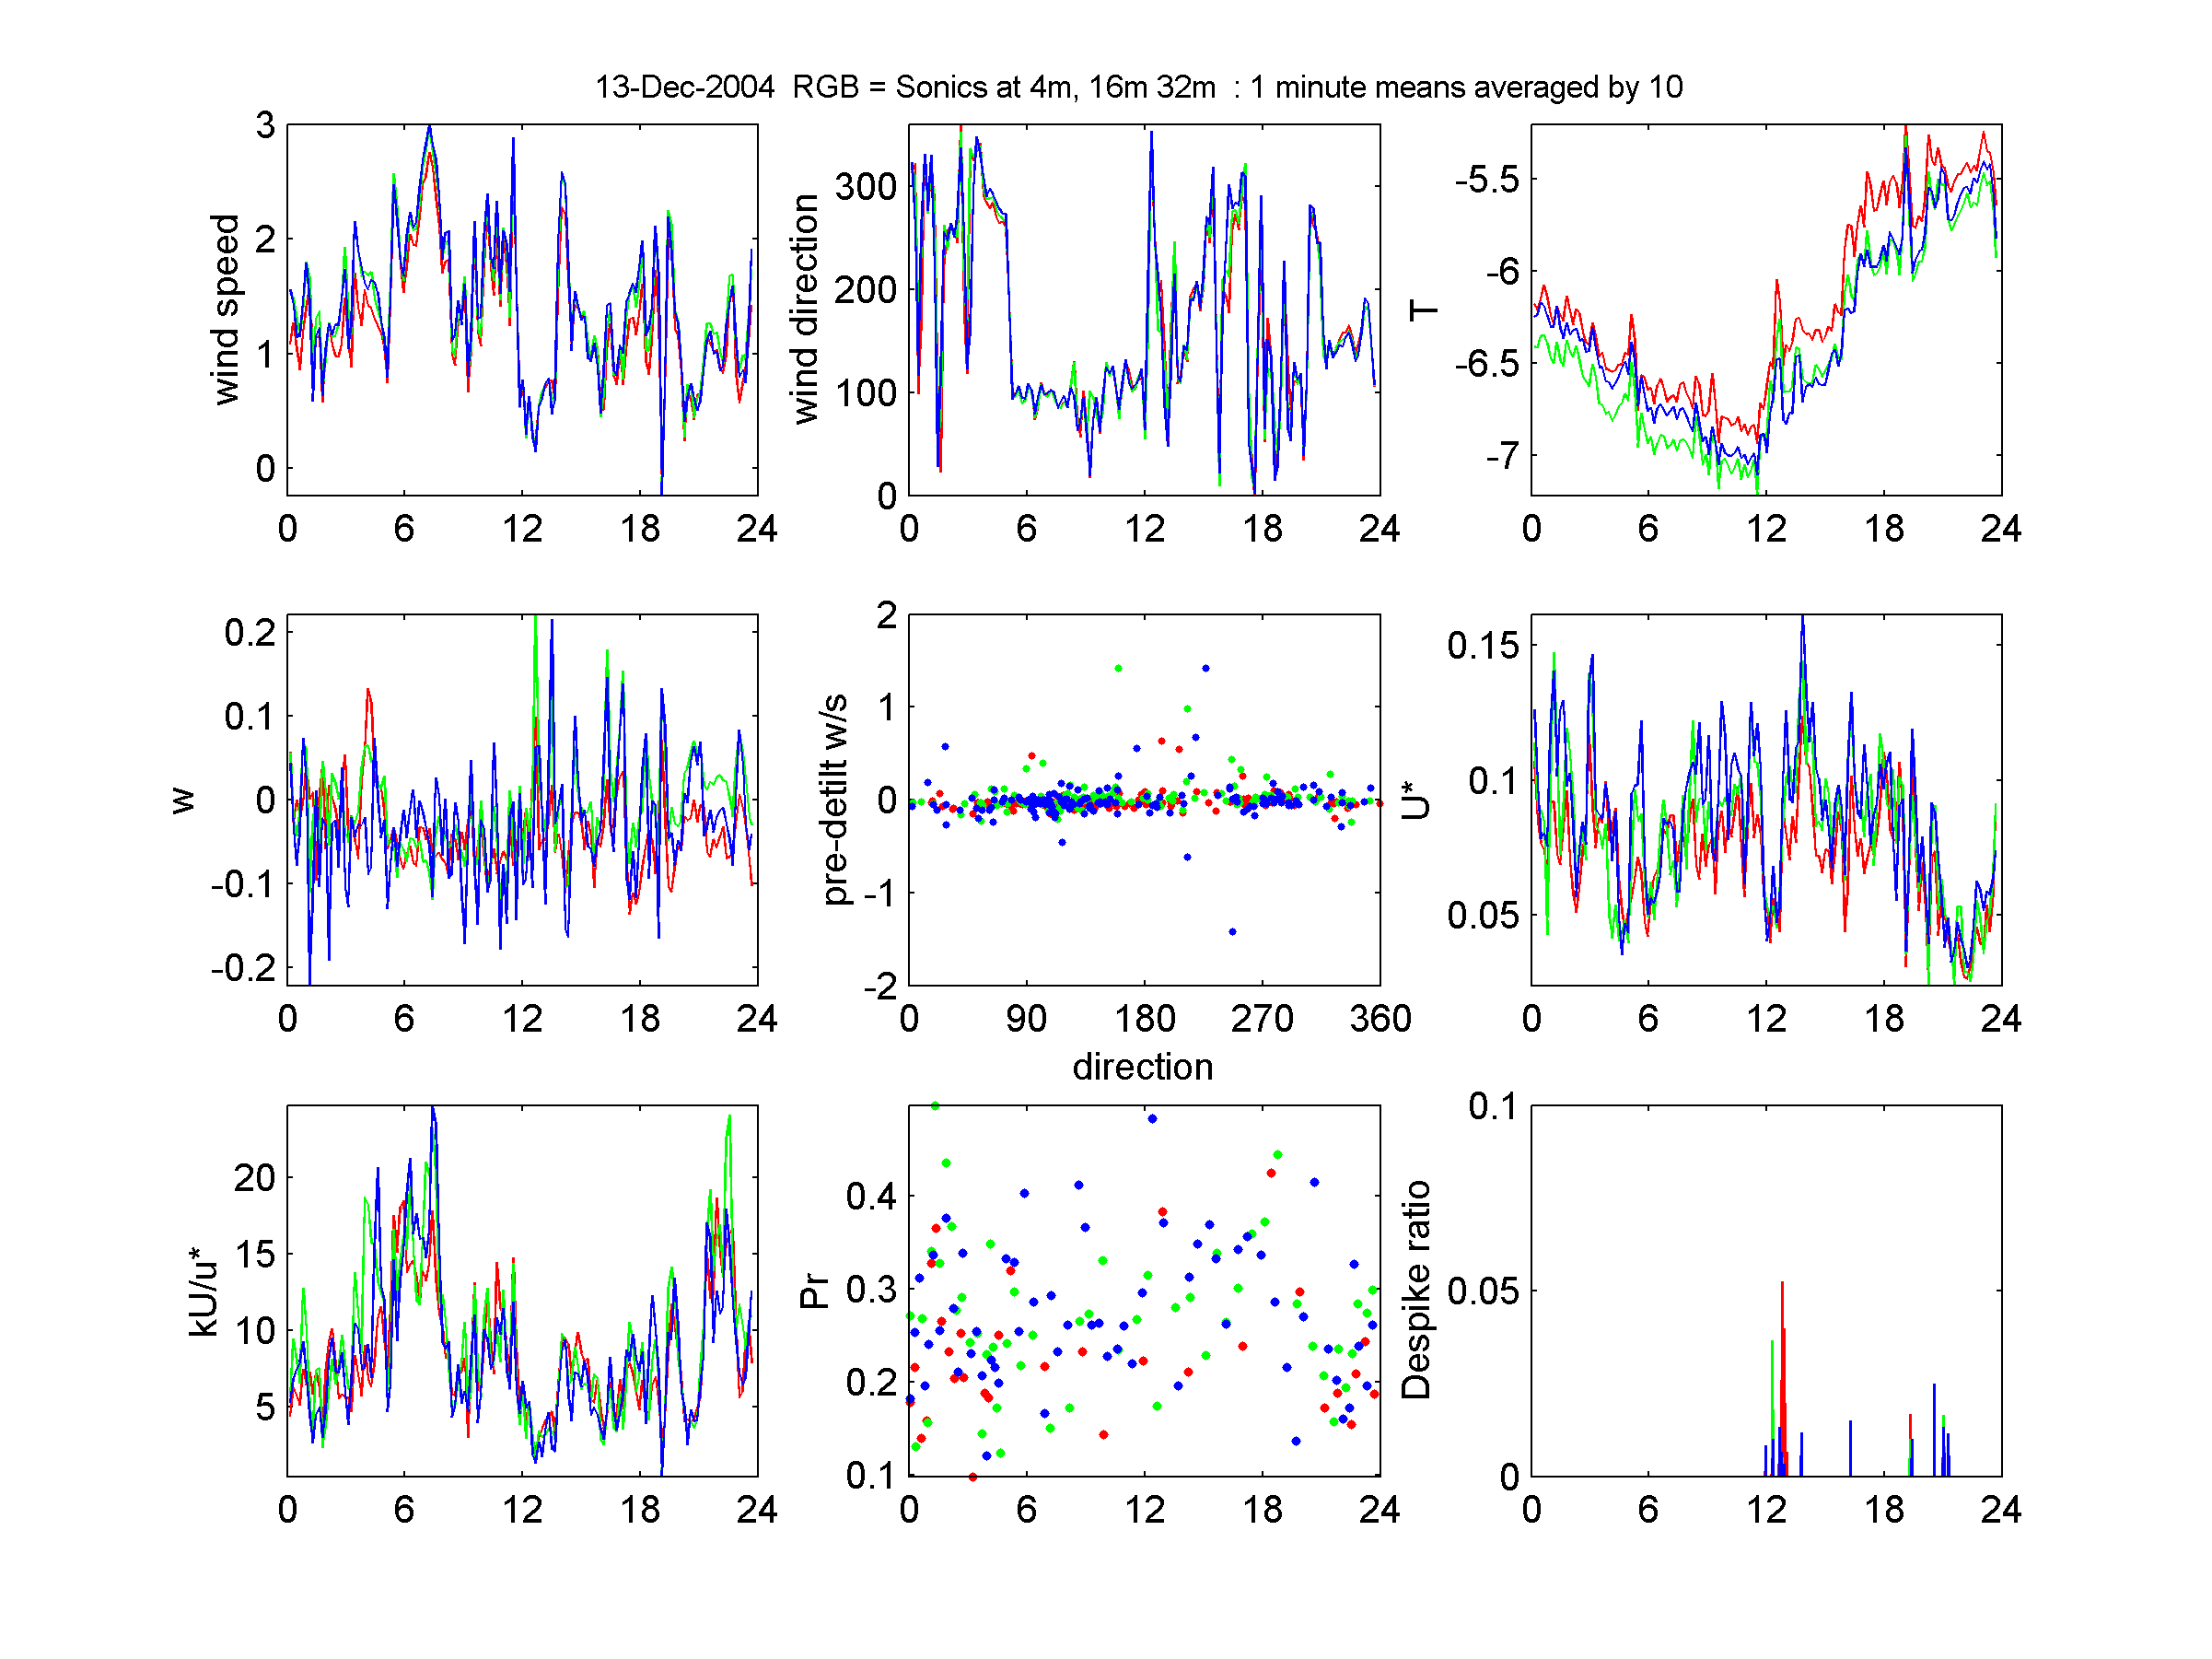
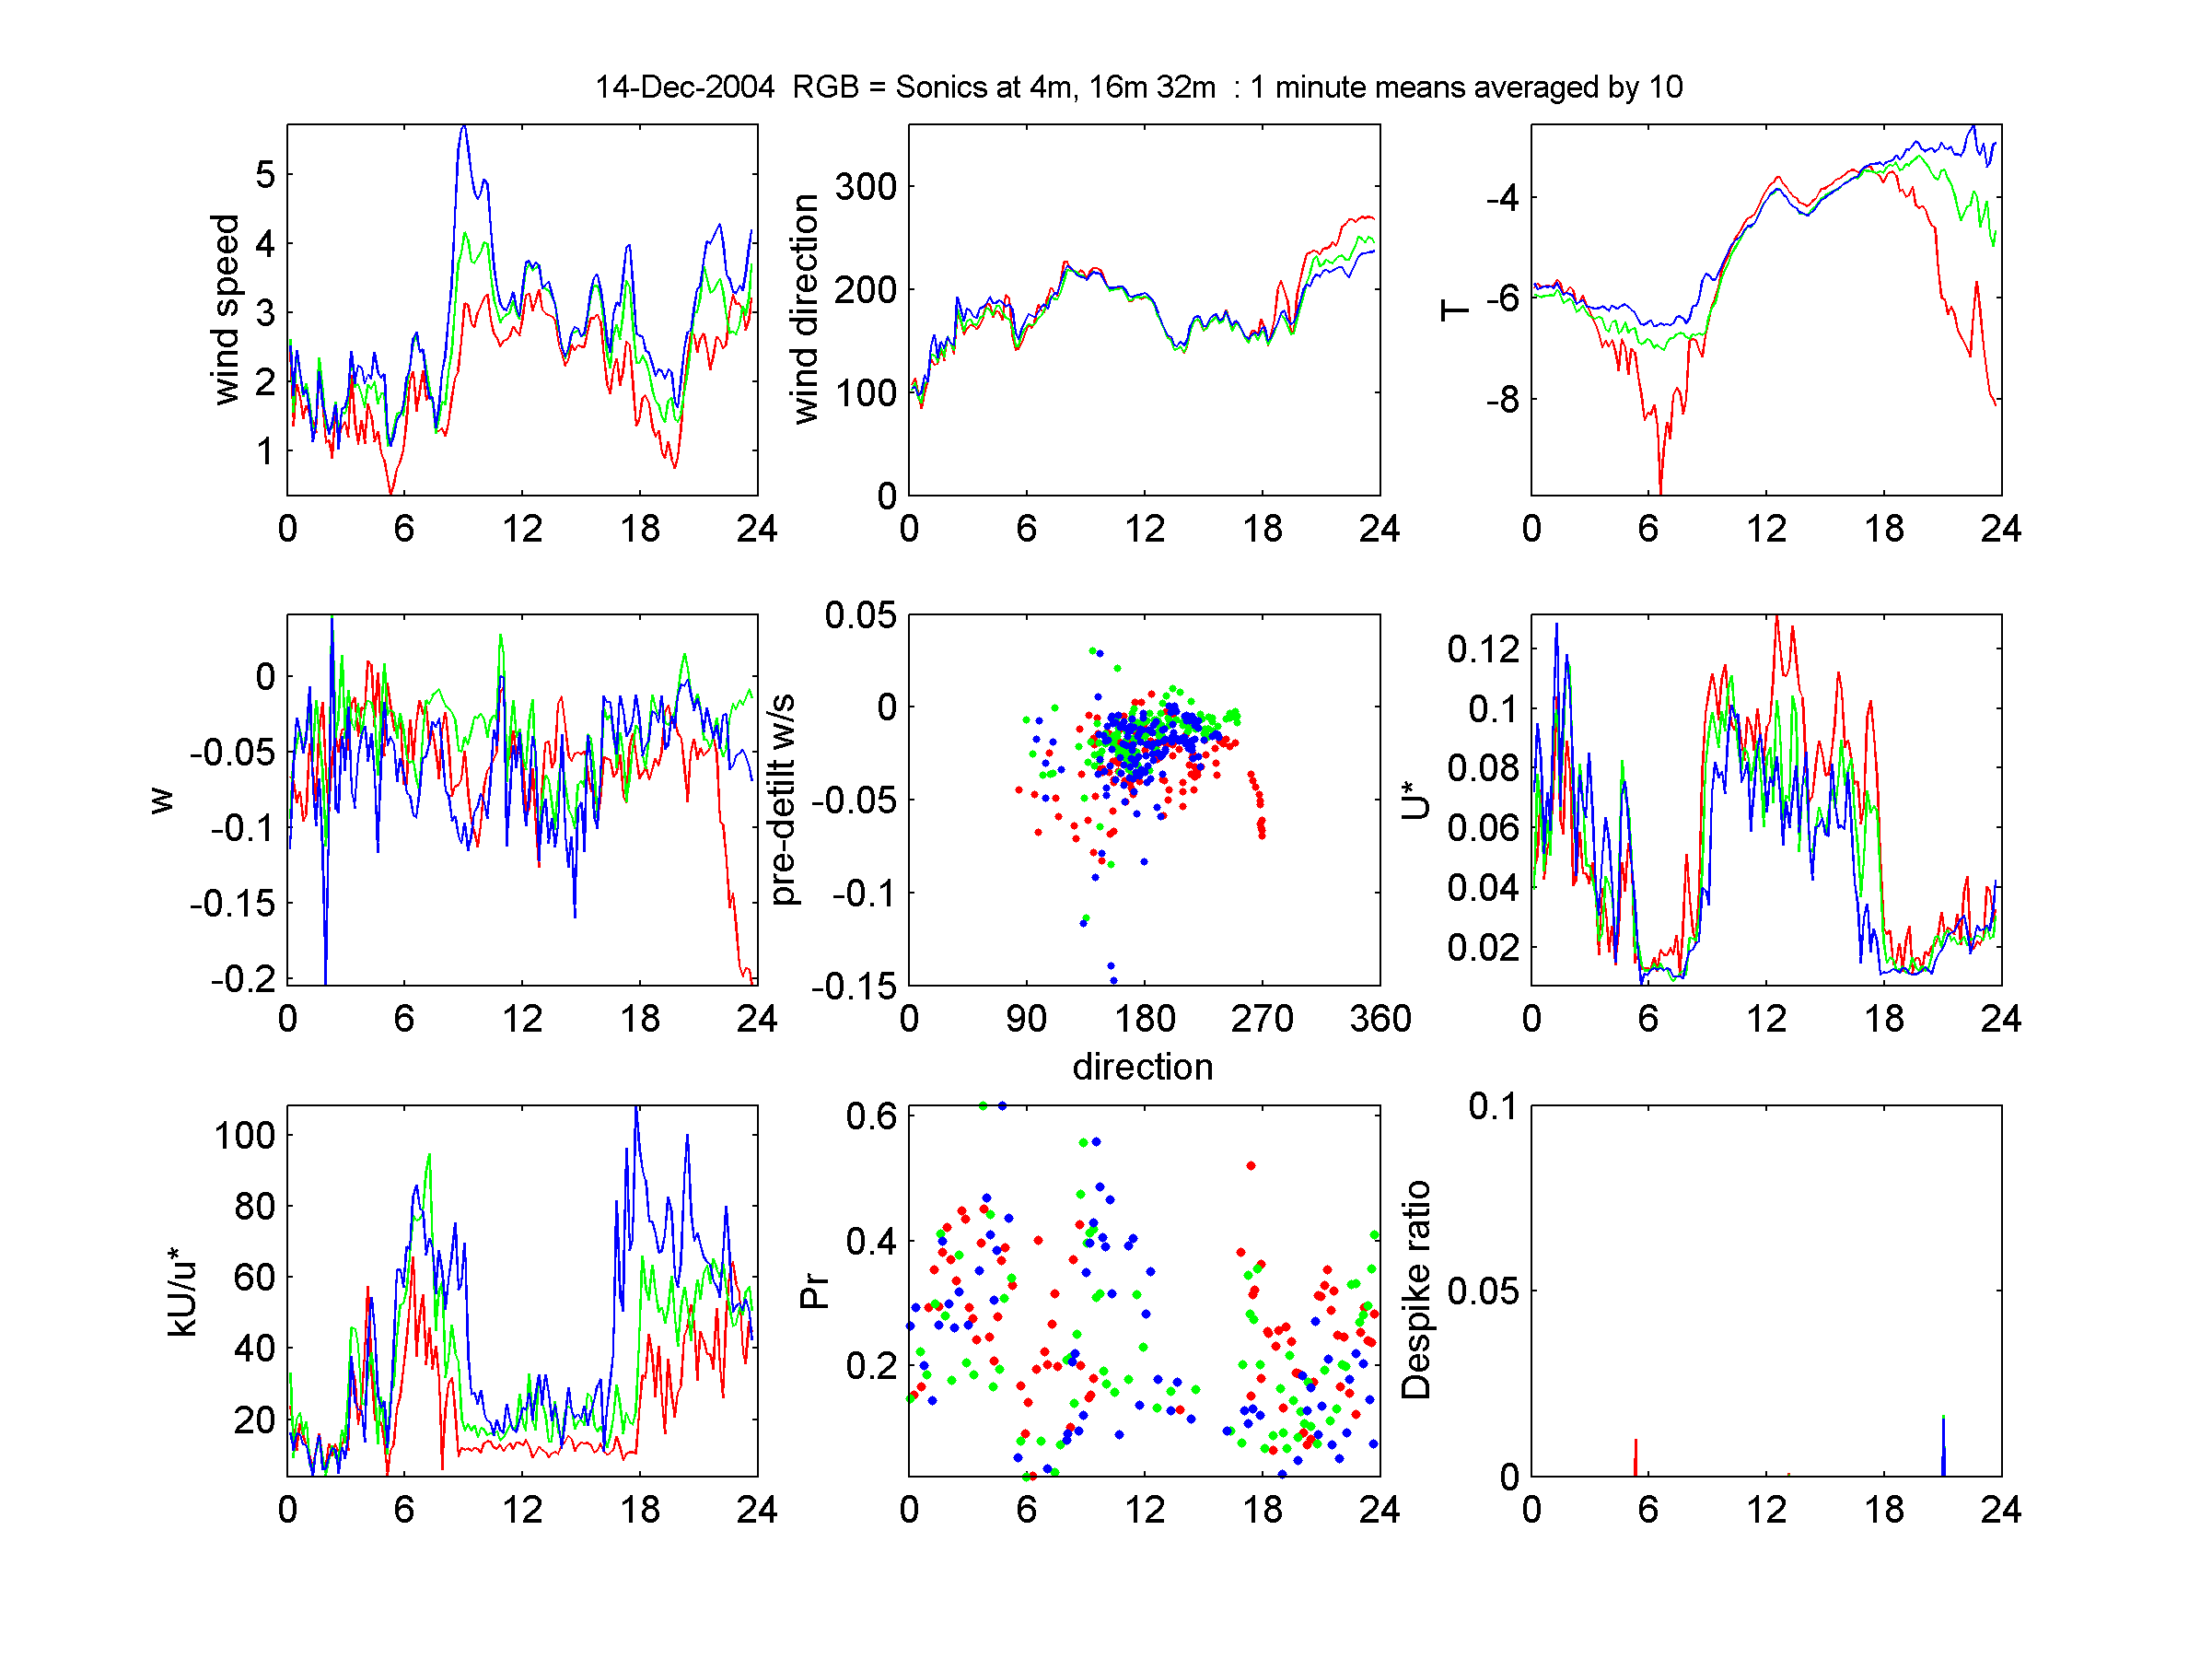
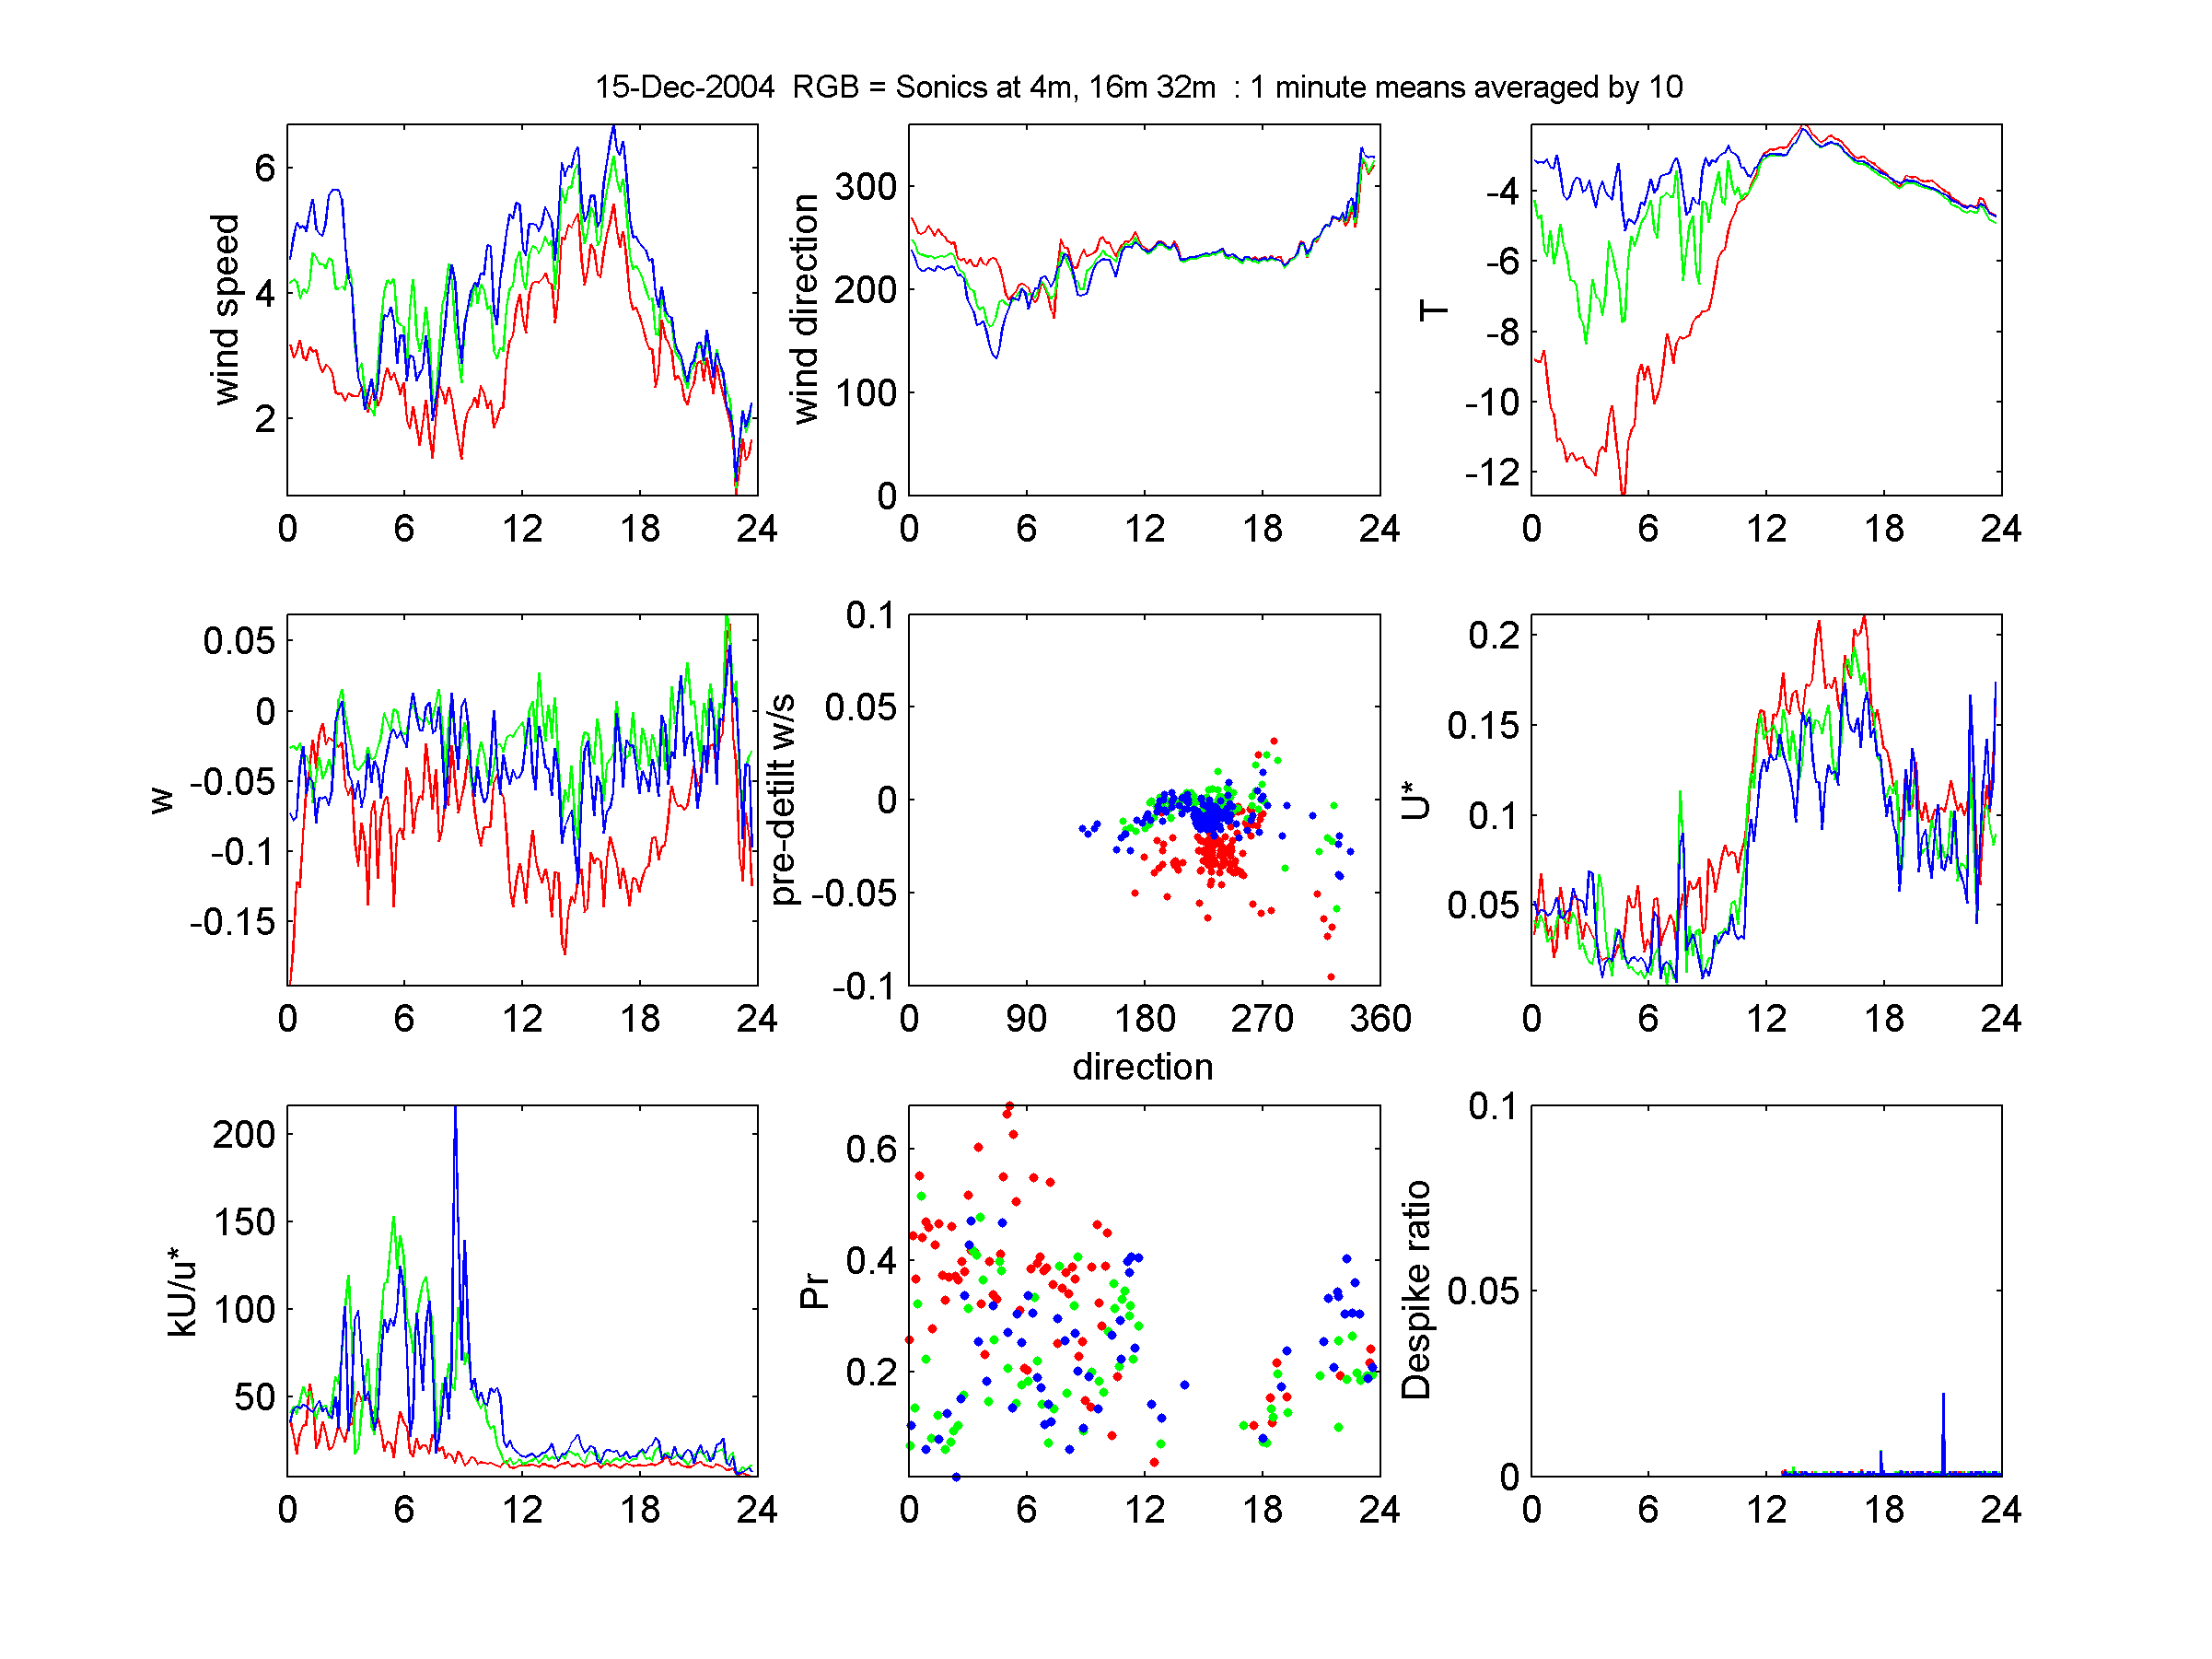
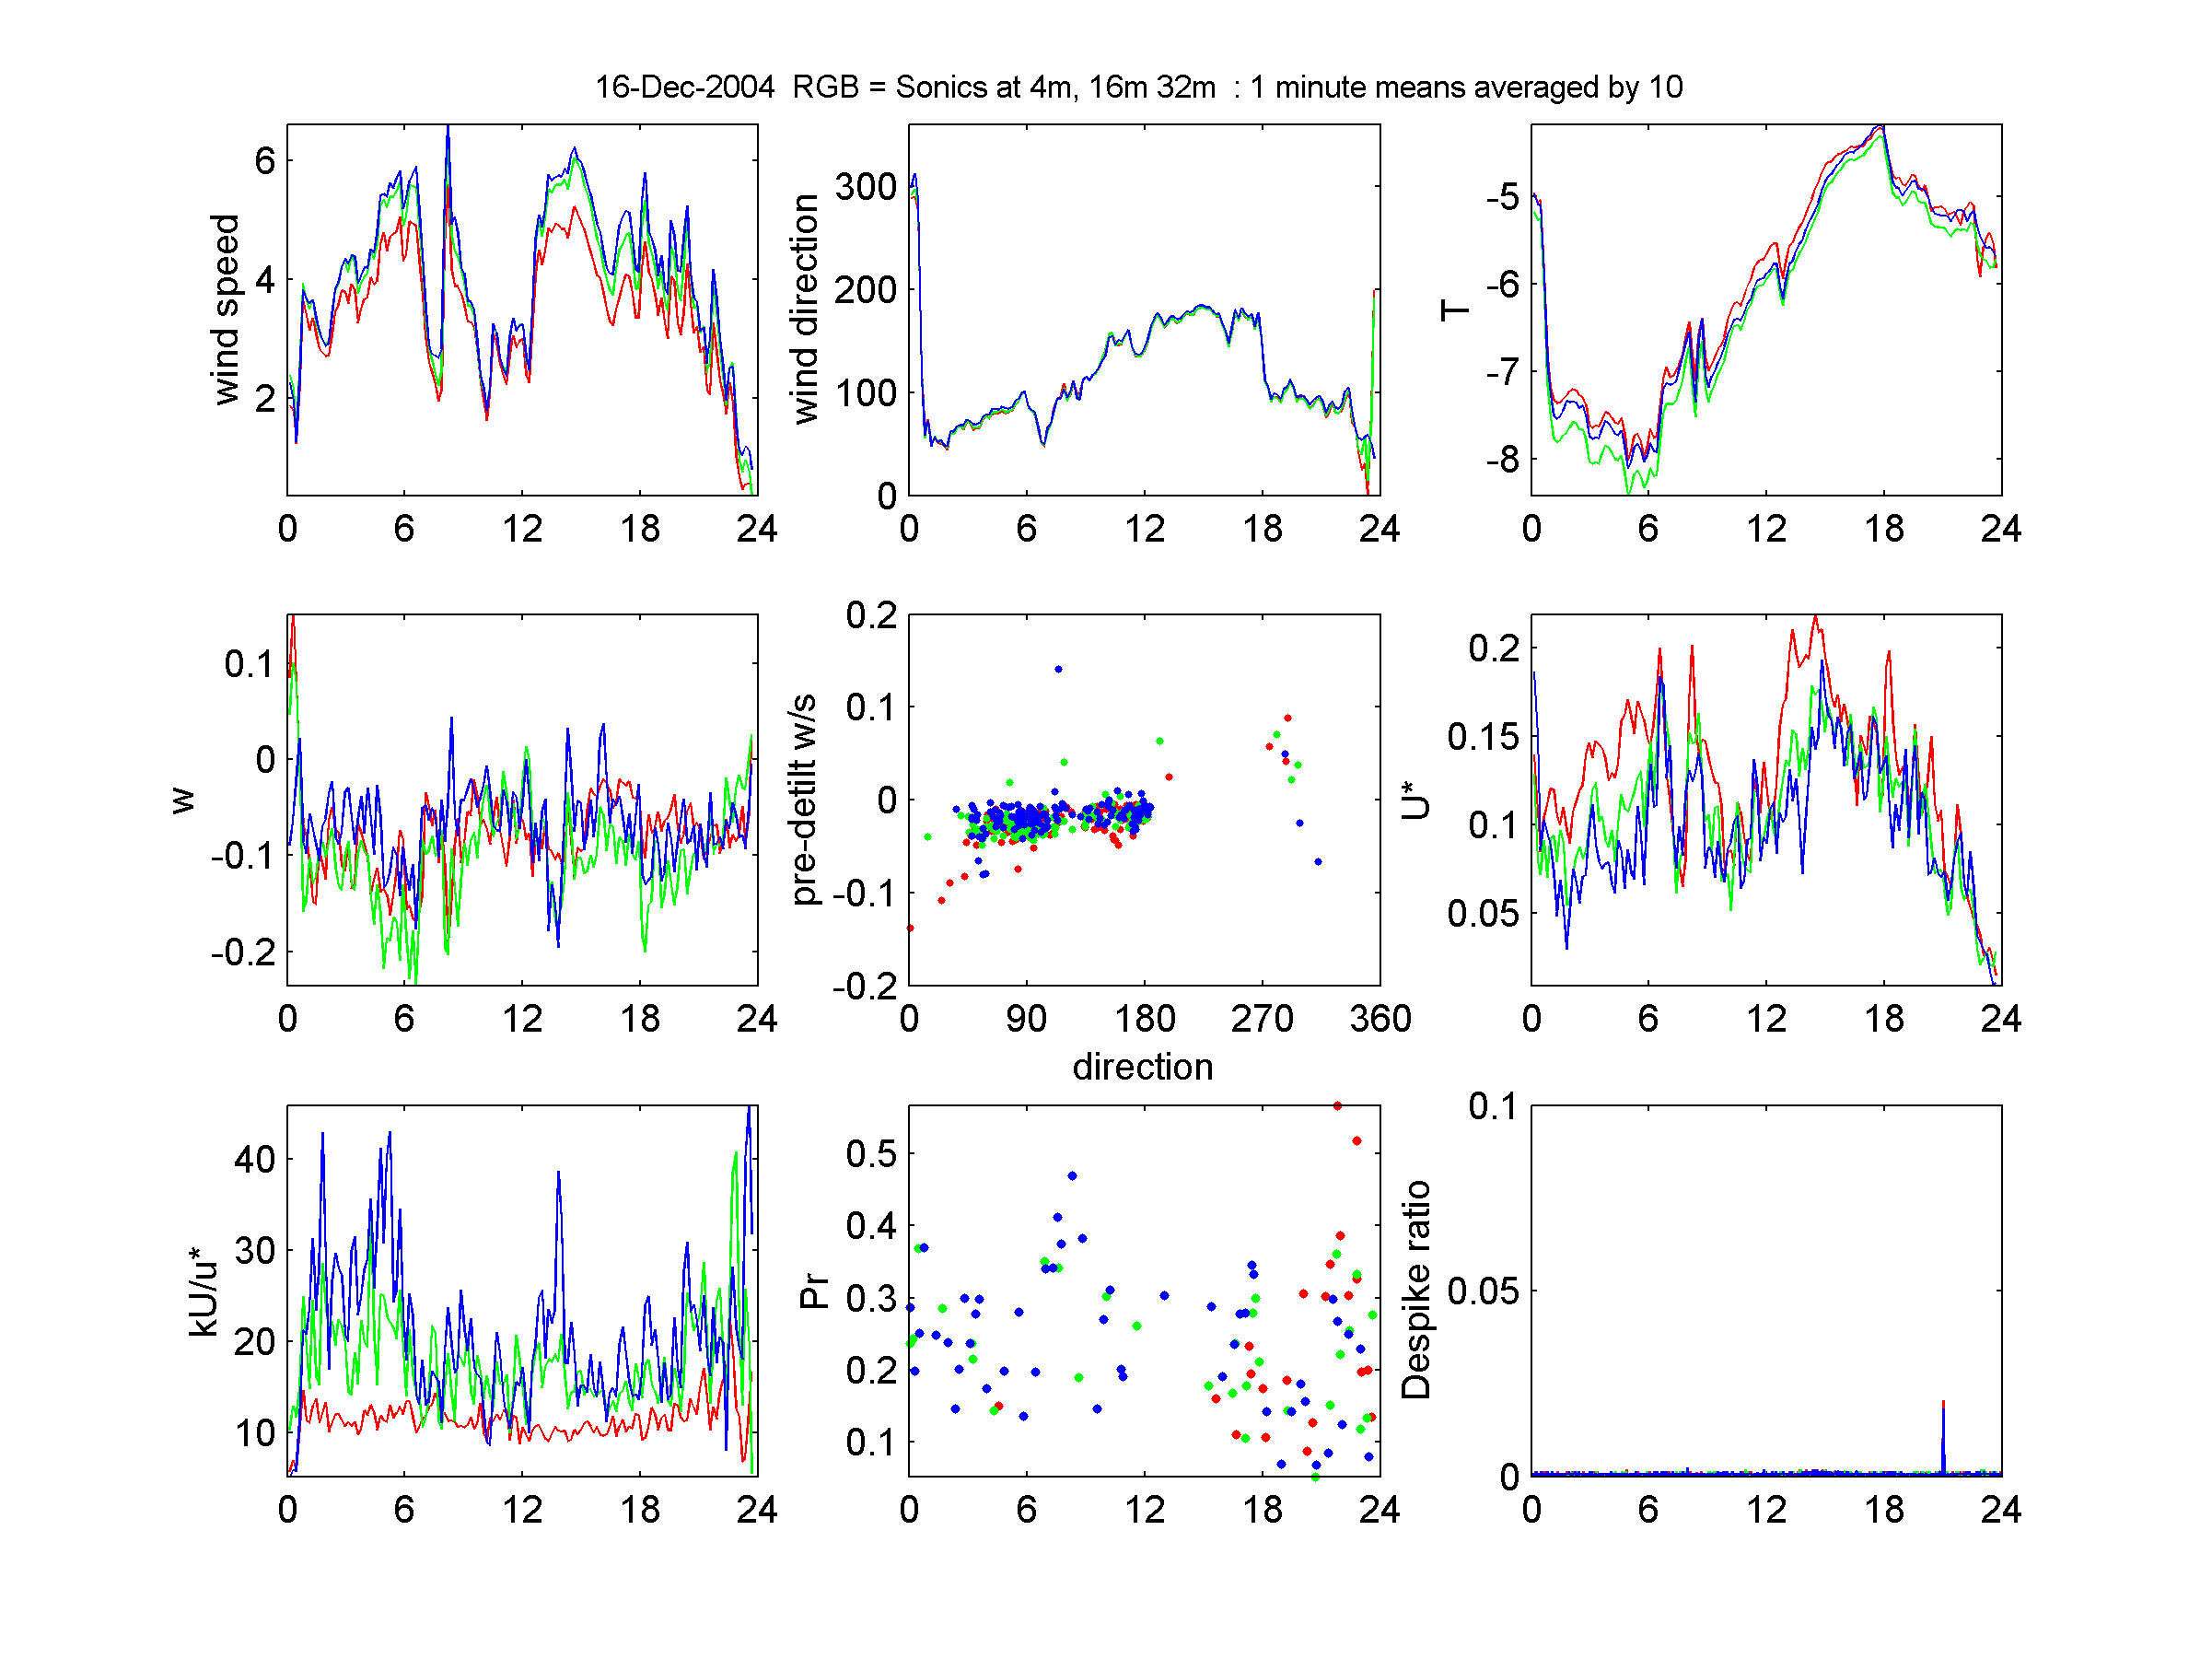
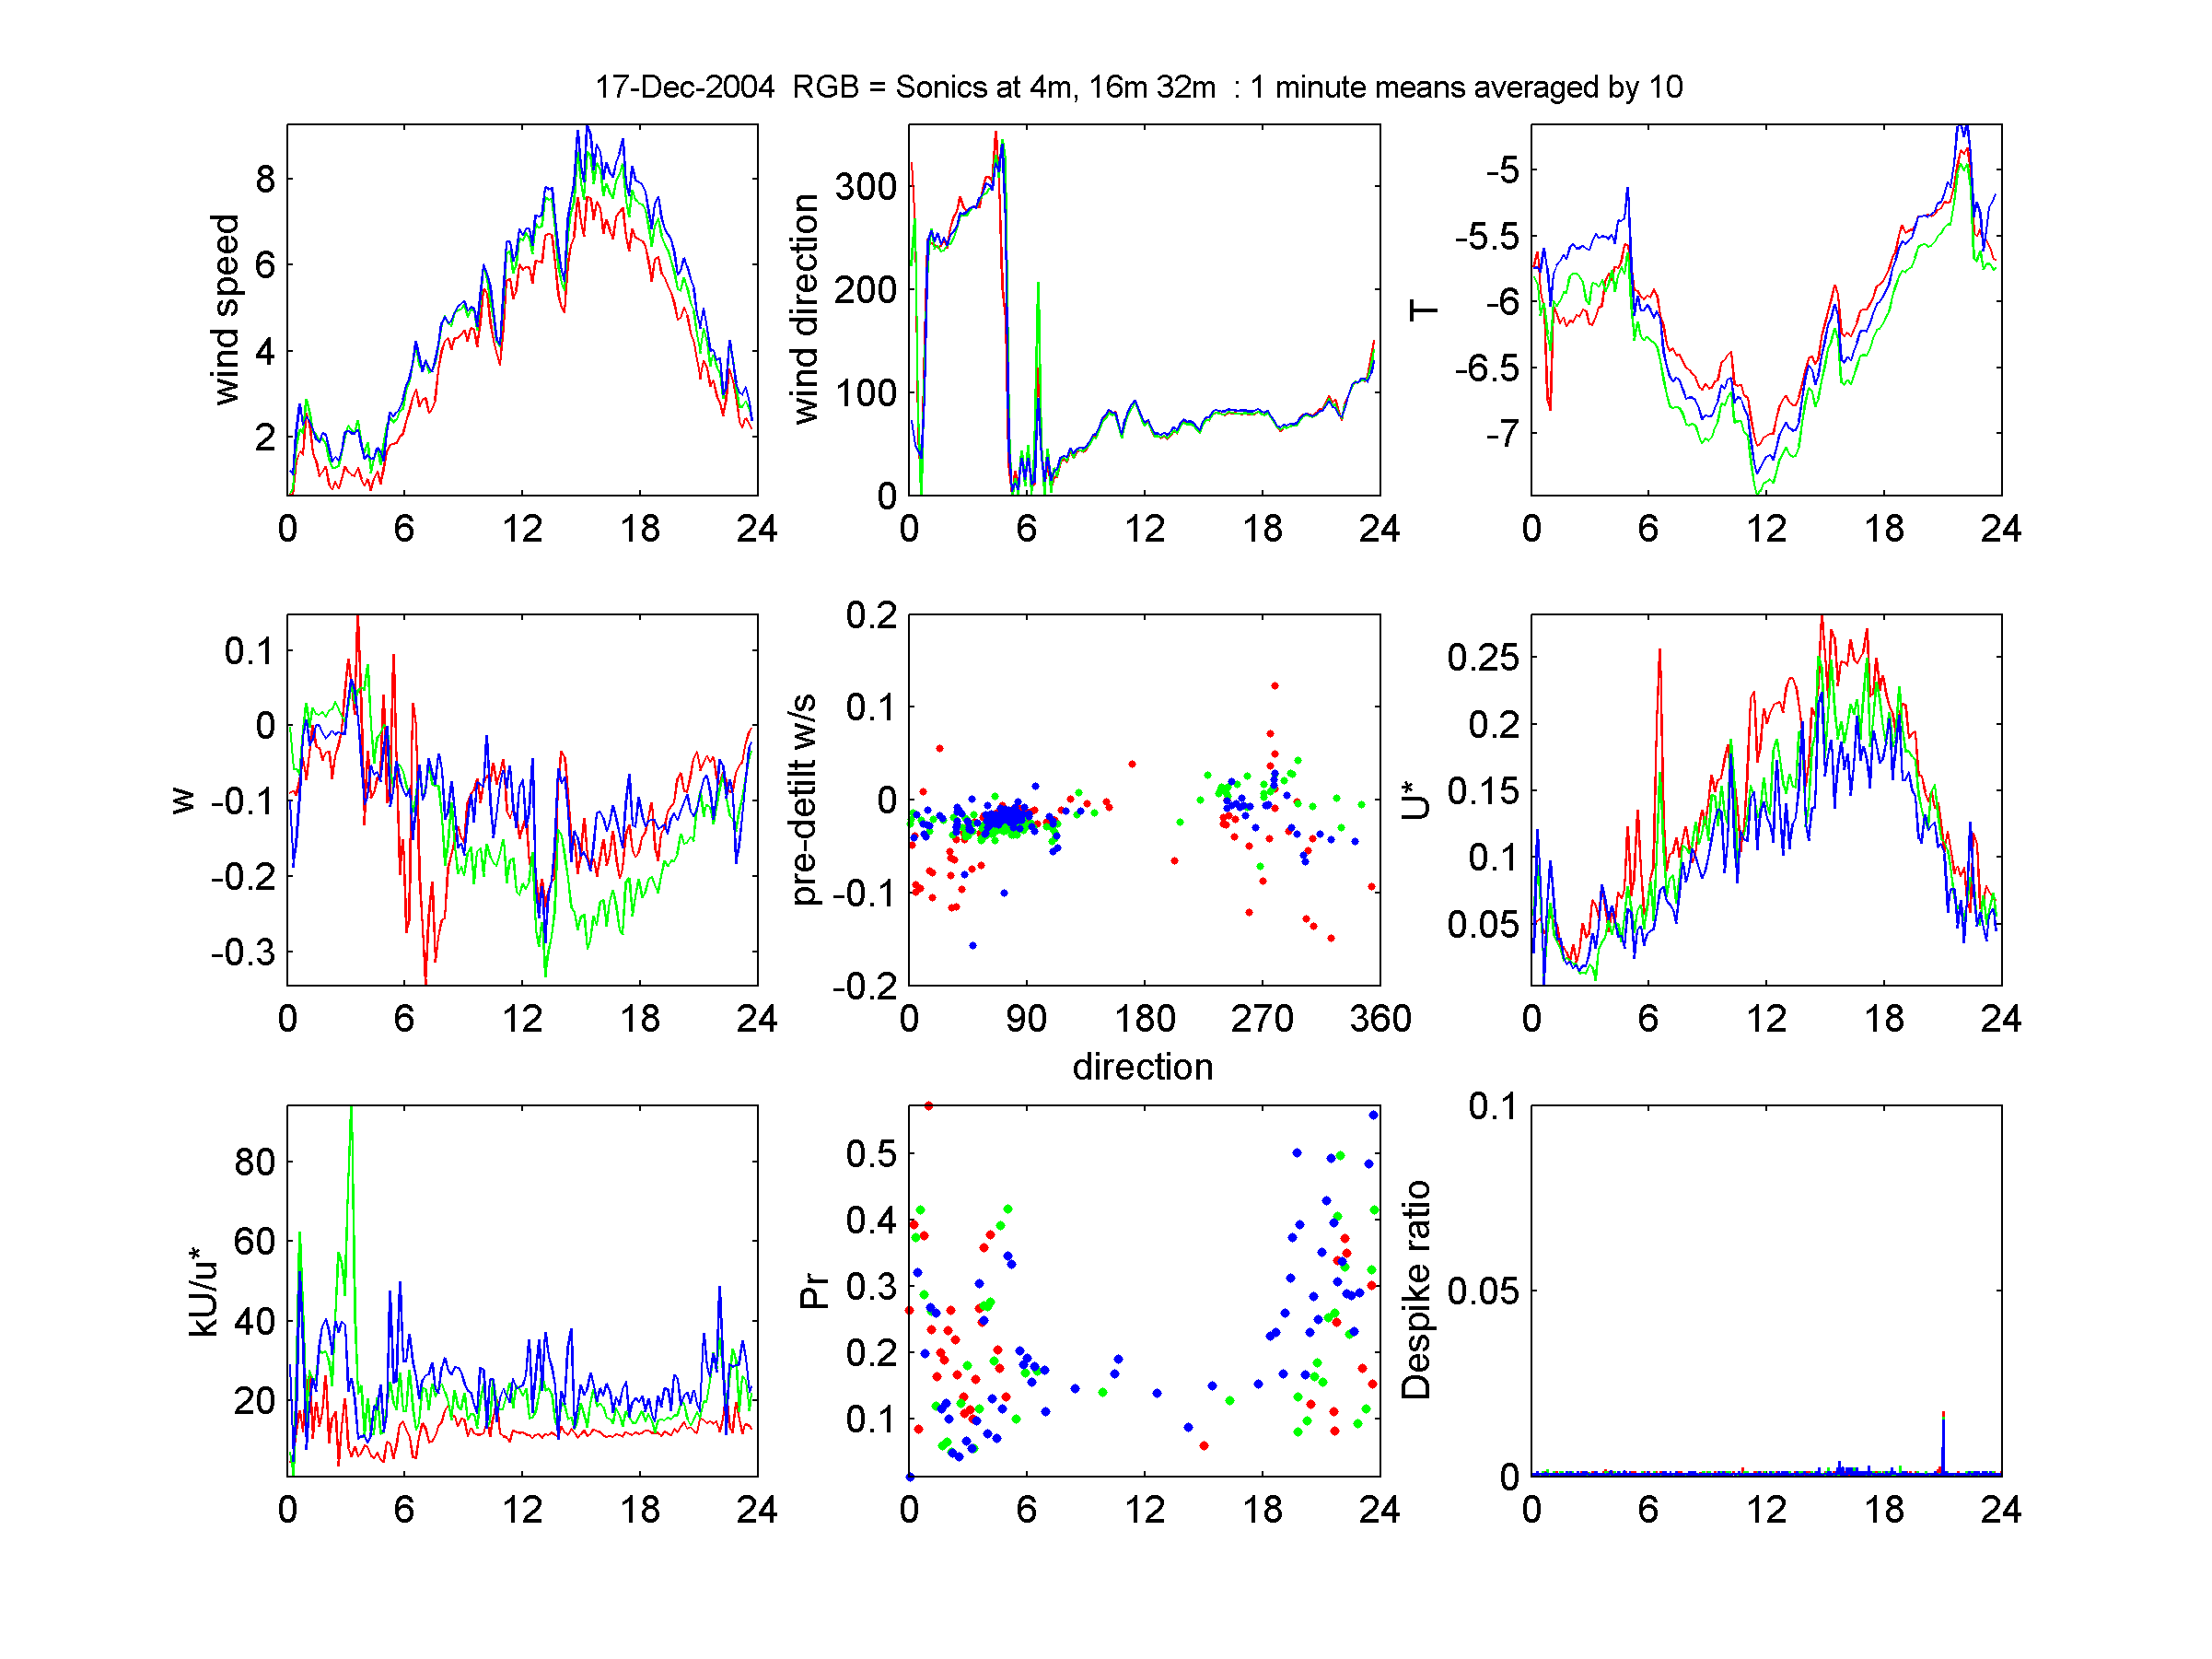
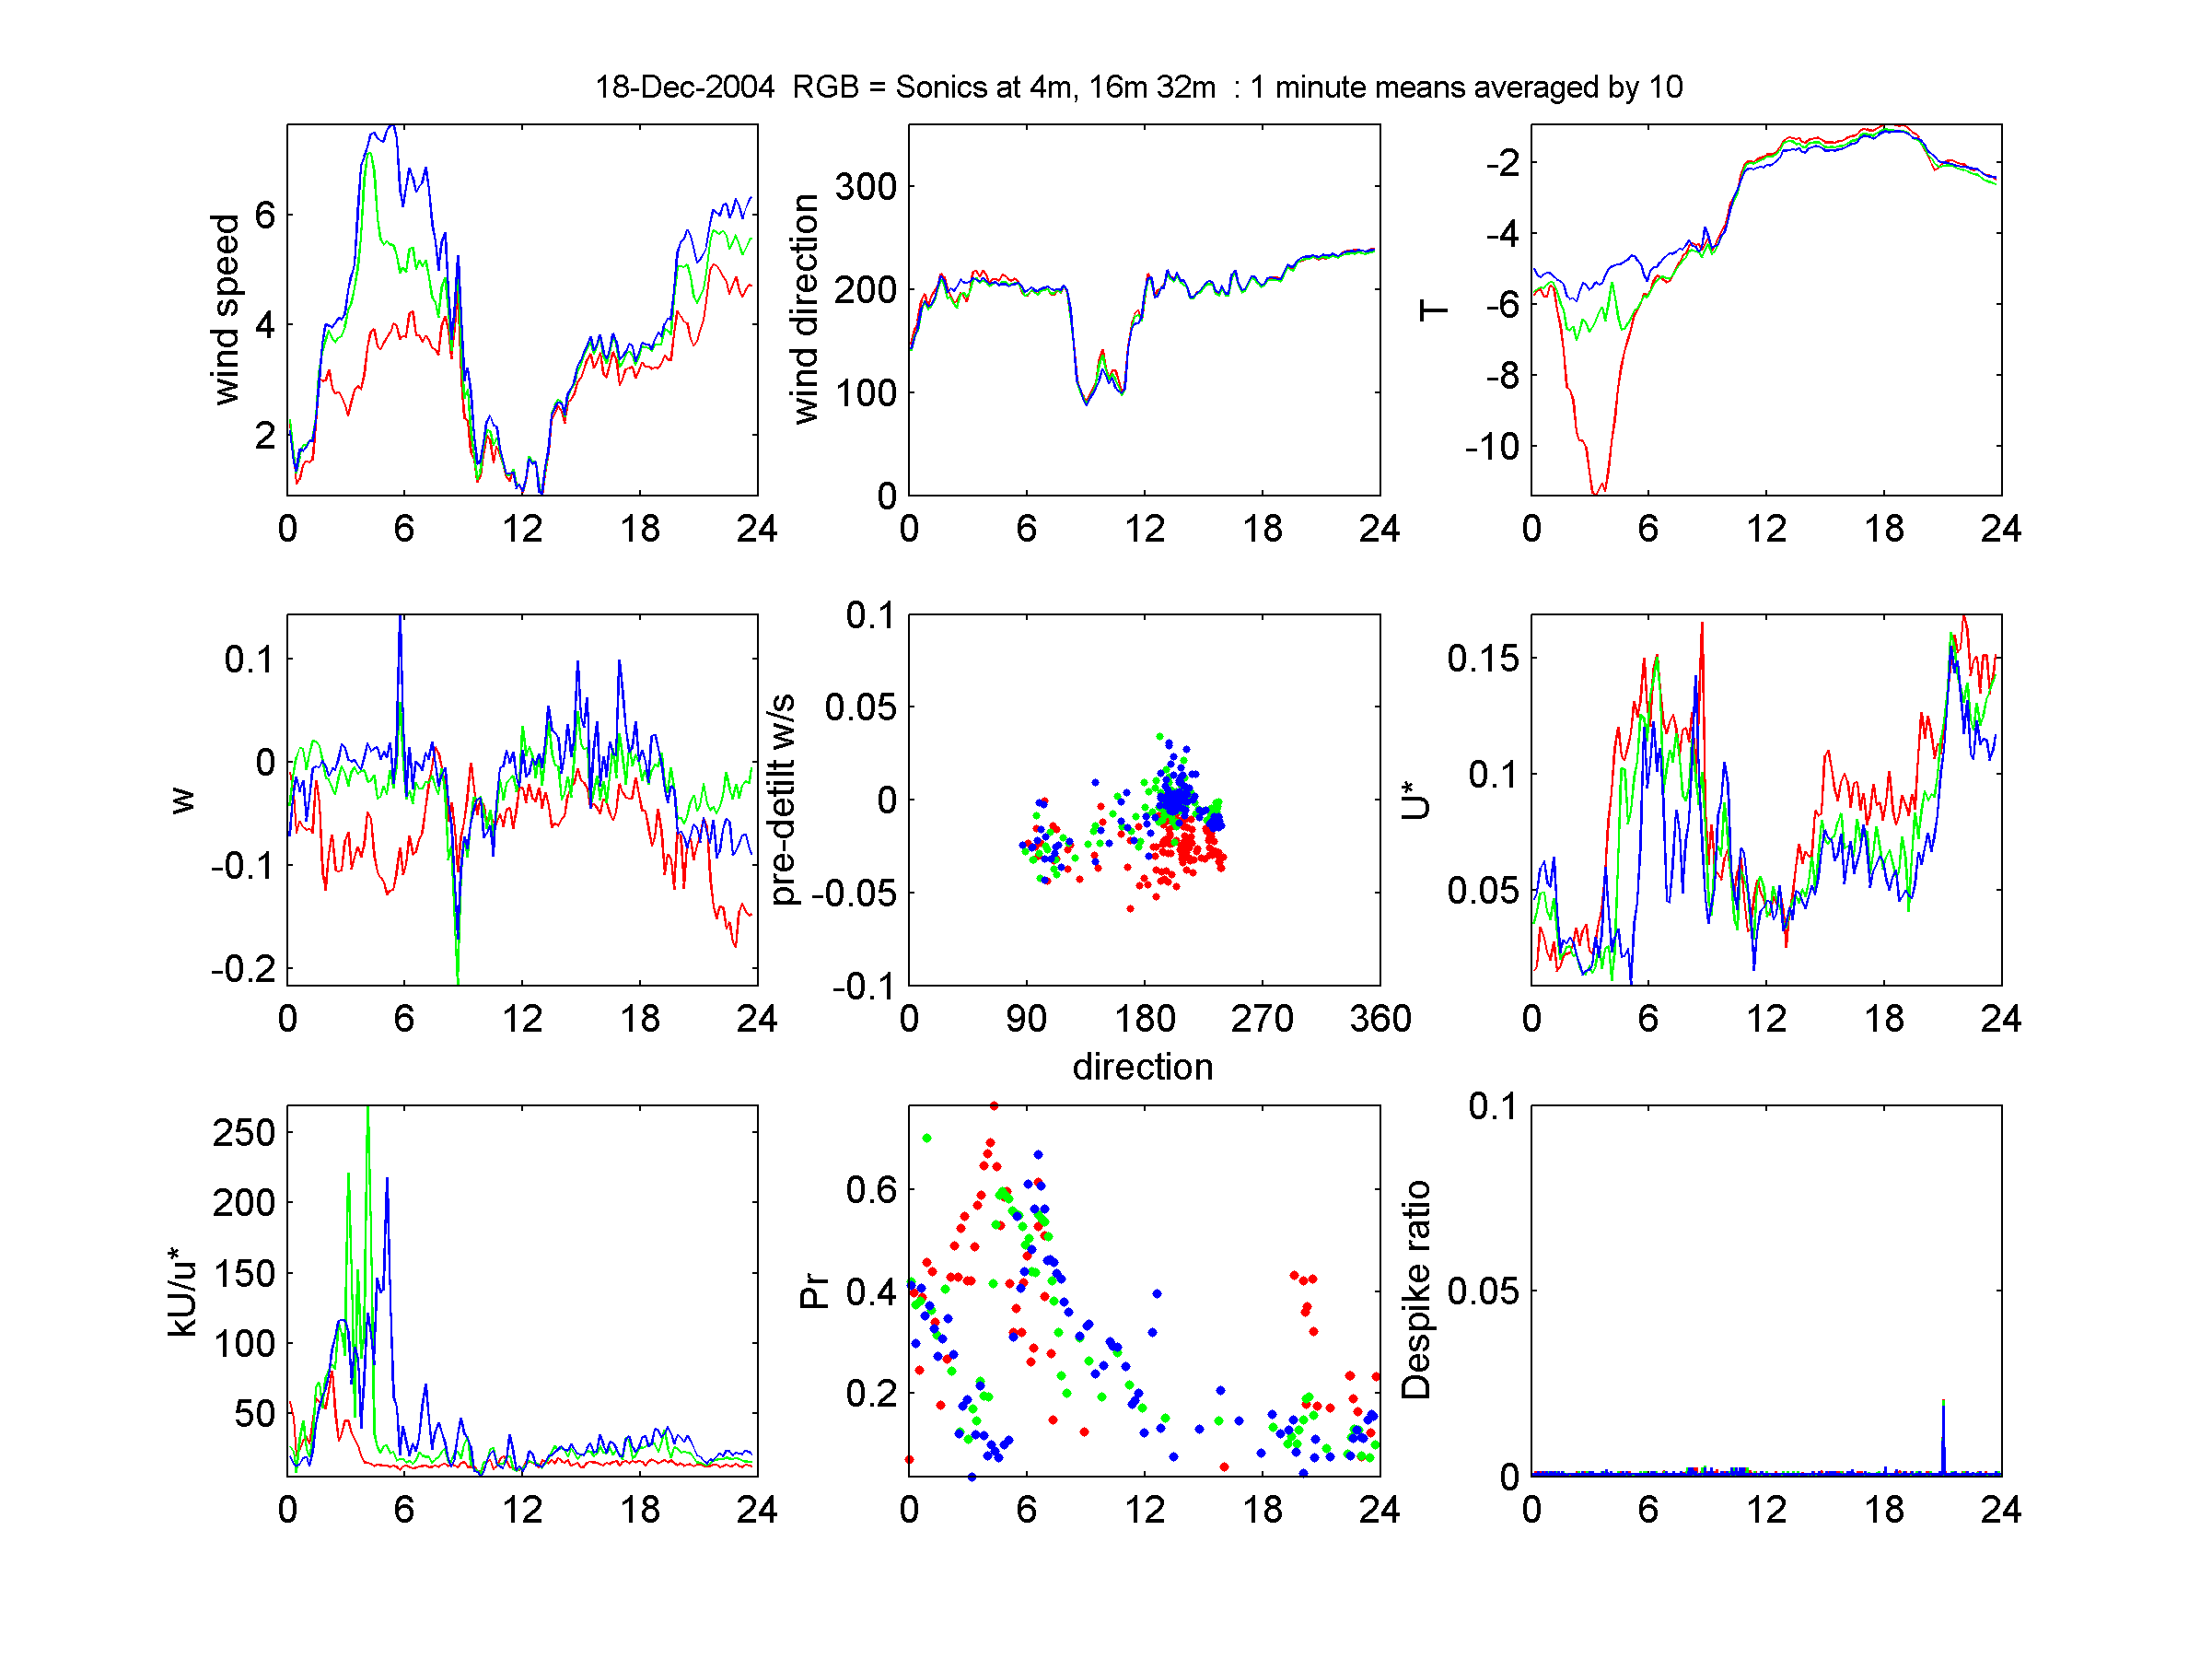
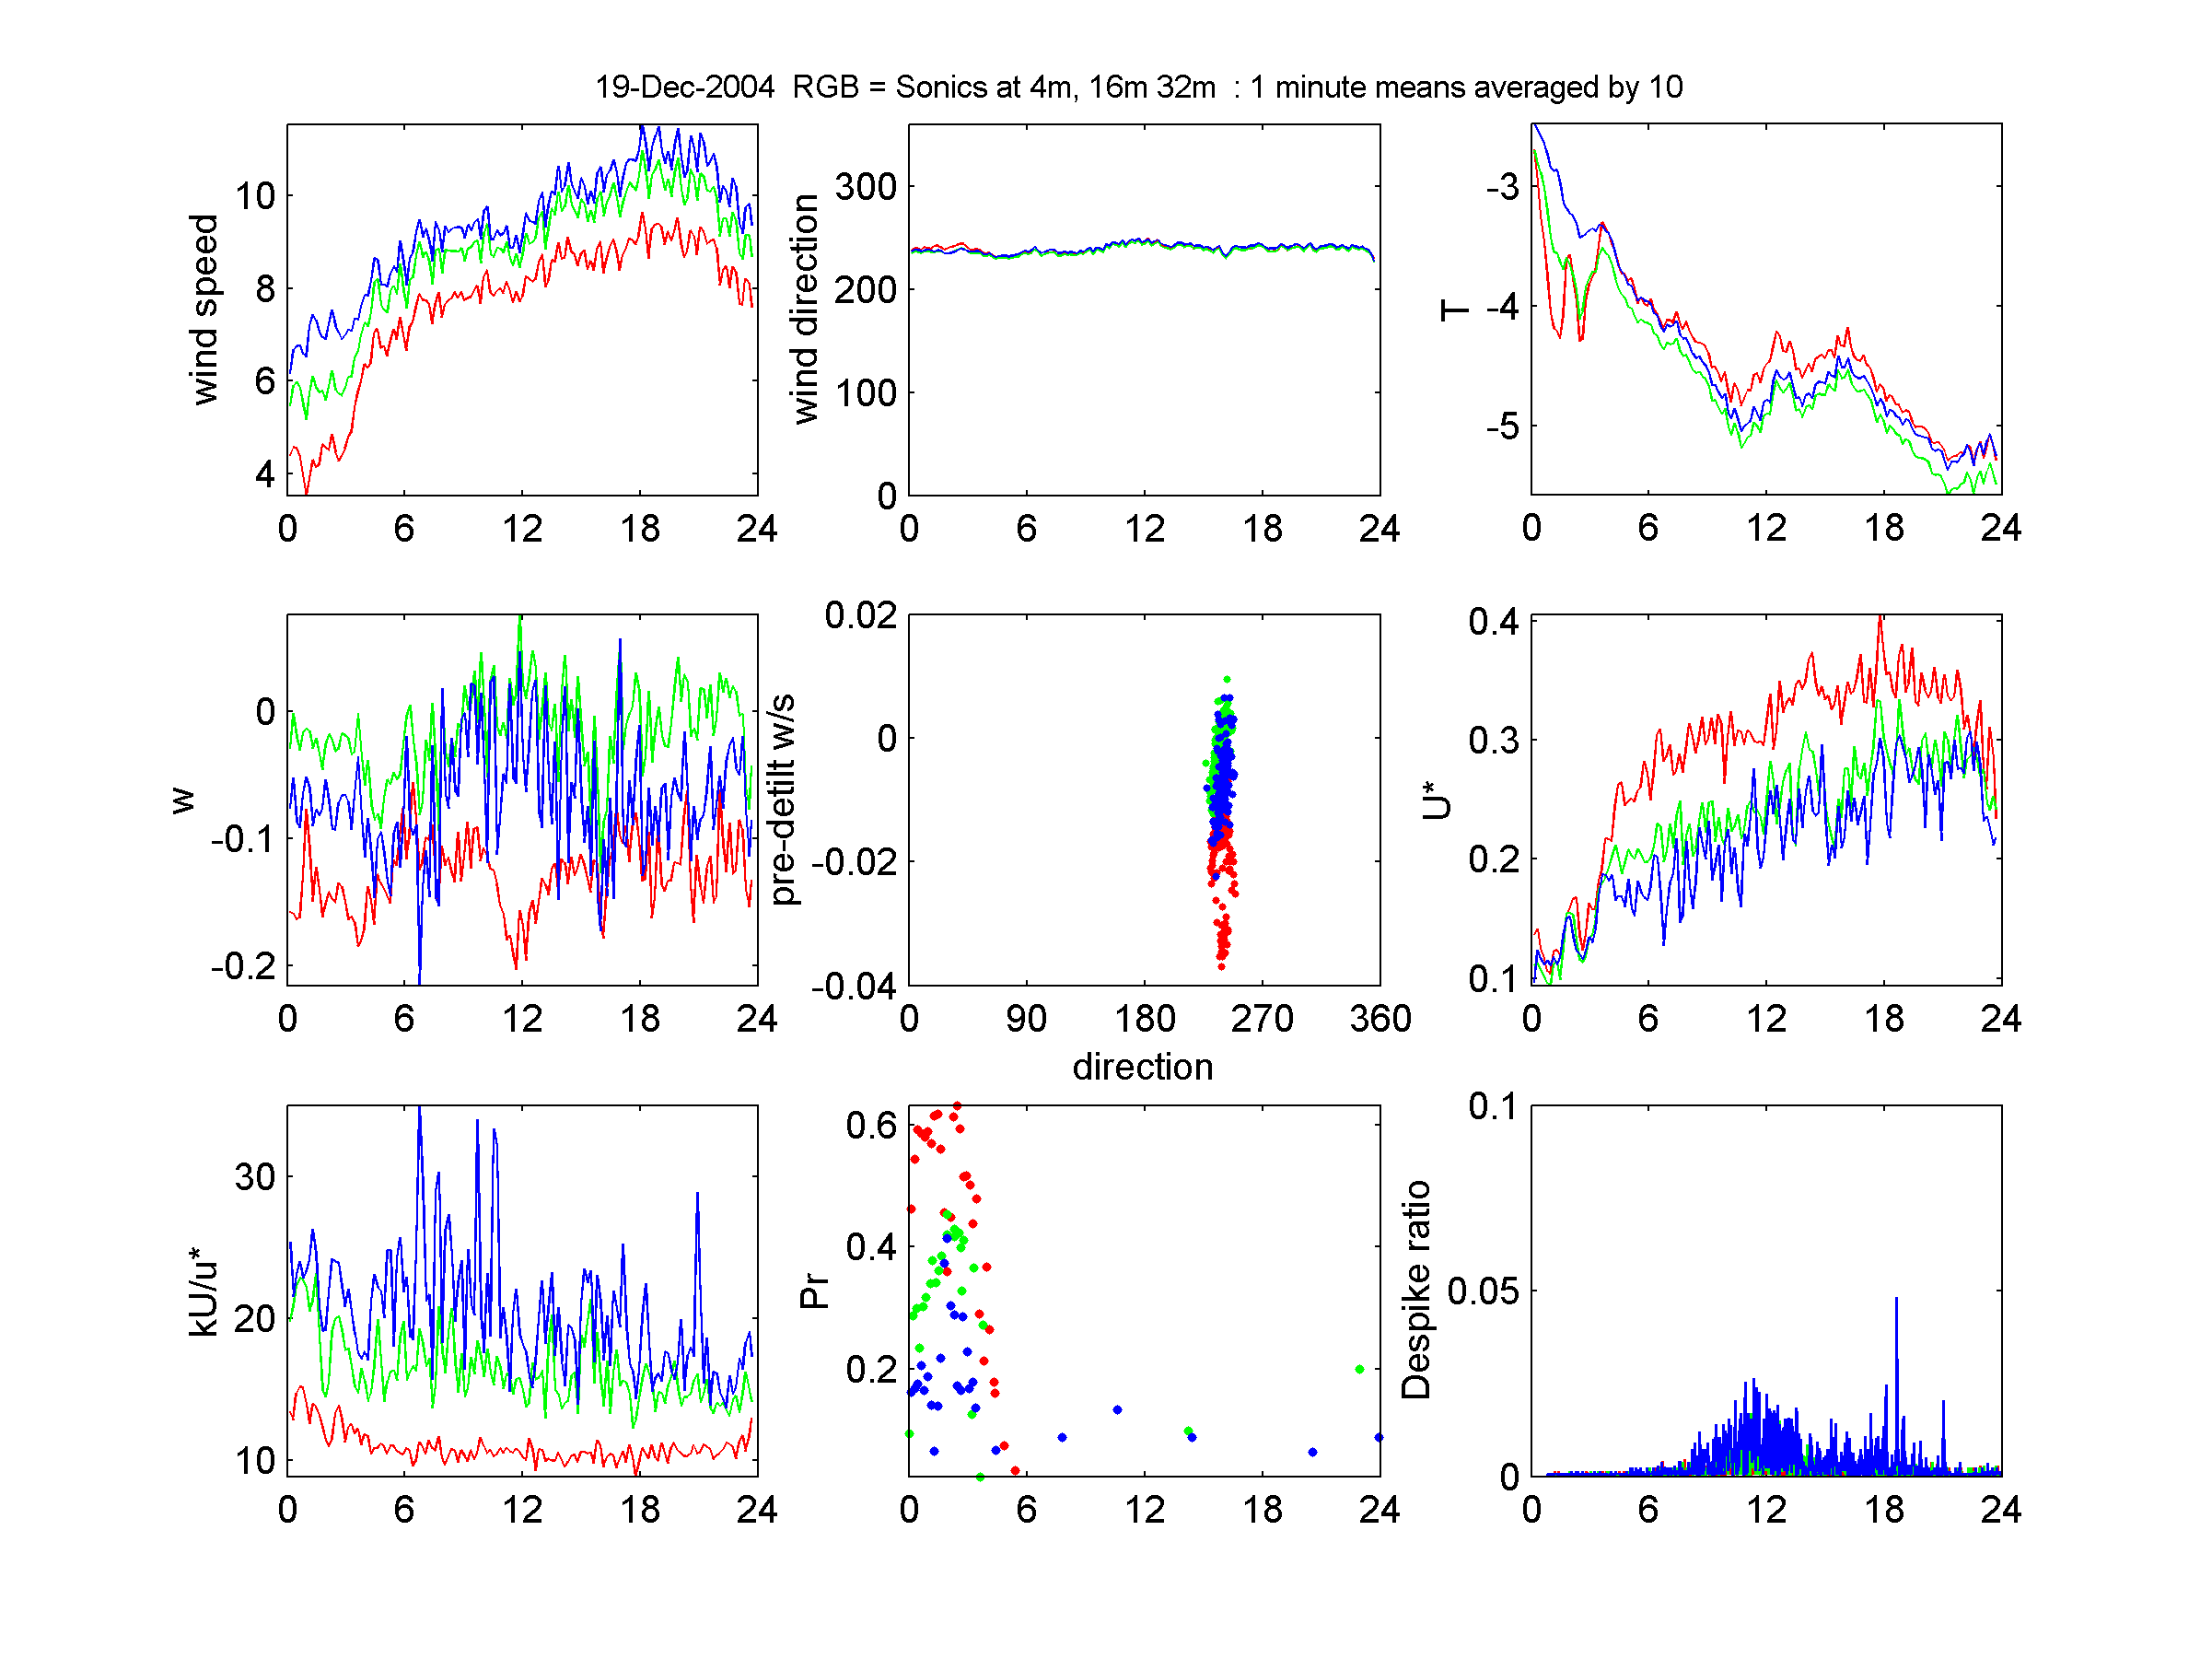
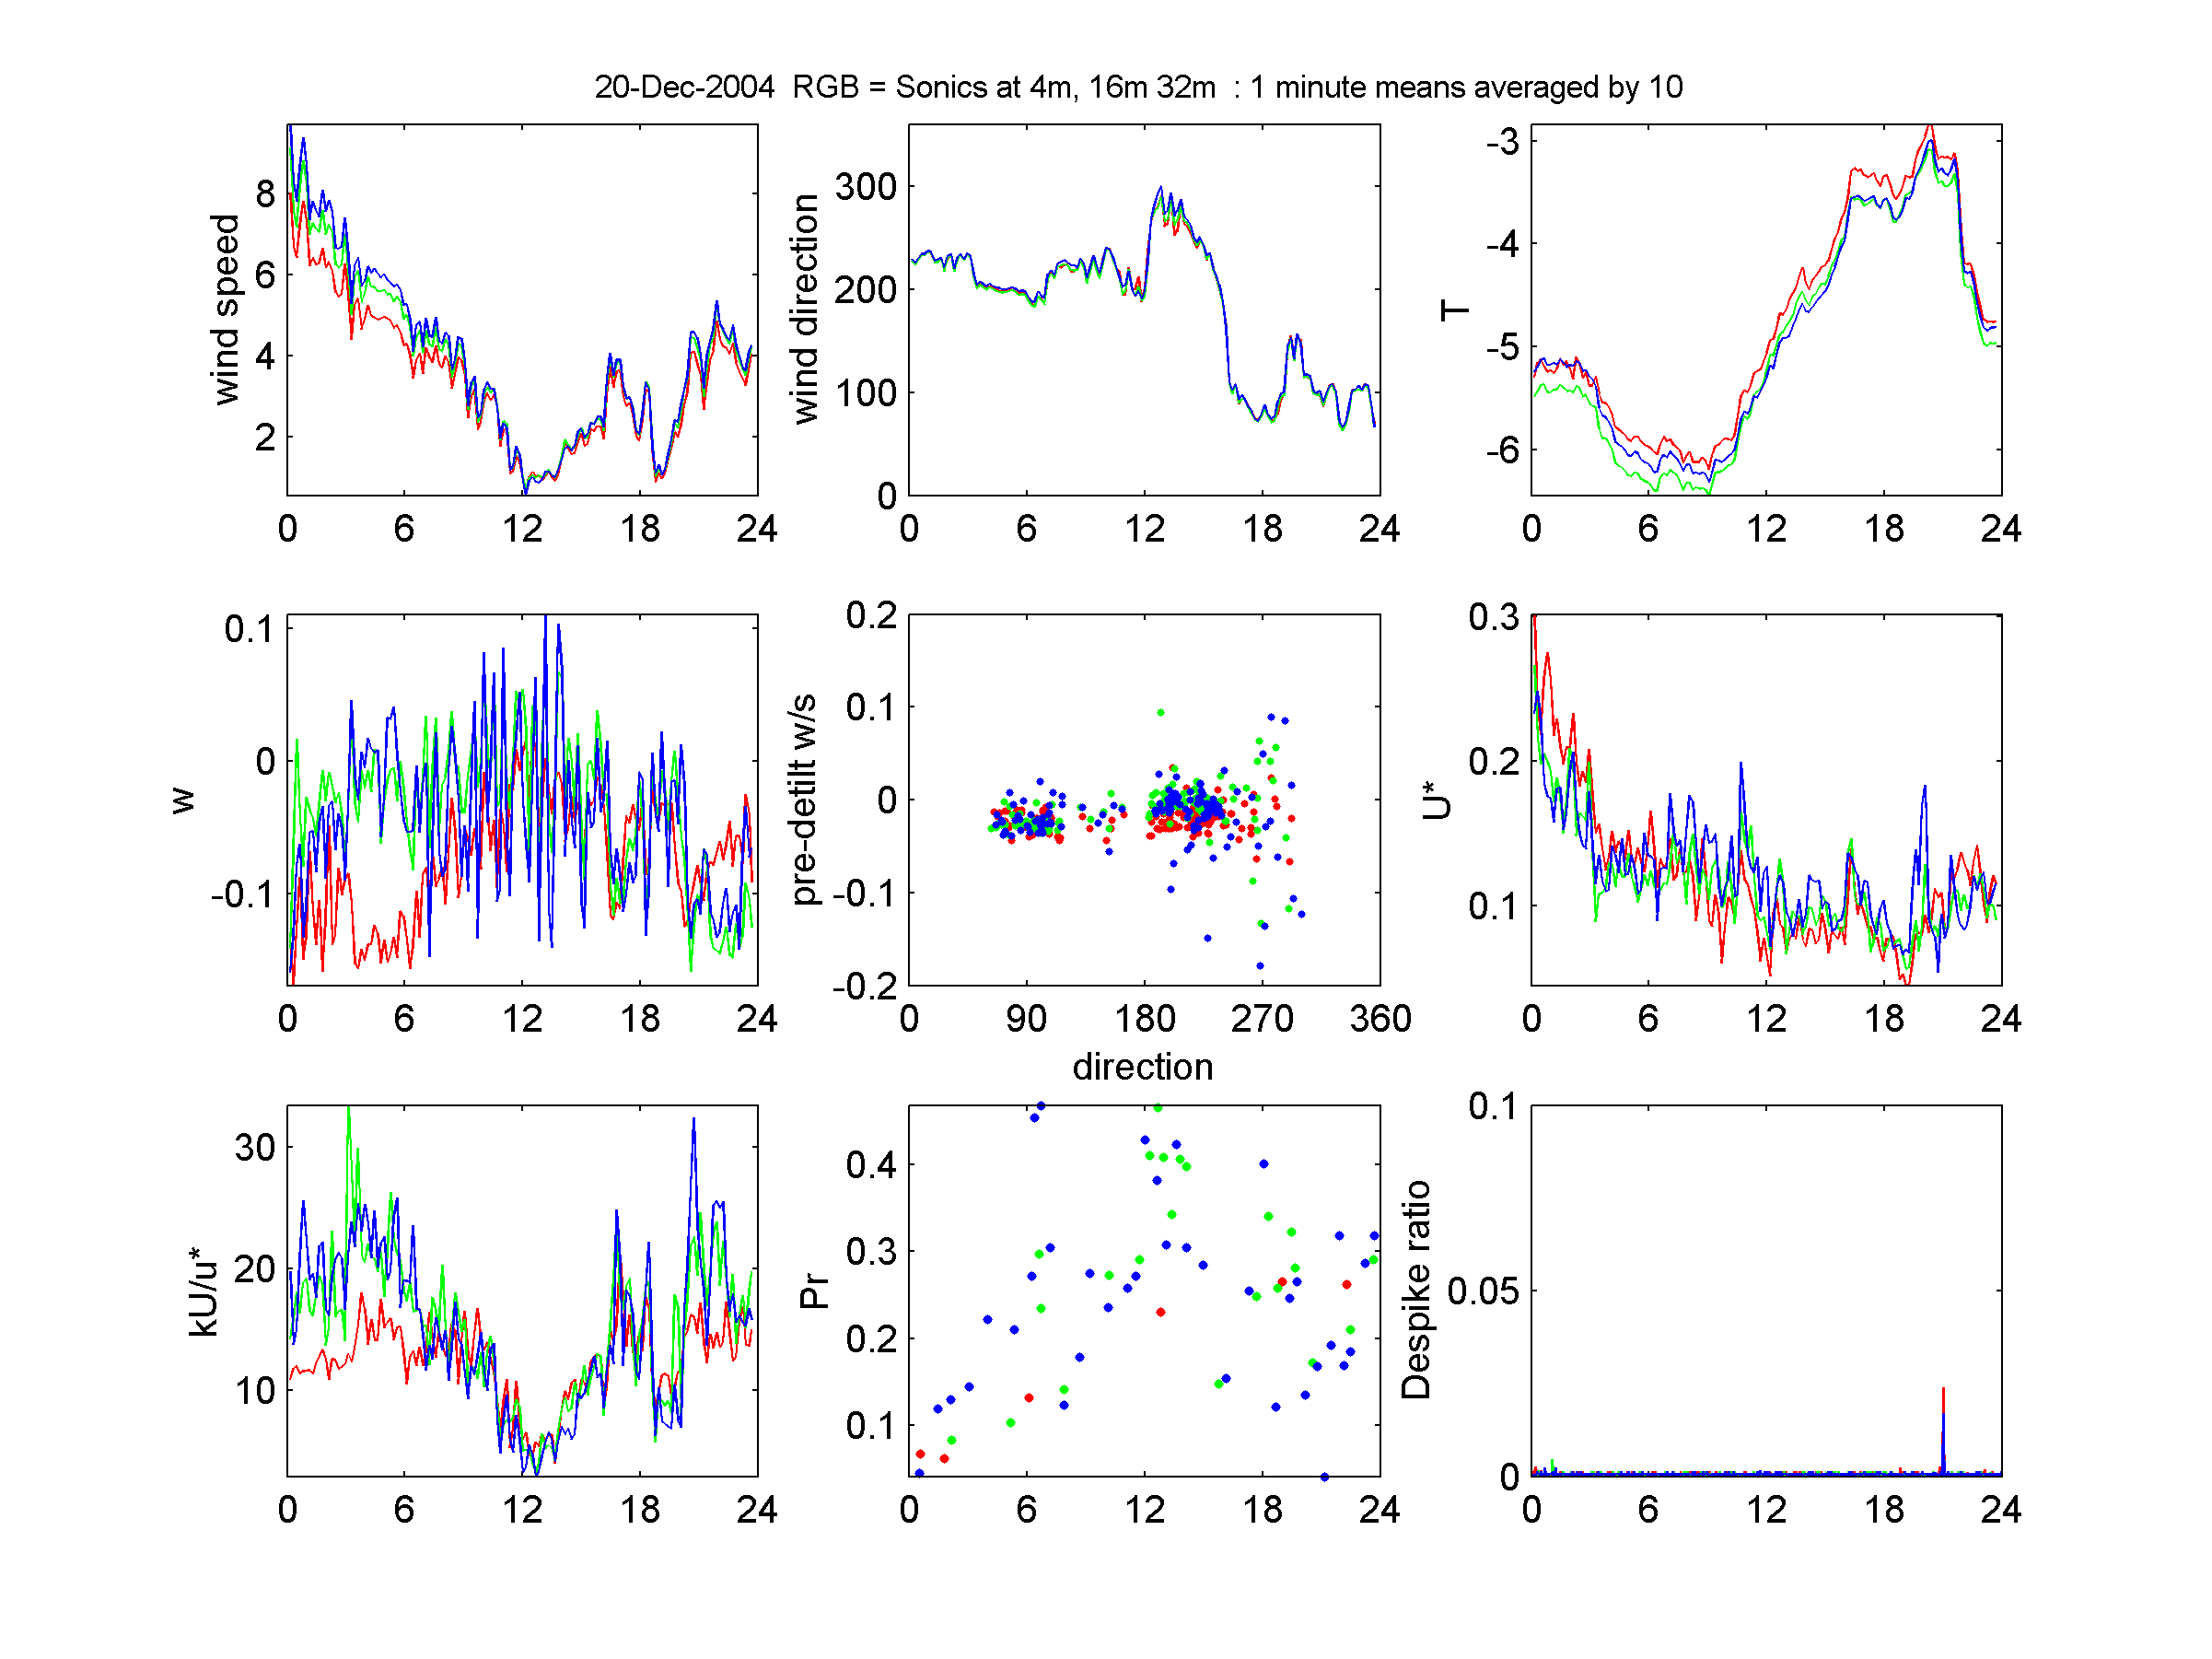
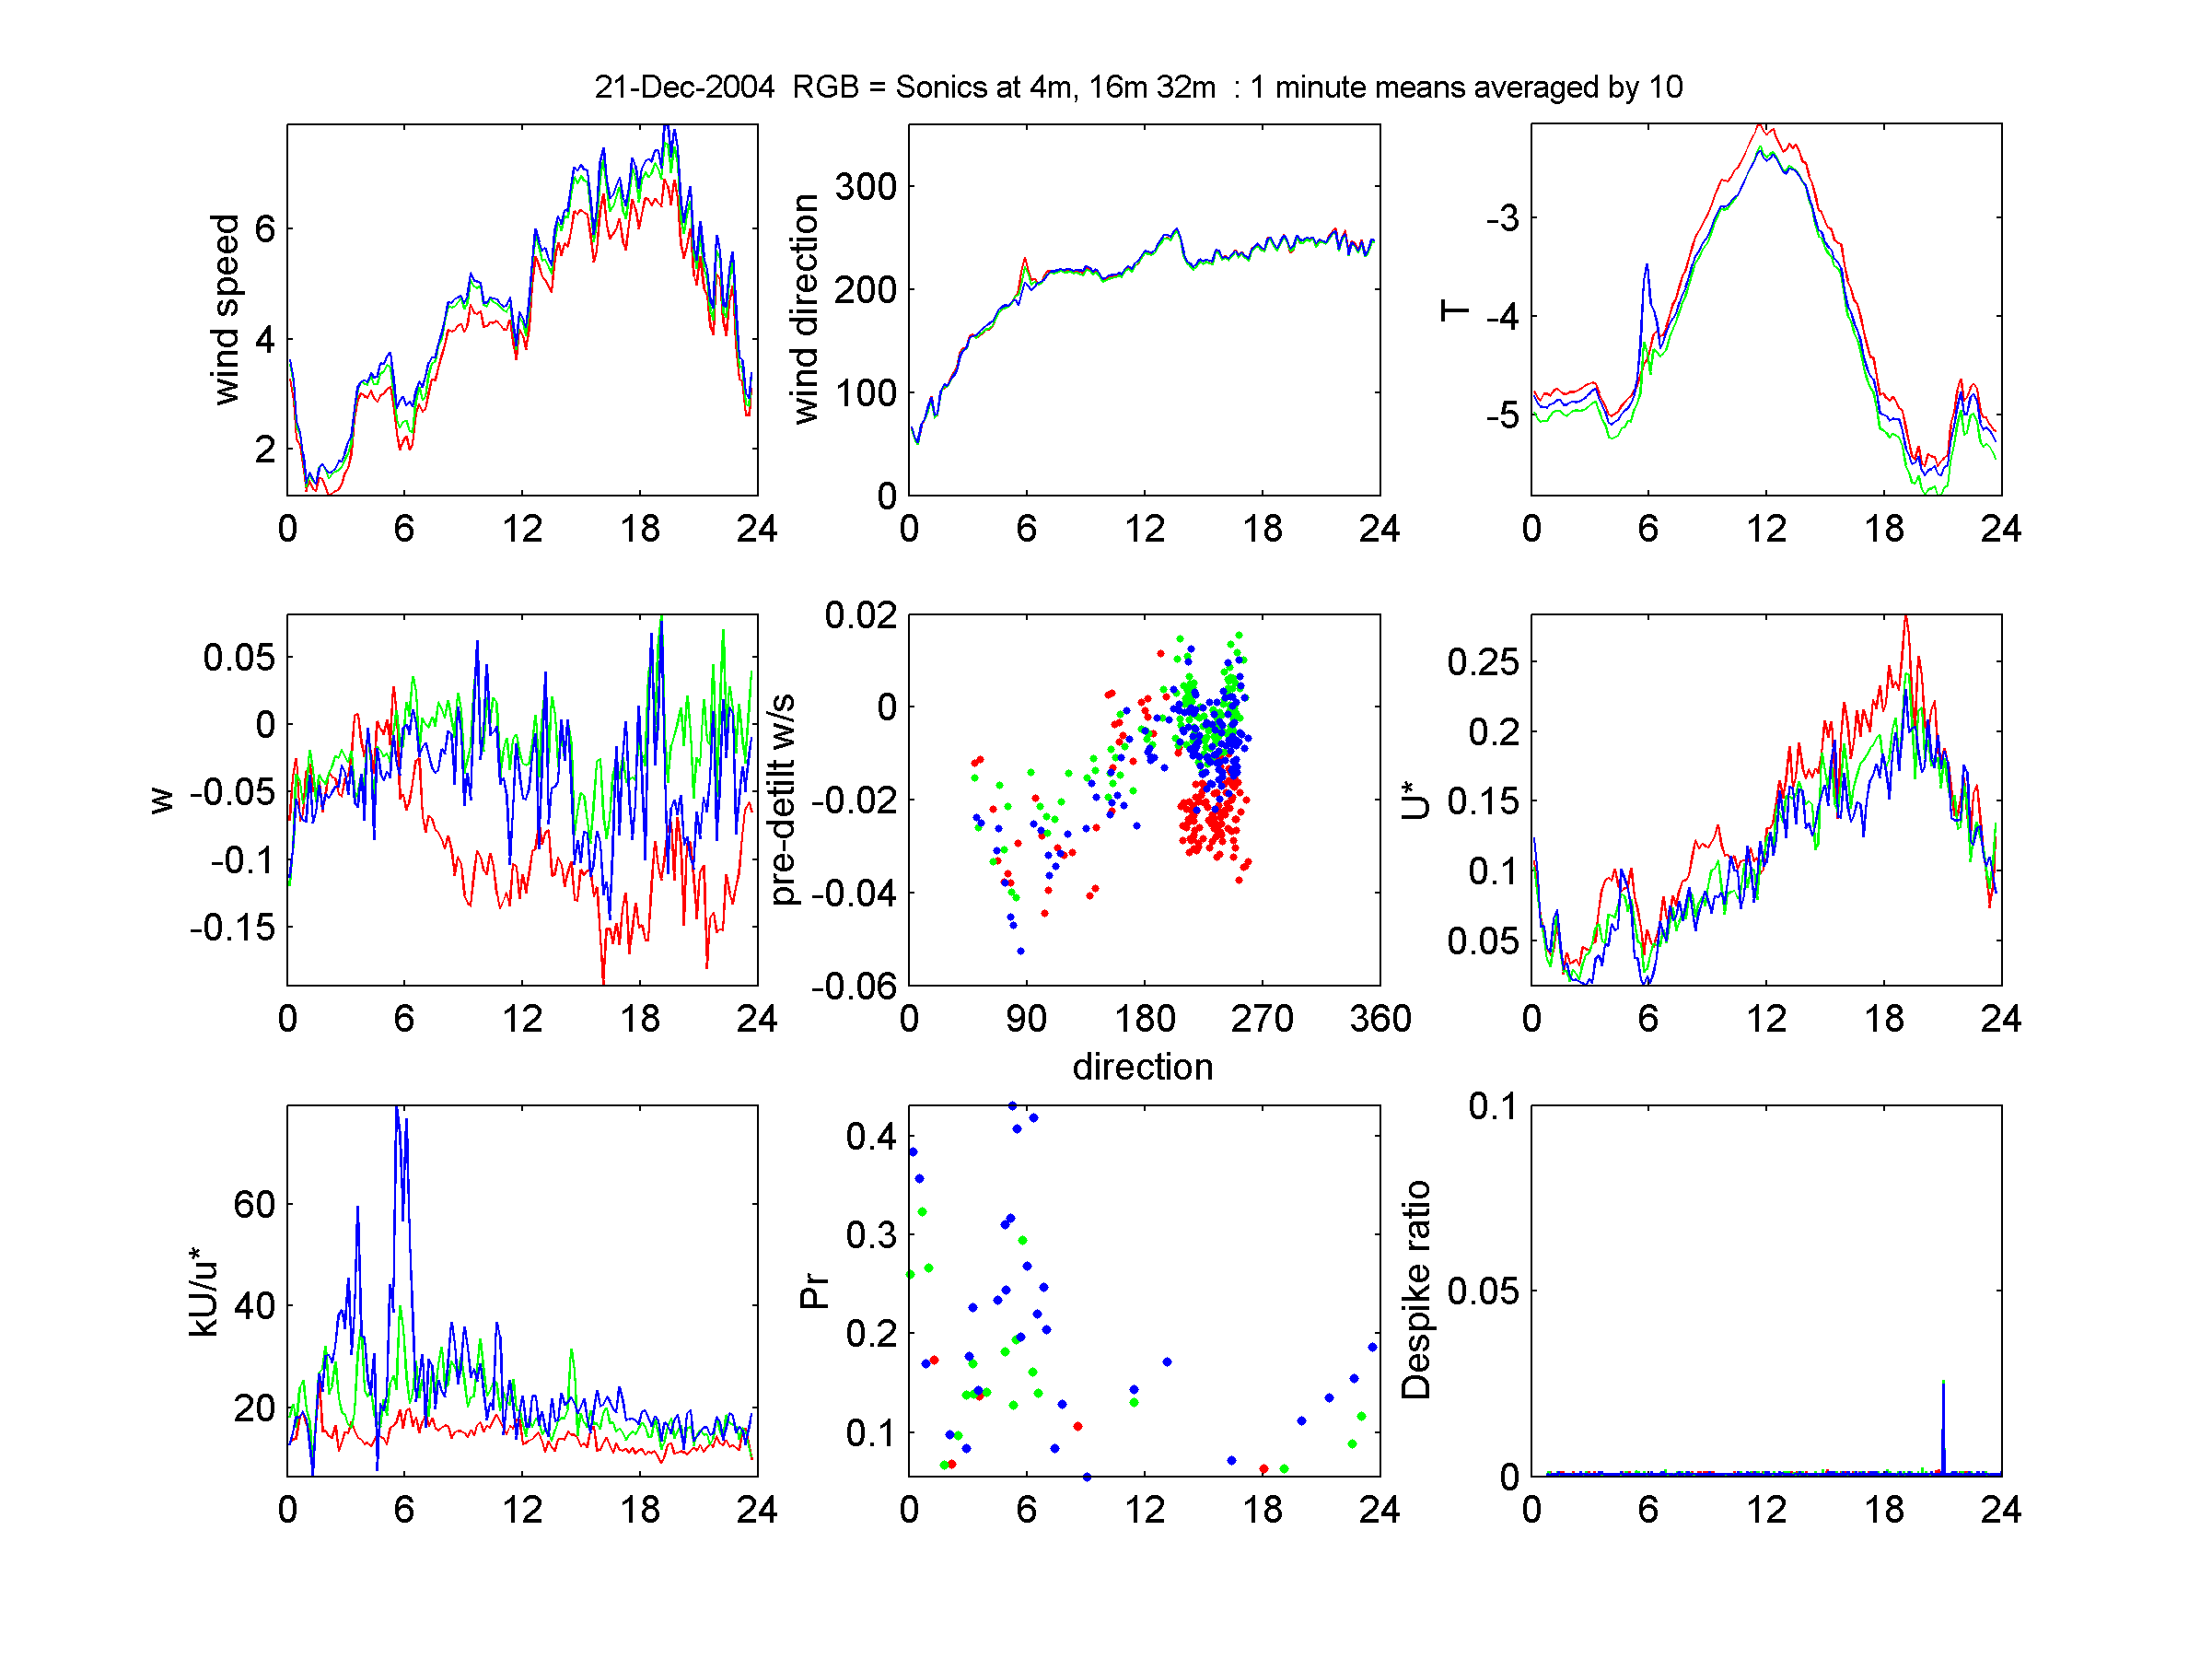
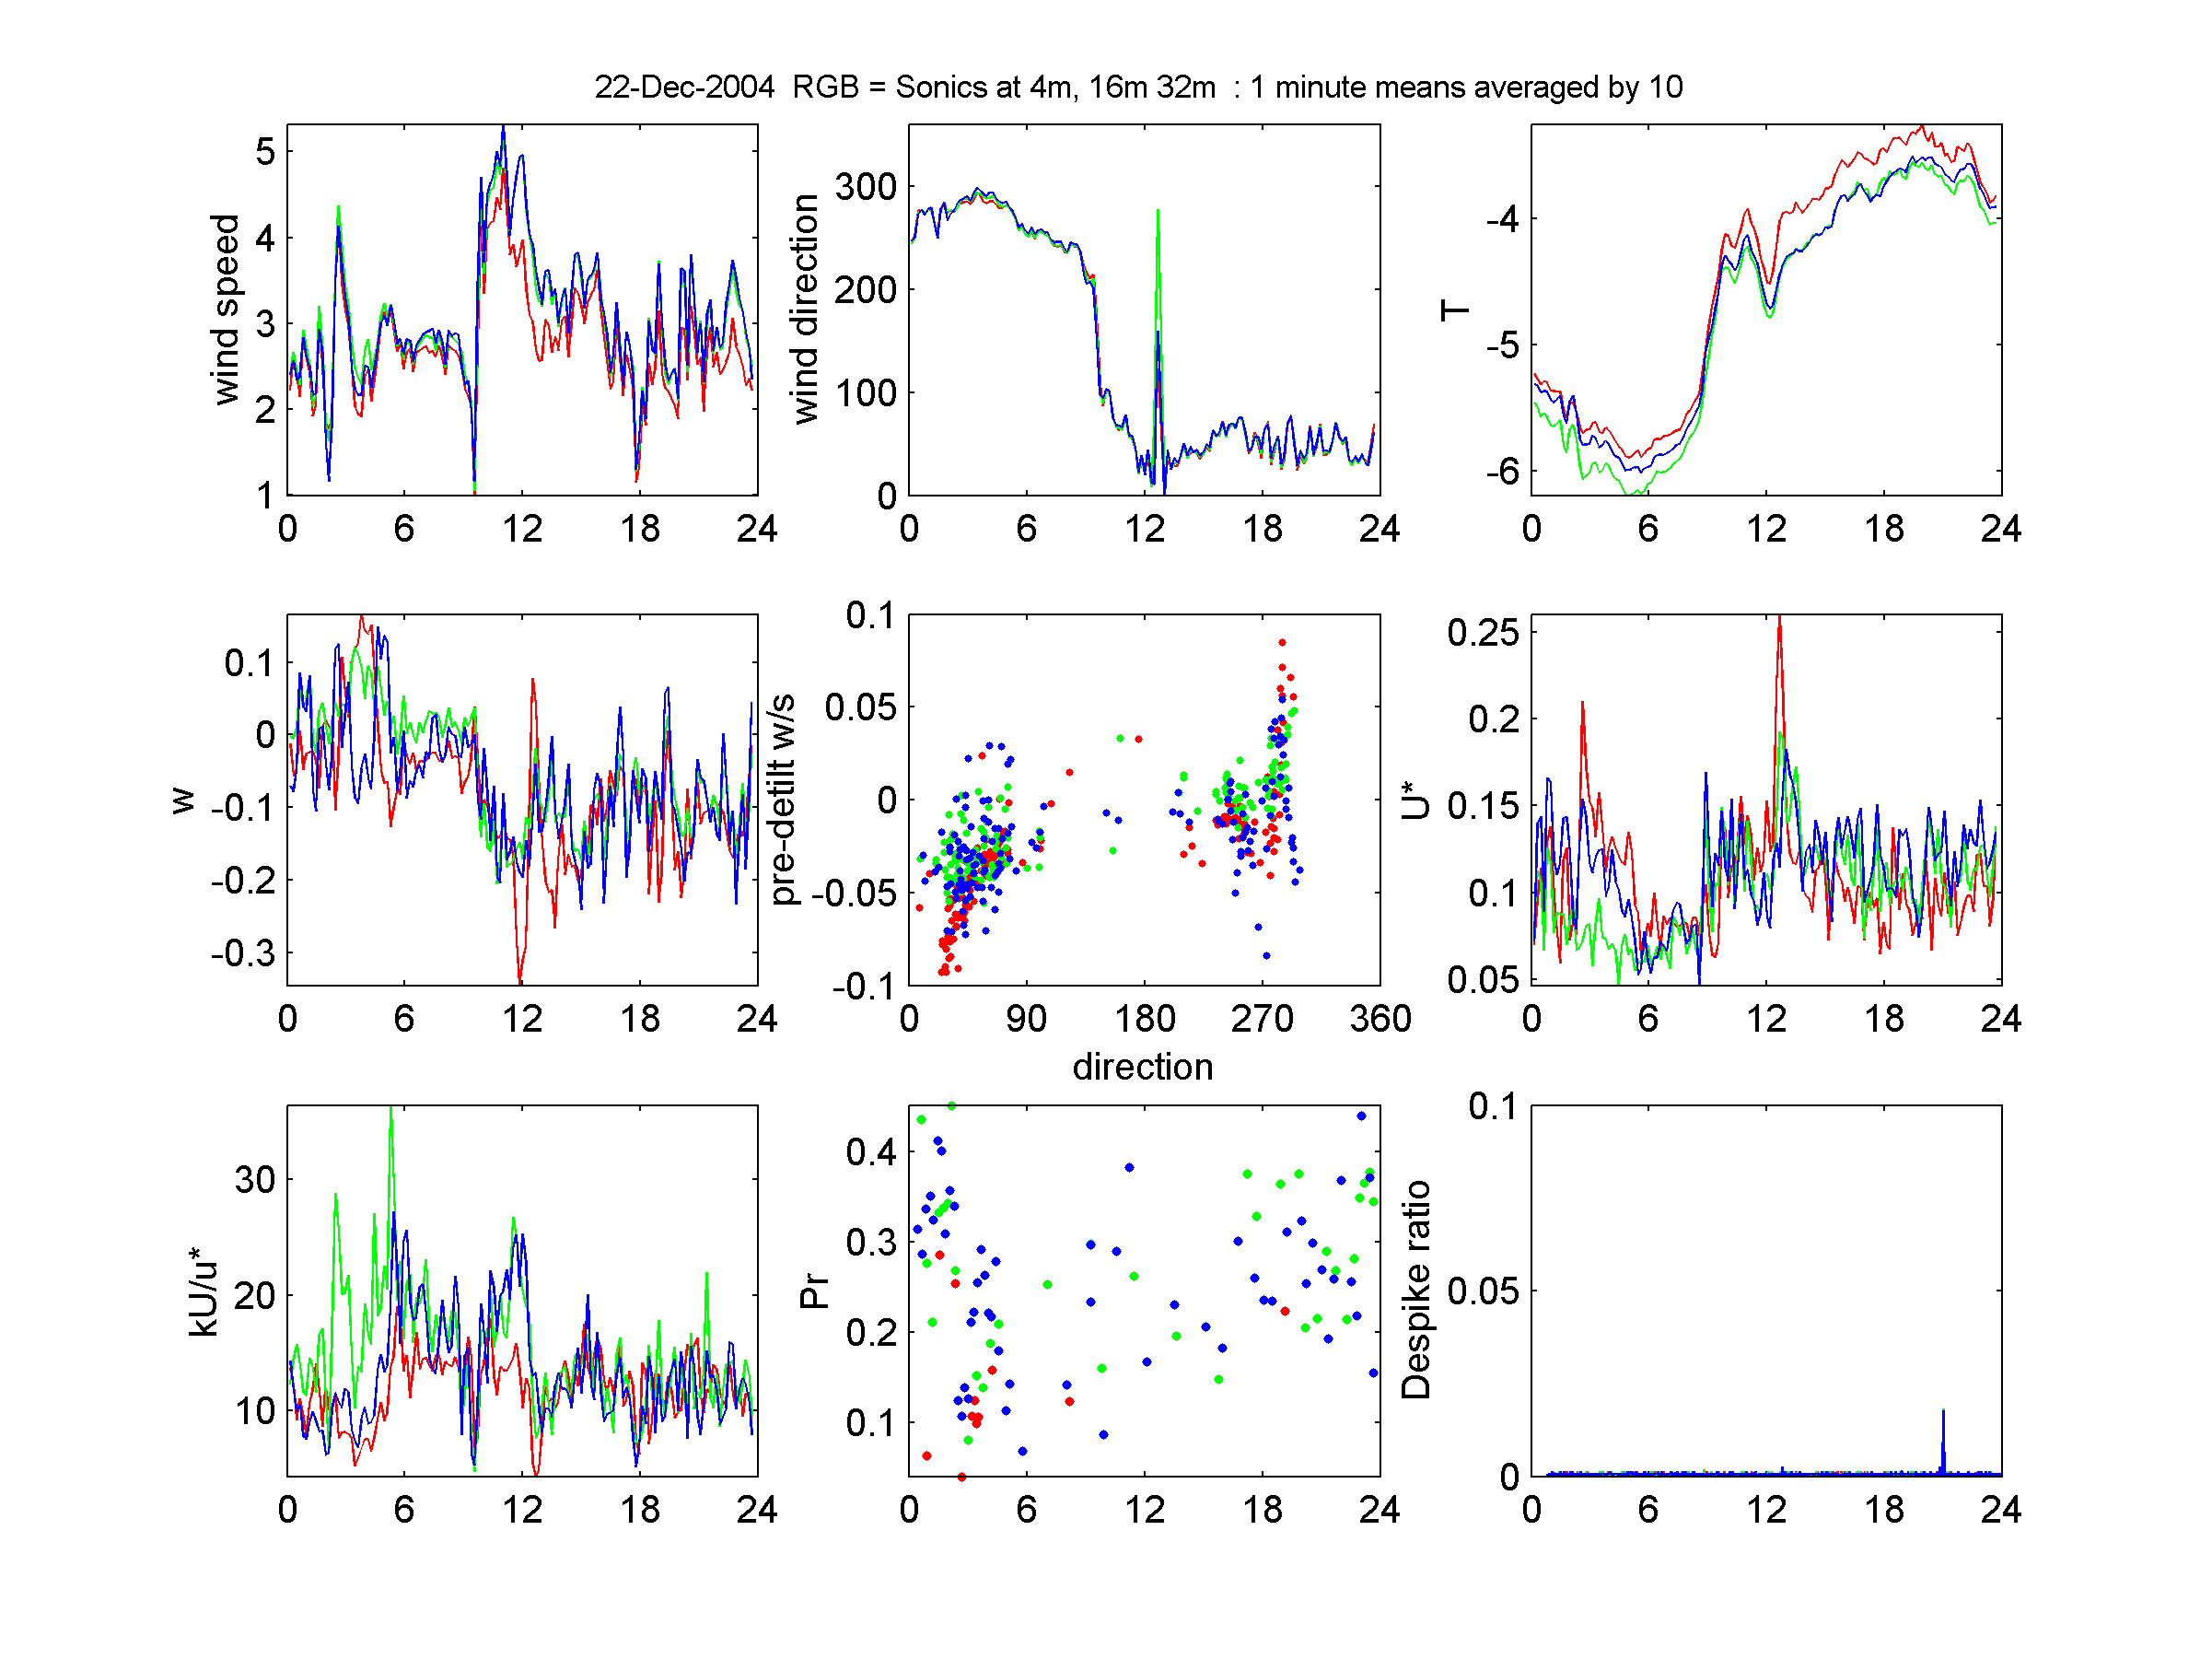
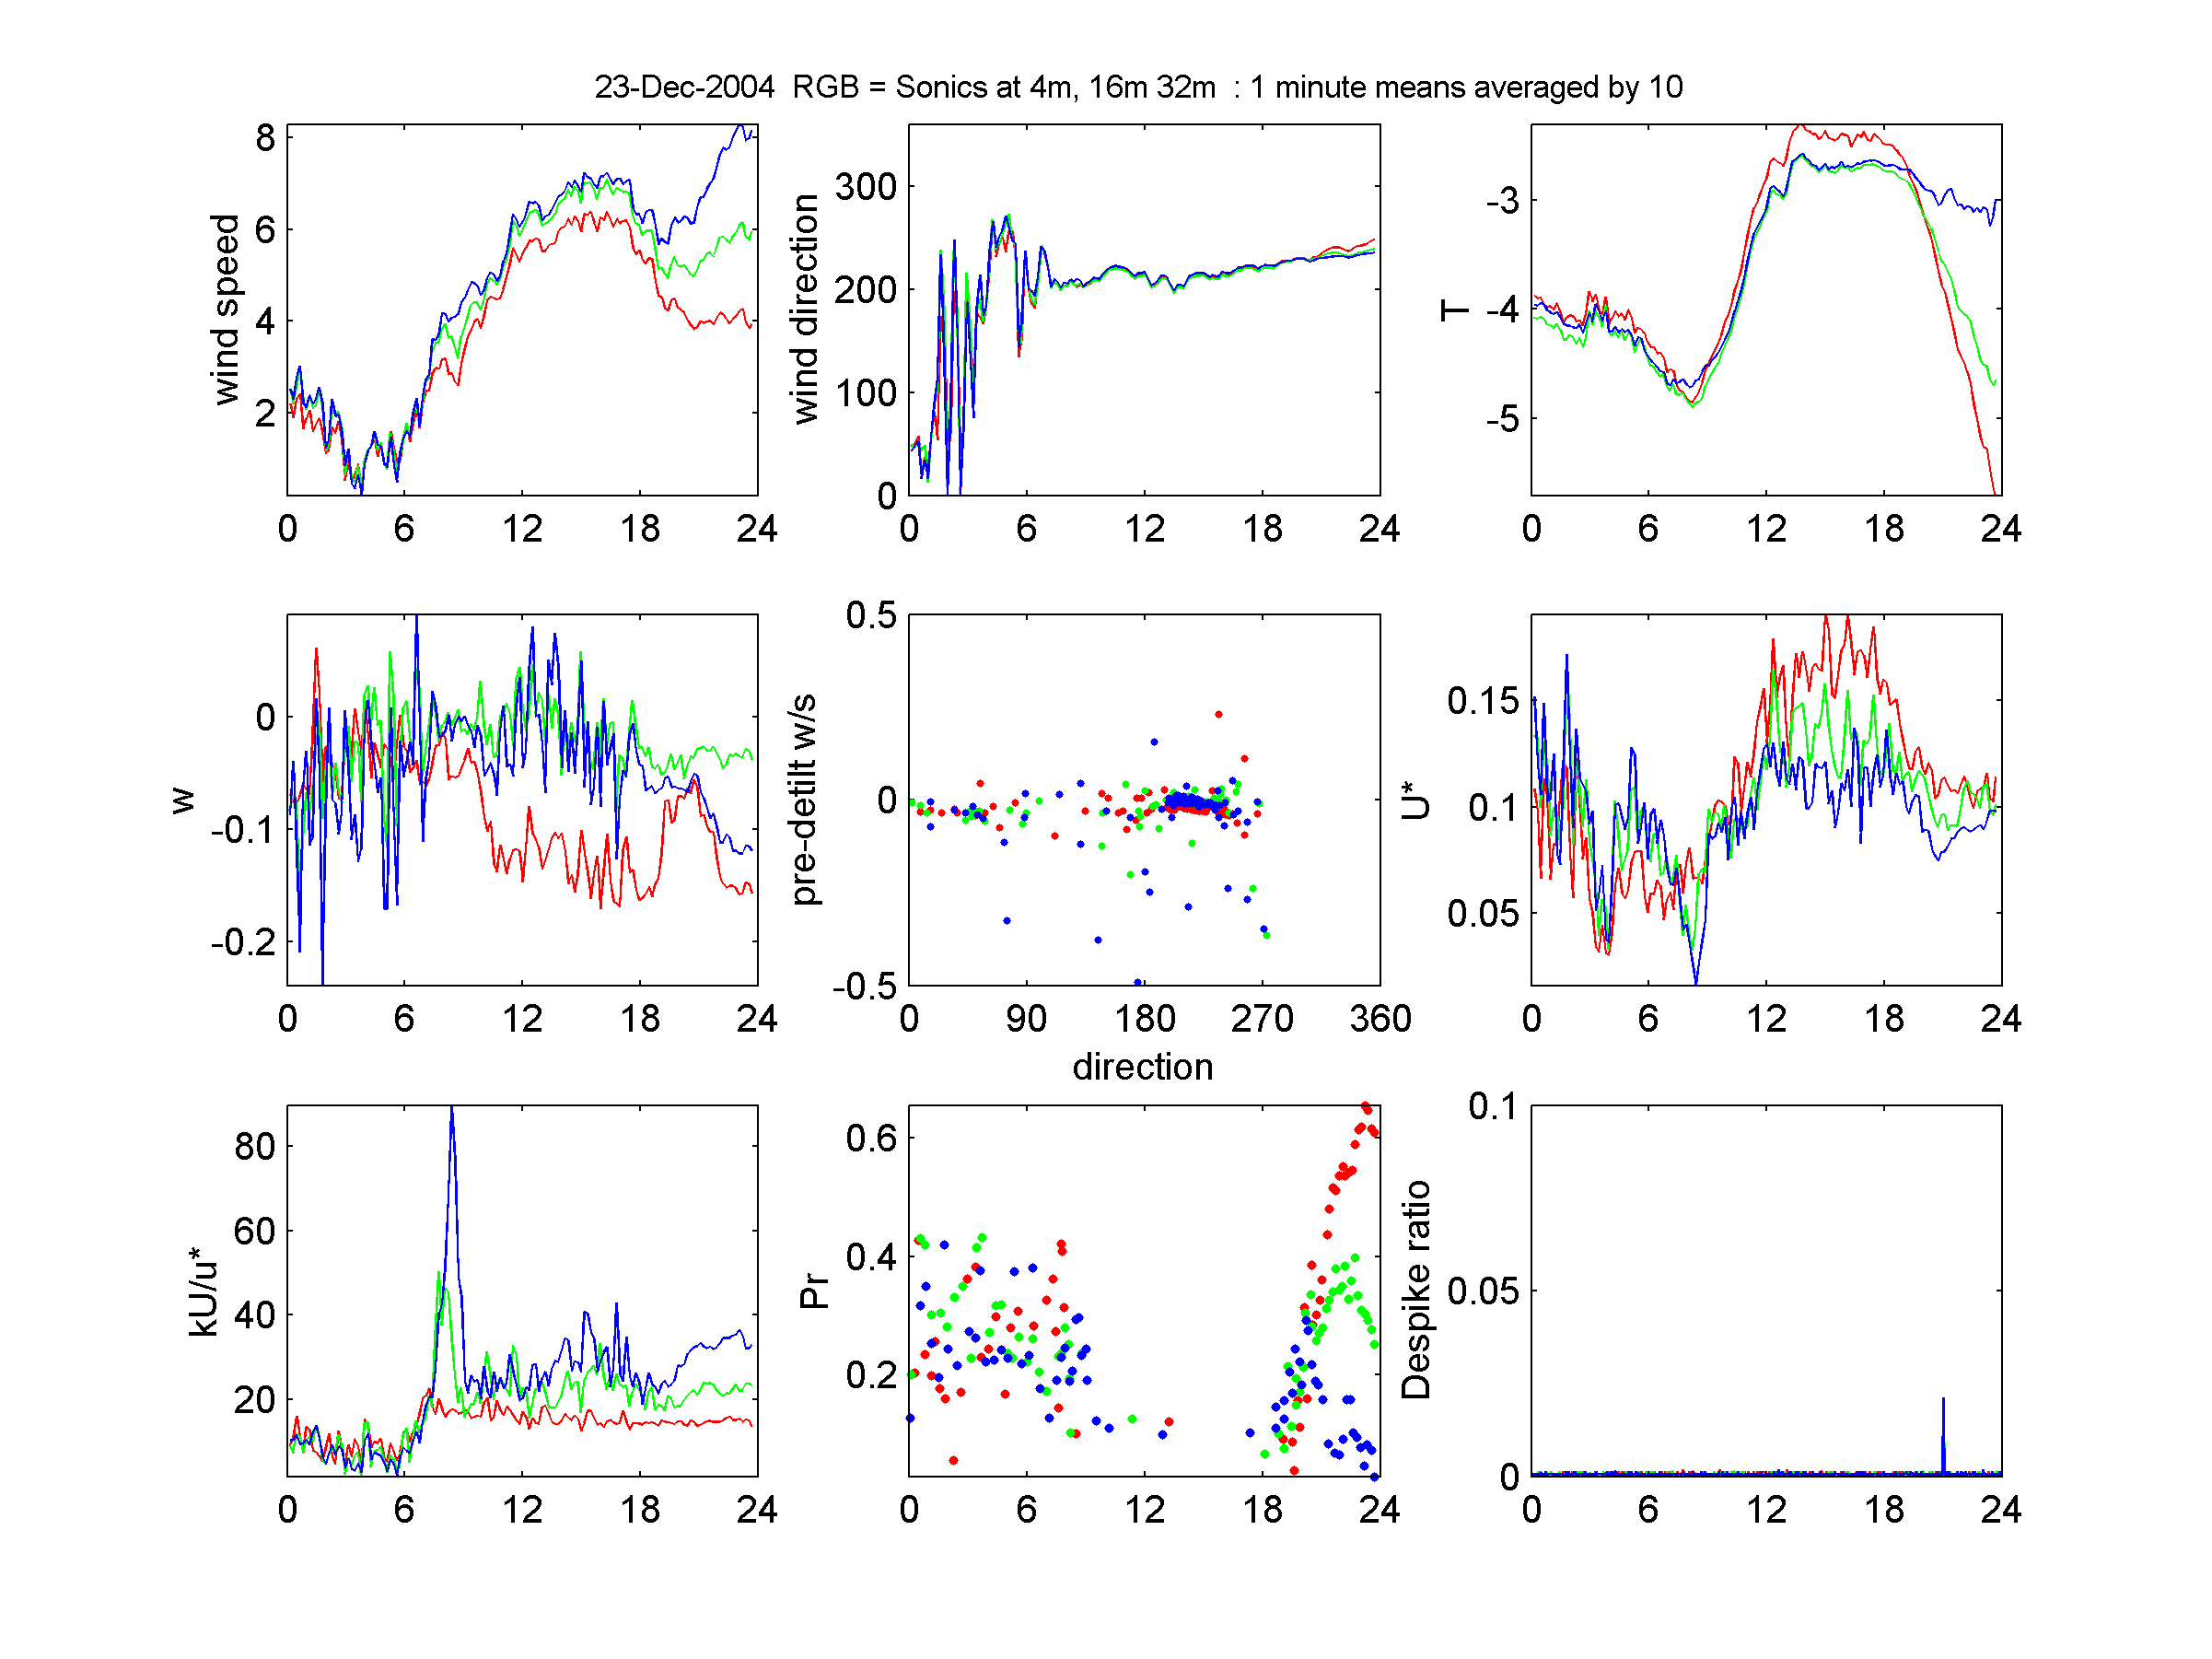
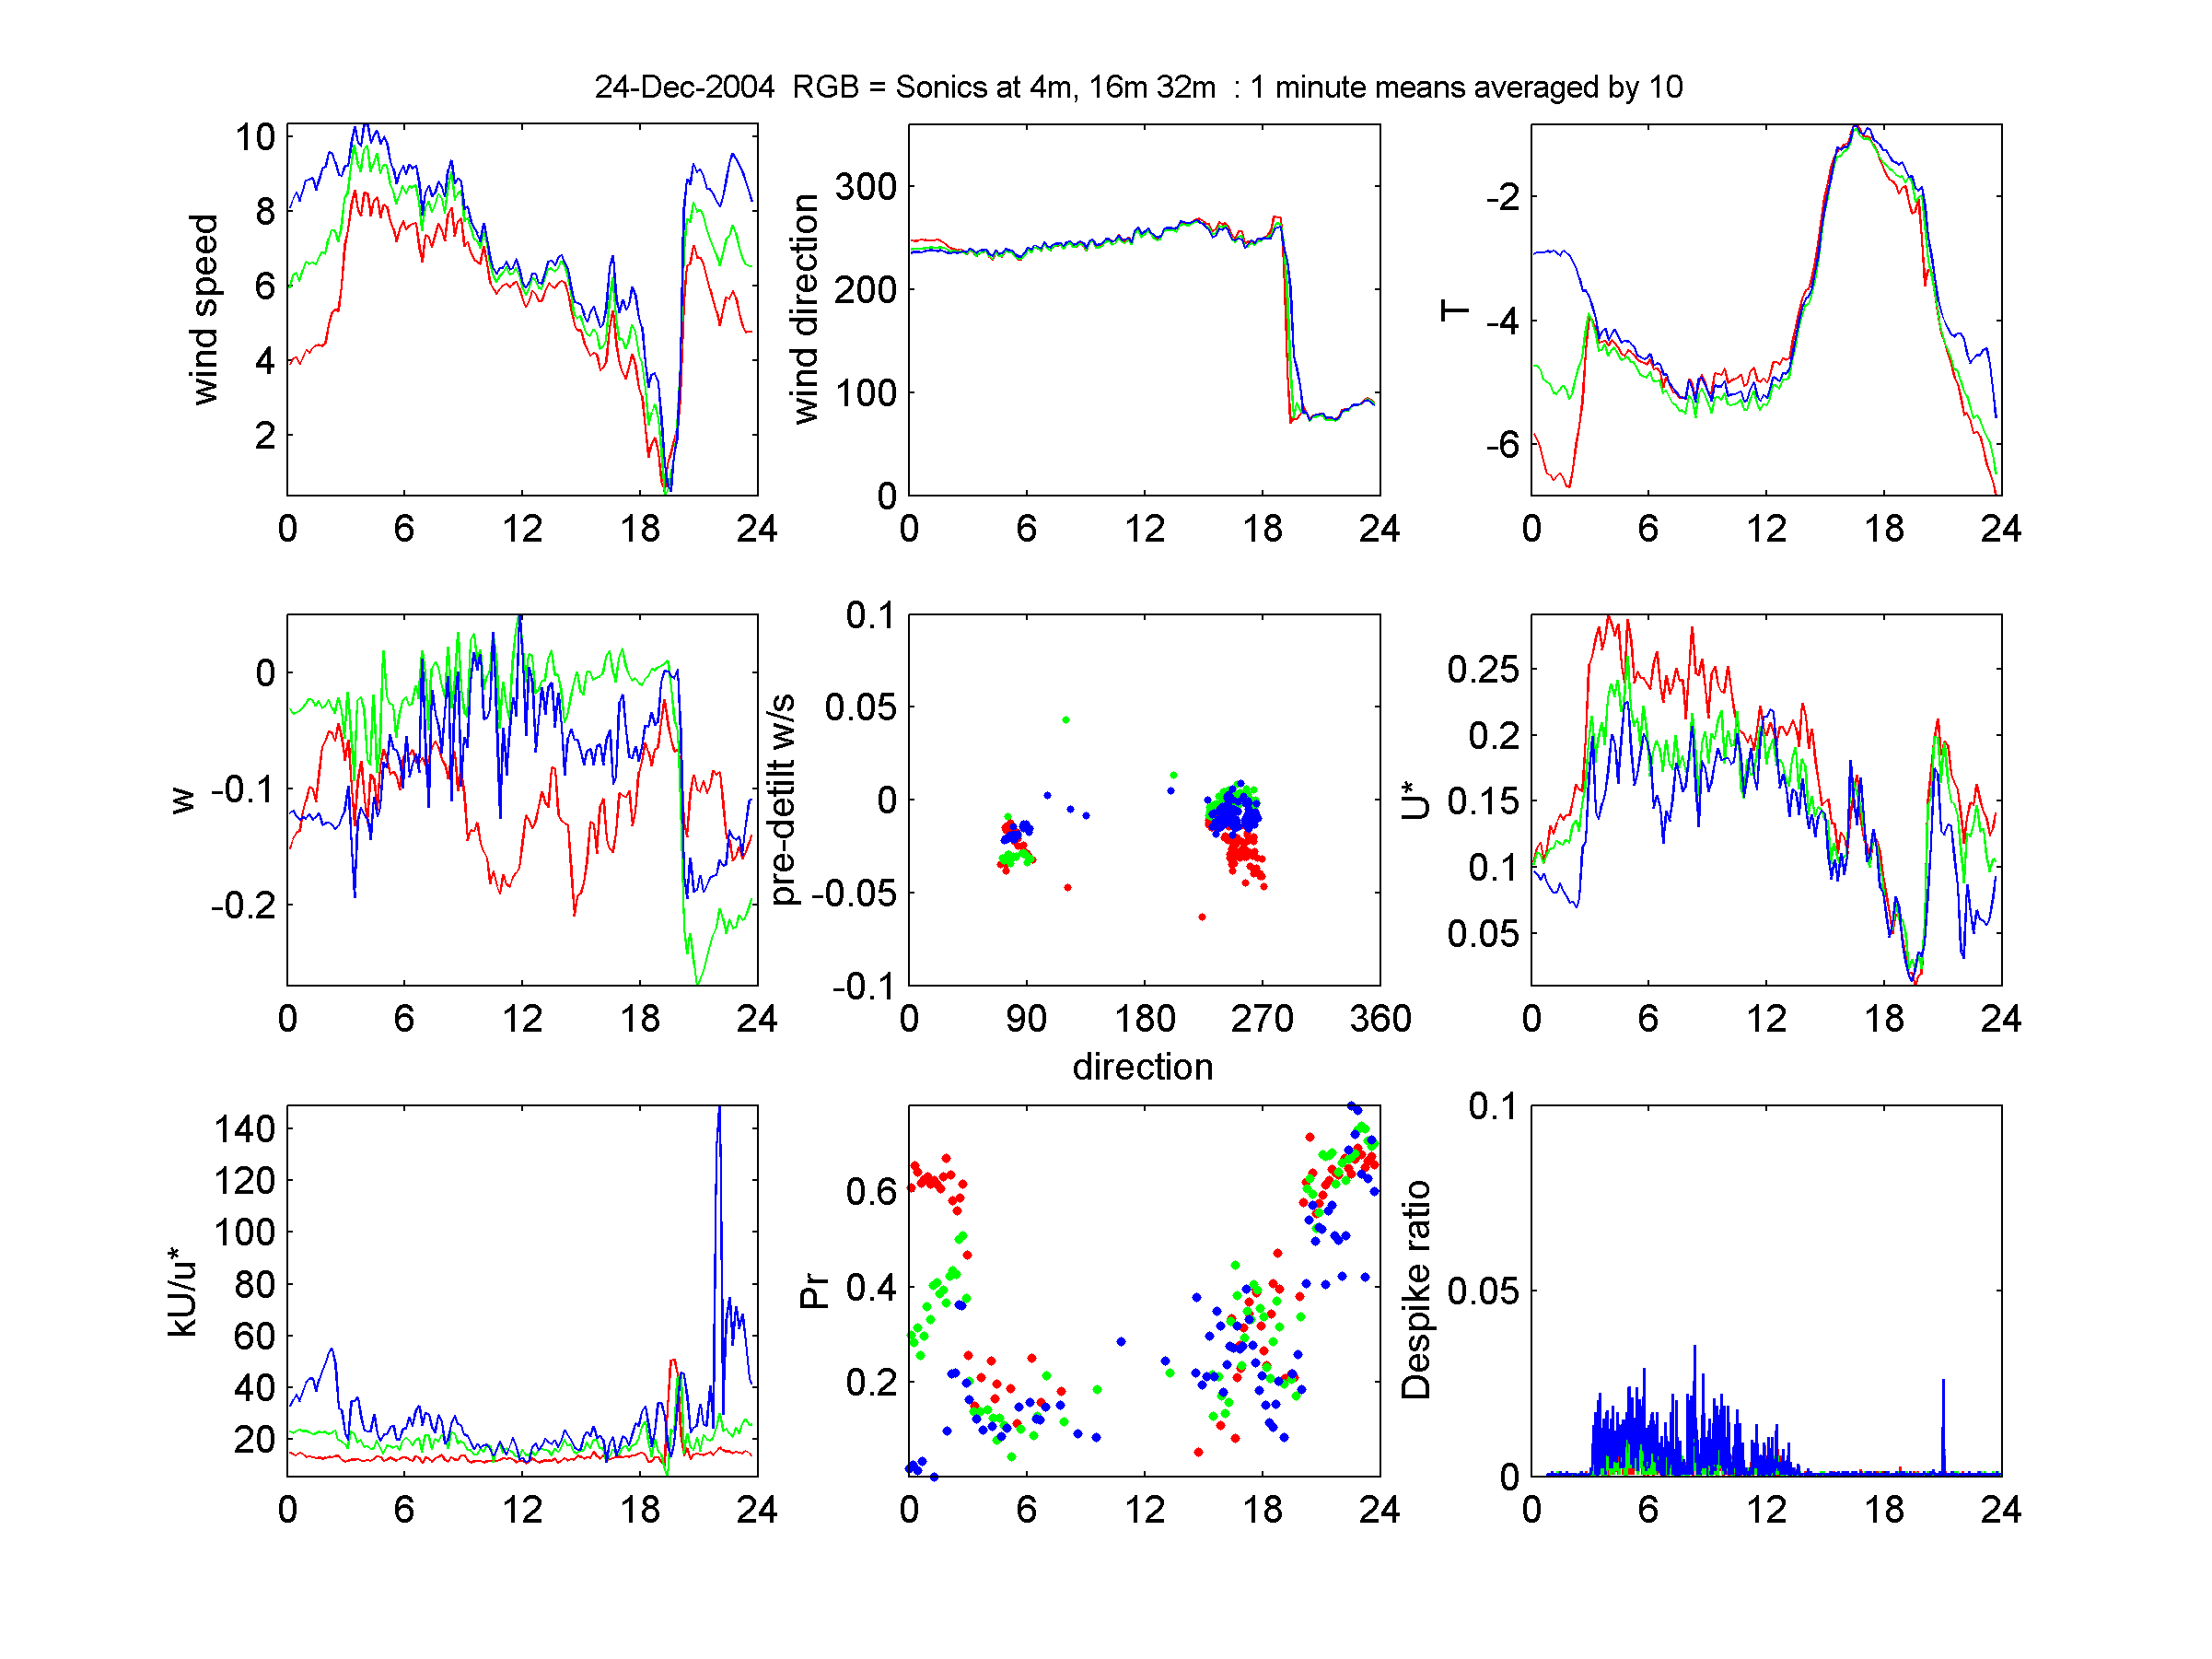
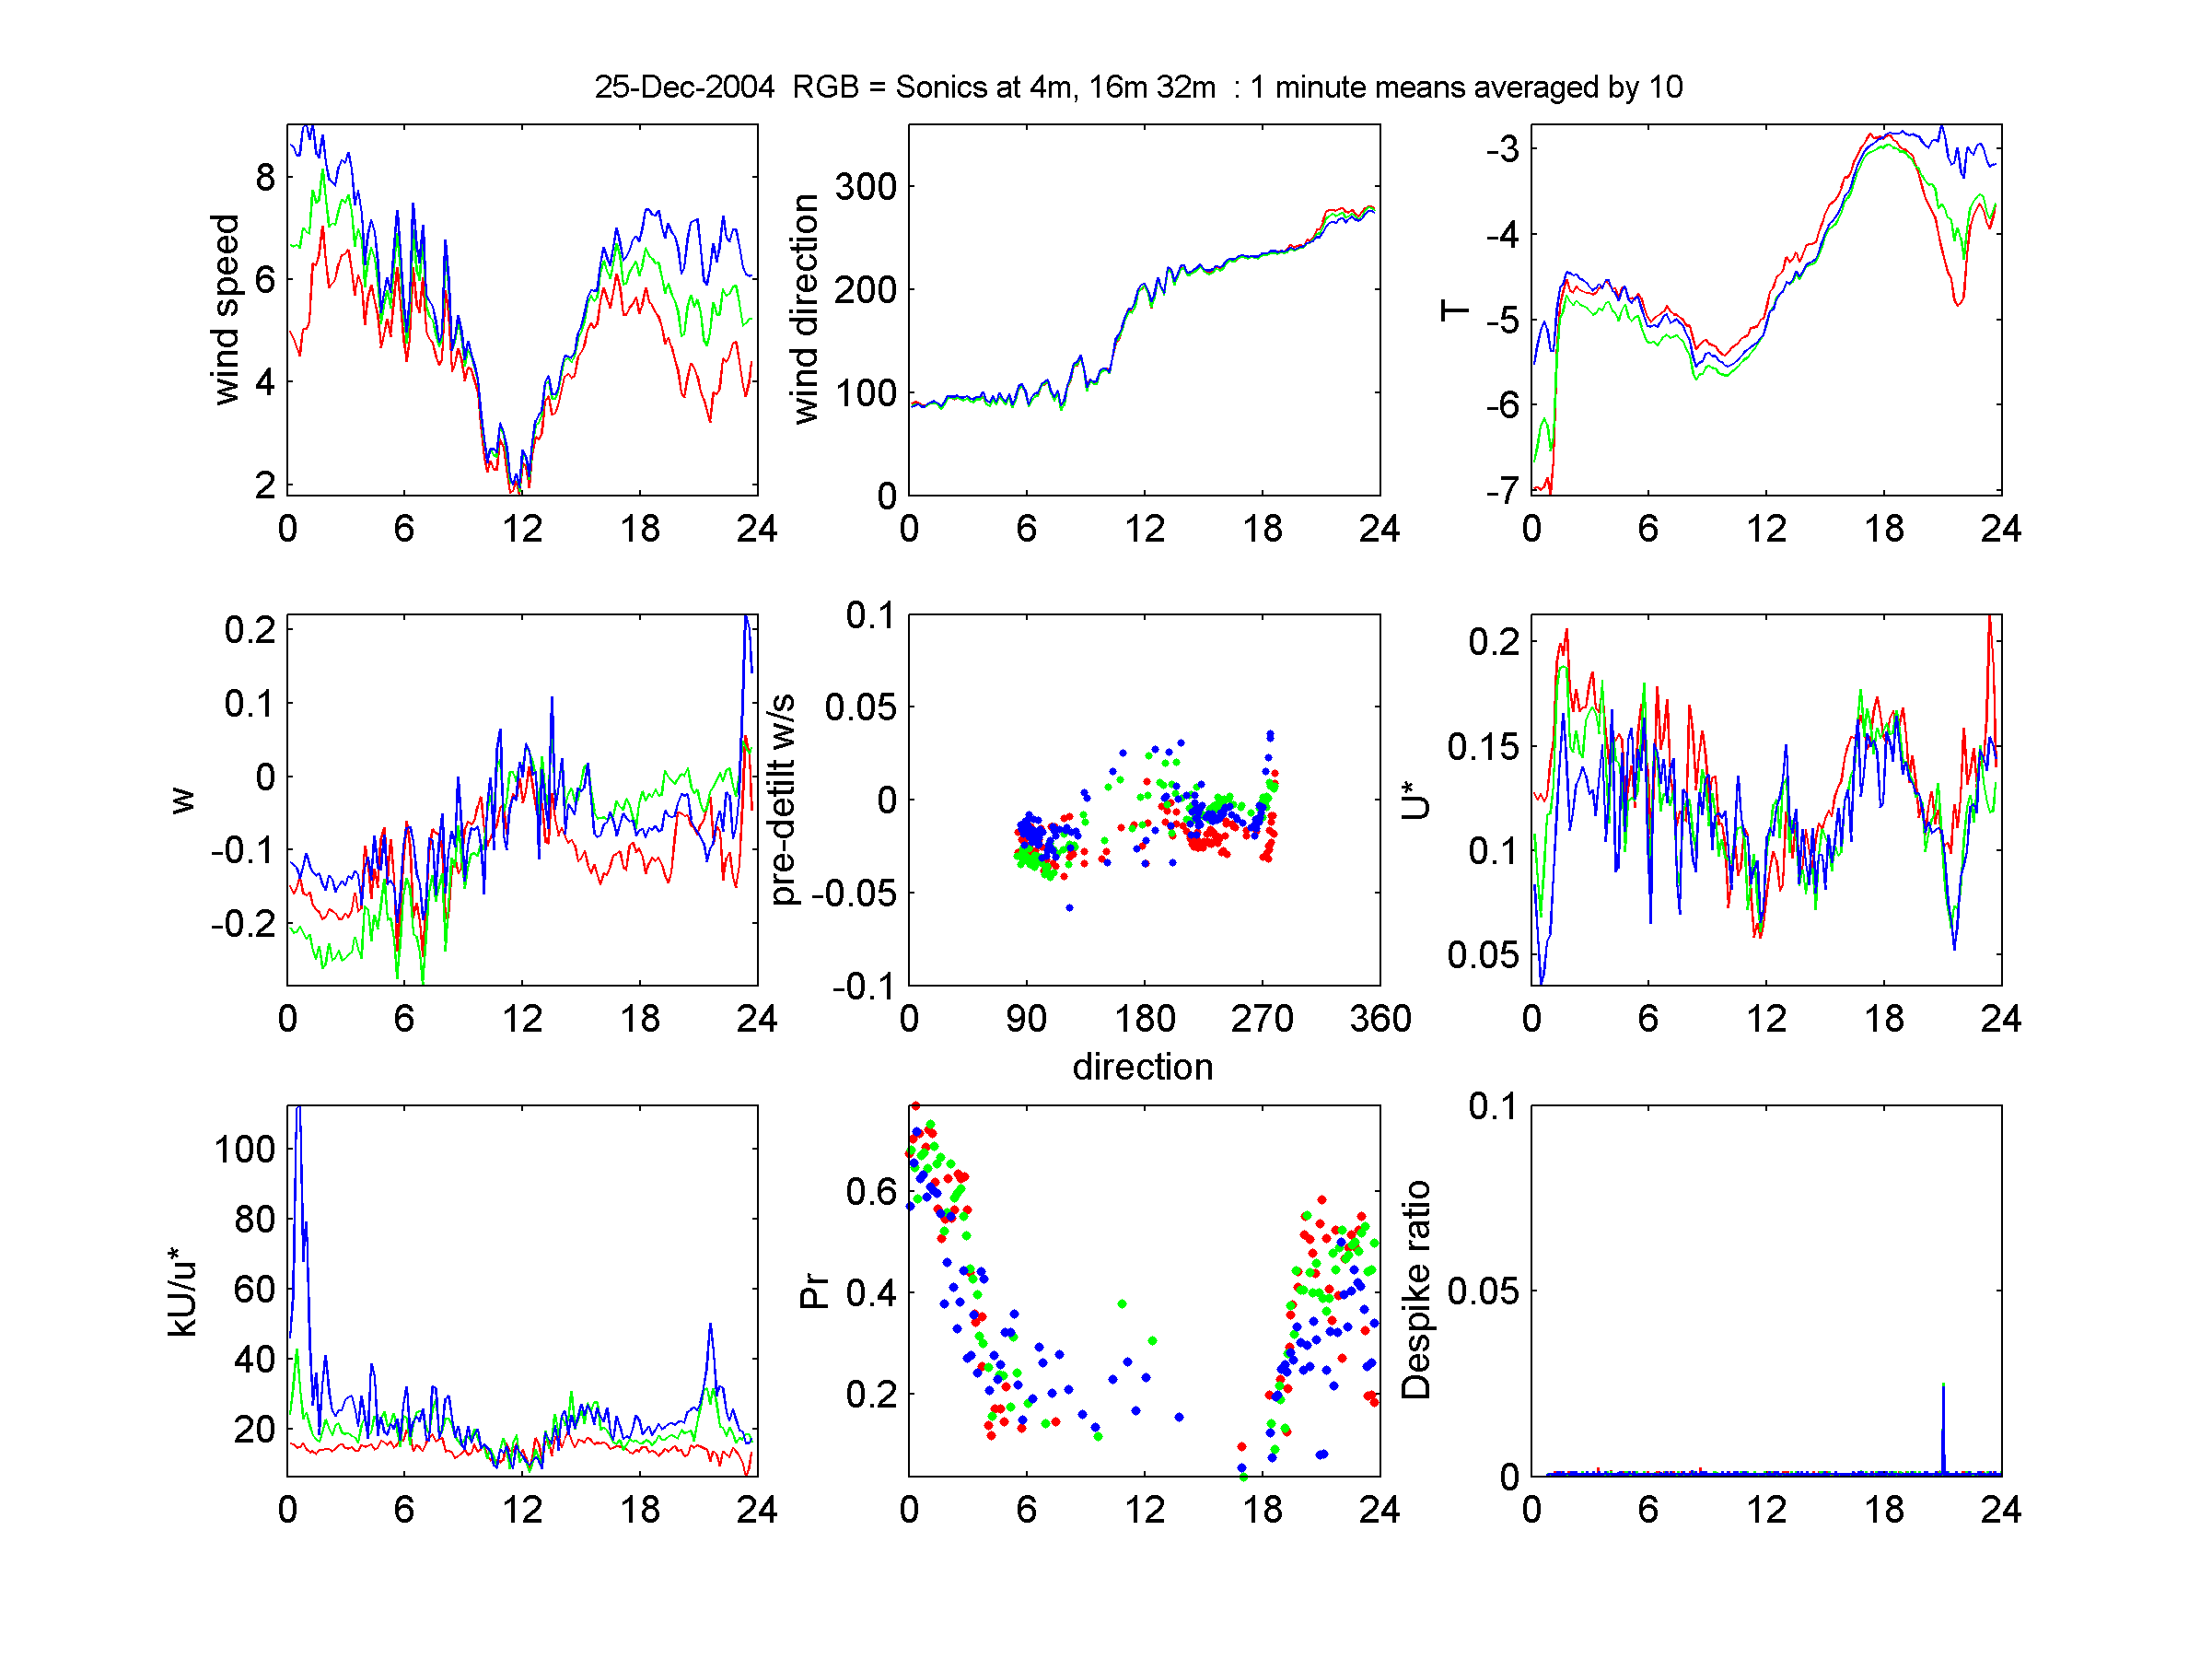
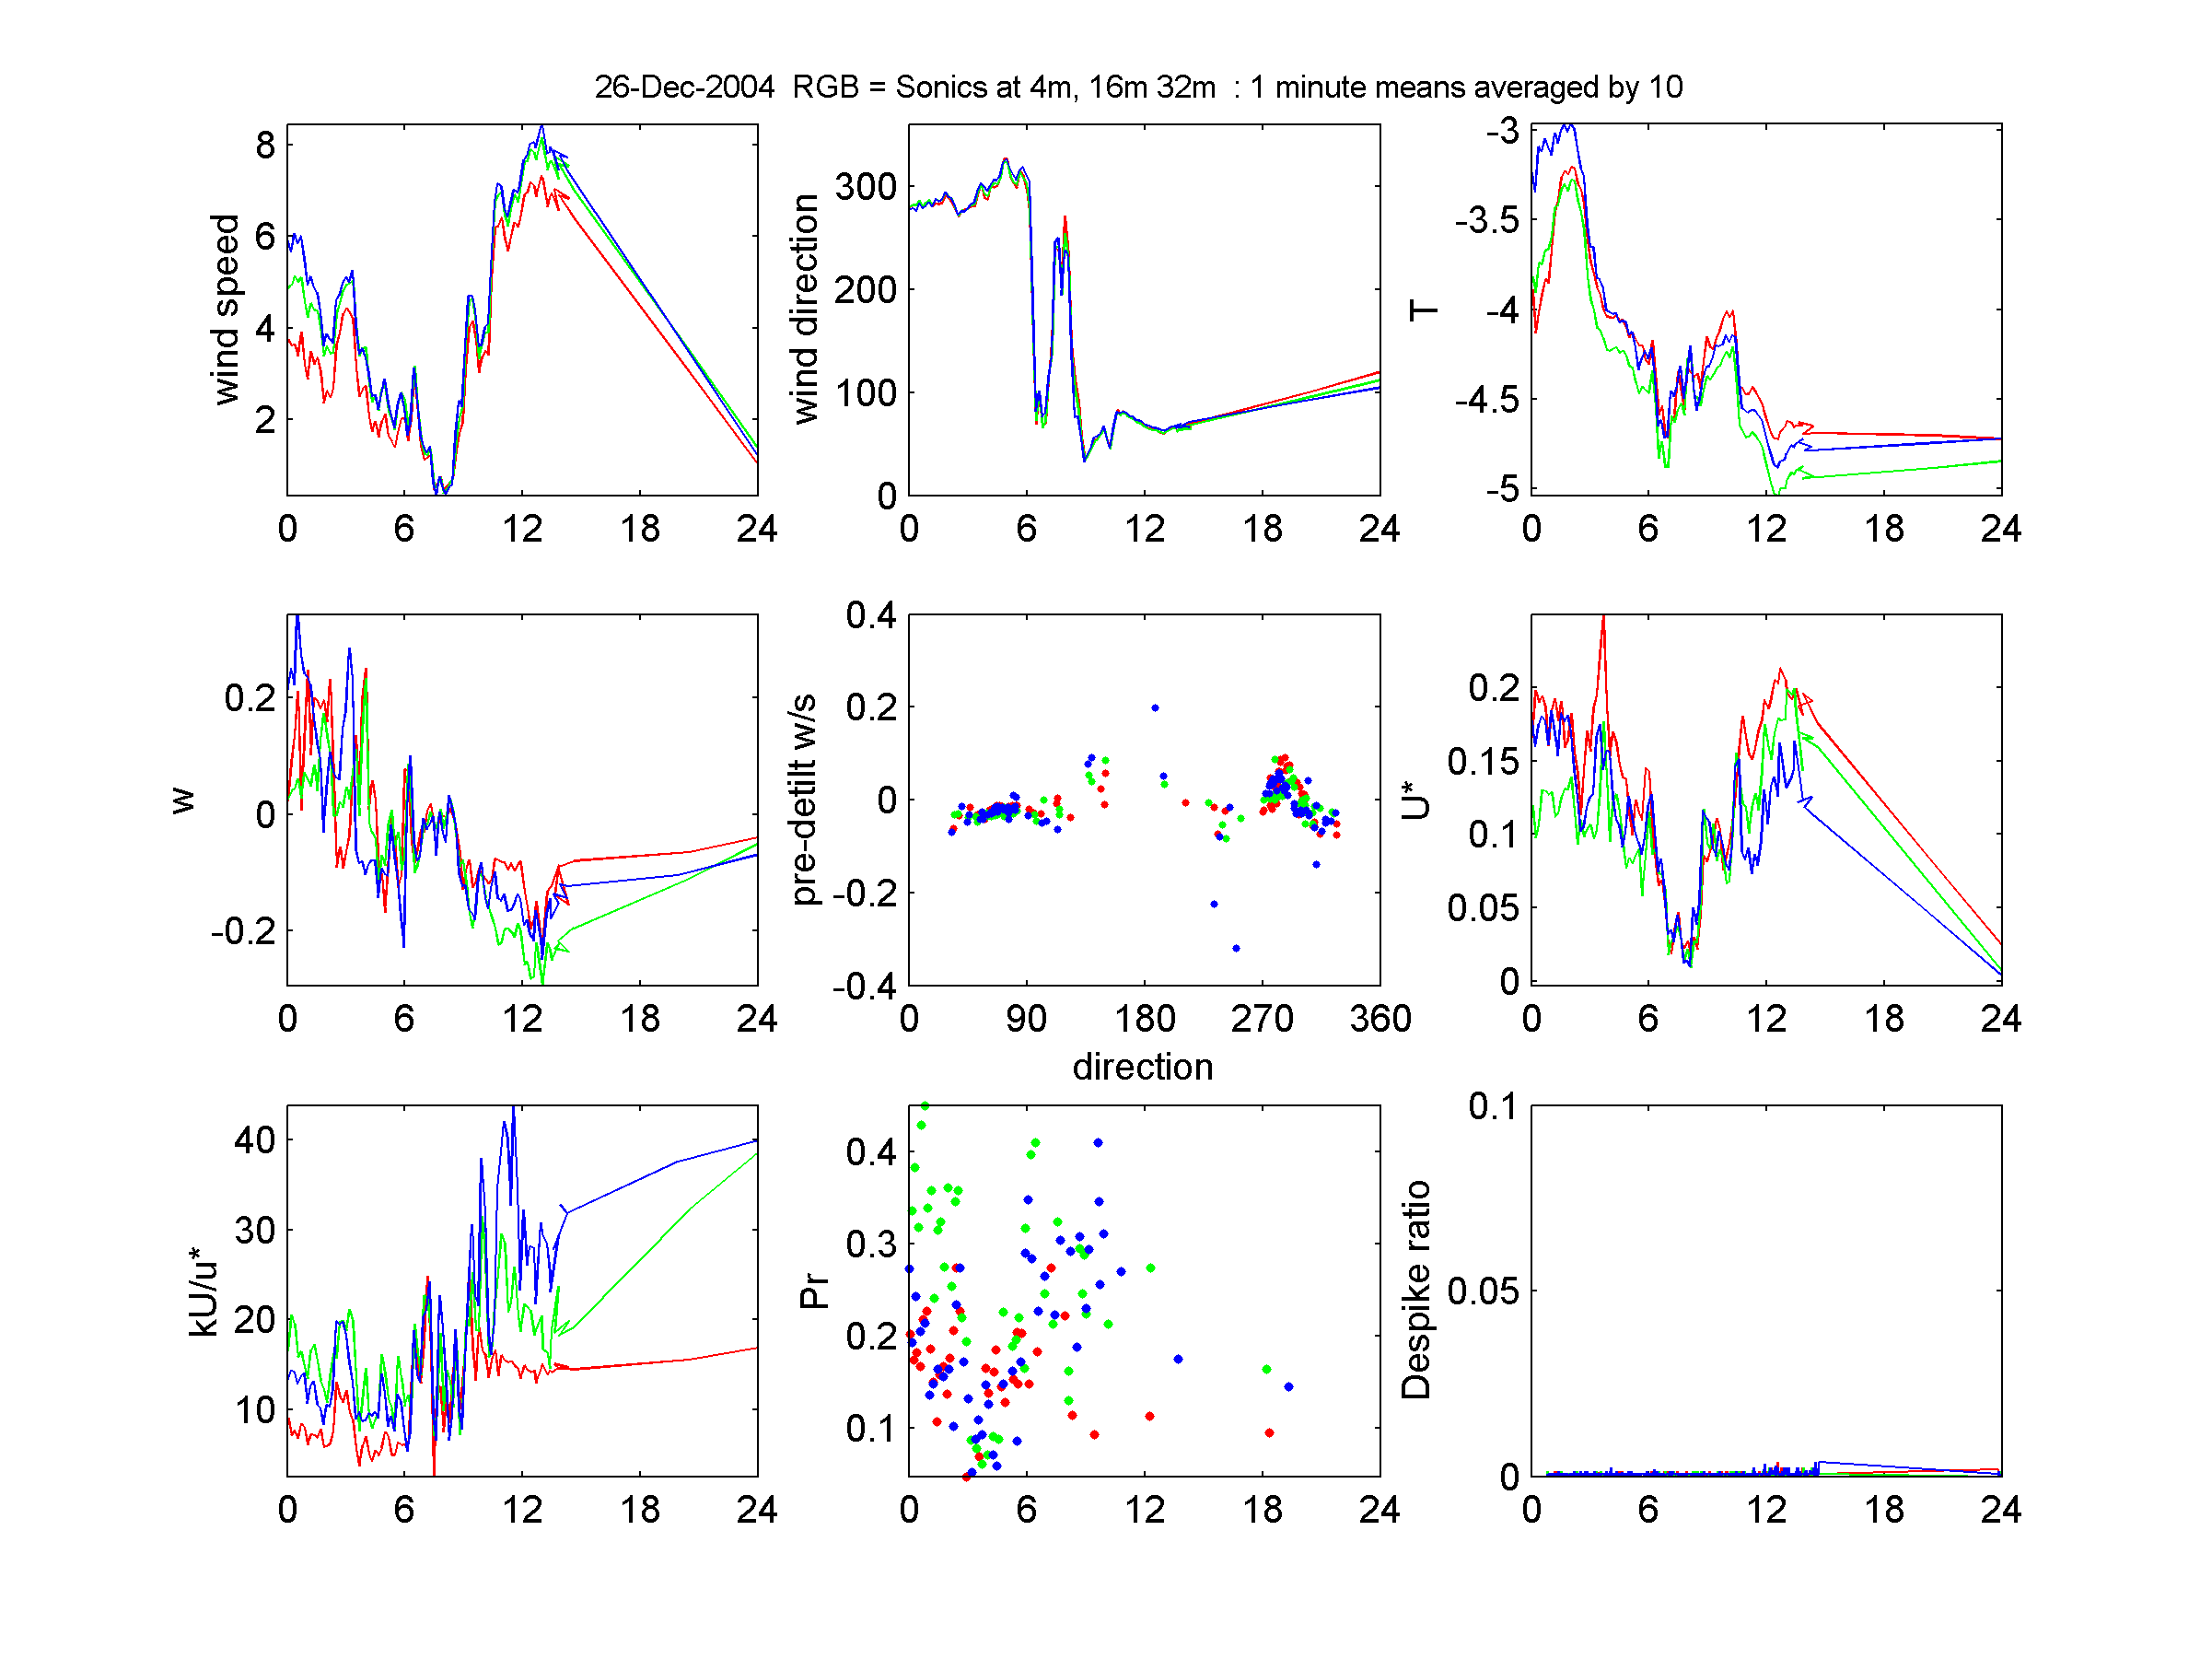
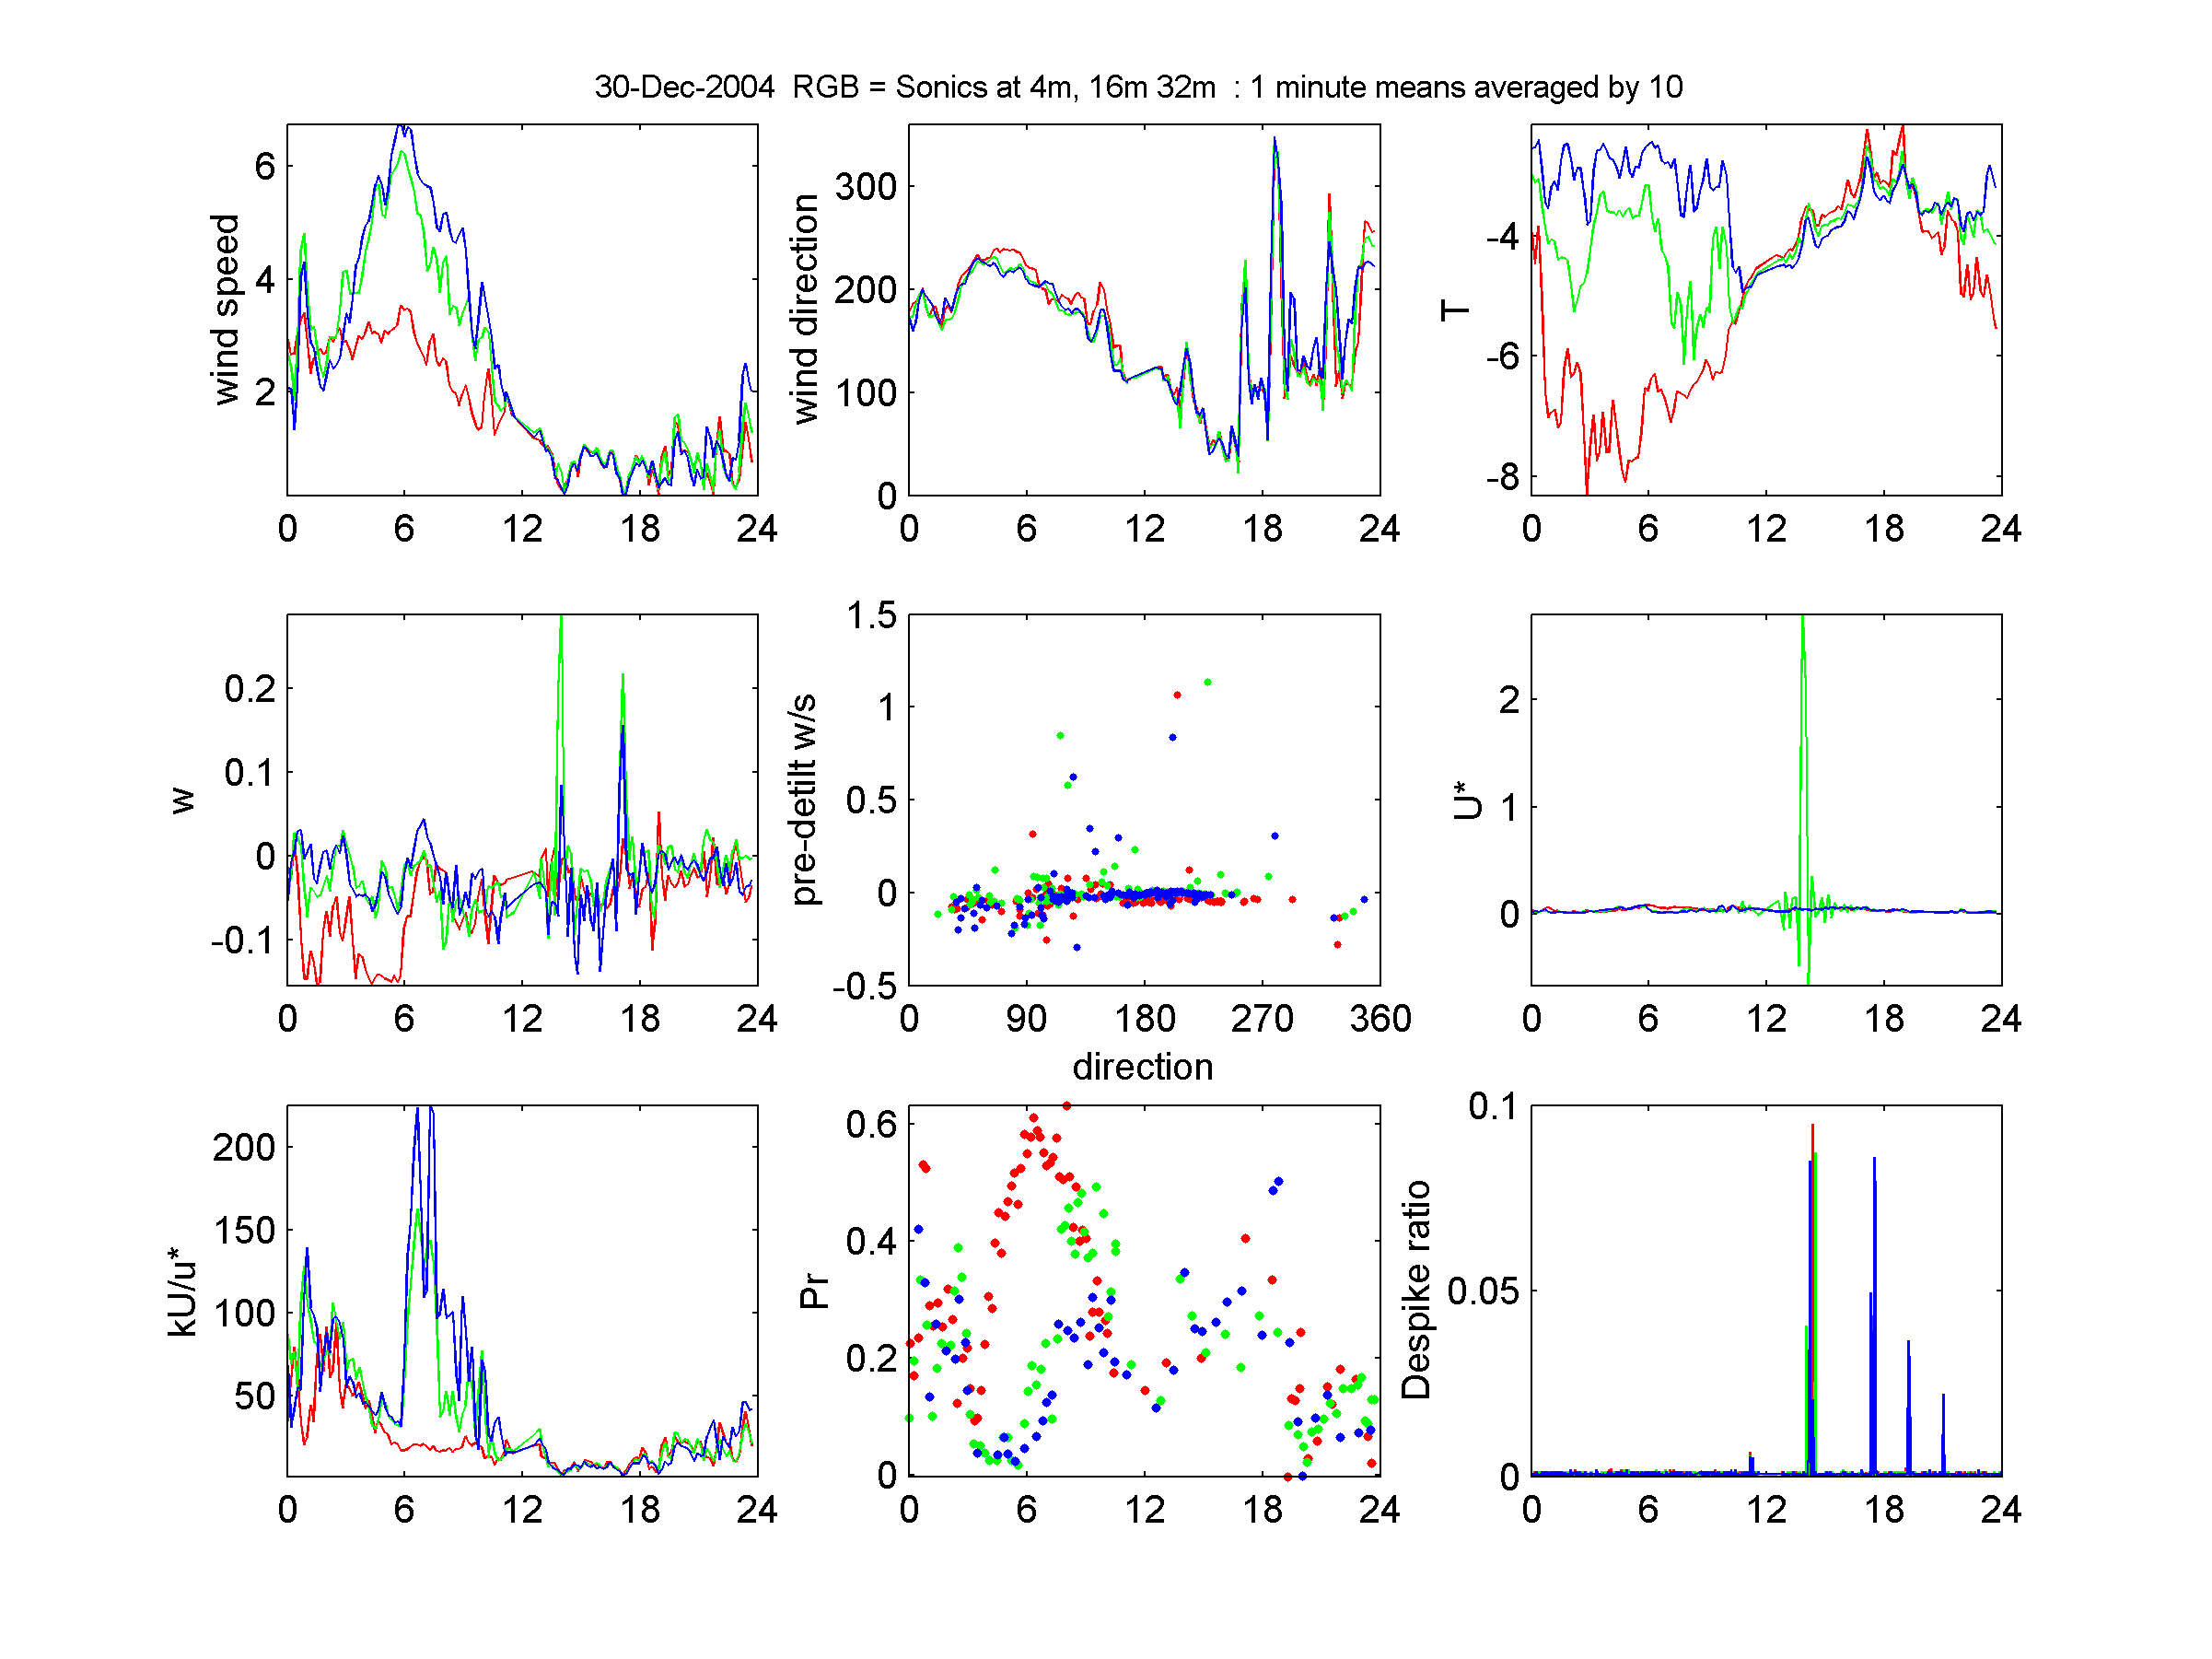
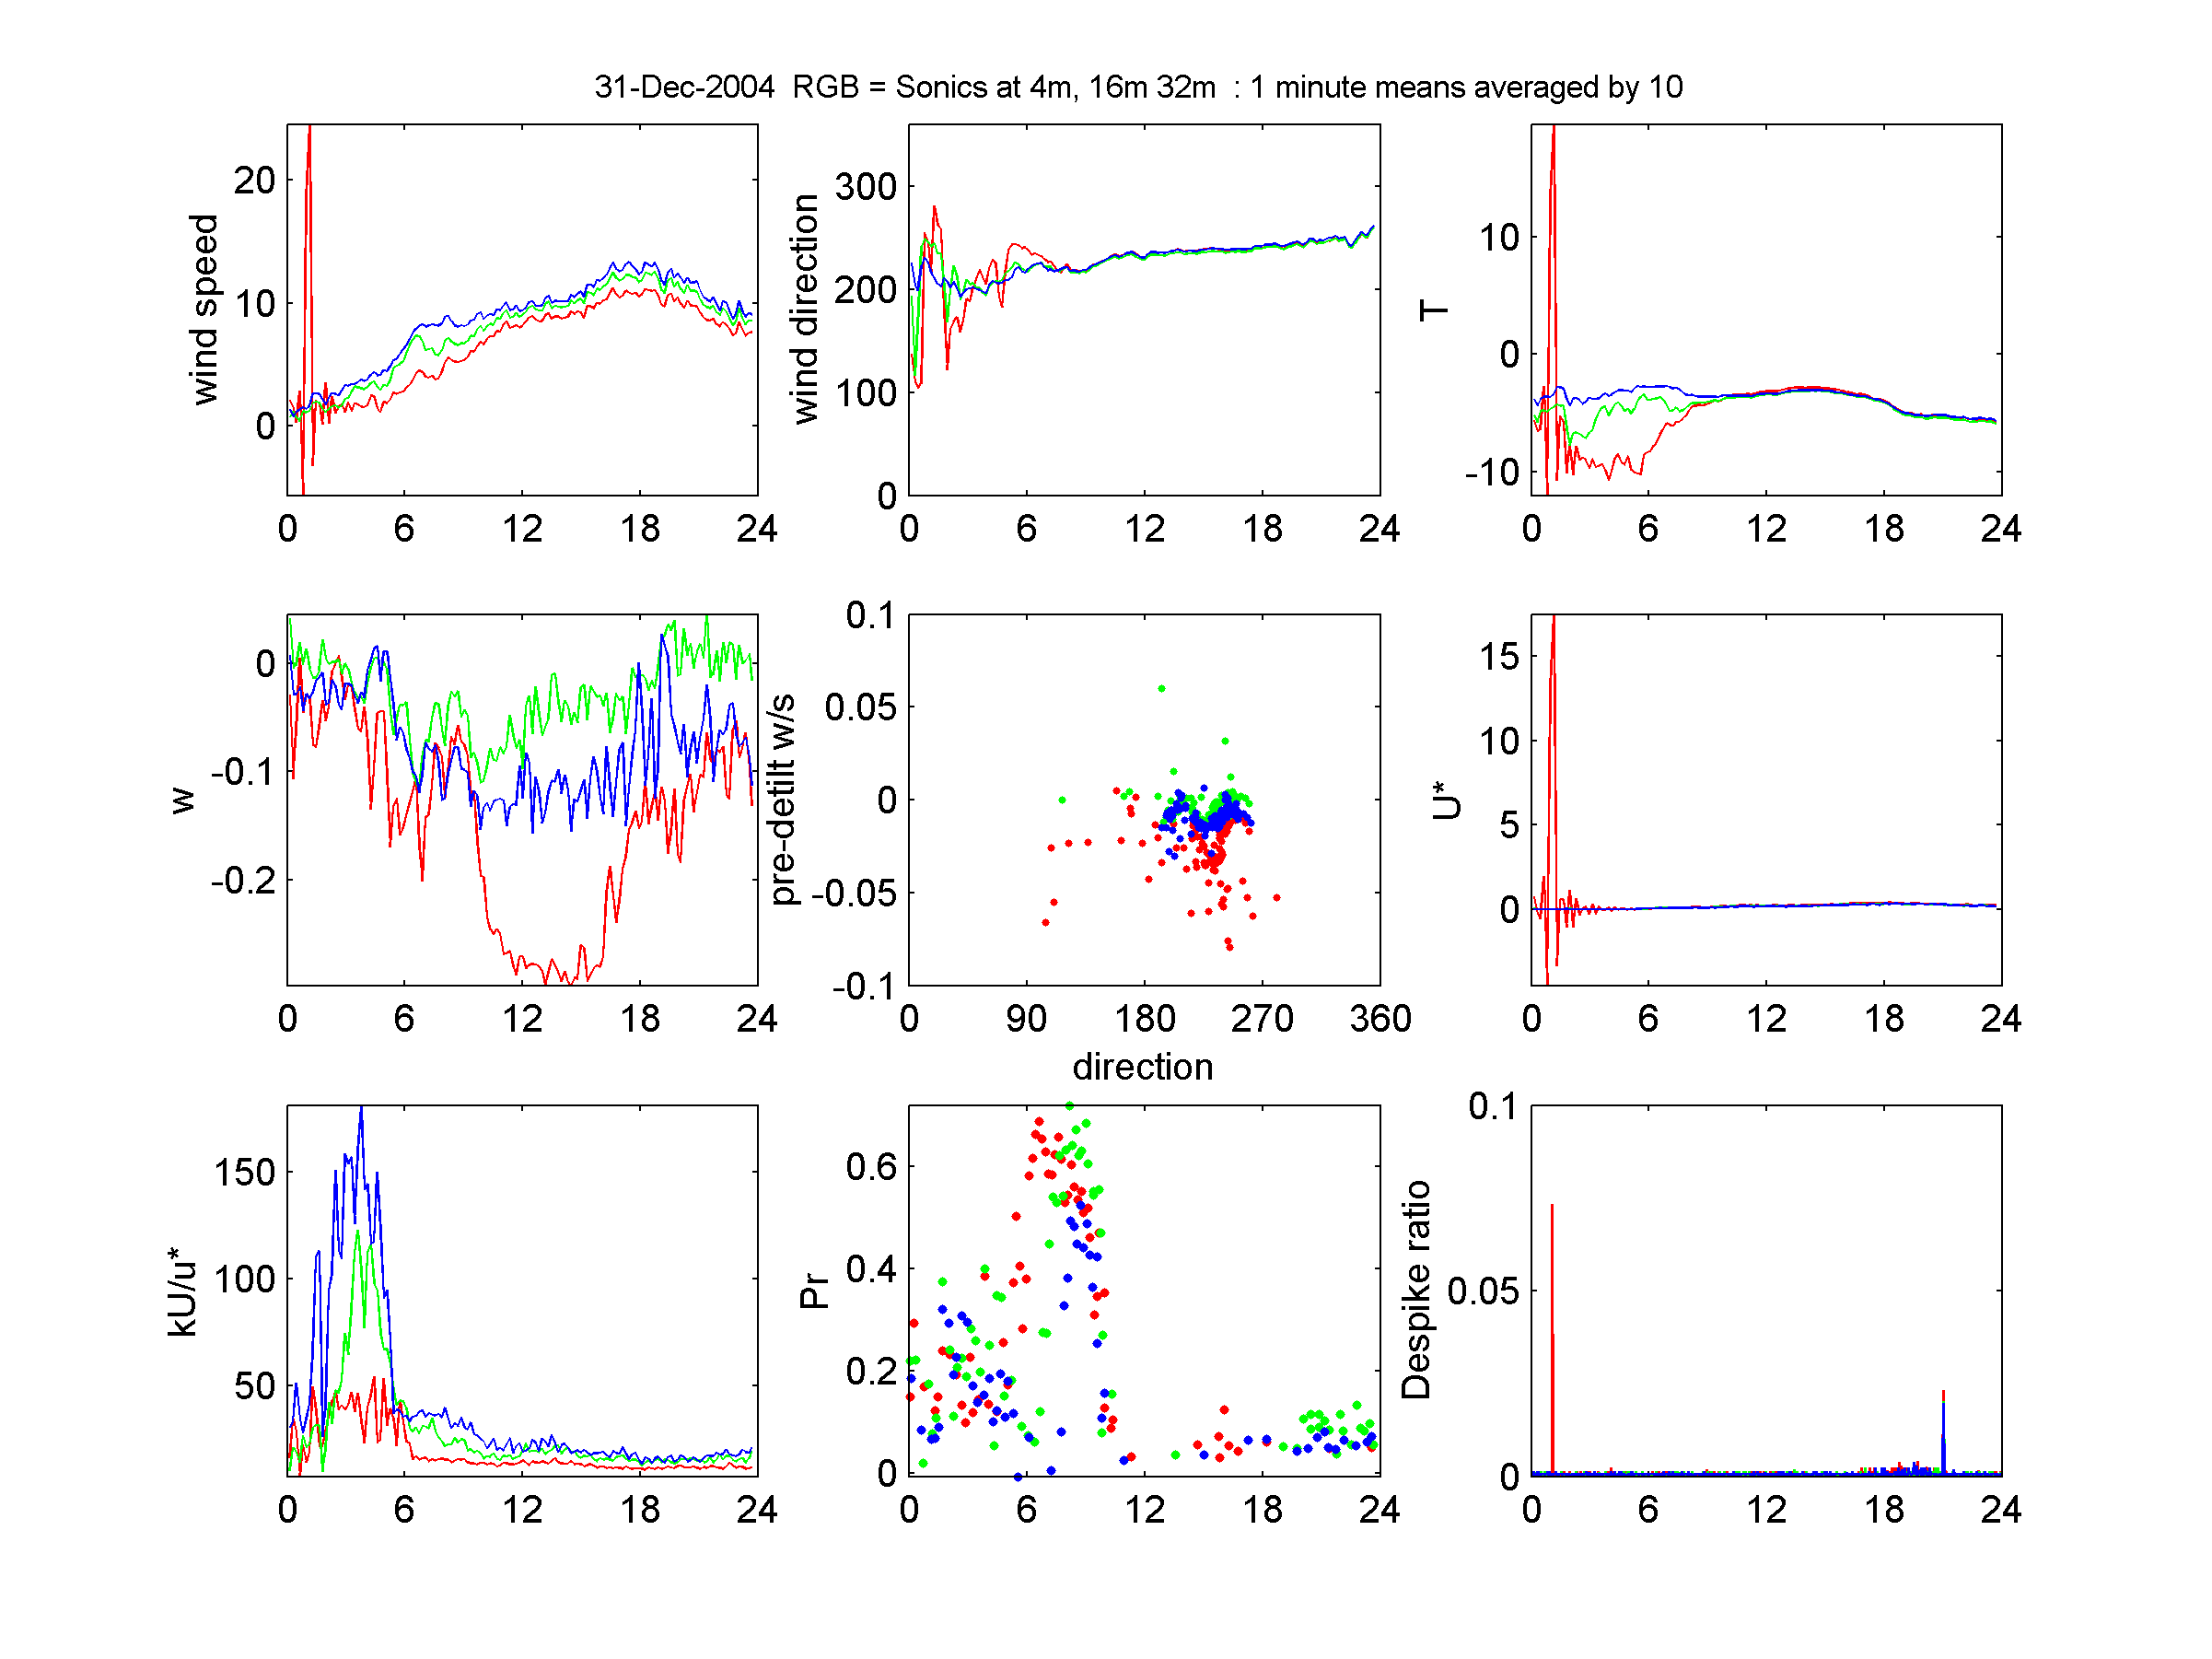
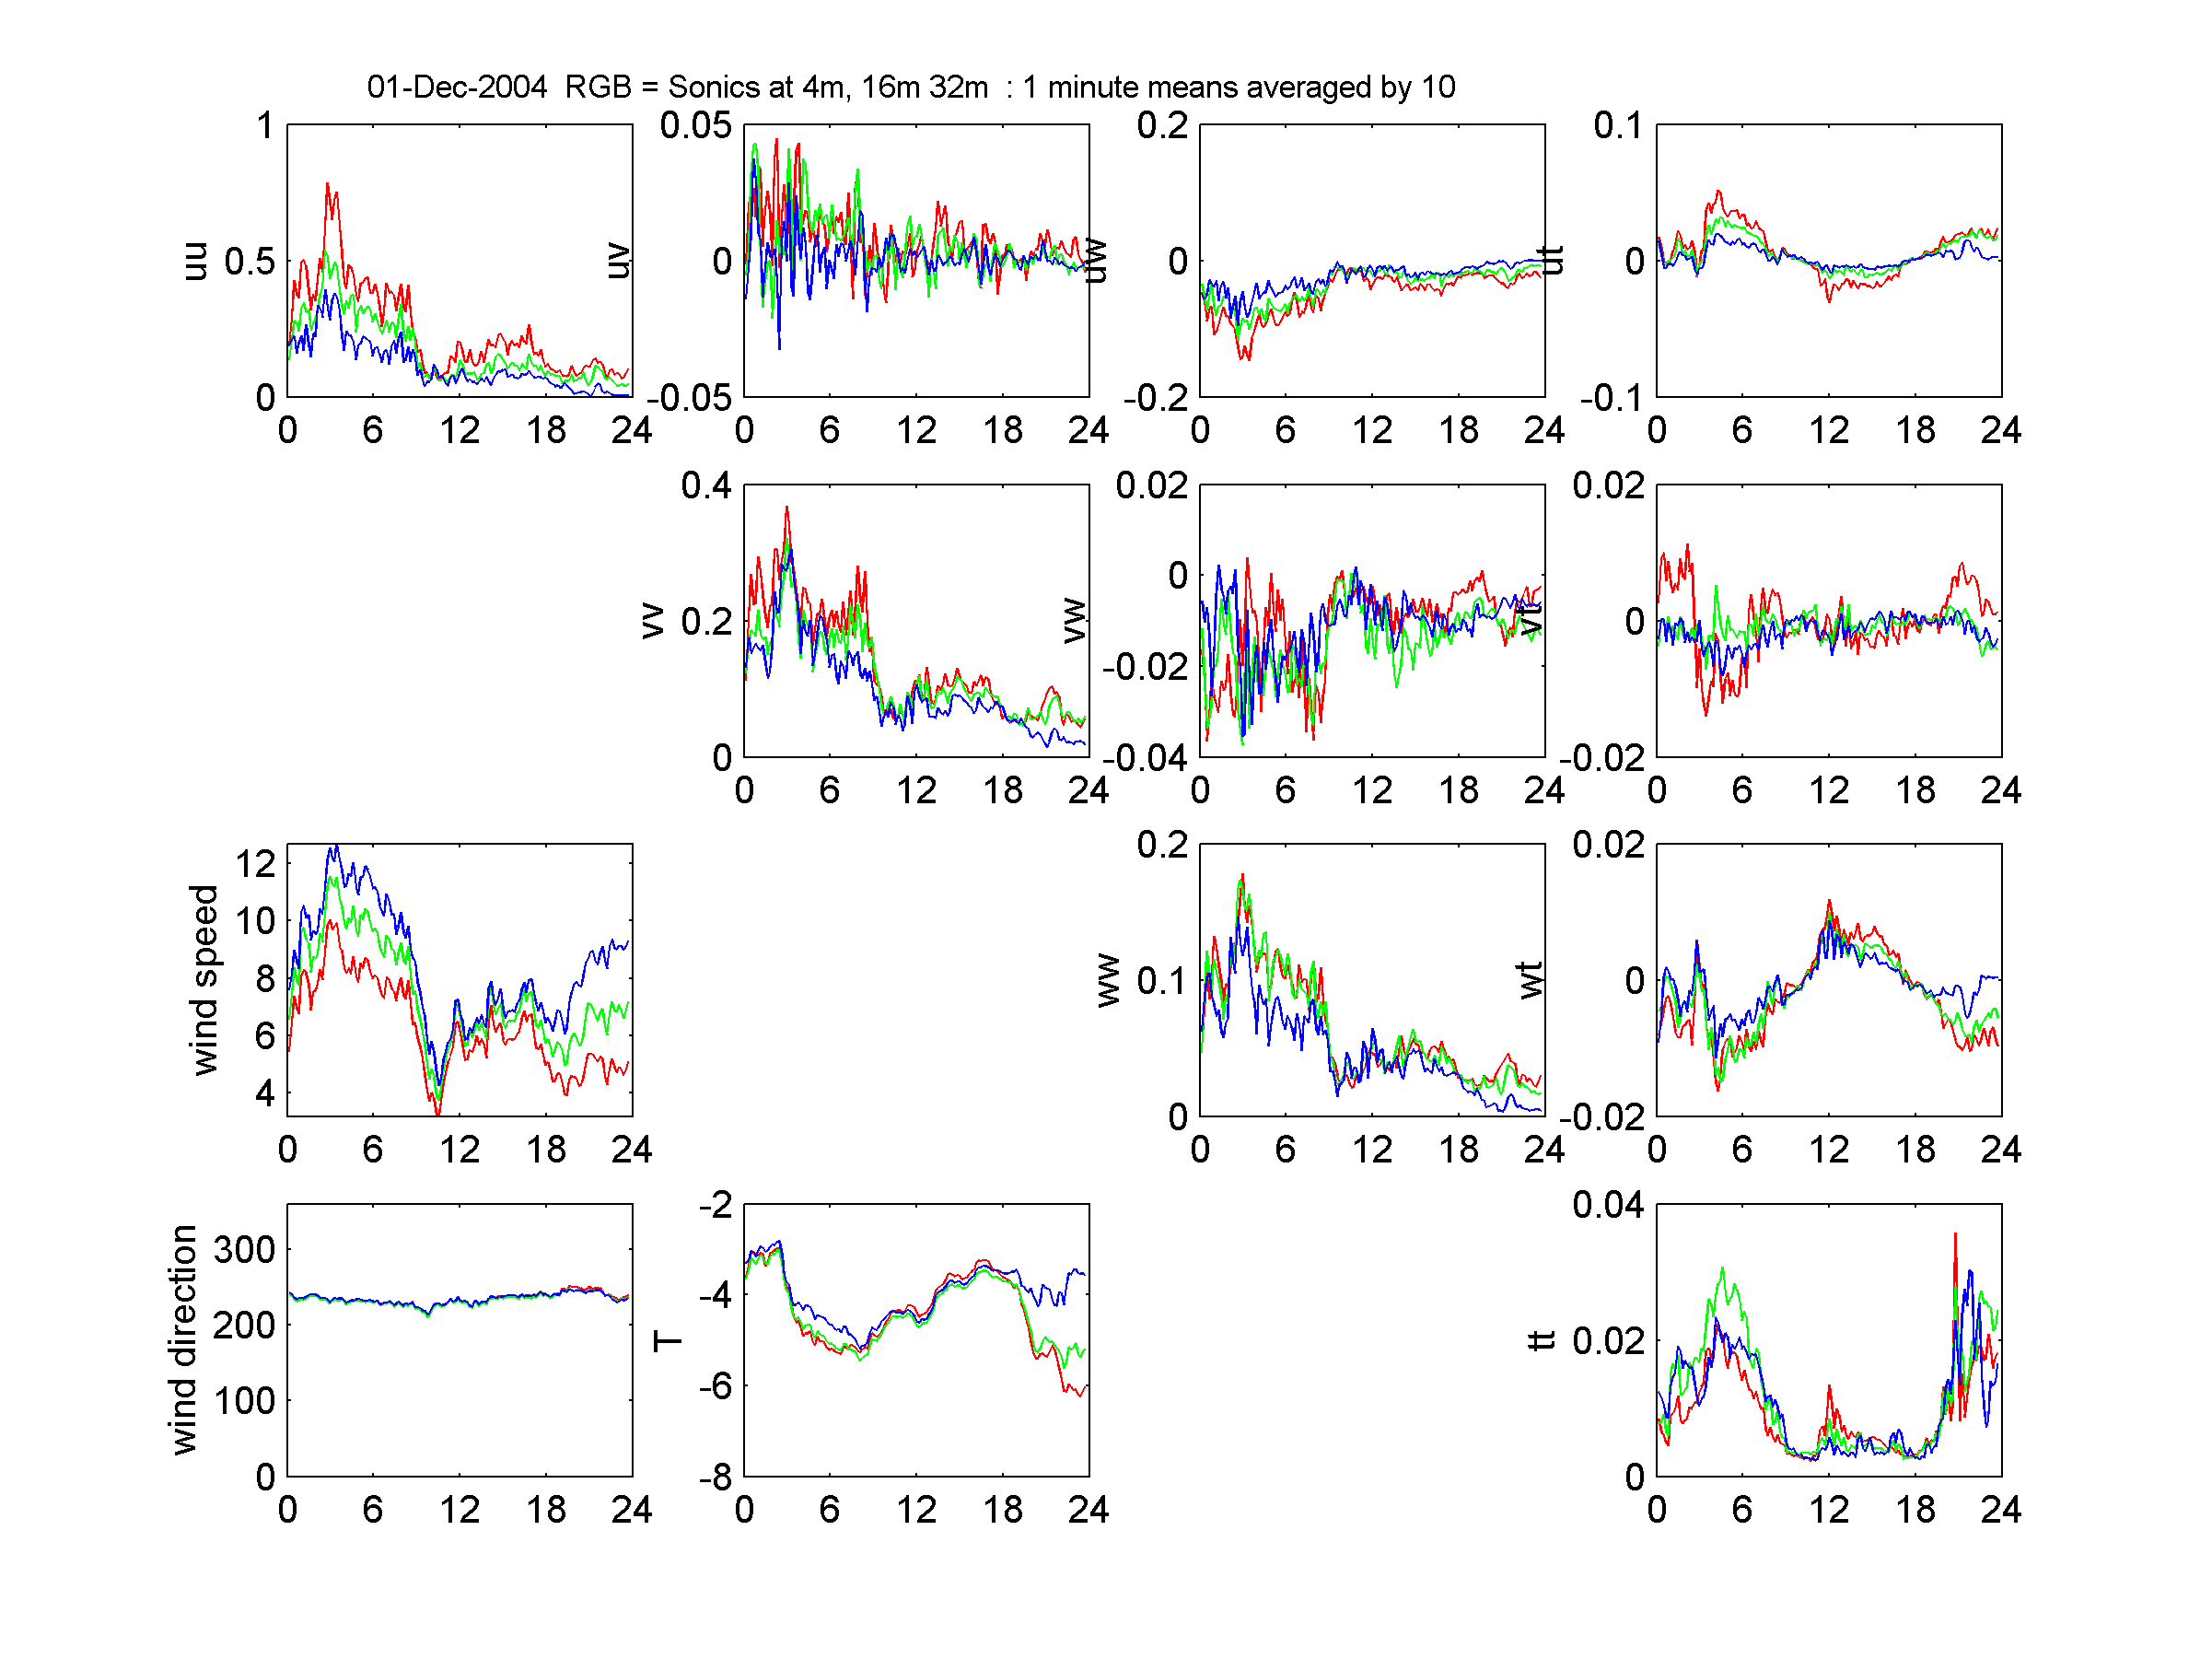
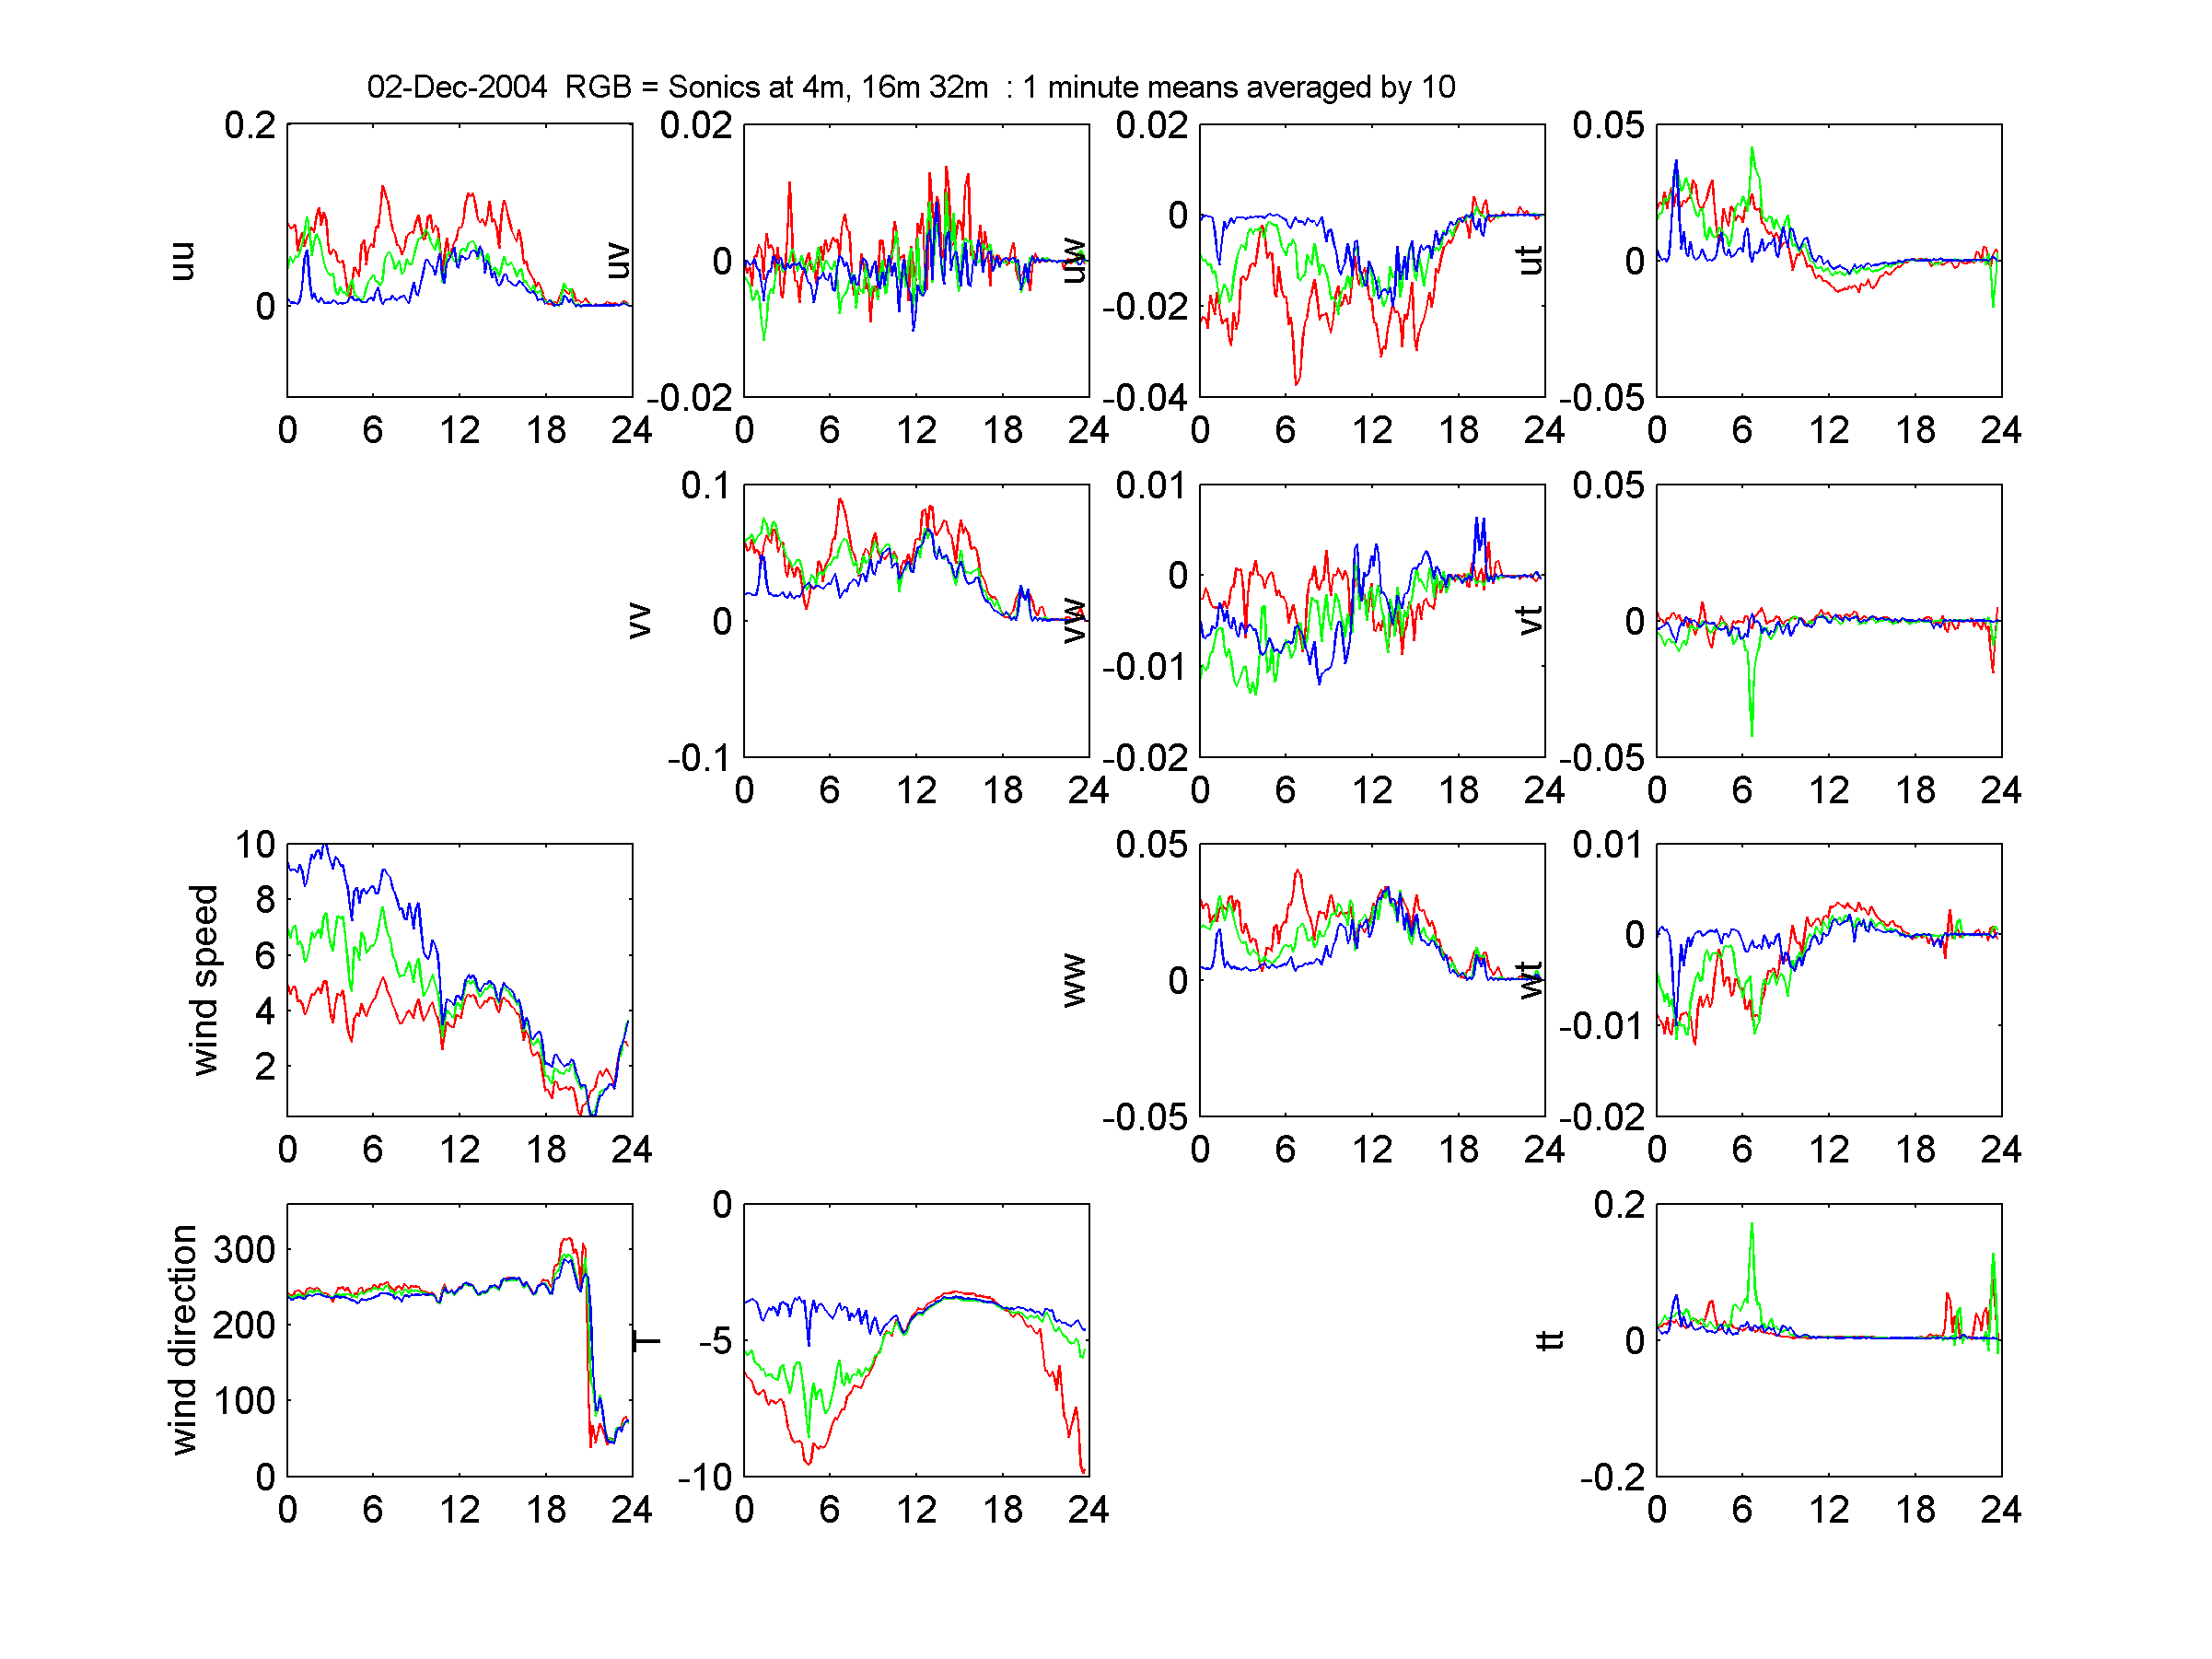
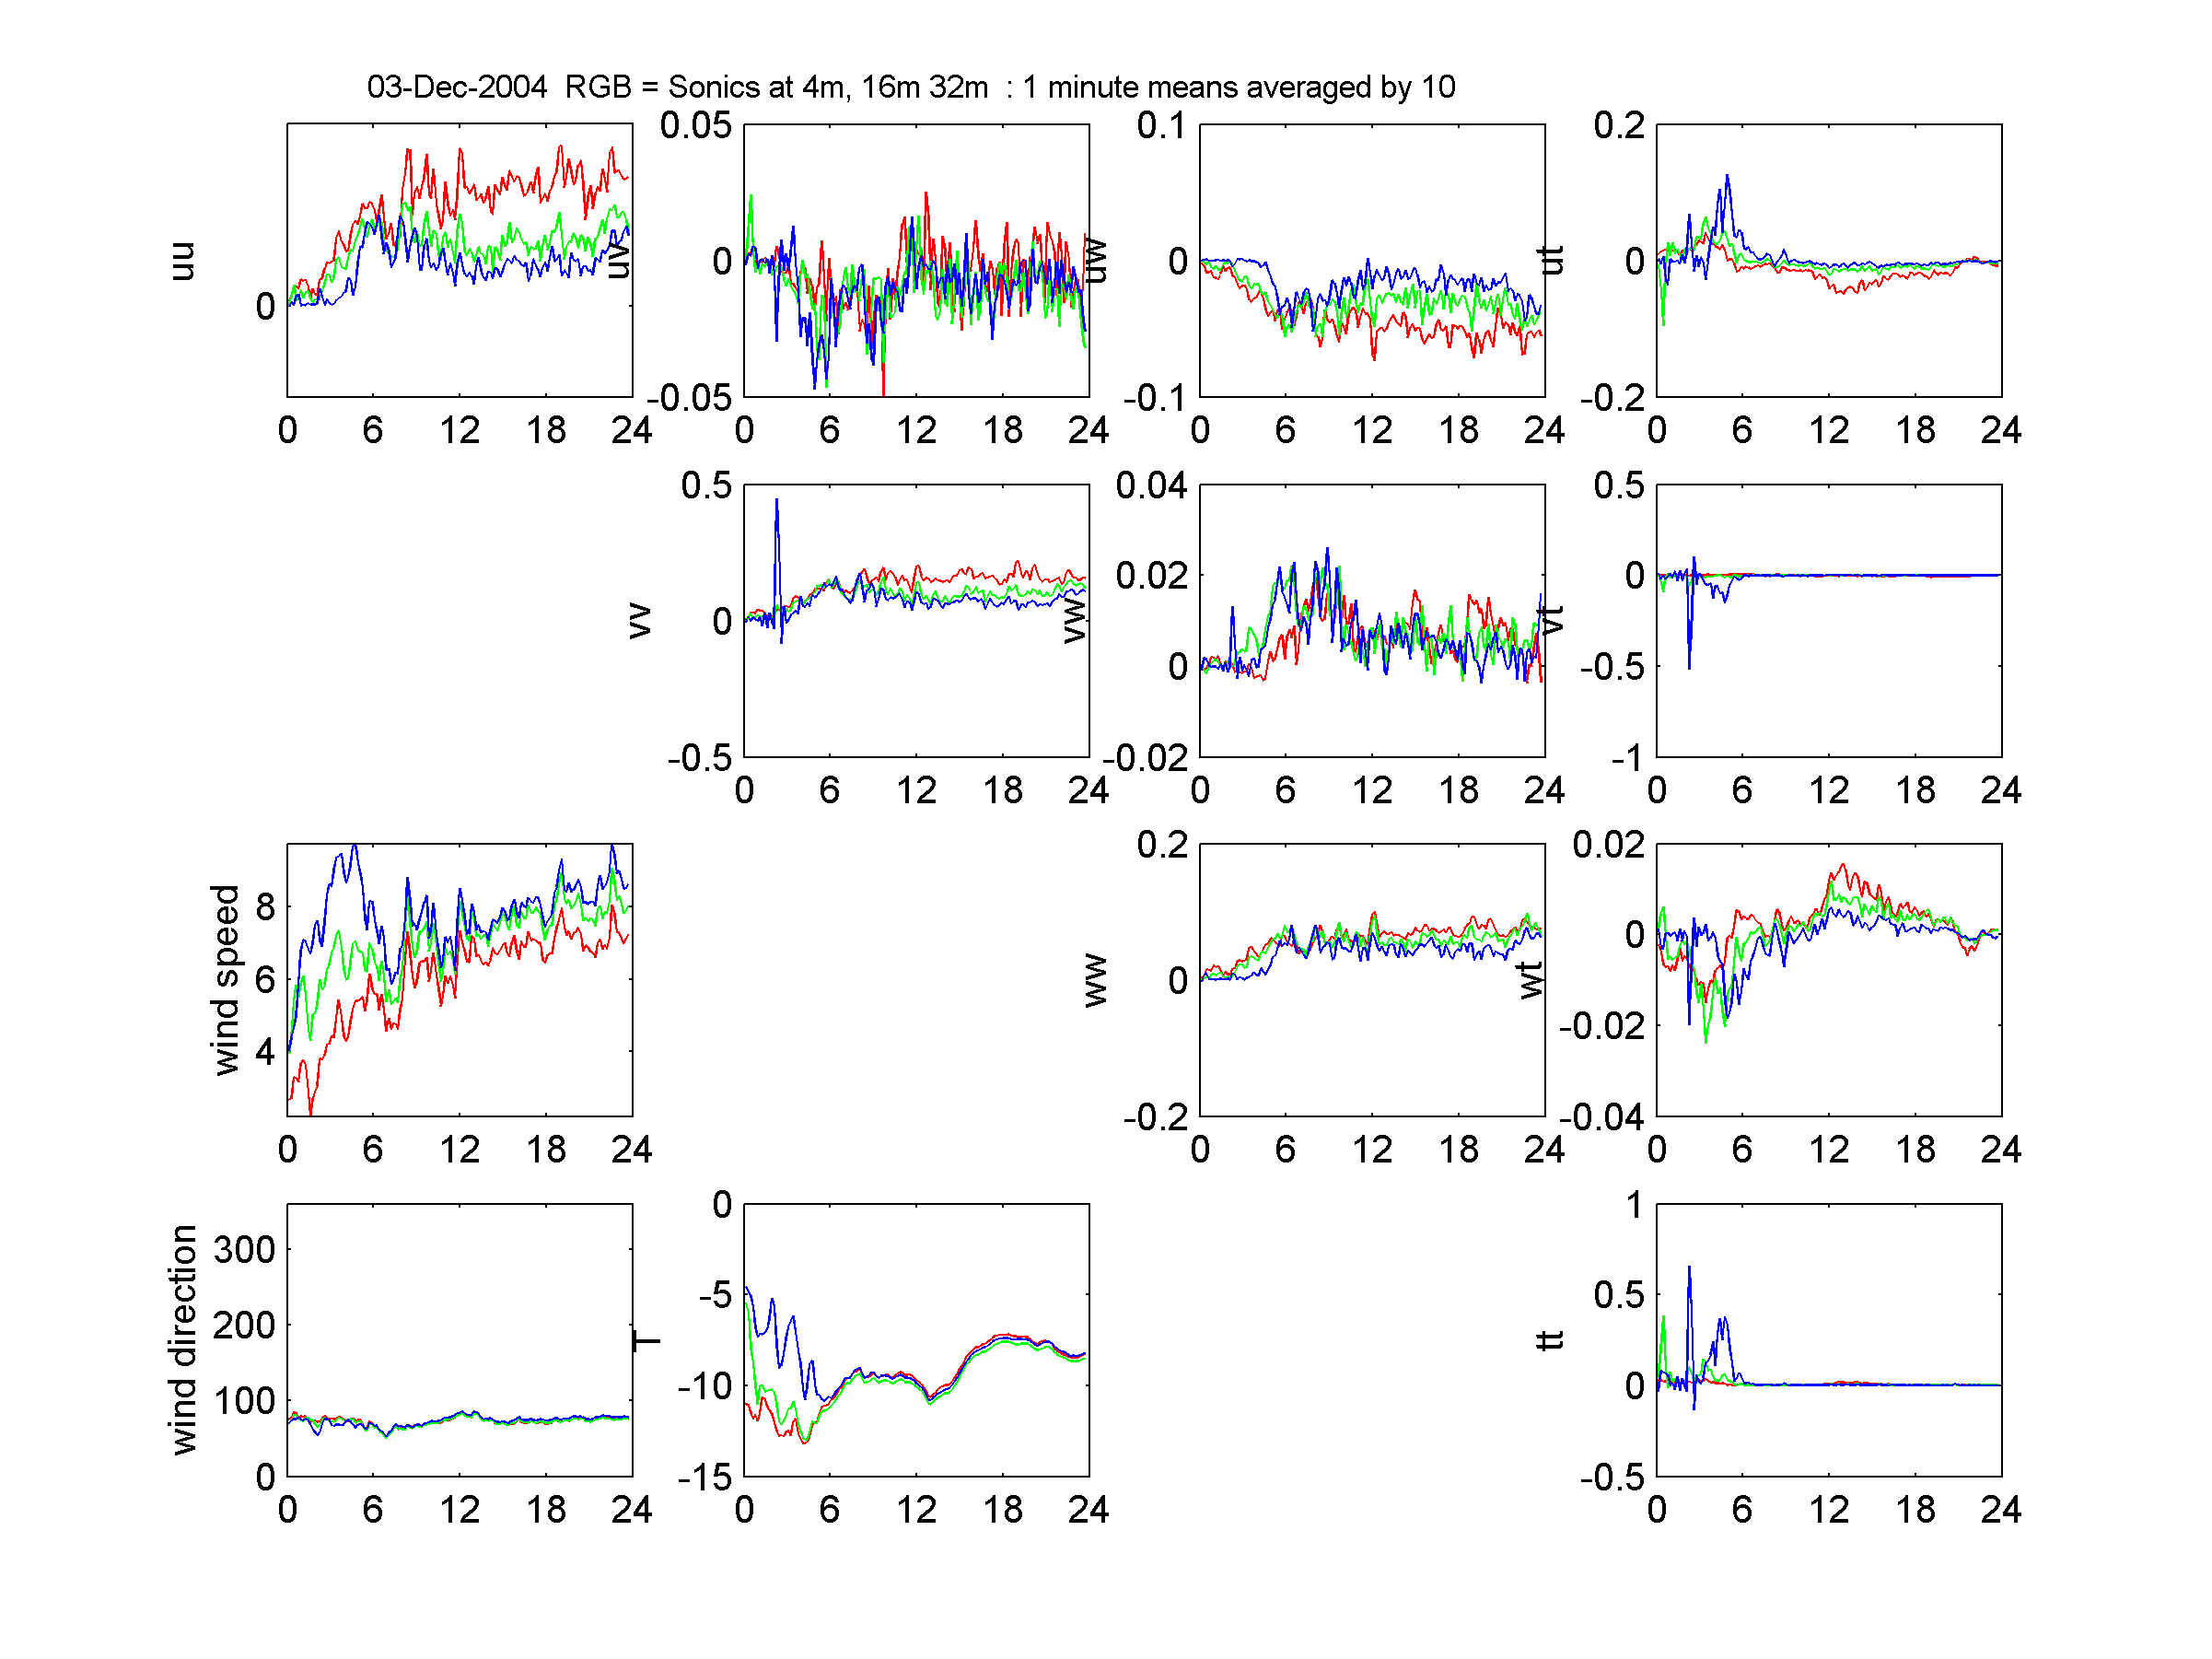
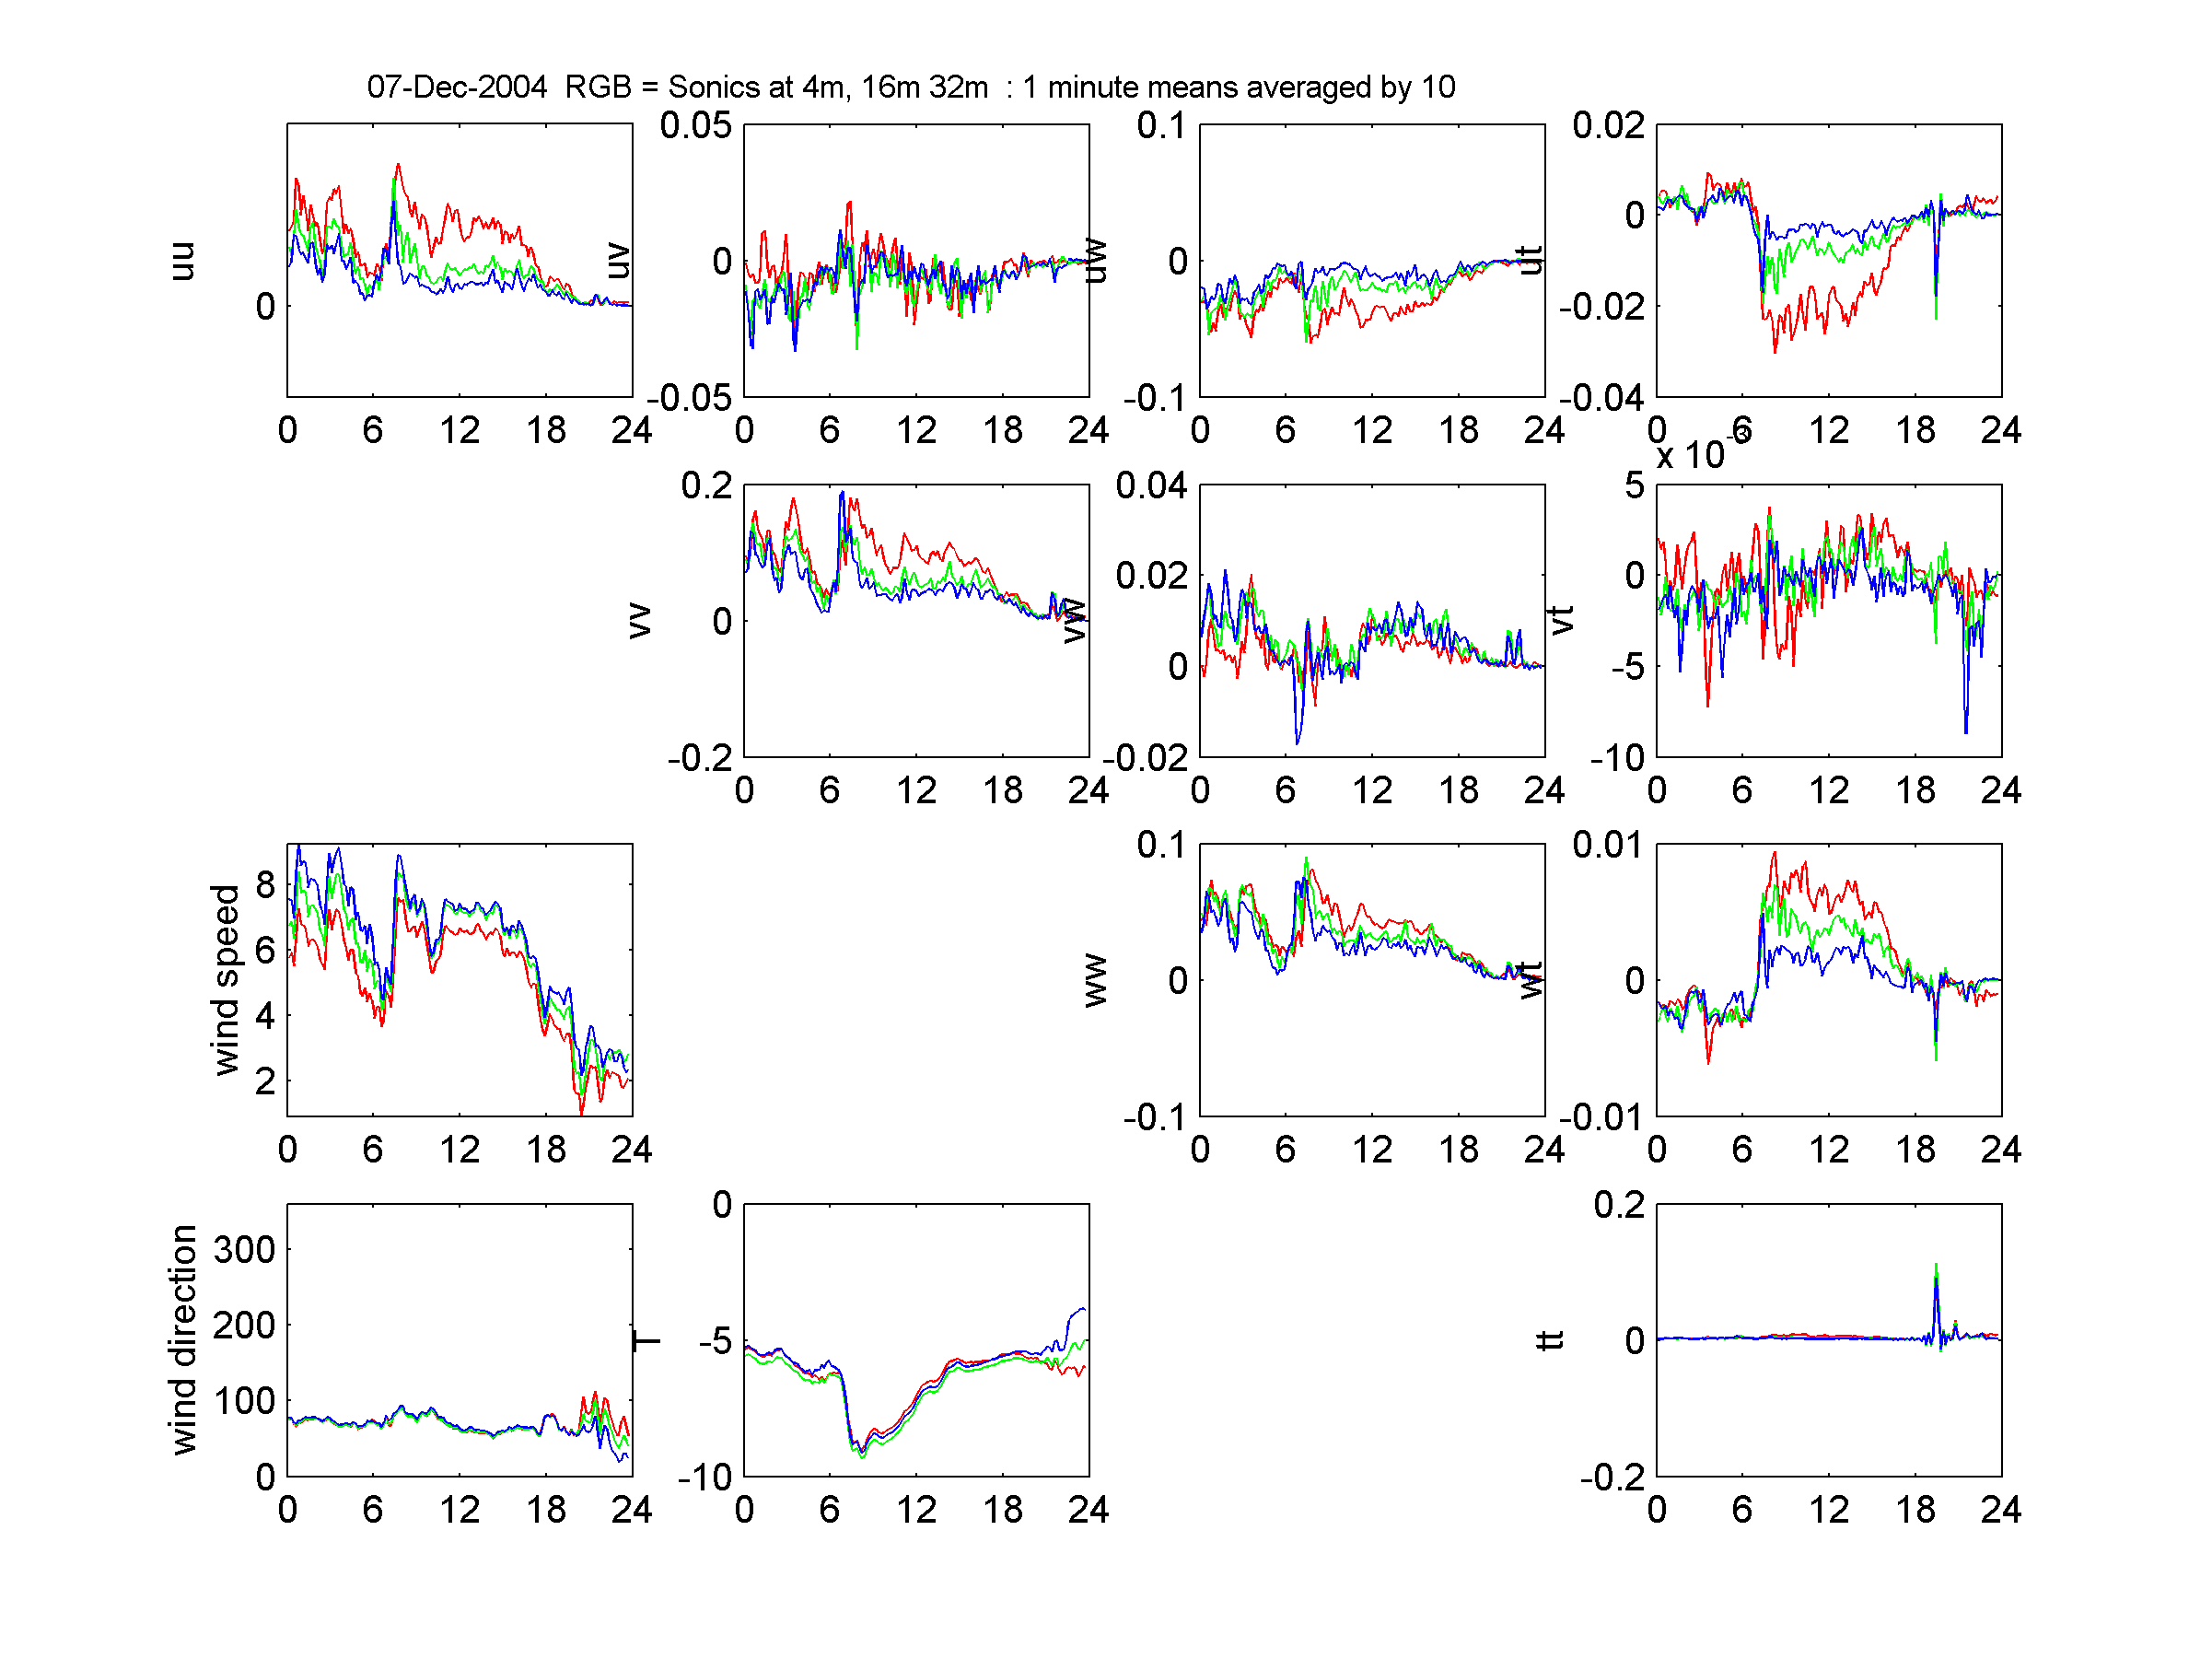
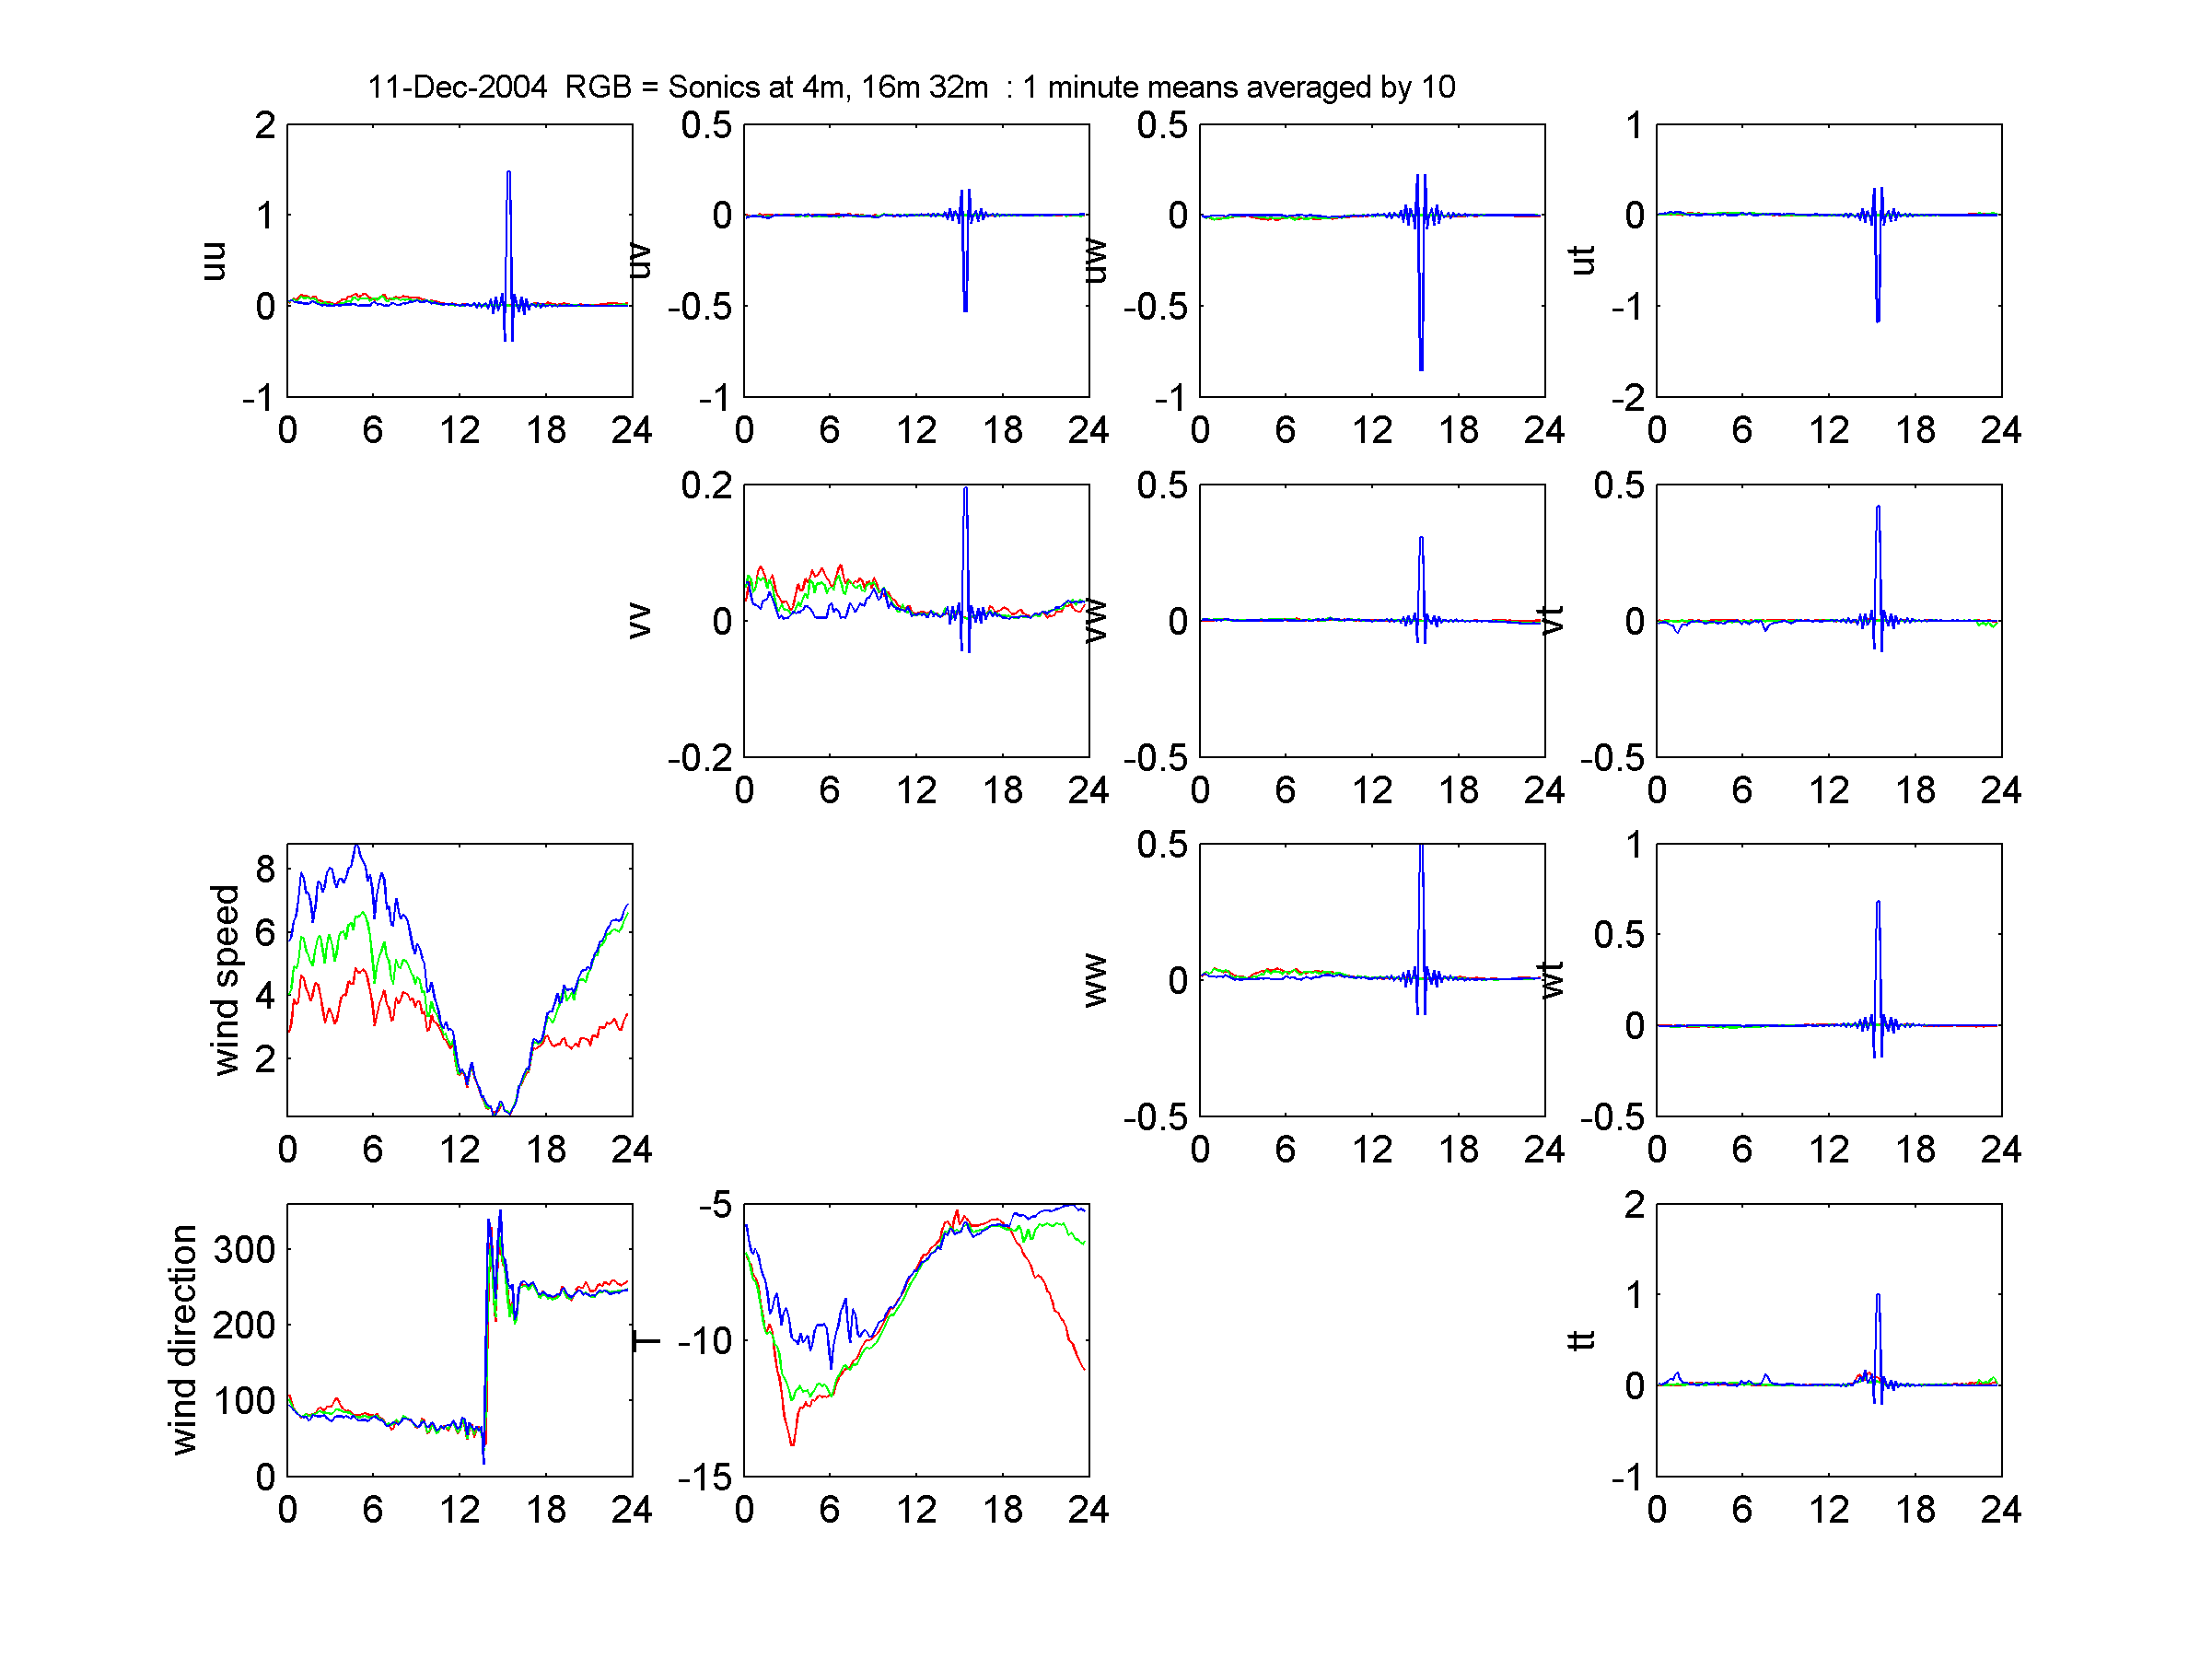
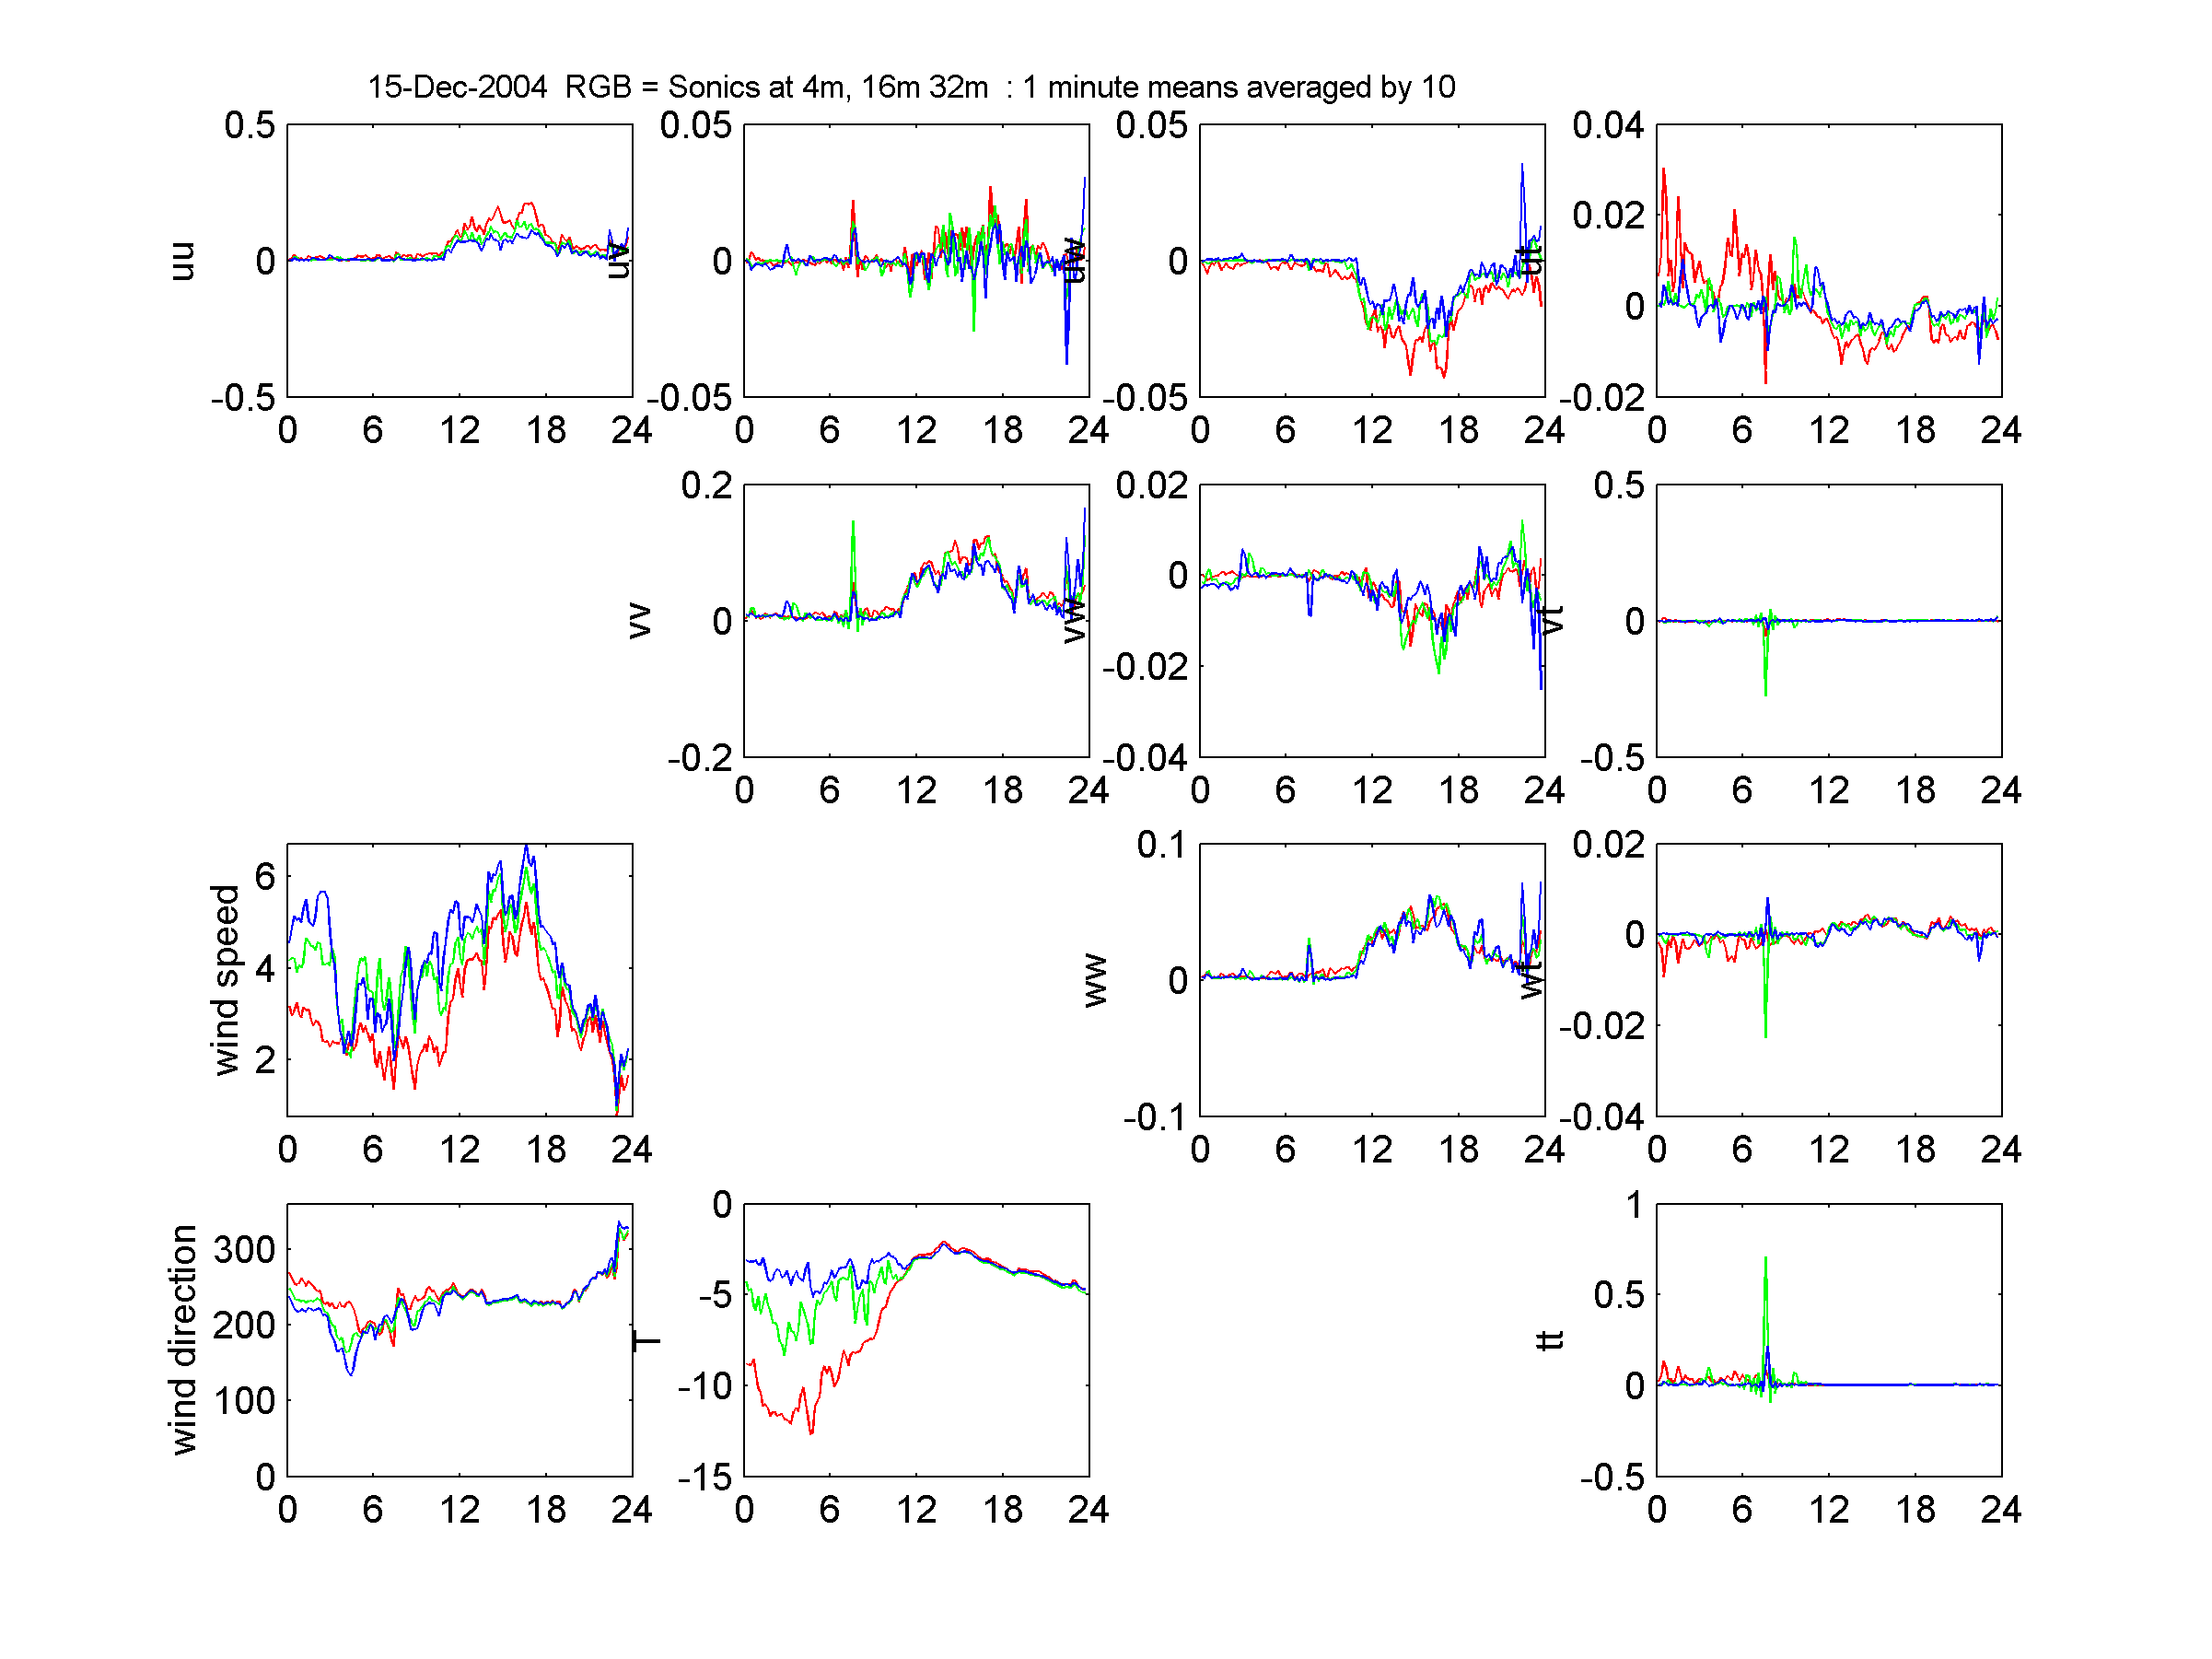
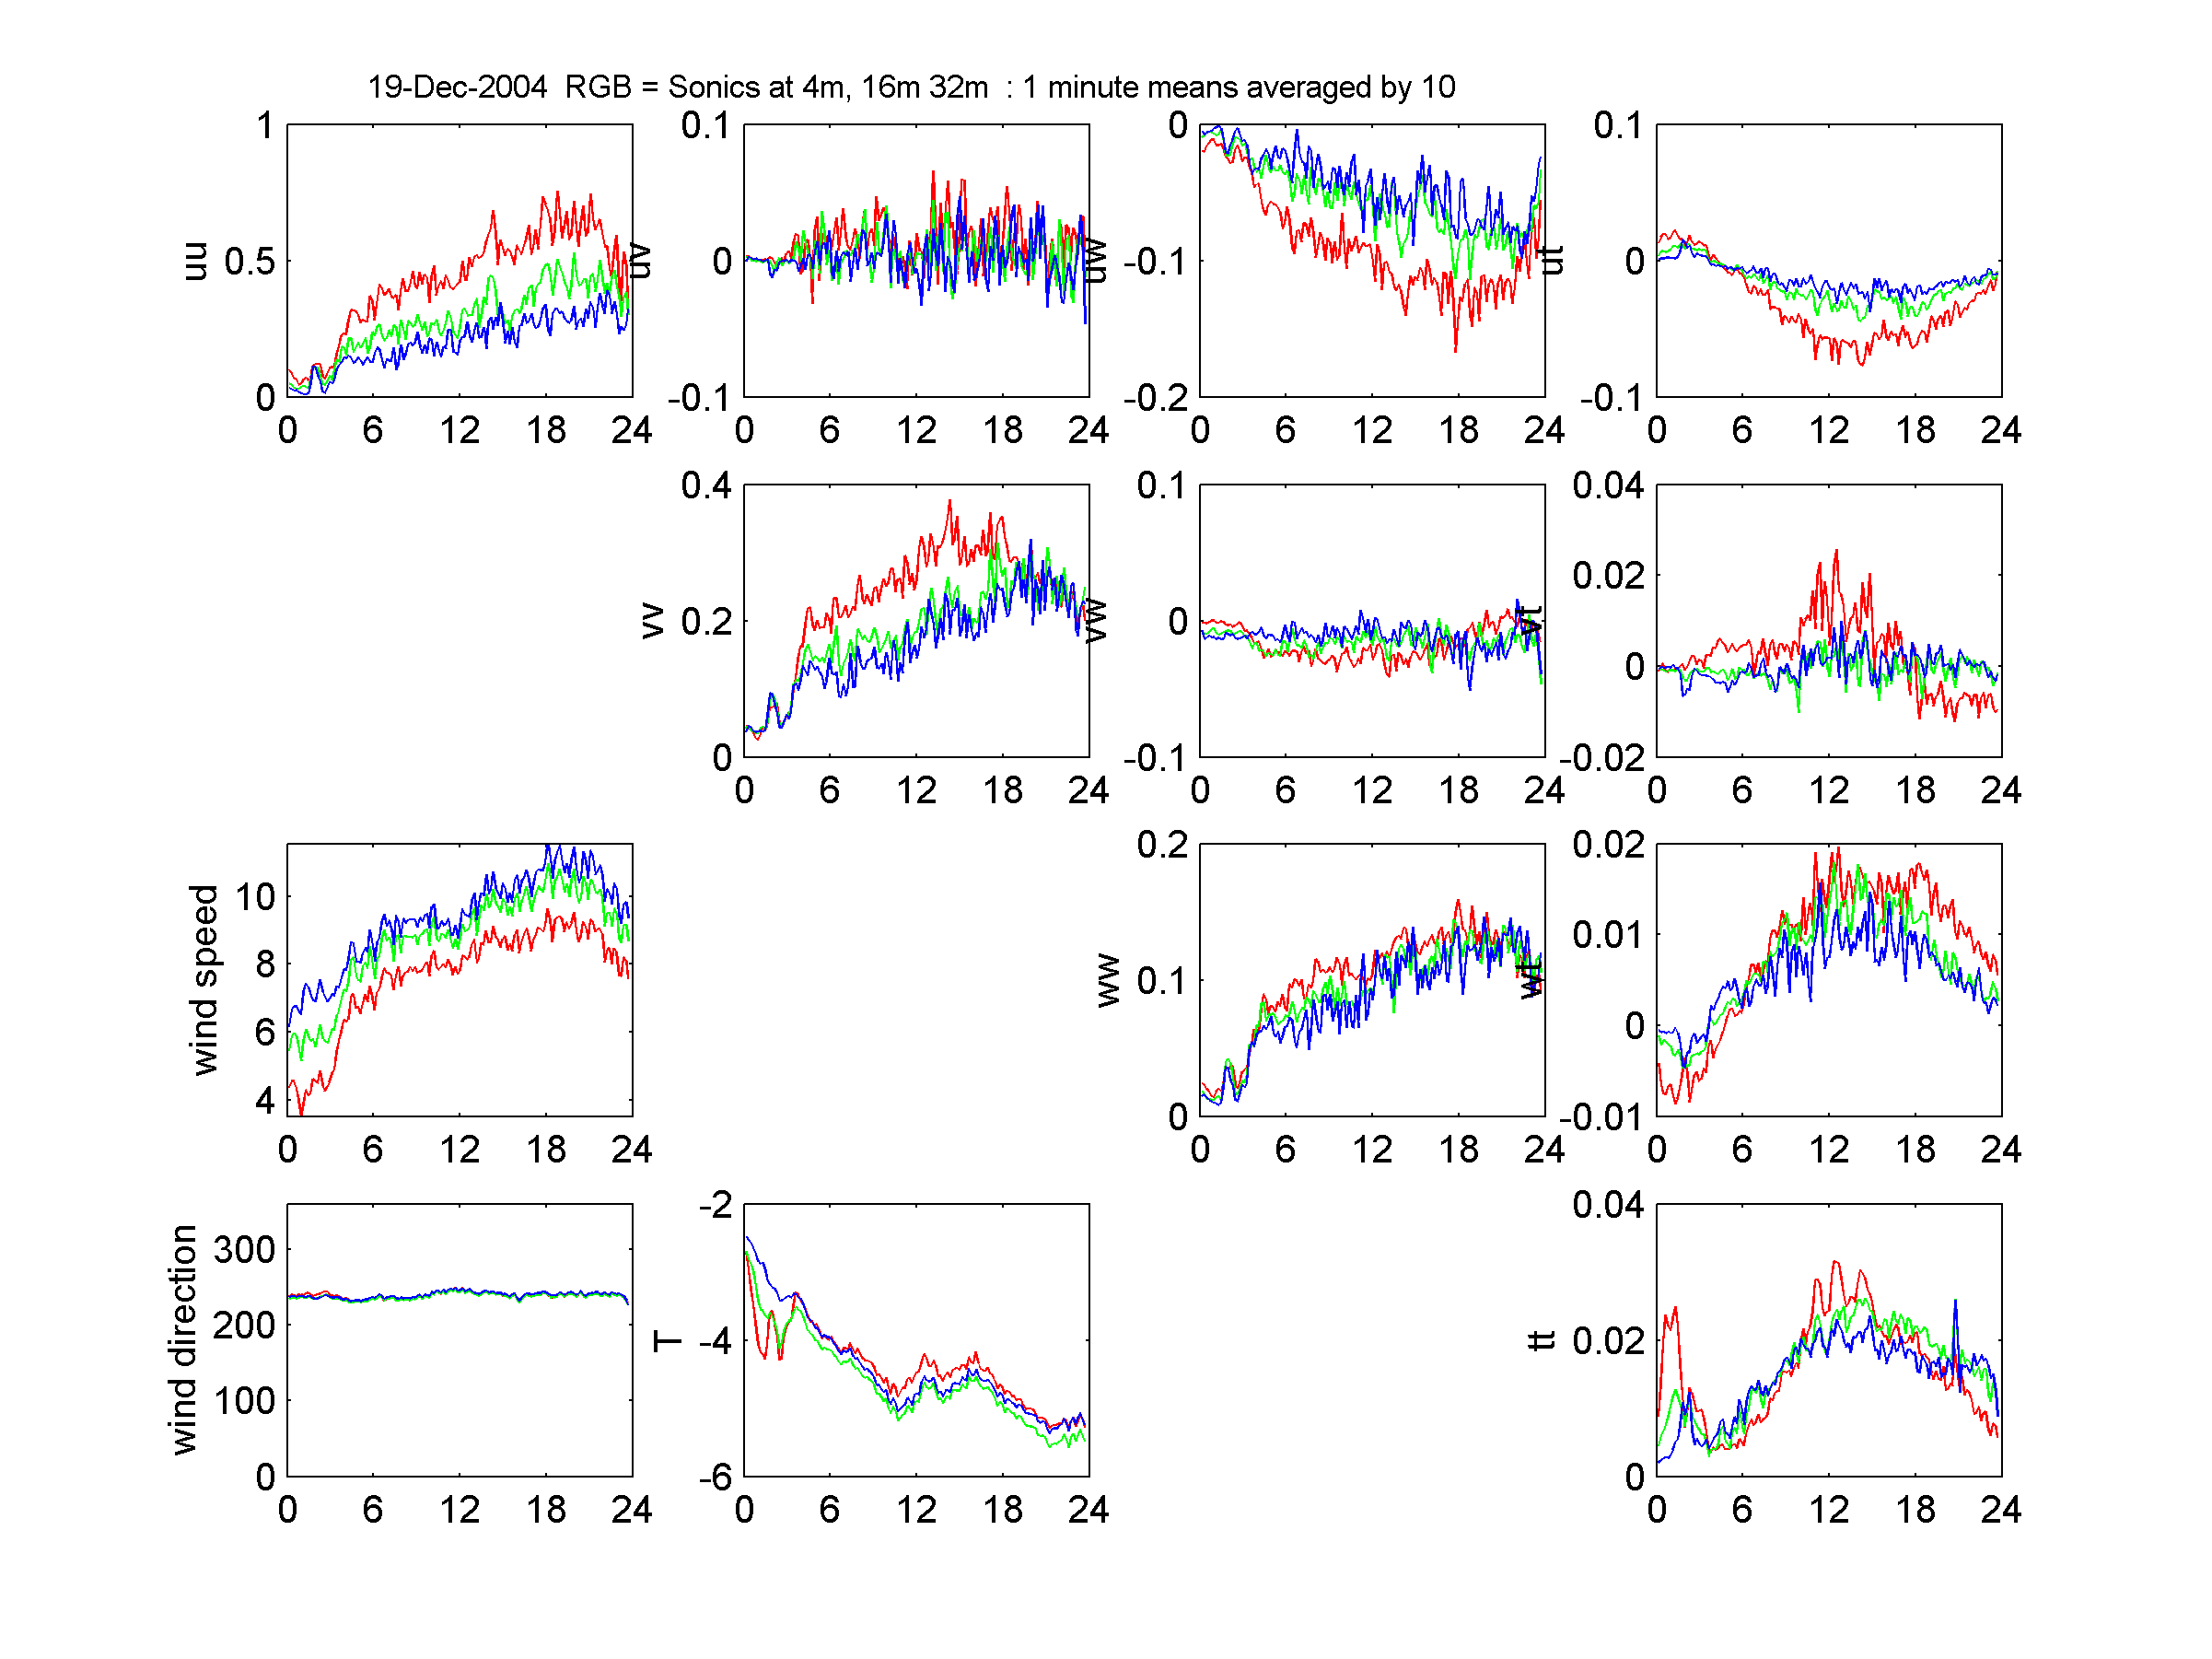
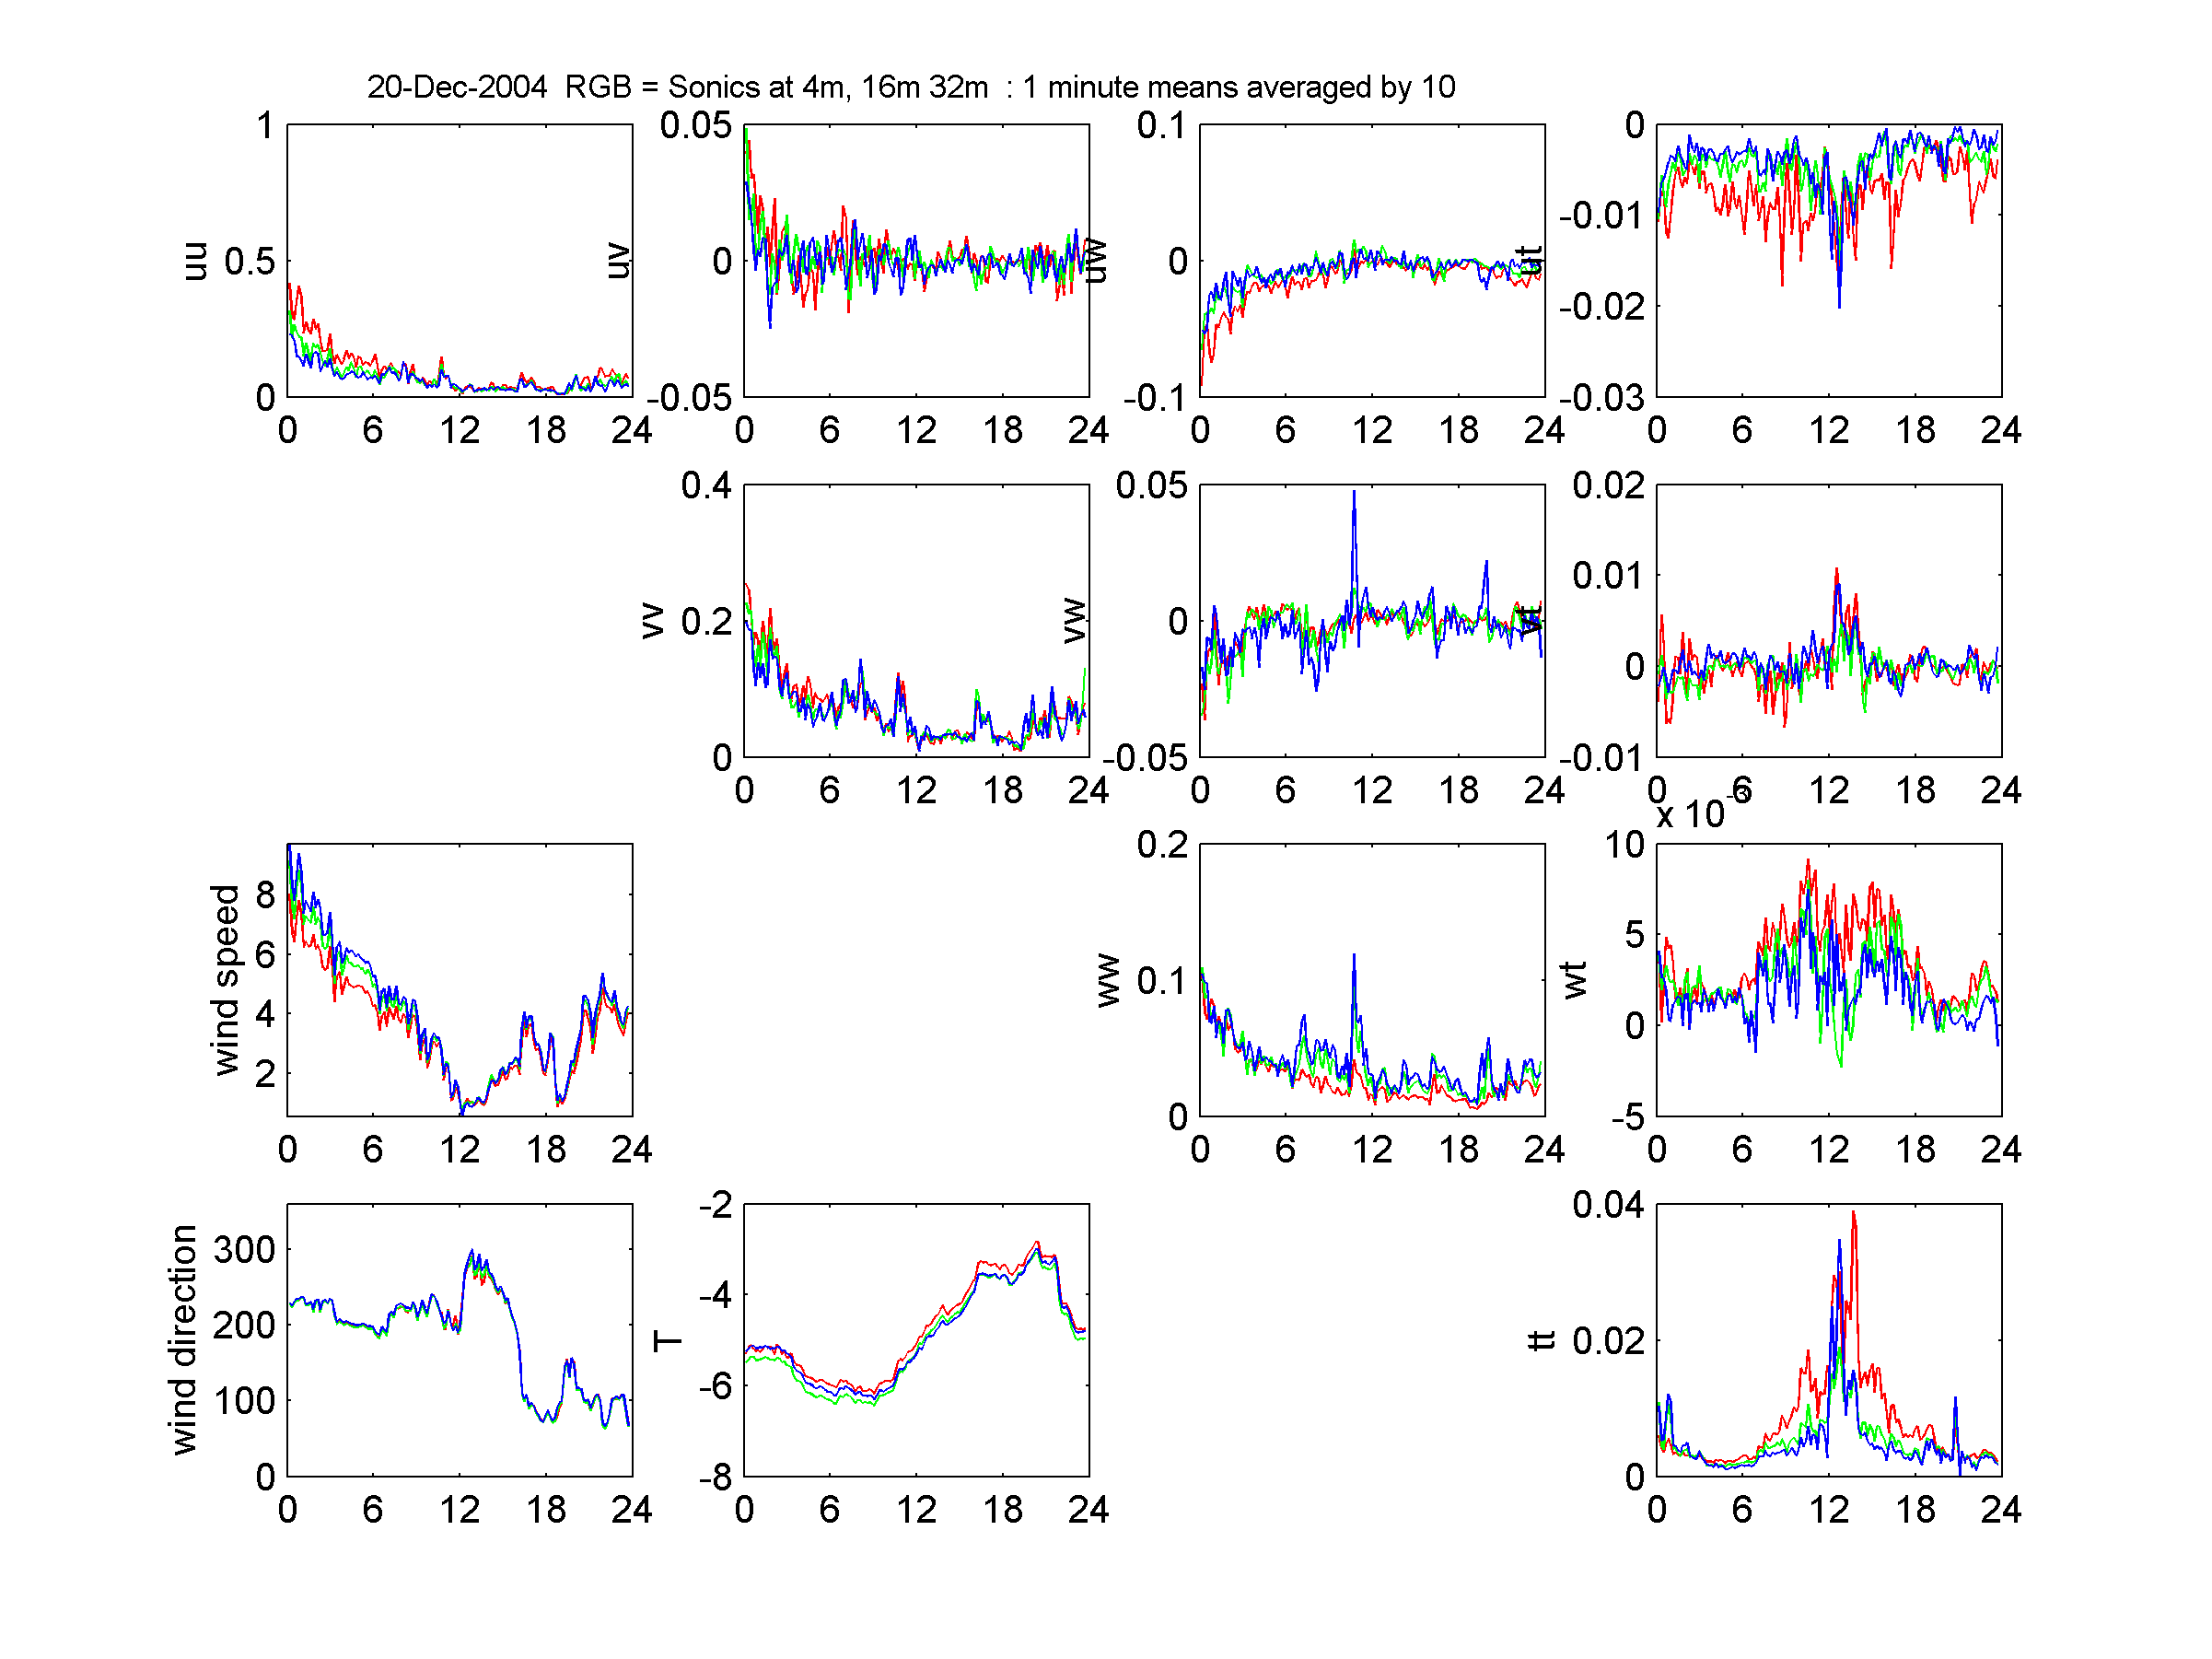
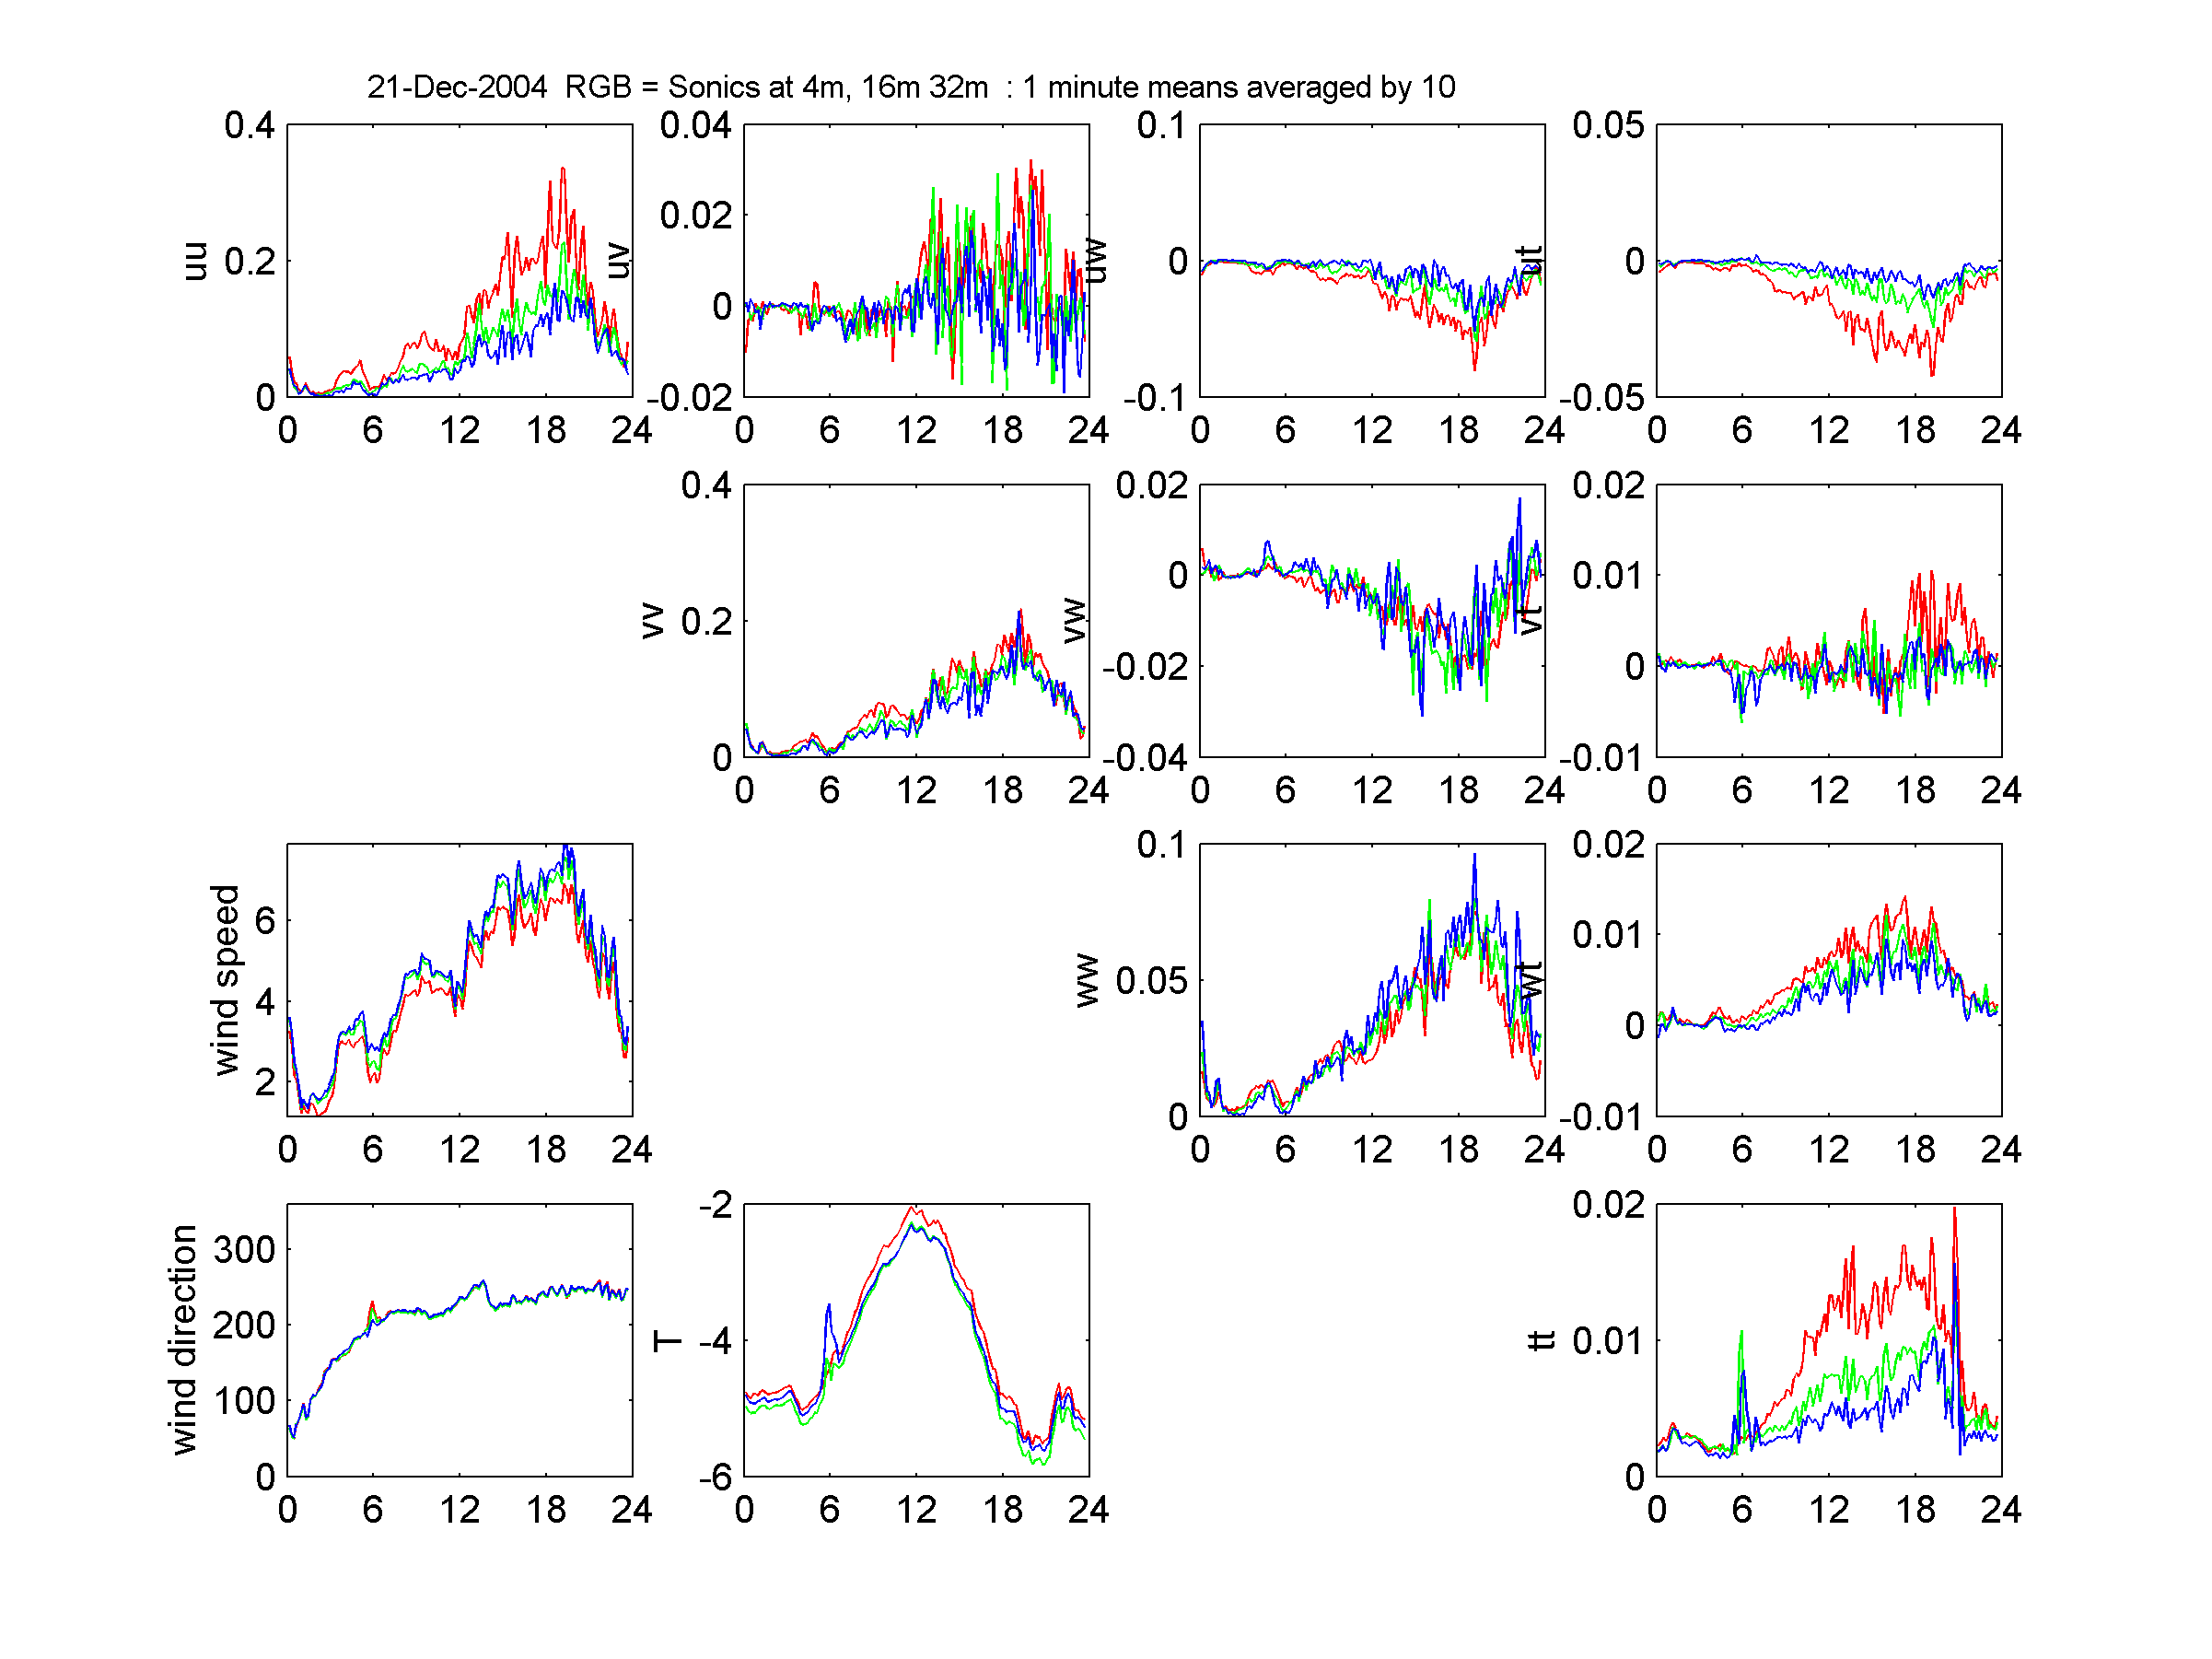
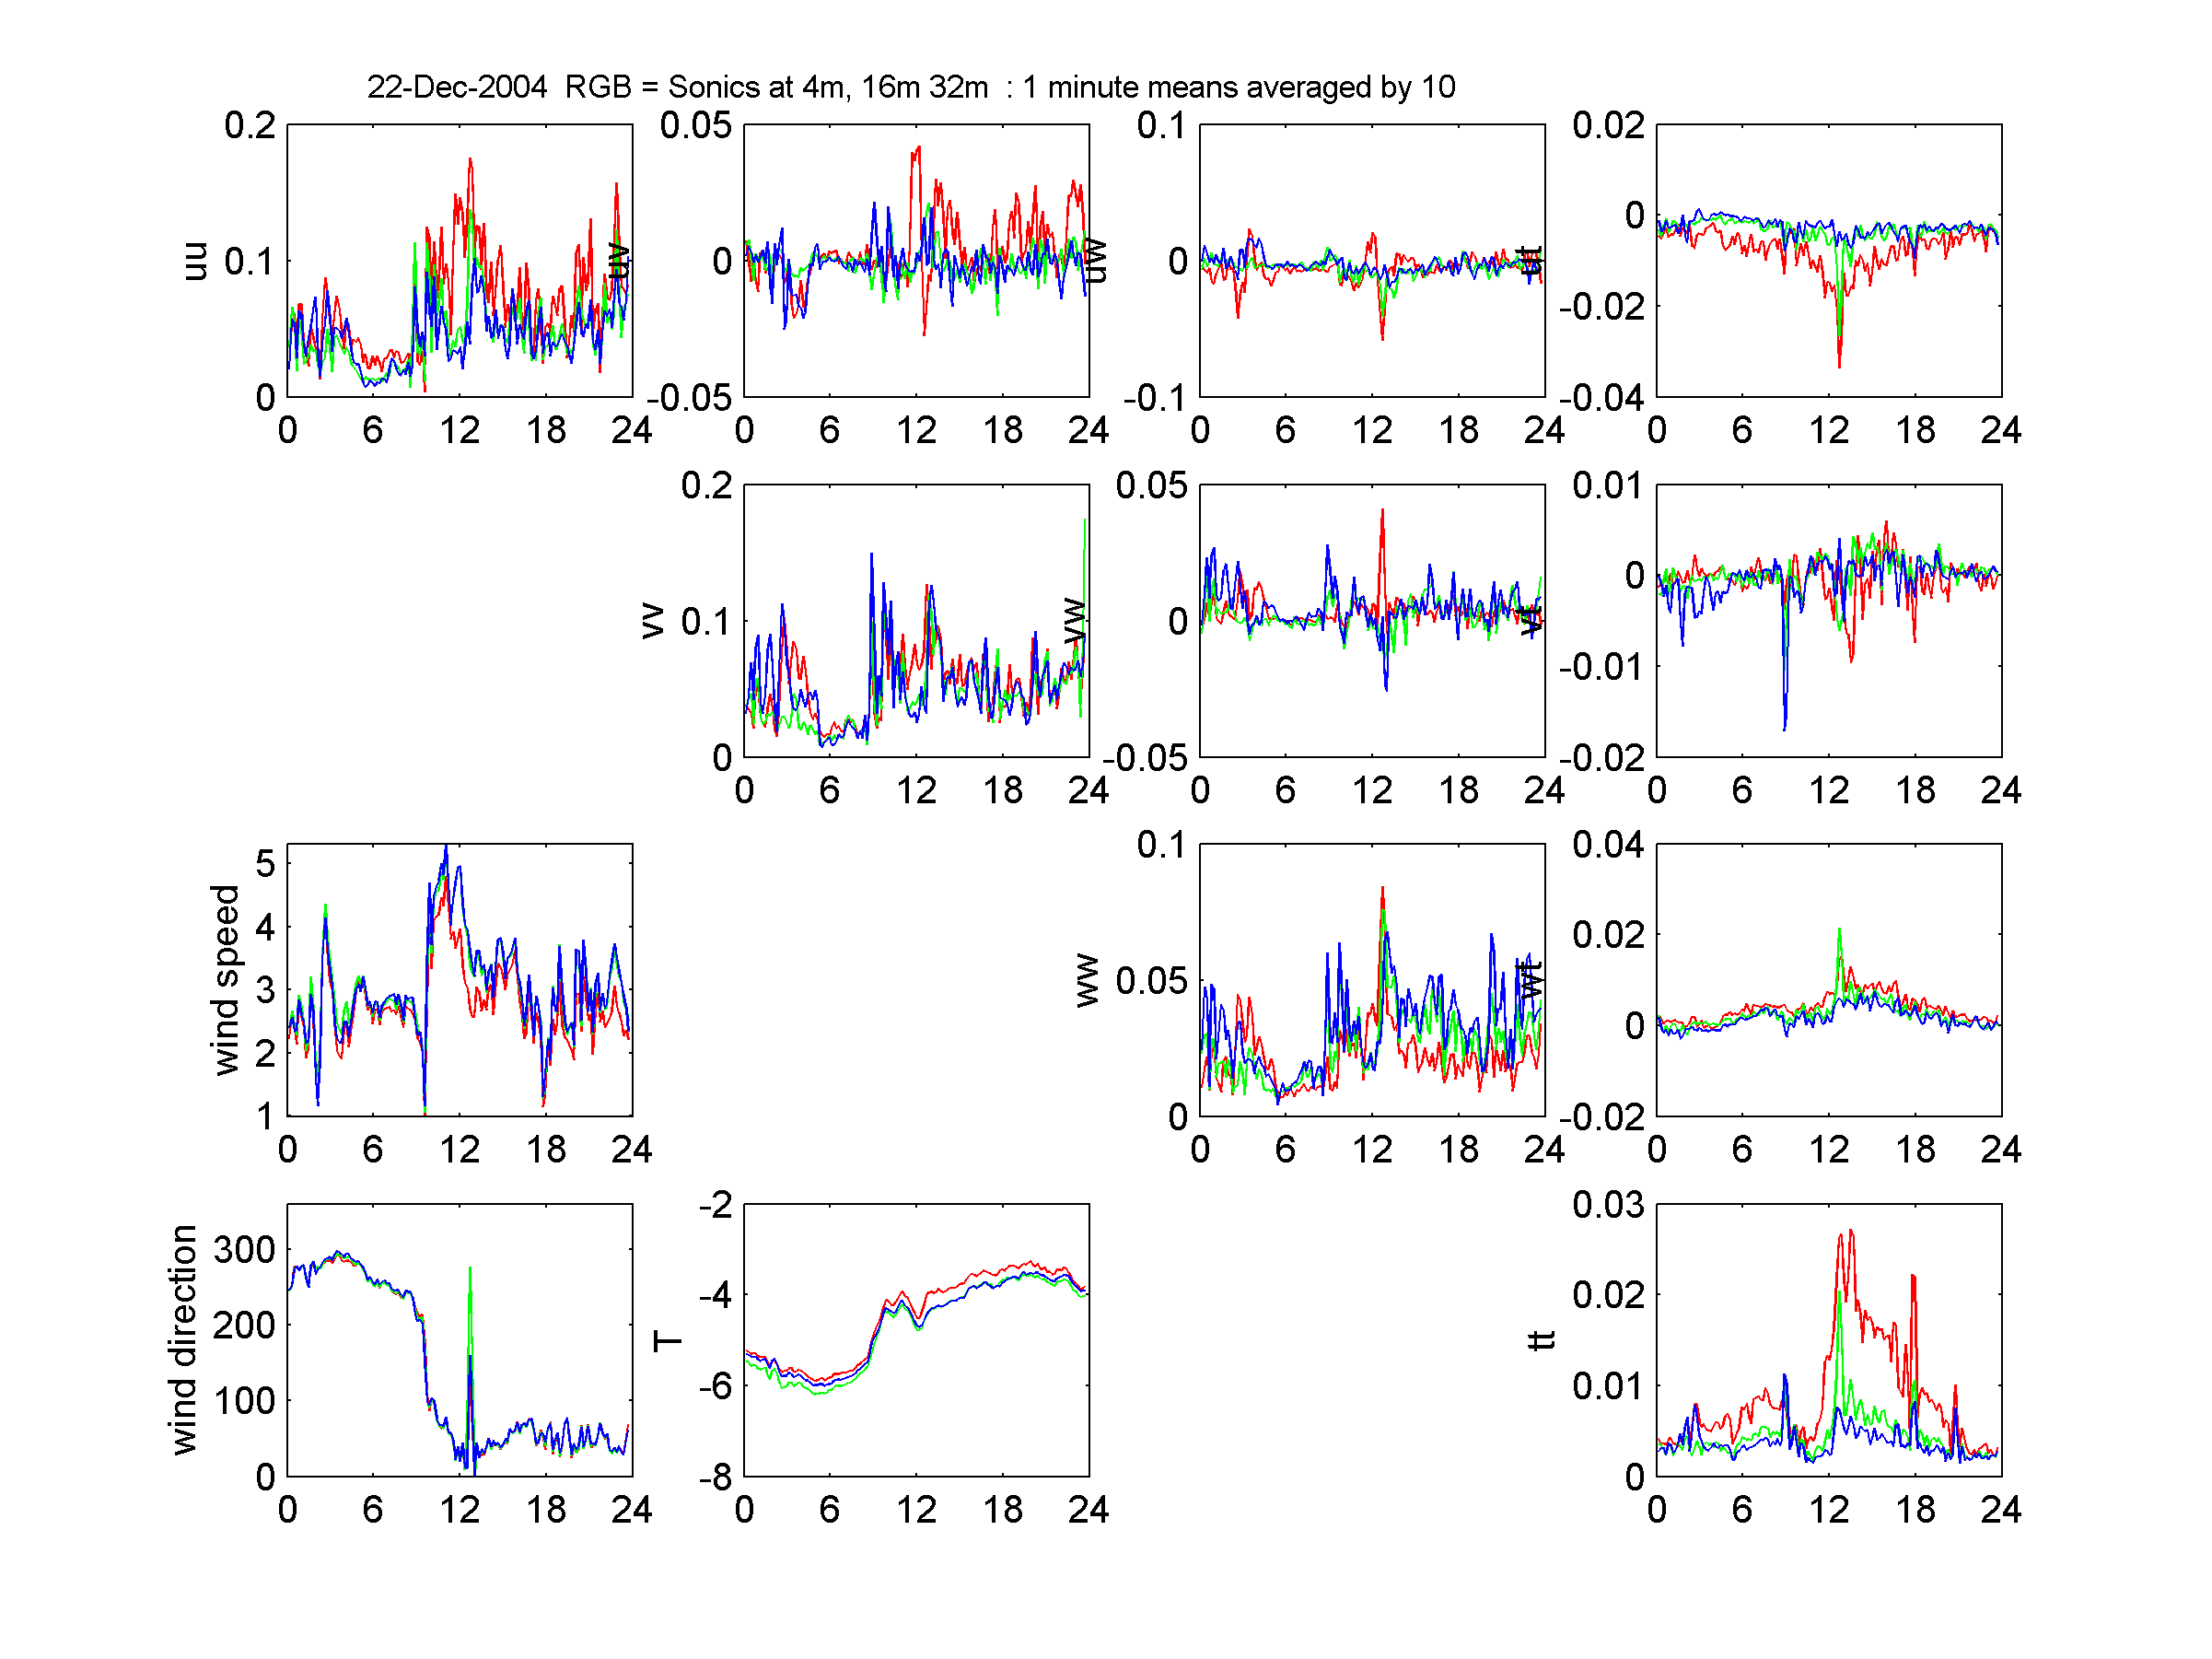
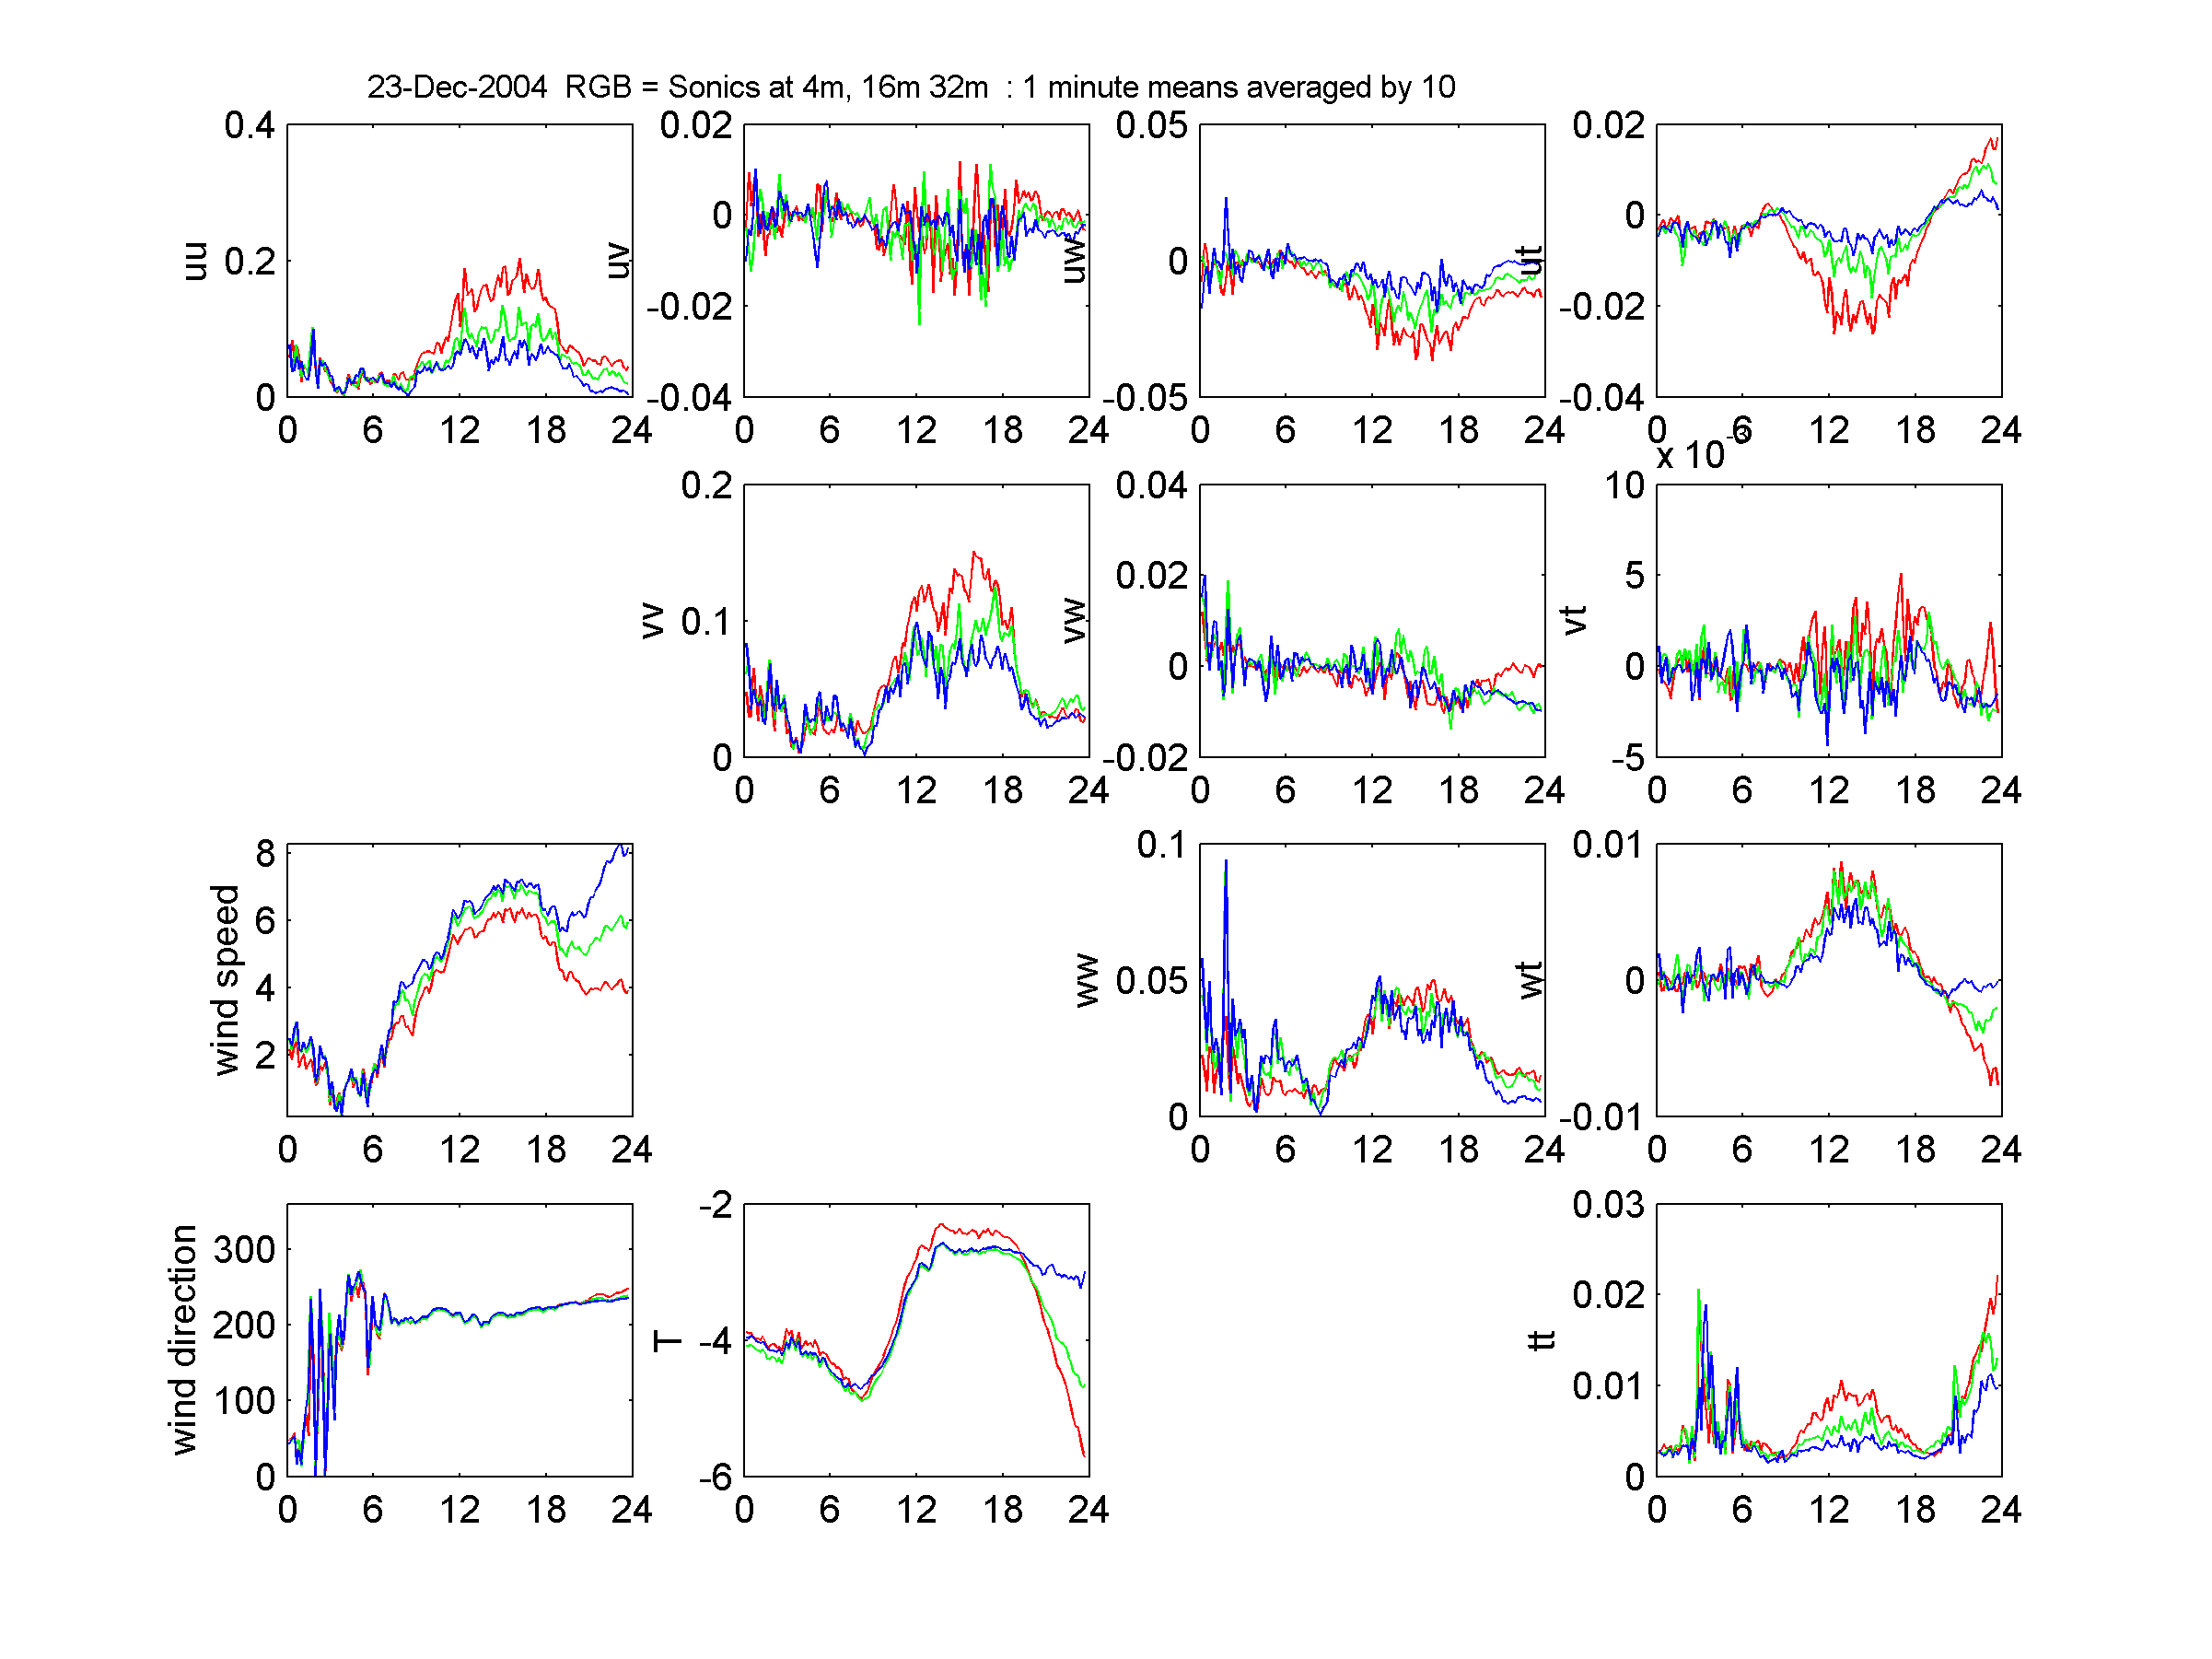
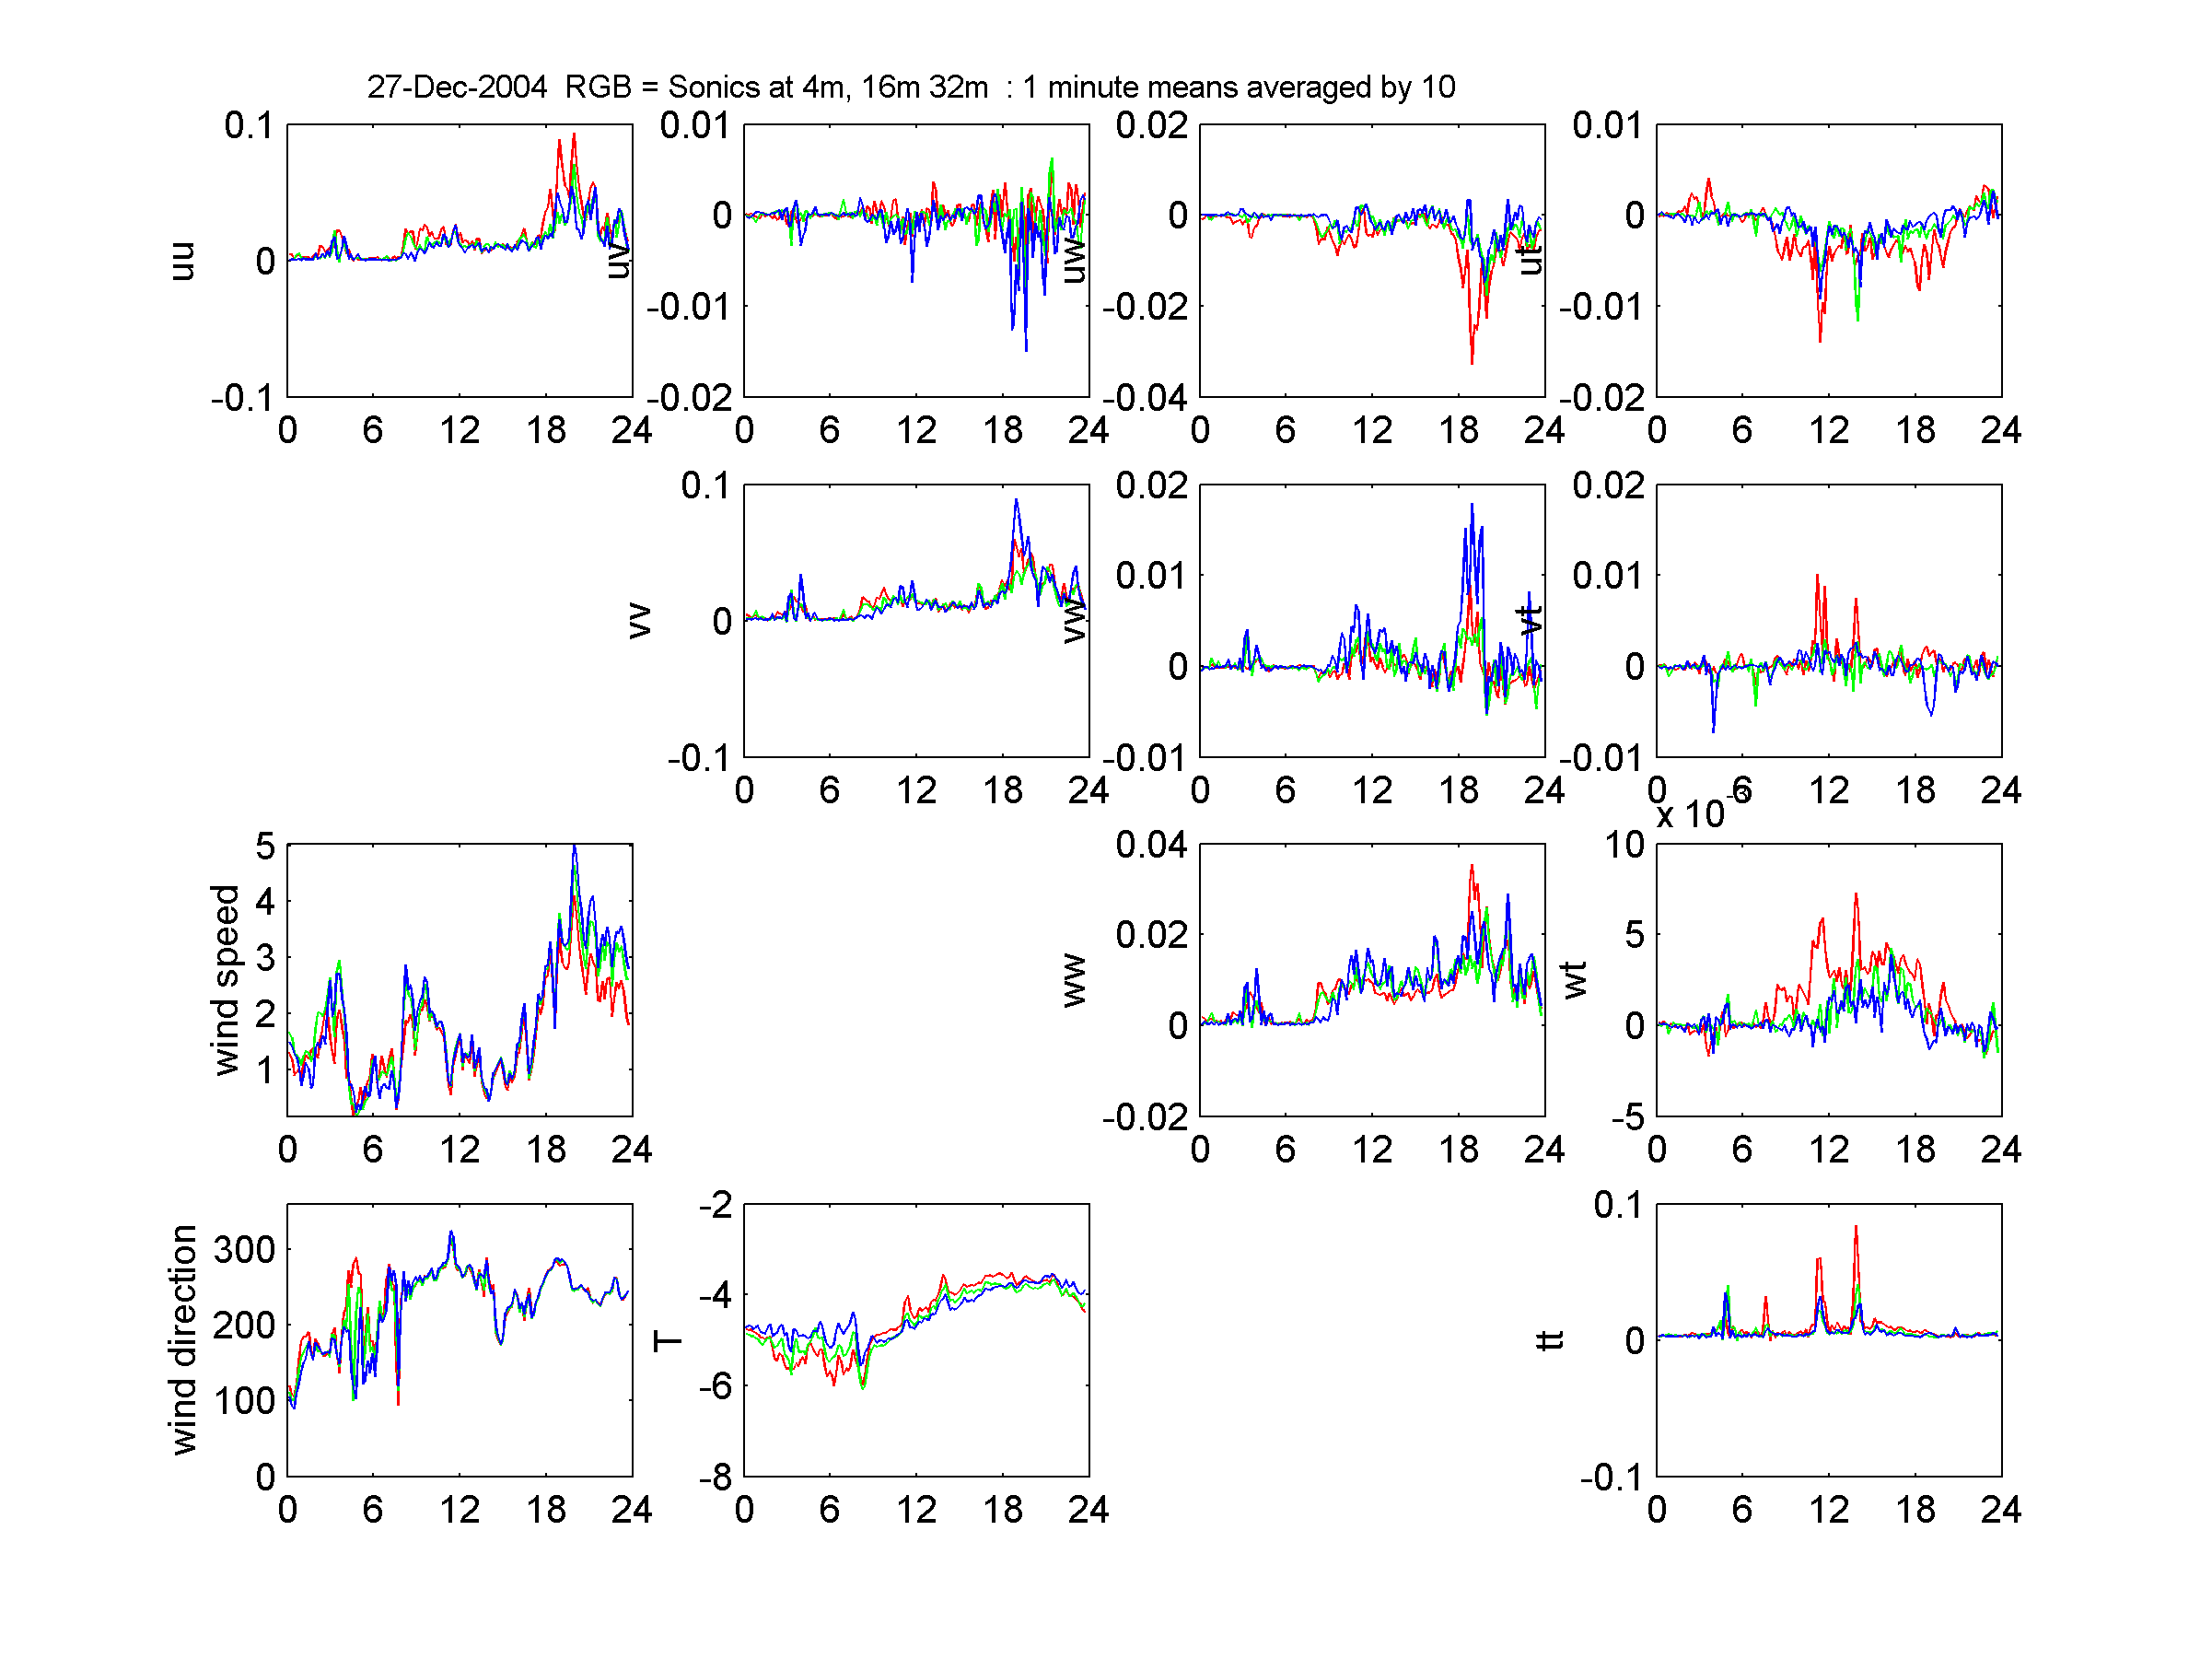
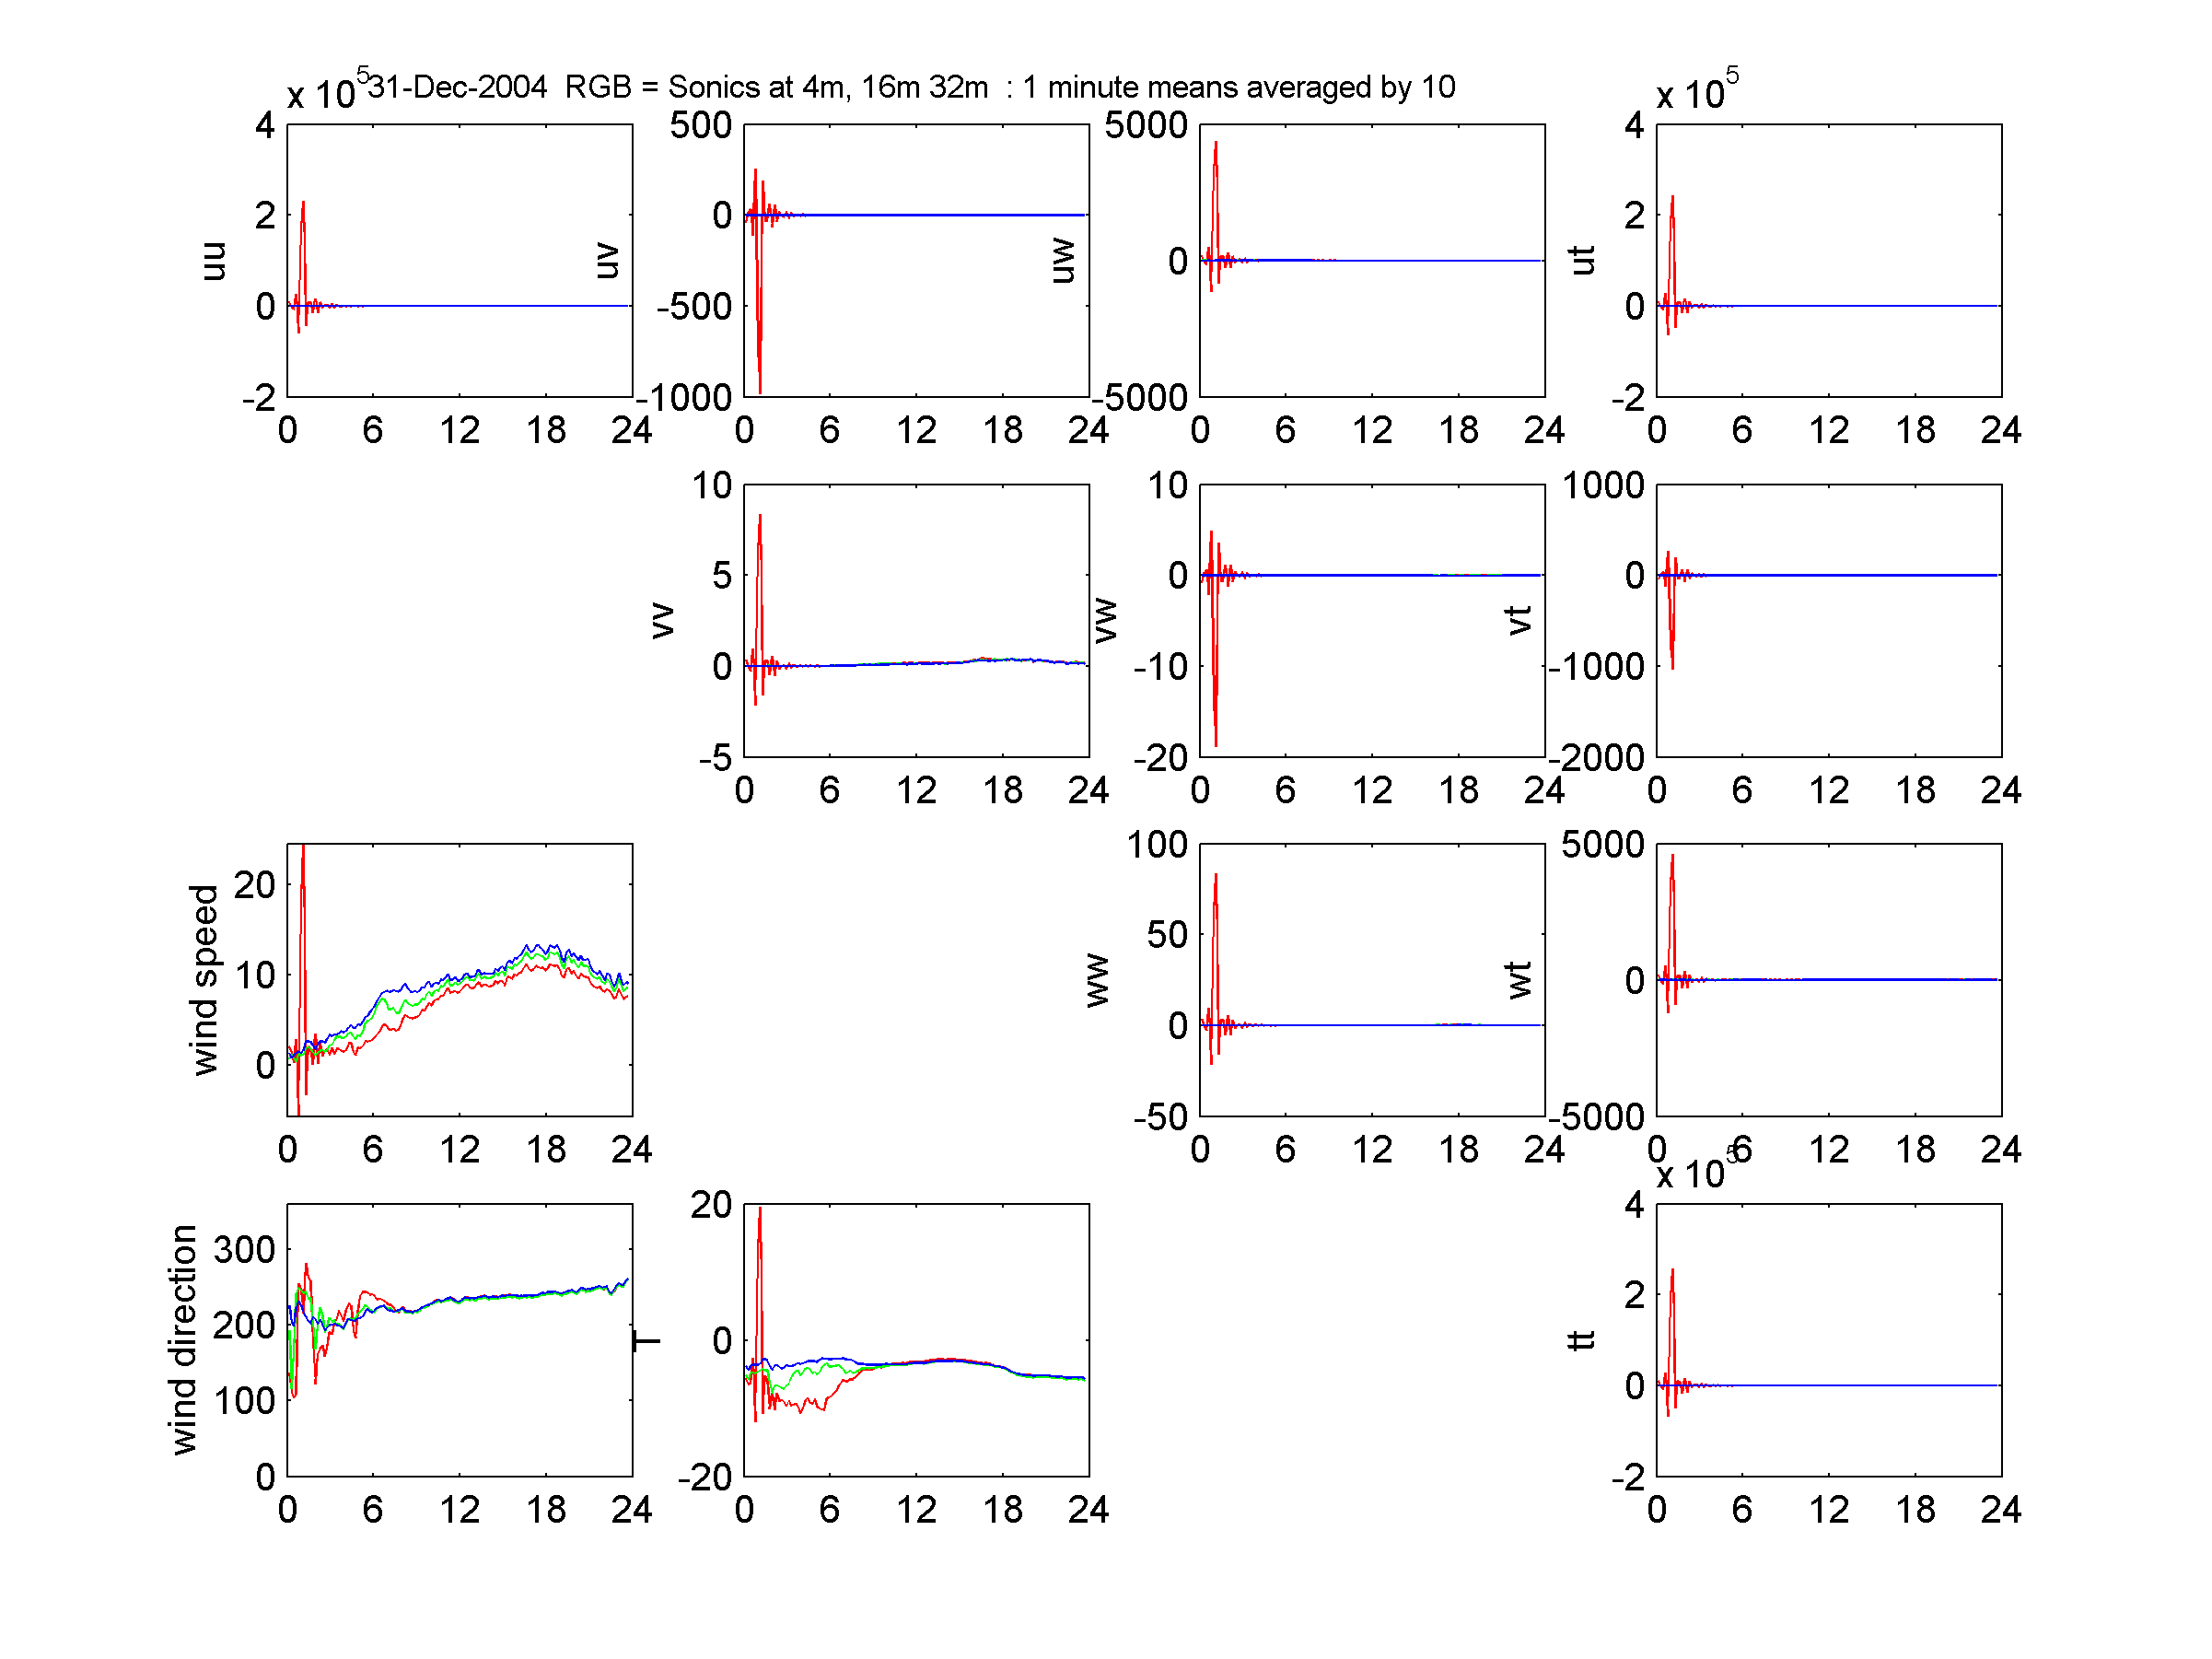
Daily summary plots of sonic anemometer means and cross
products. Three instruments are shown on each day, coded Red, Green and
Blue, corresponding to 4m, 16m and 32m nominal heights. Two styles of
plot are presented:
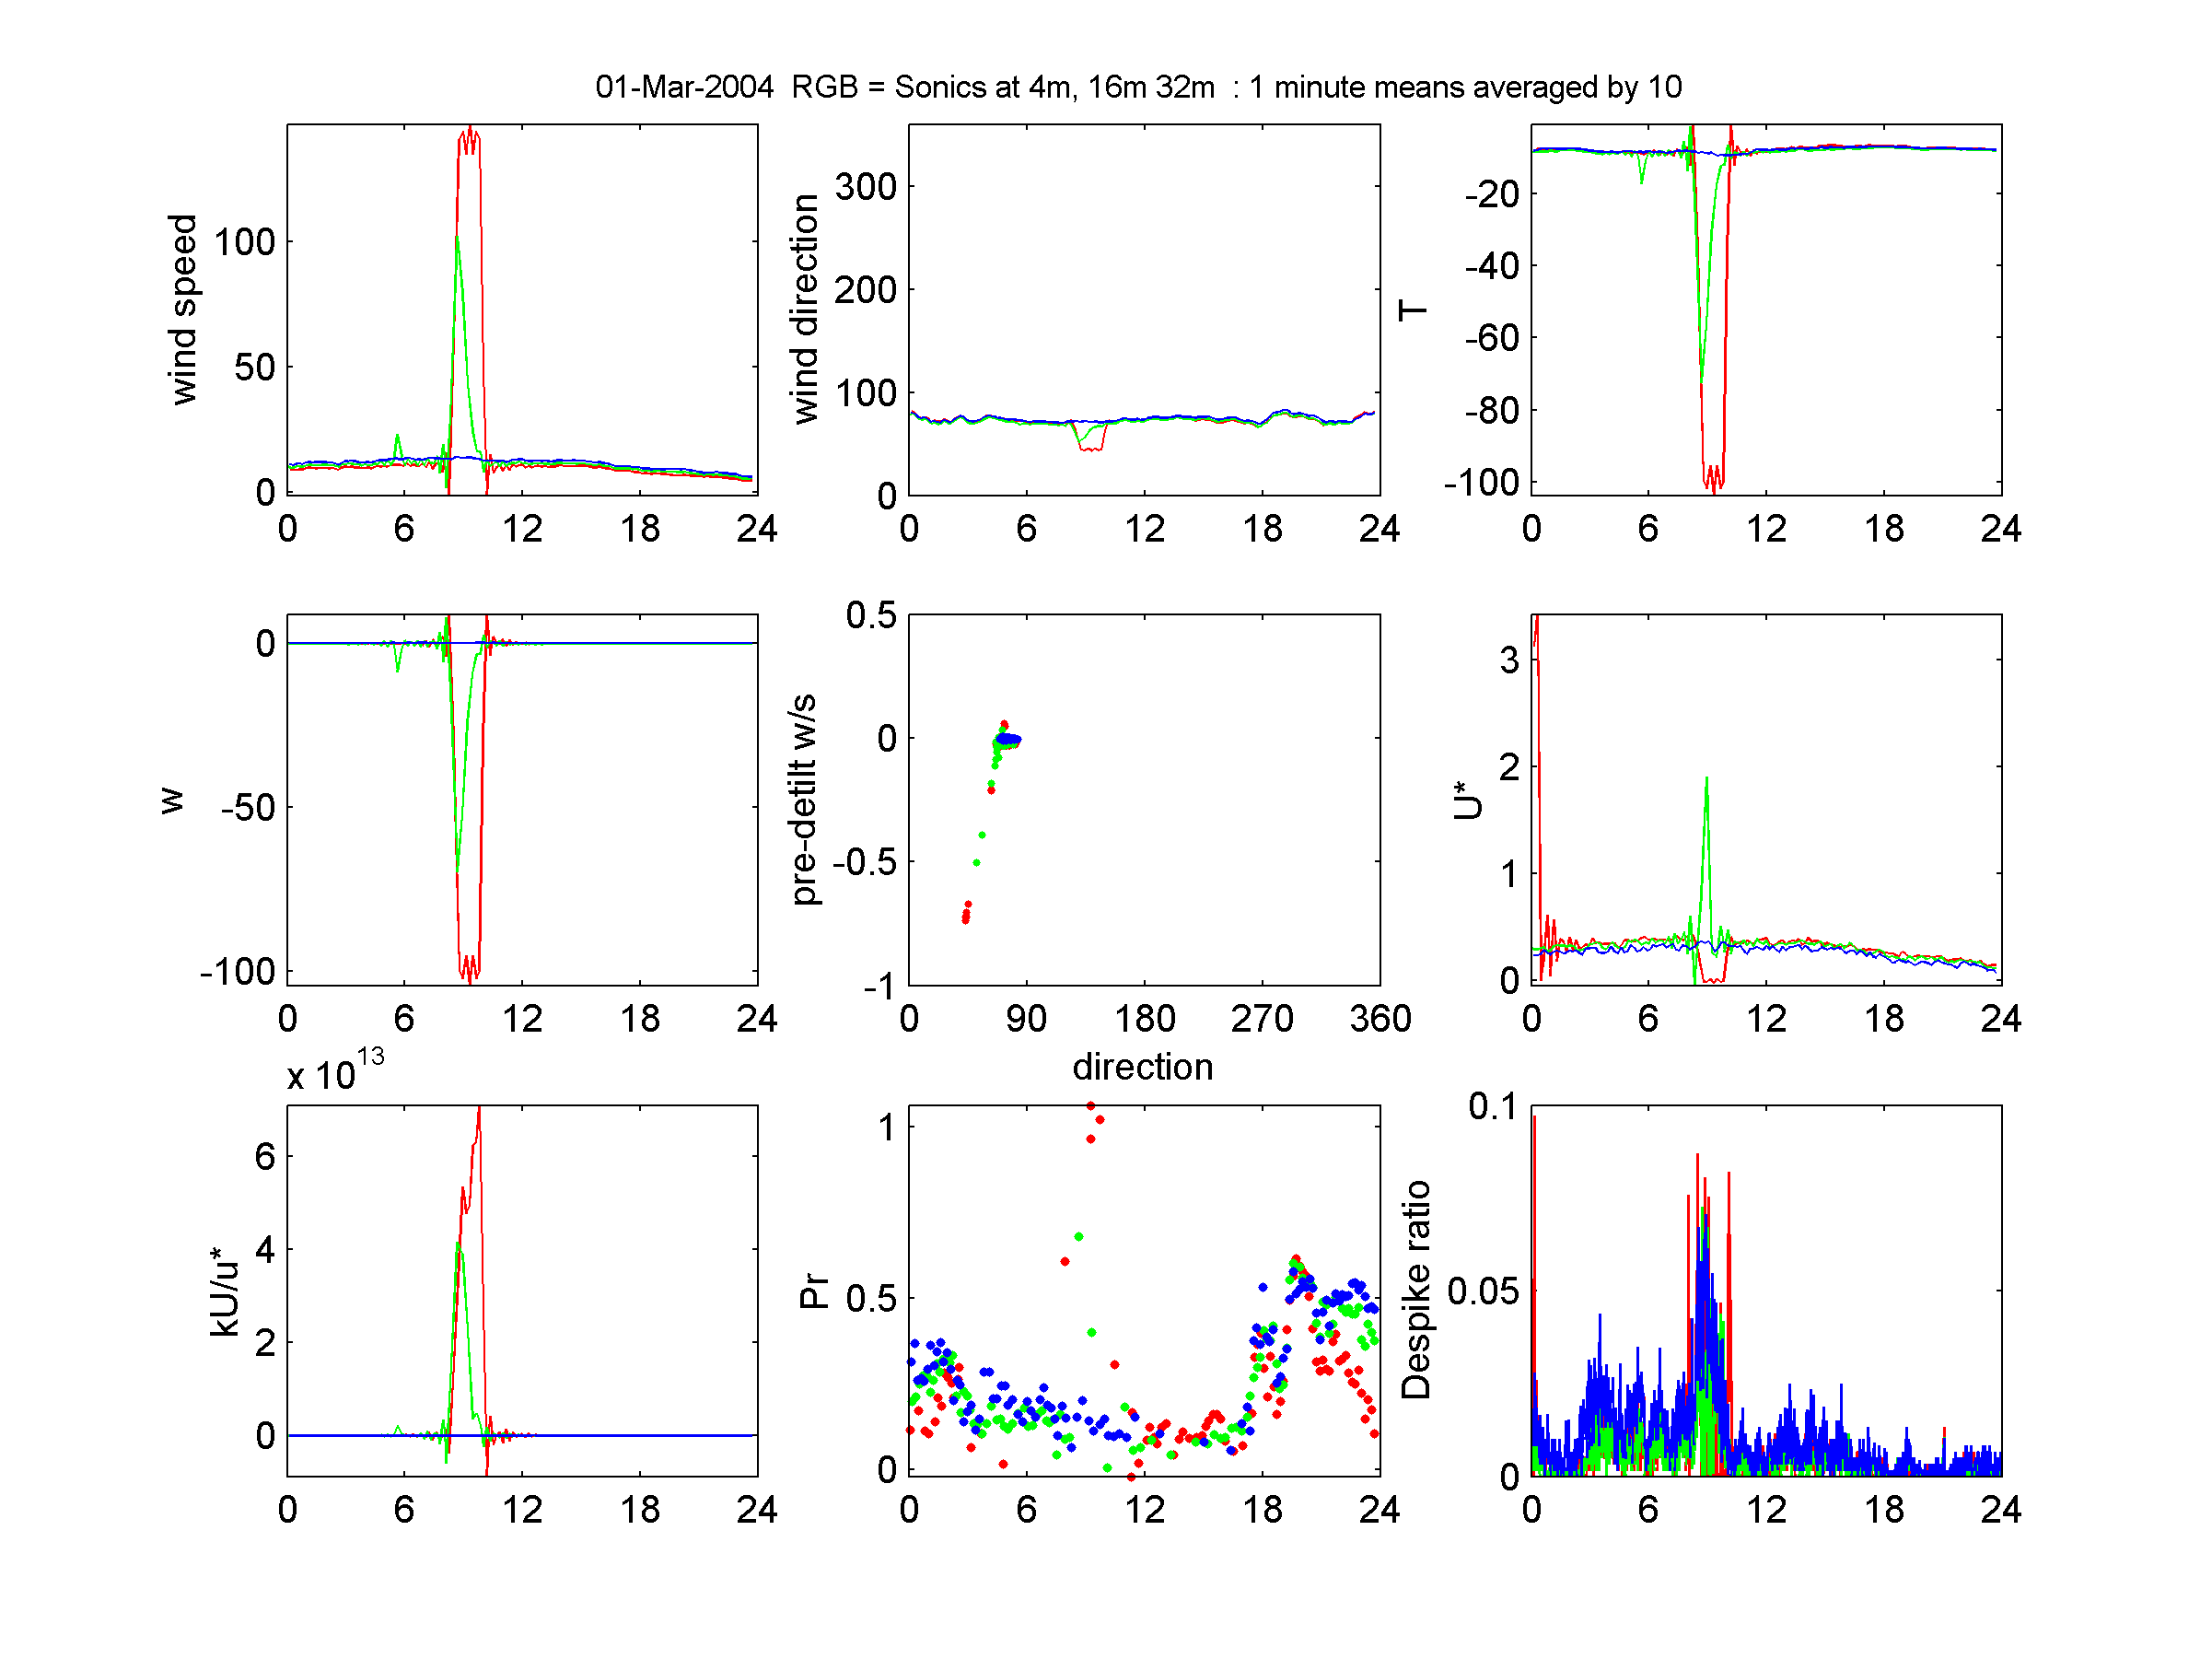
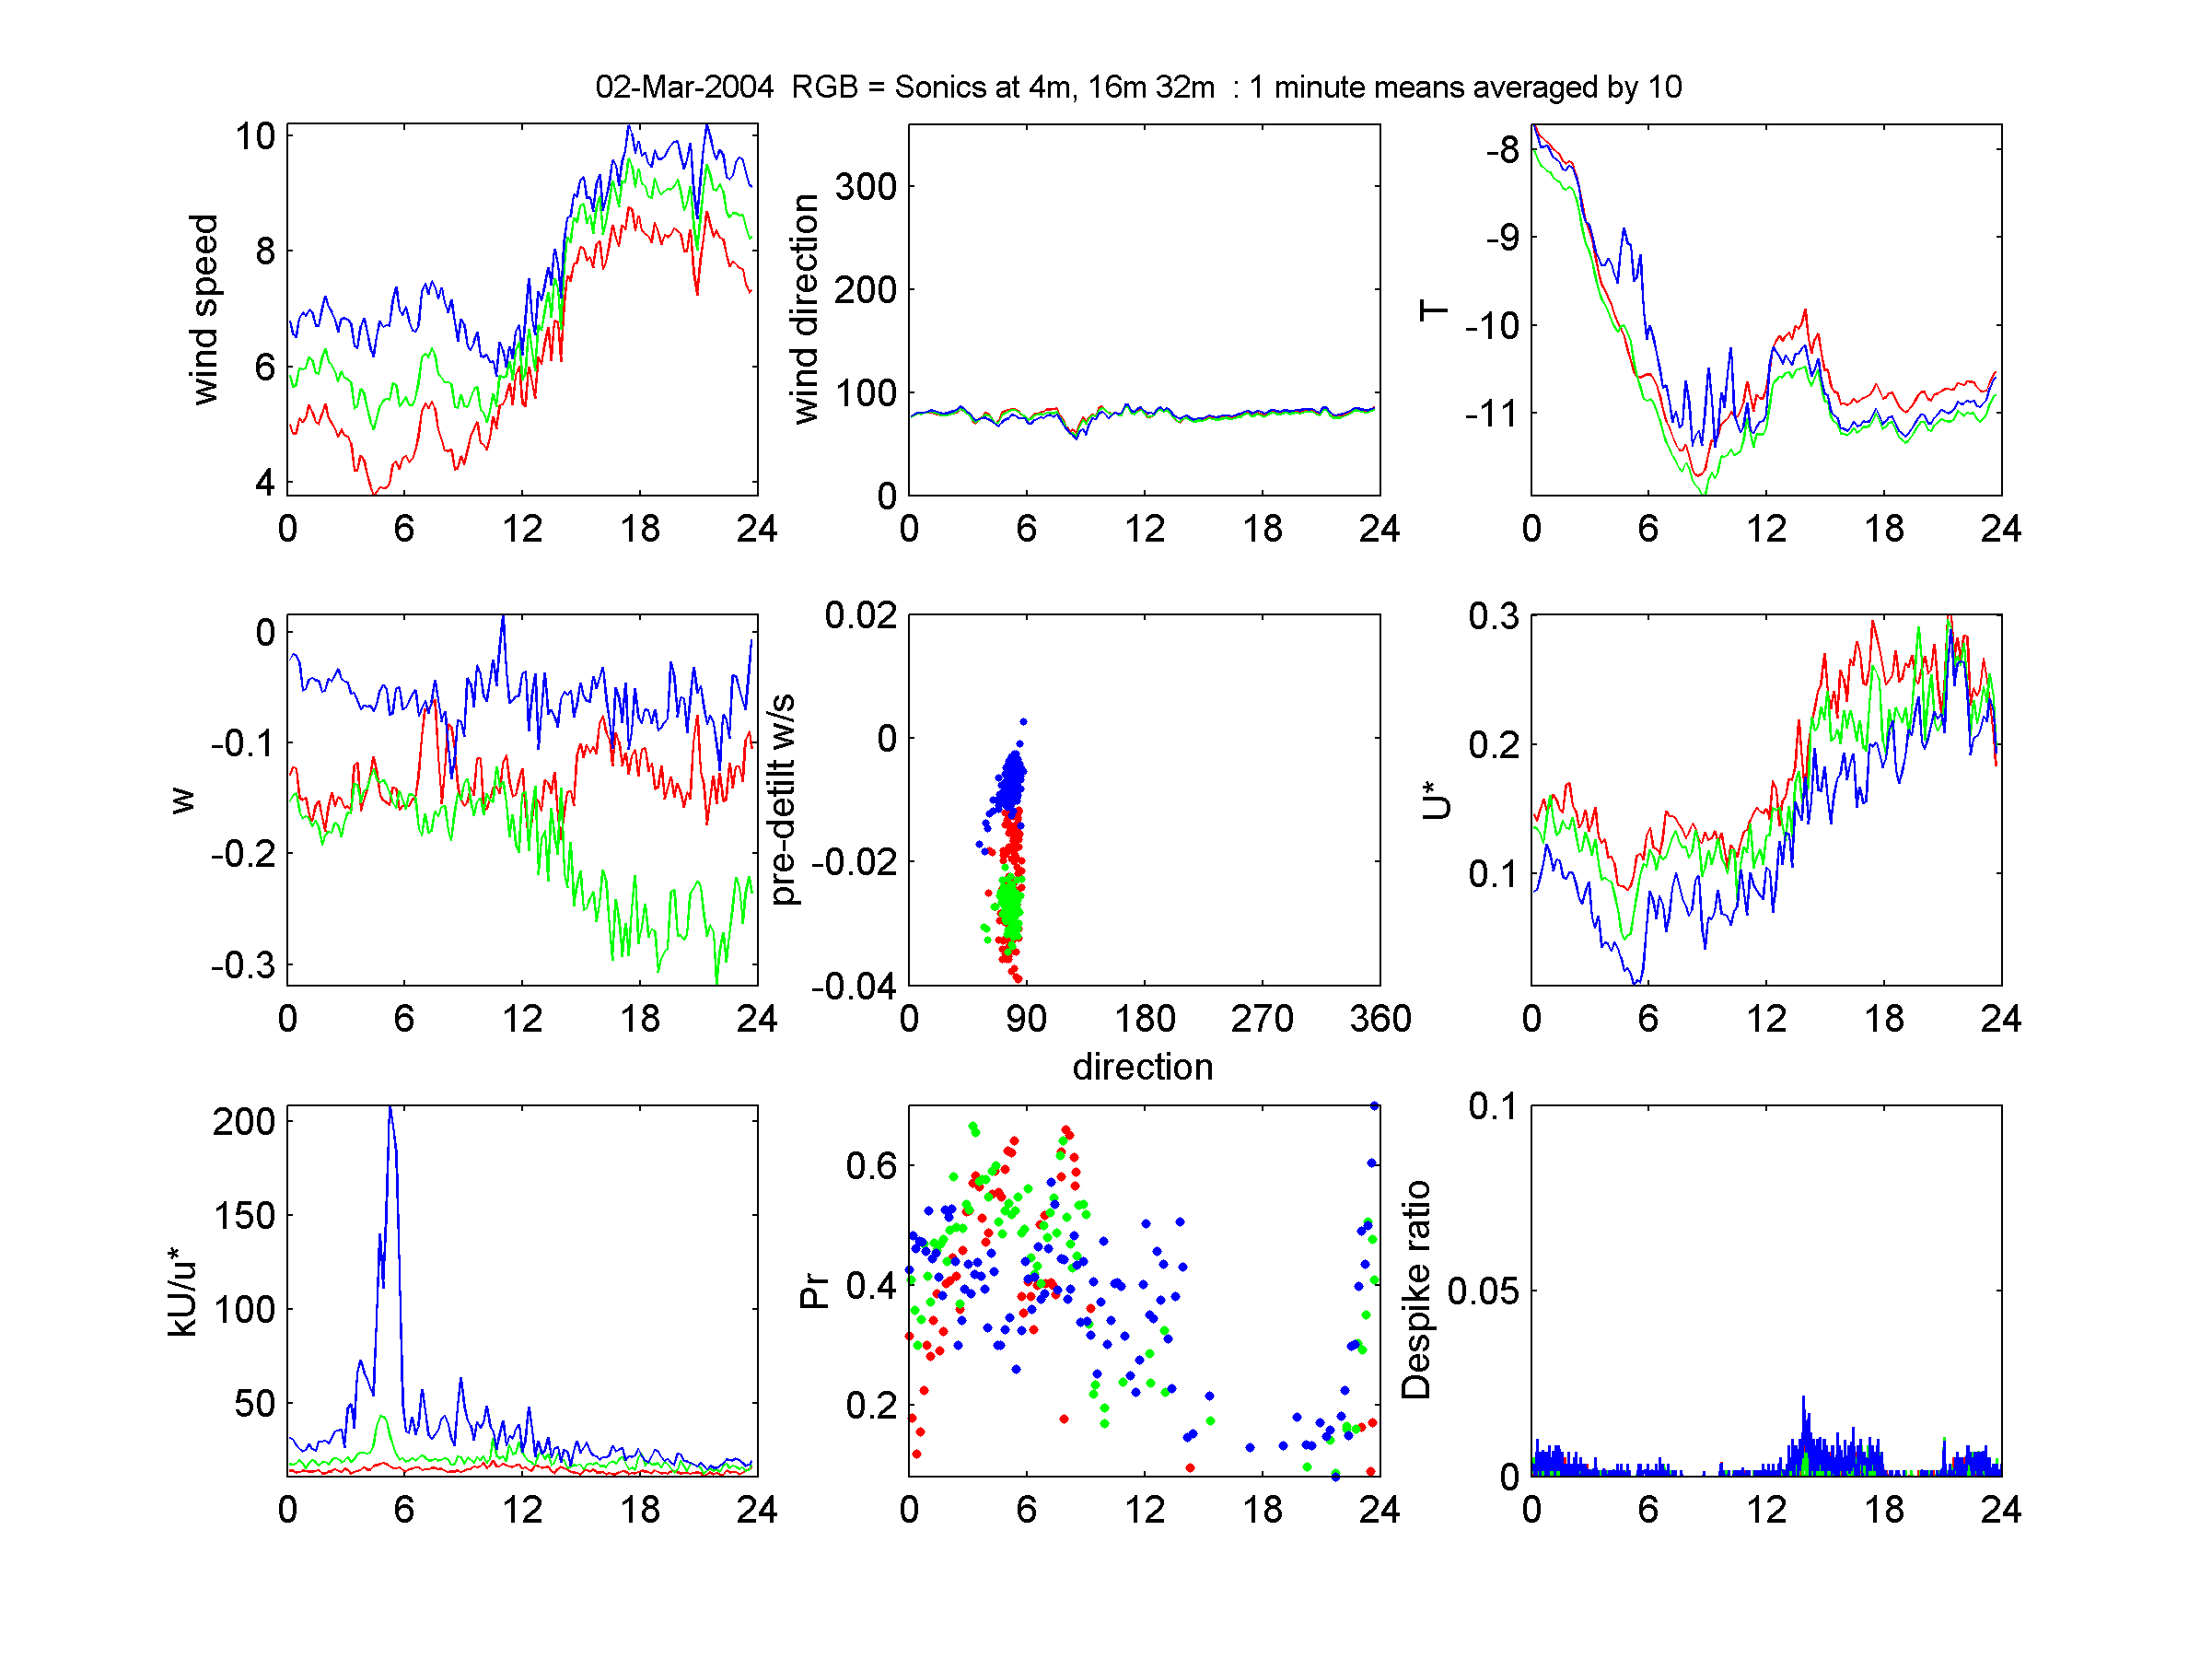
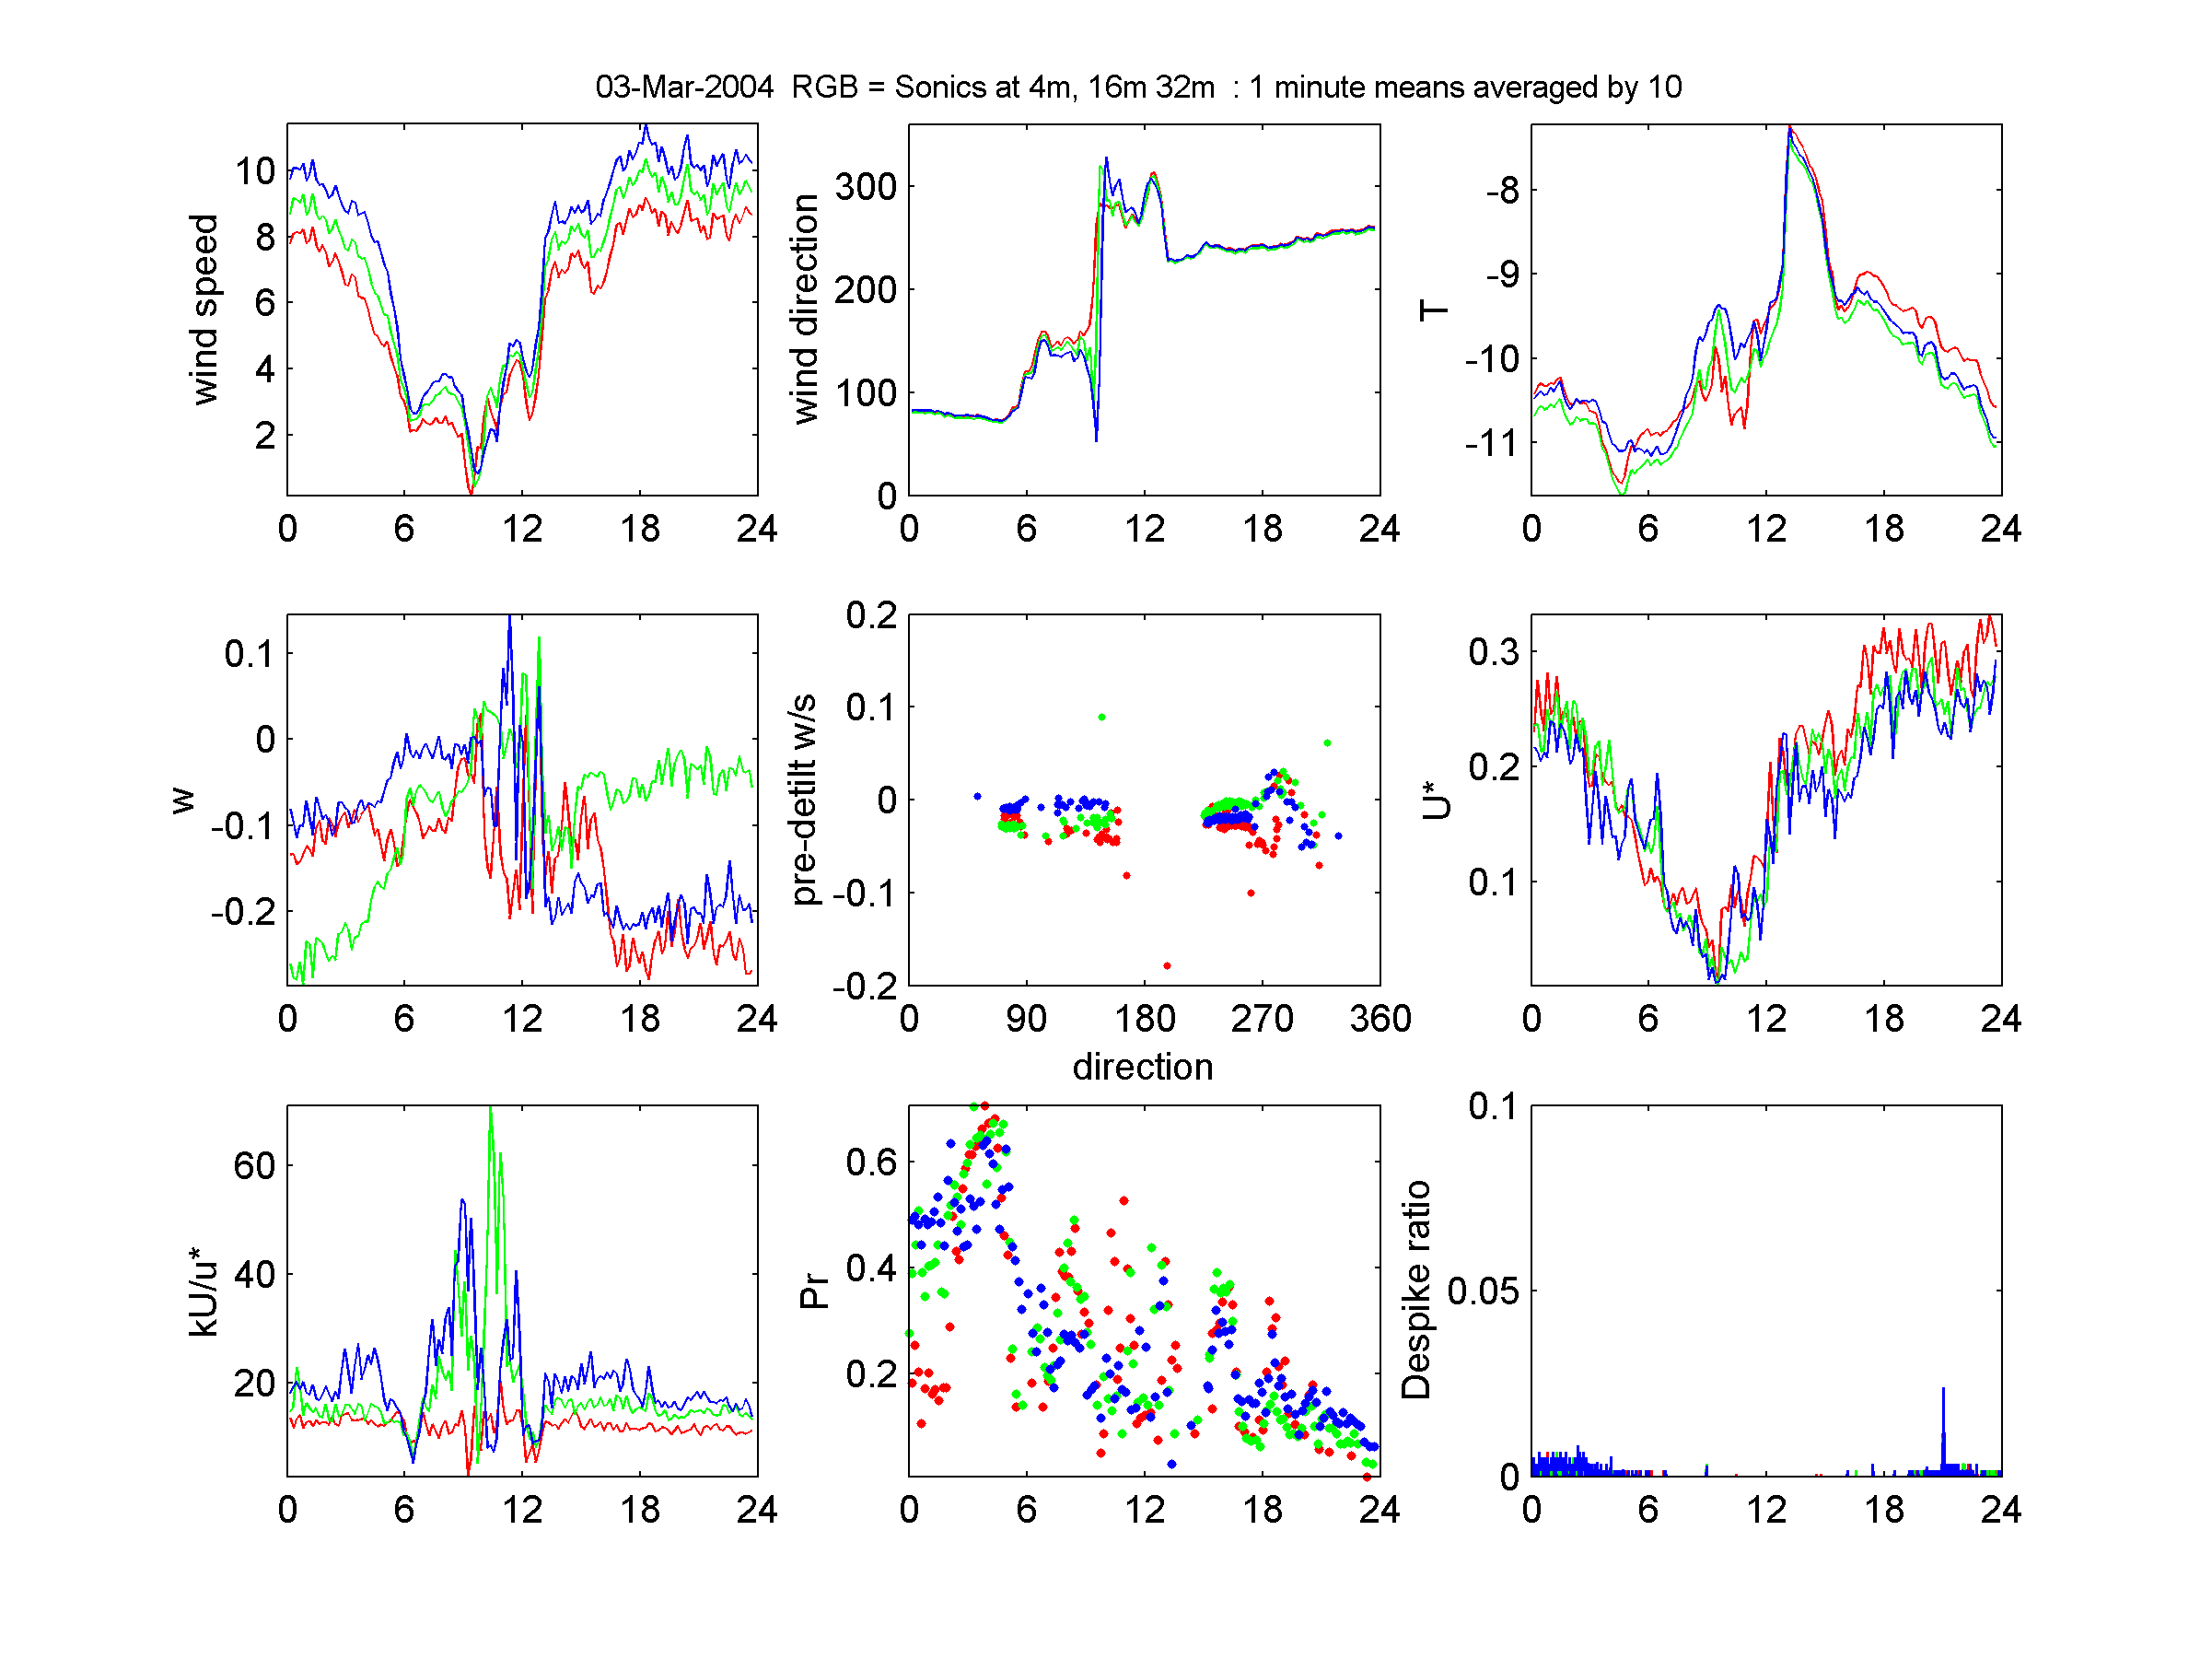
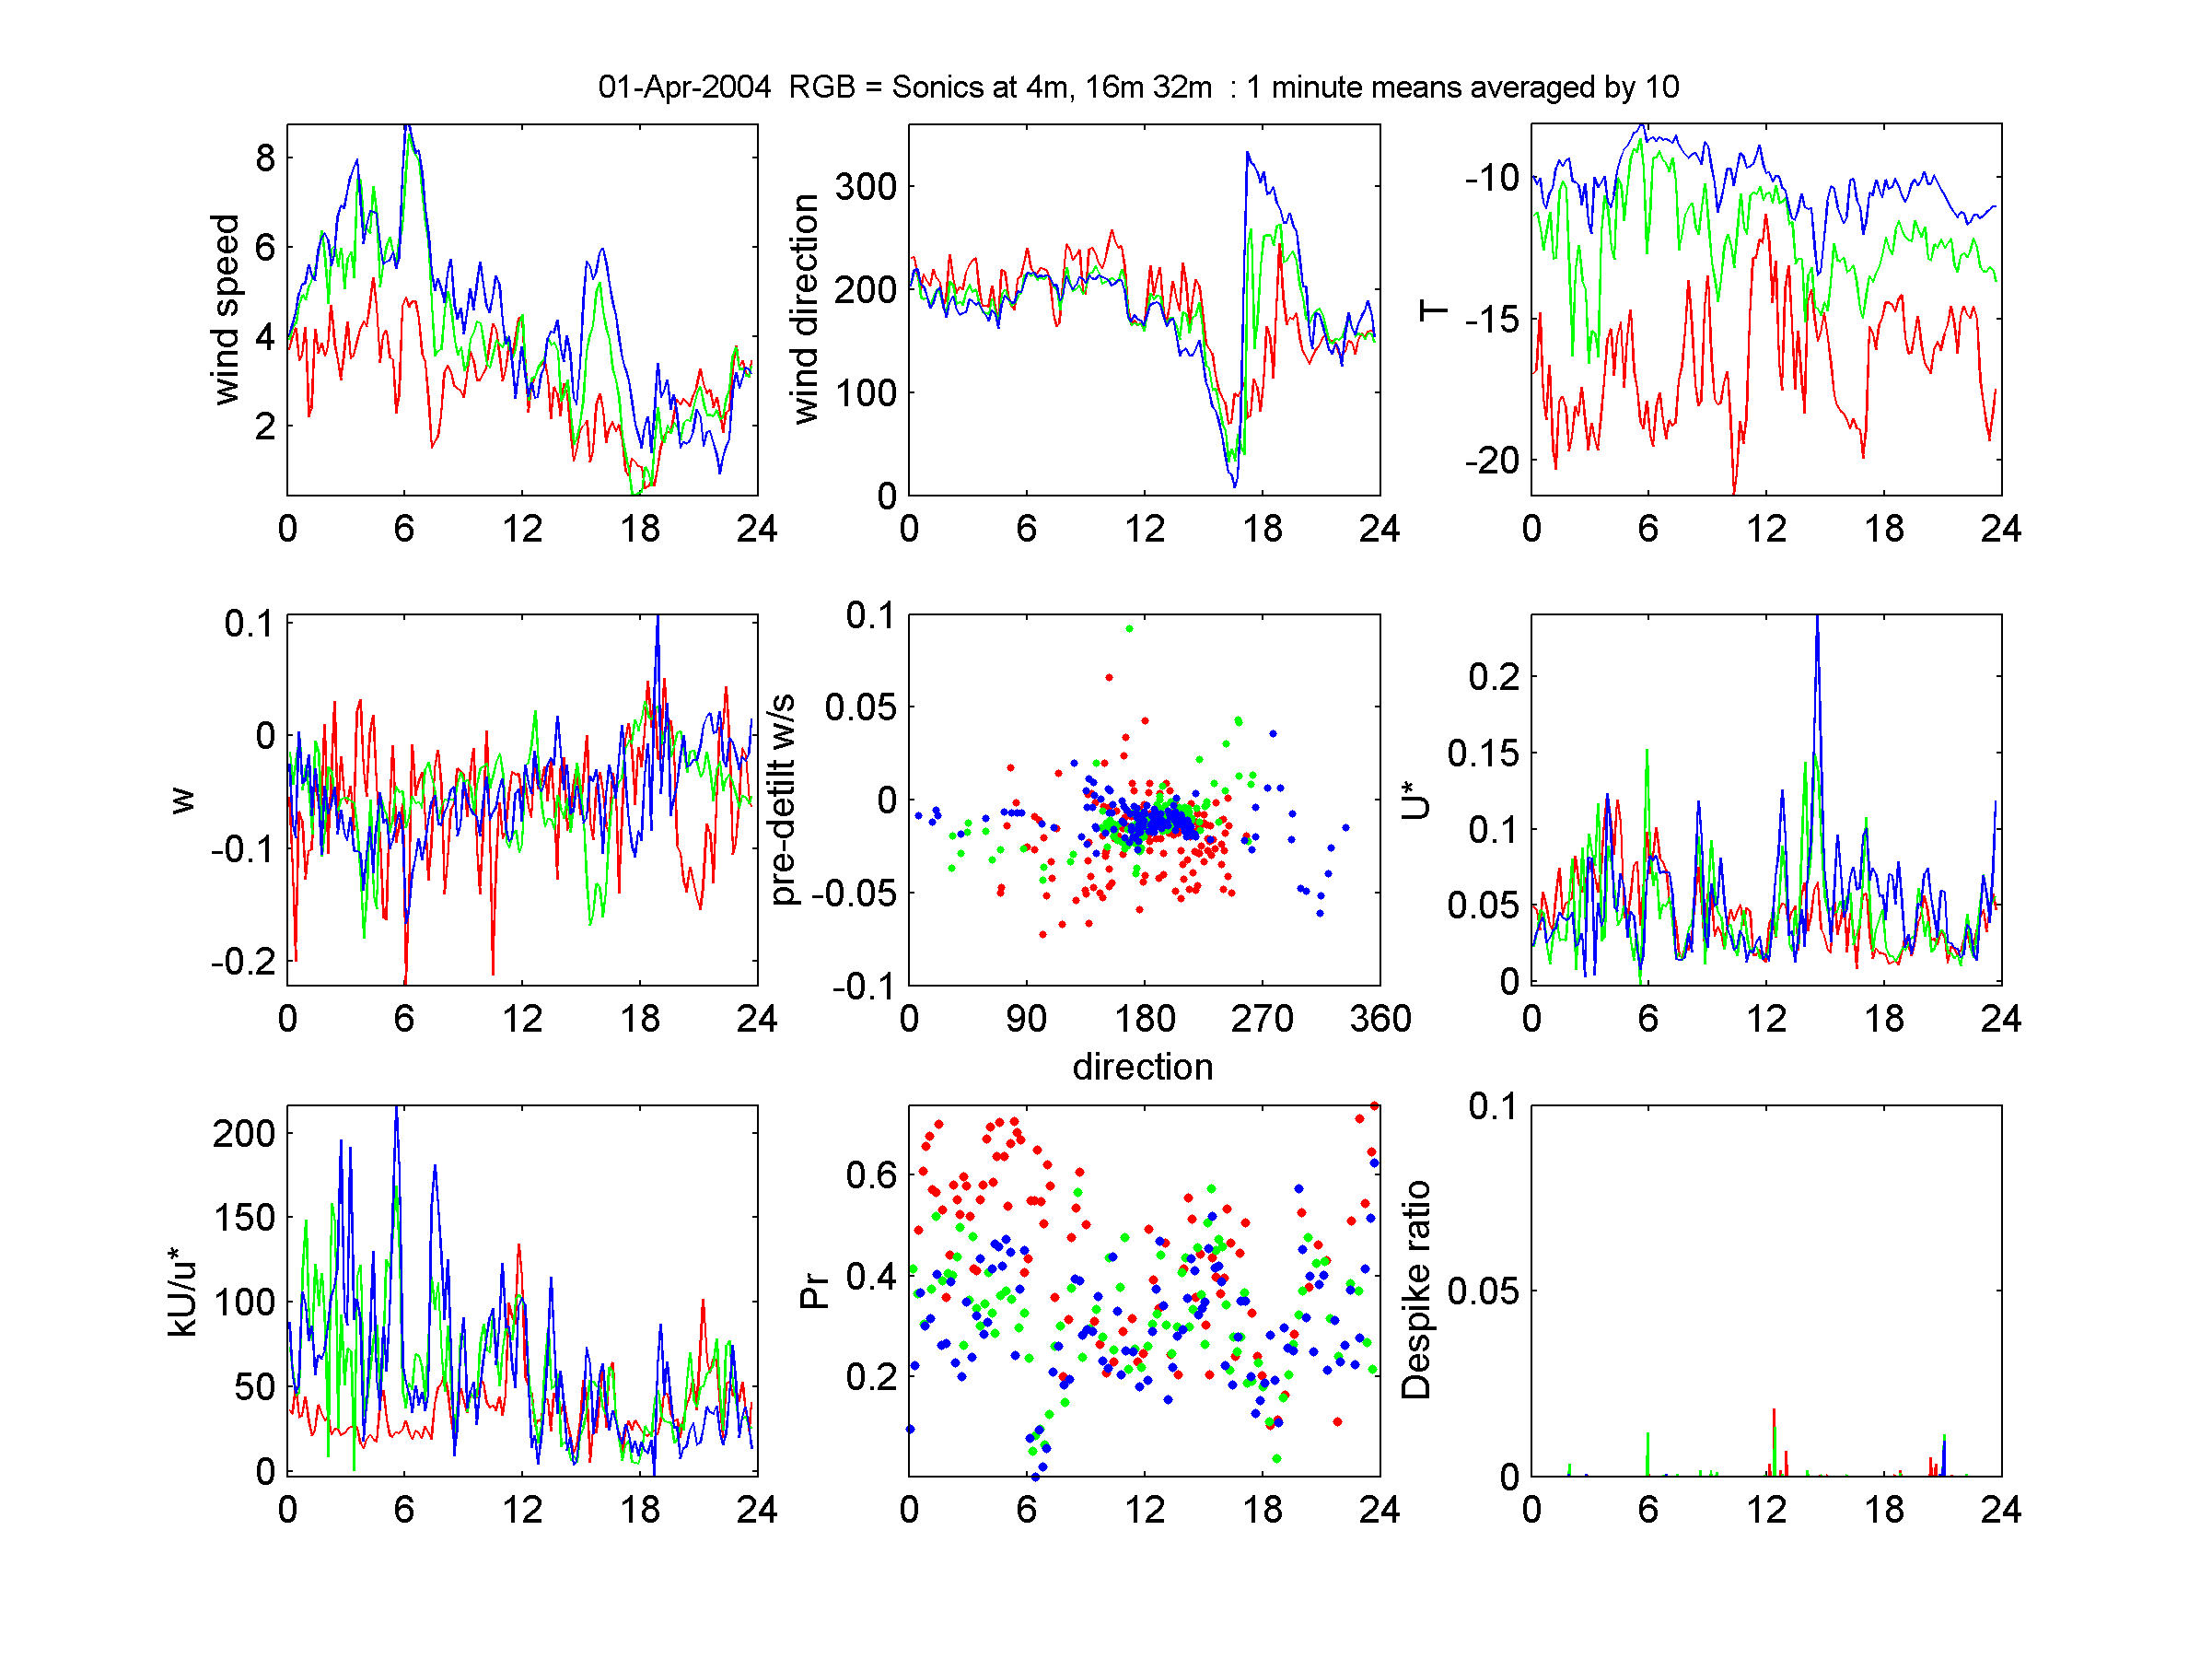
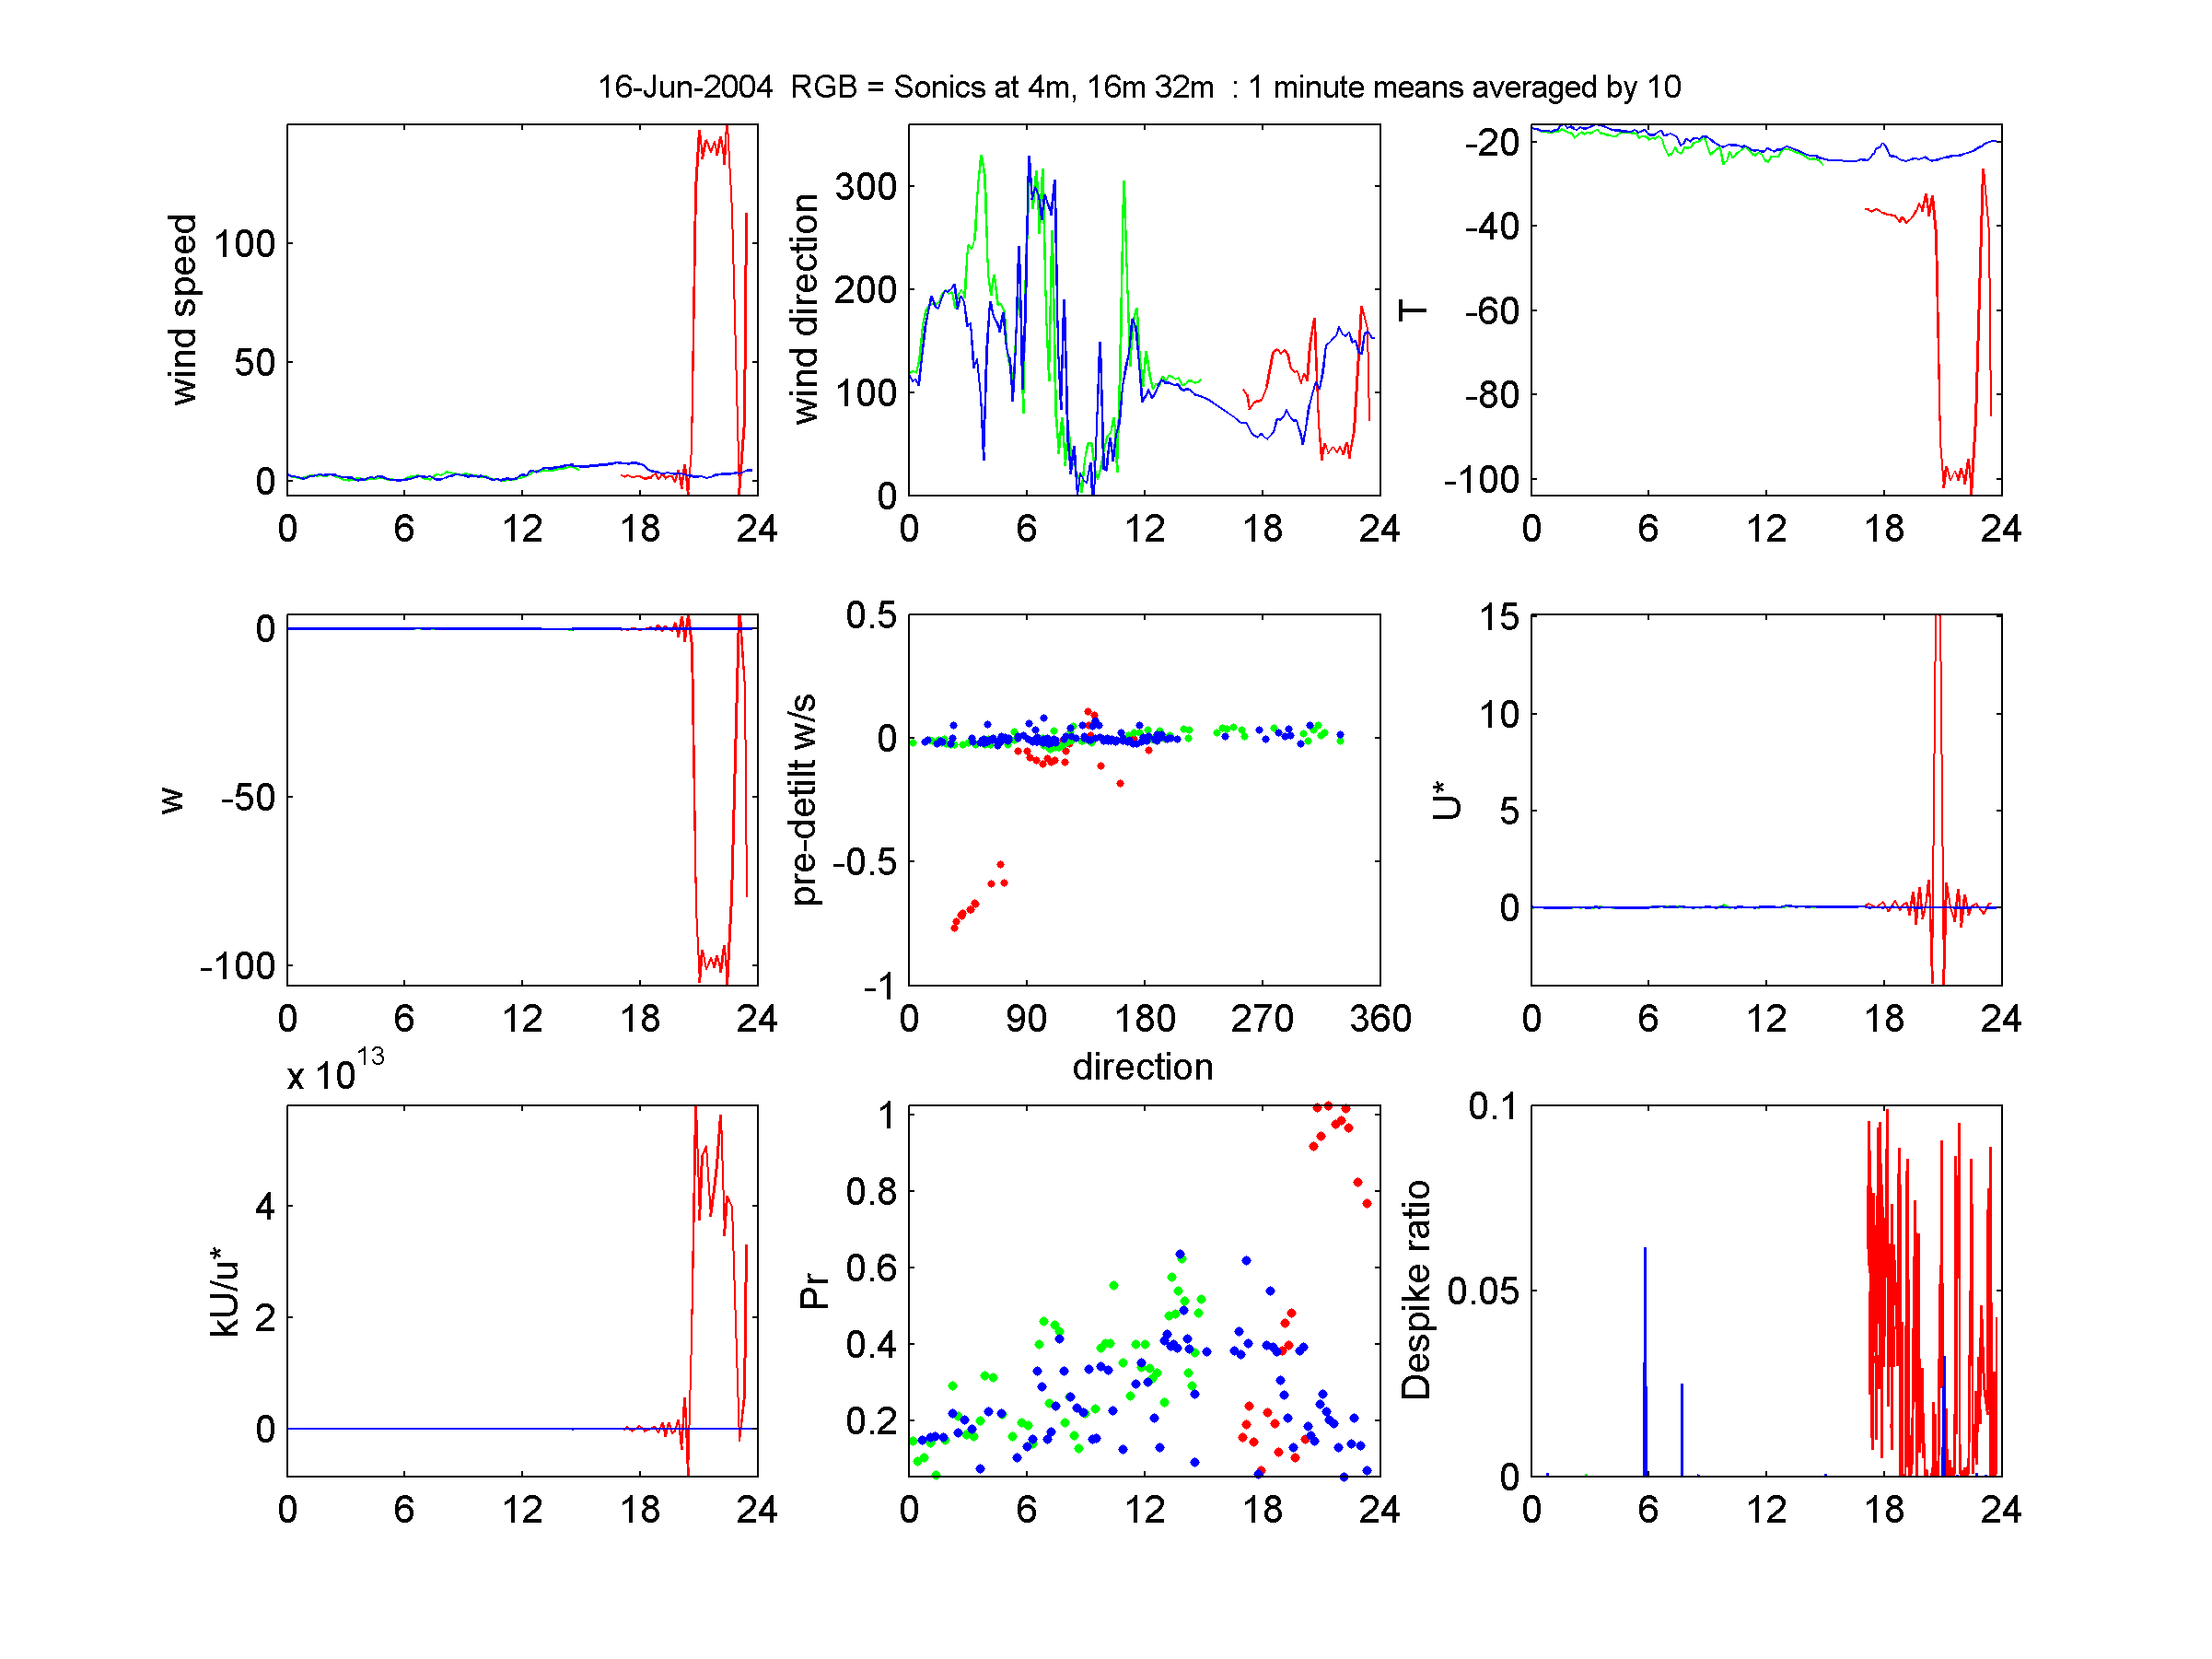
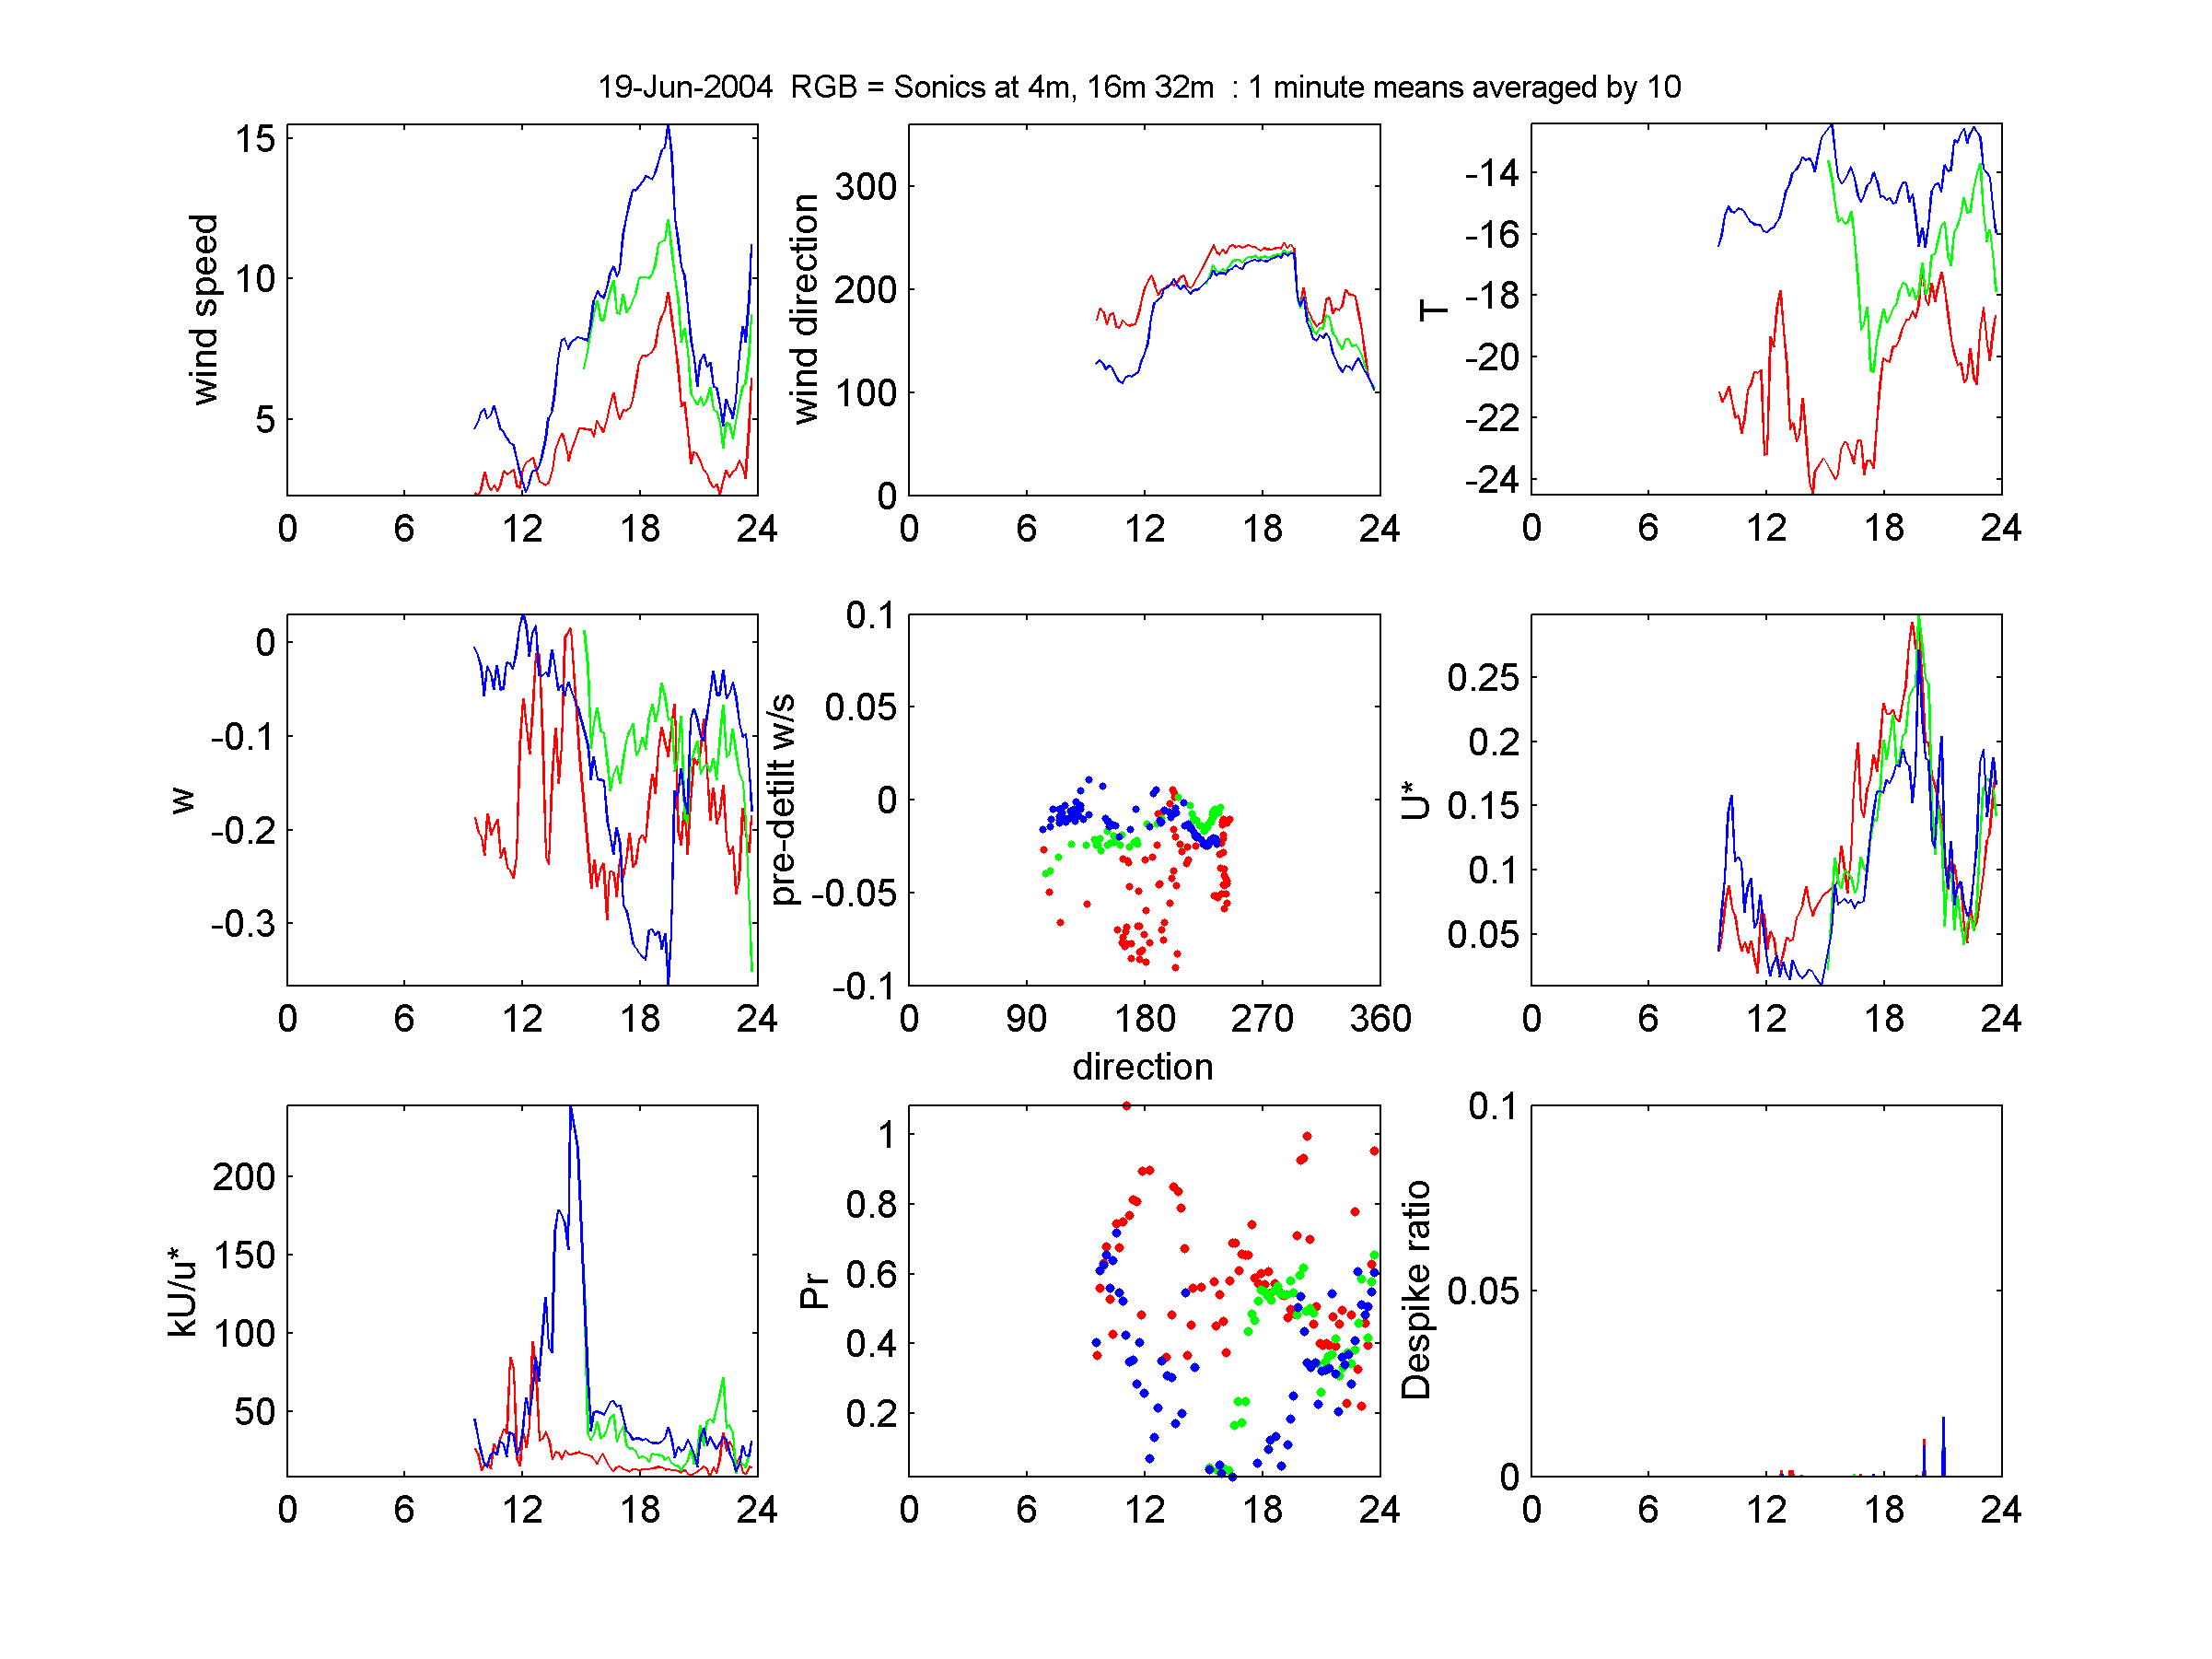
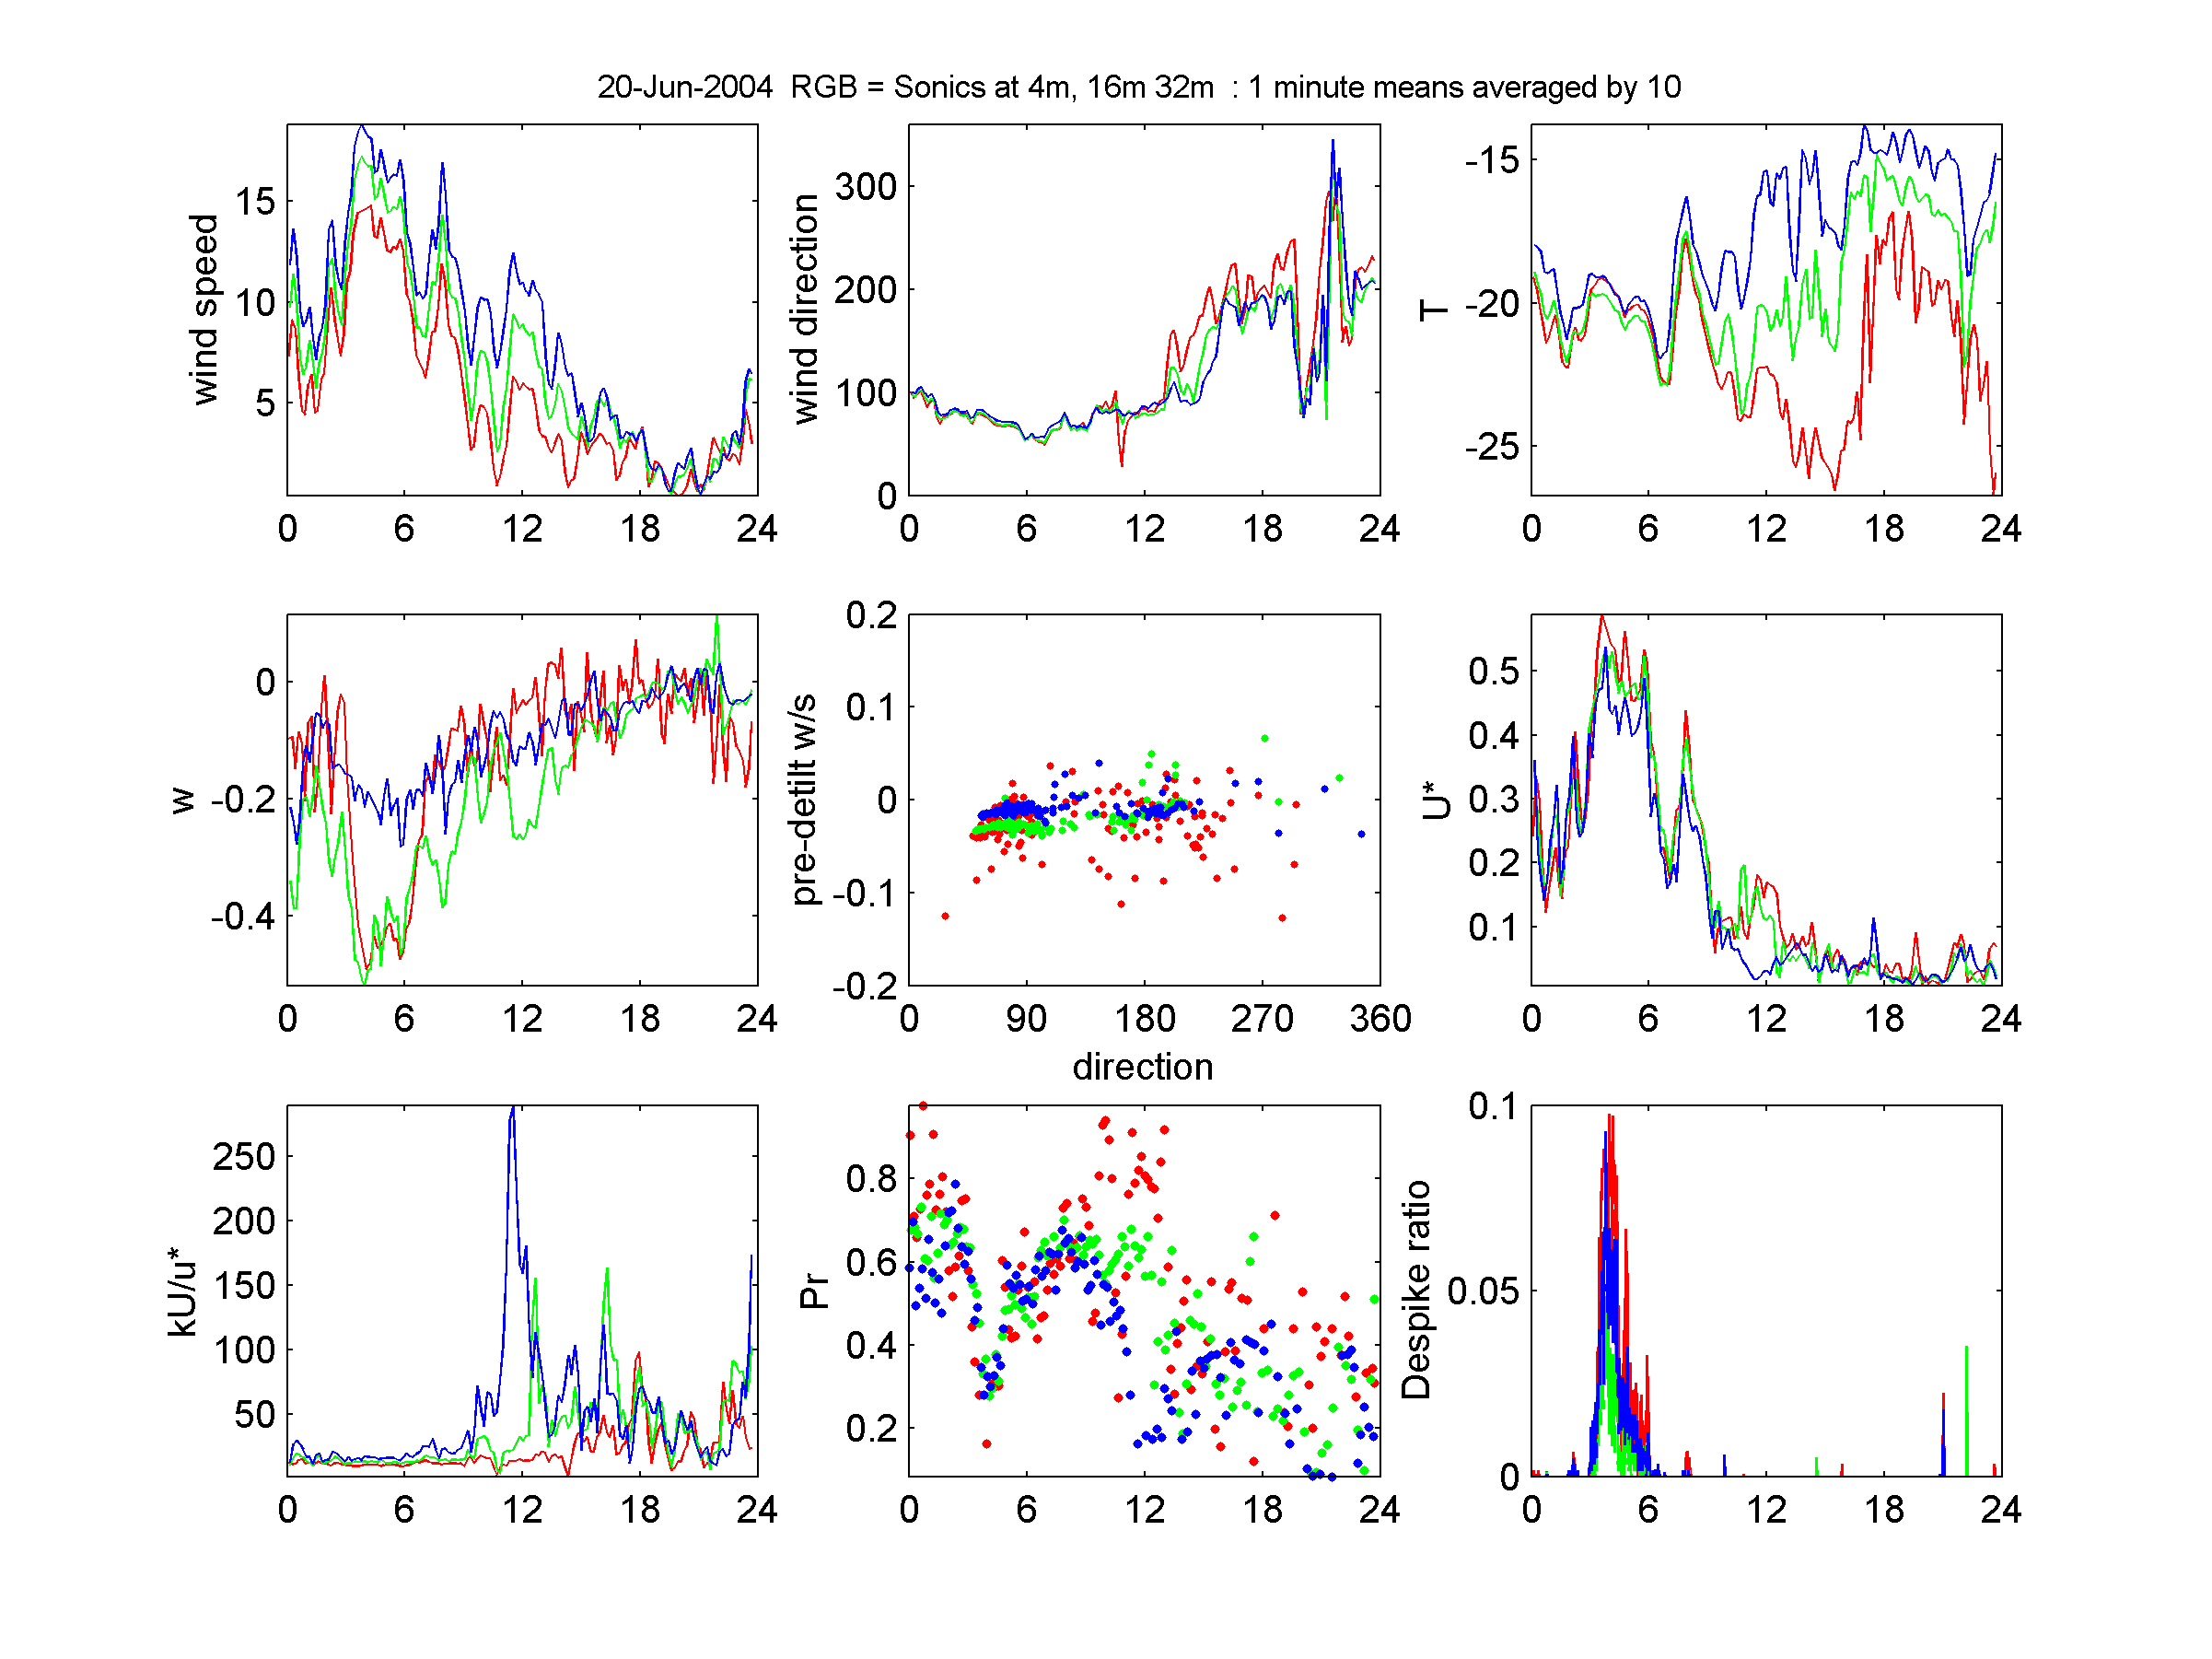
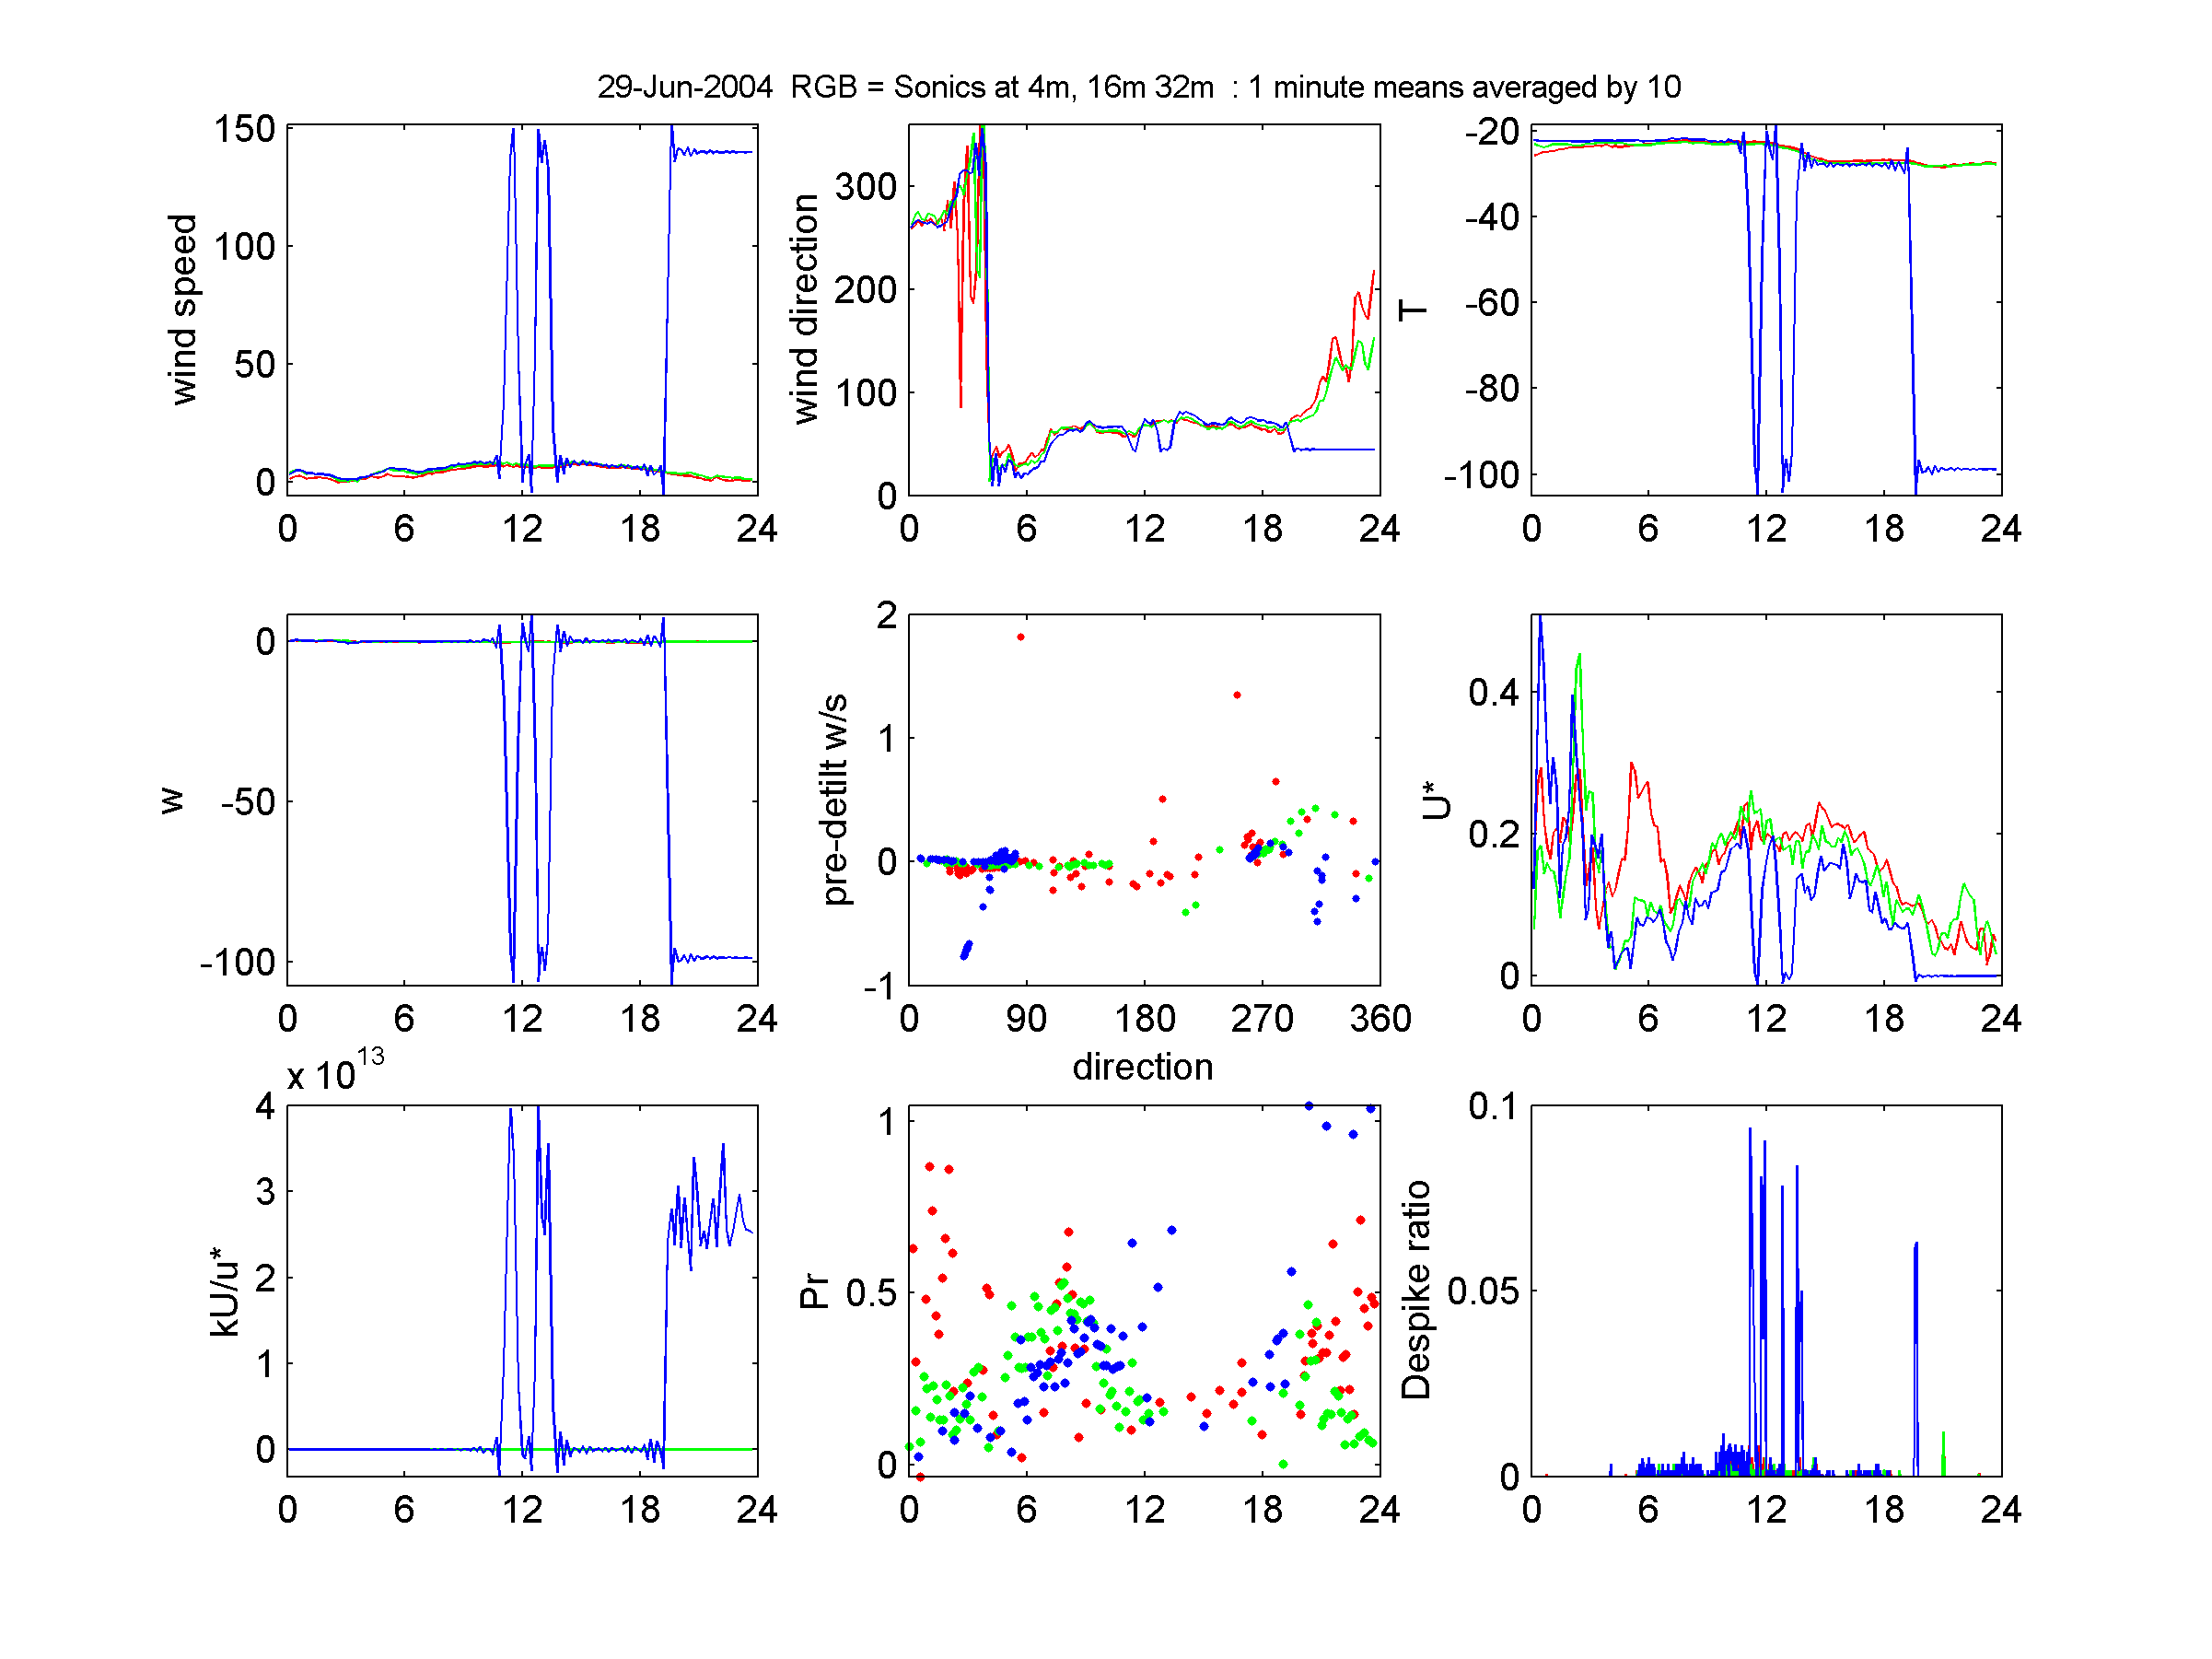
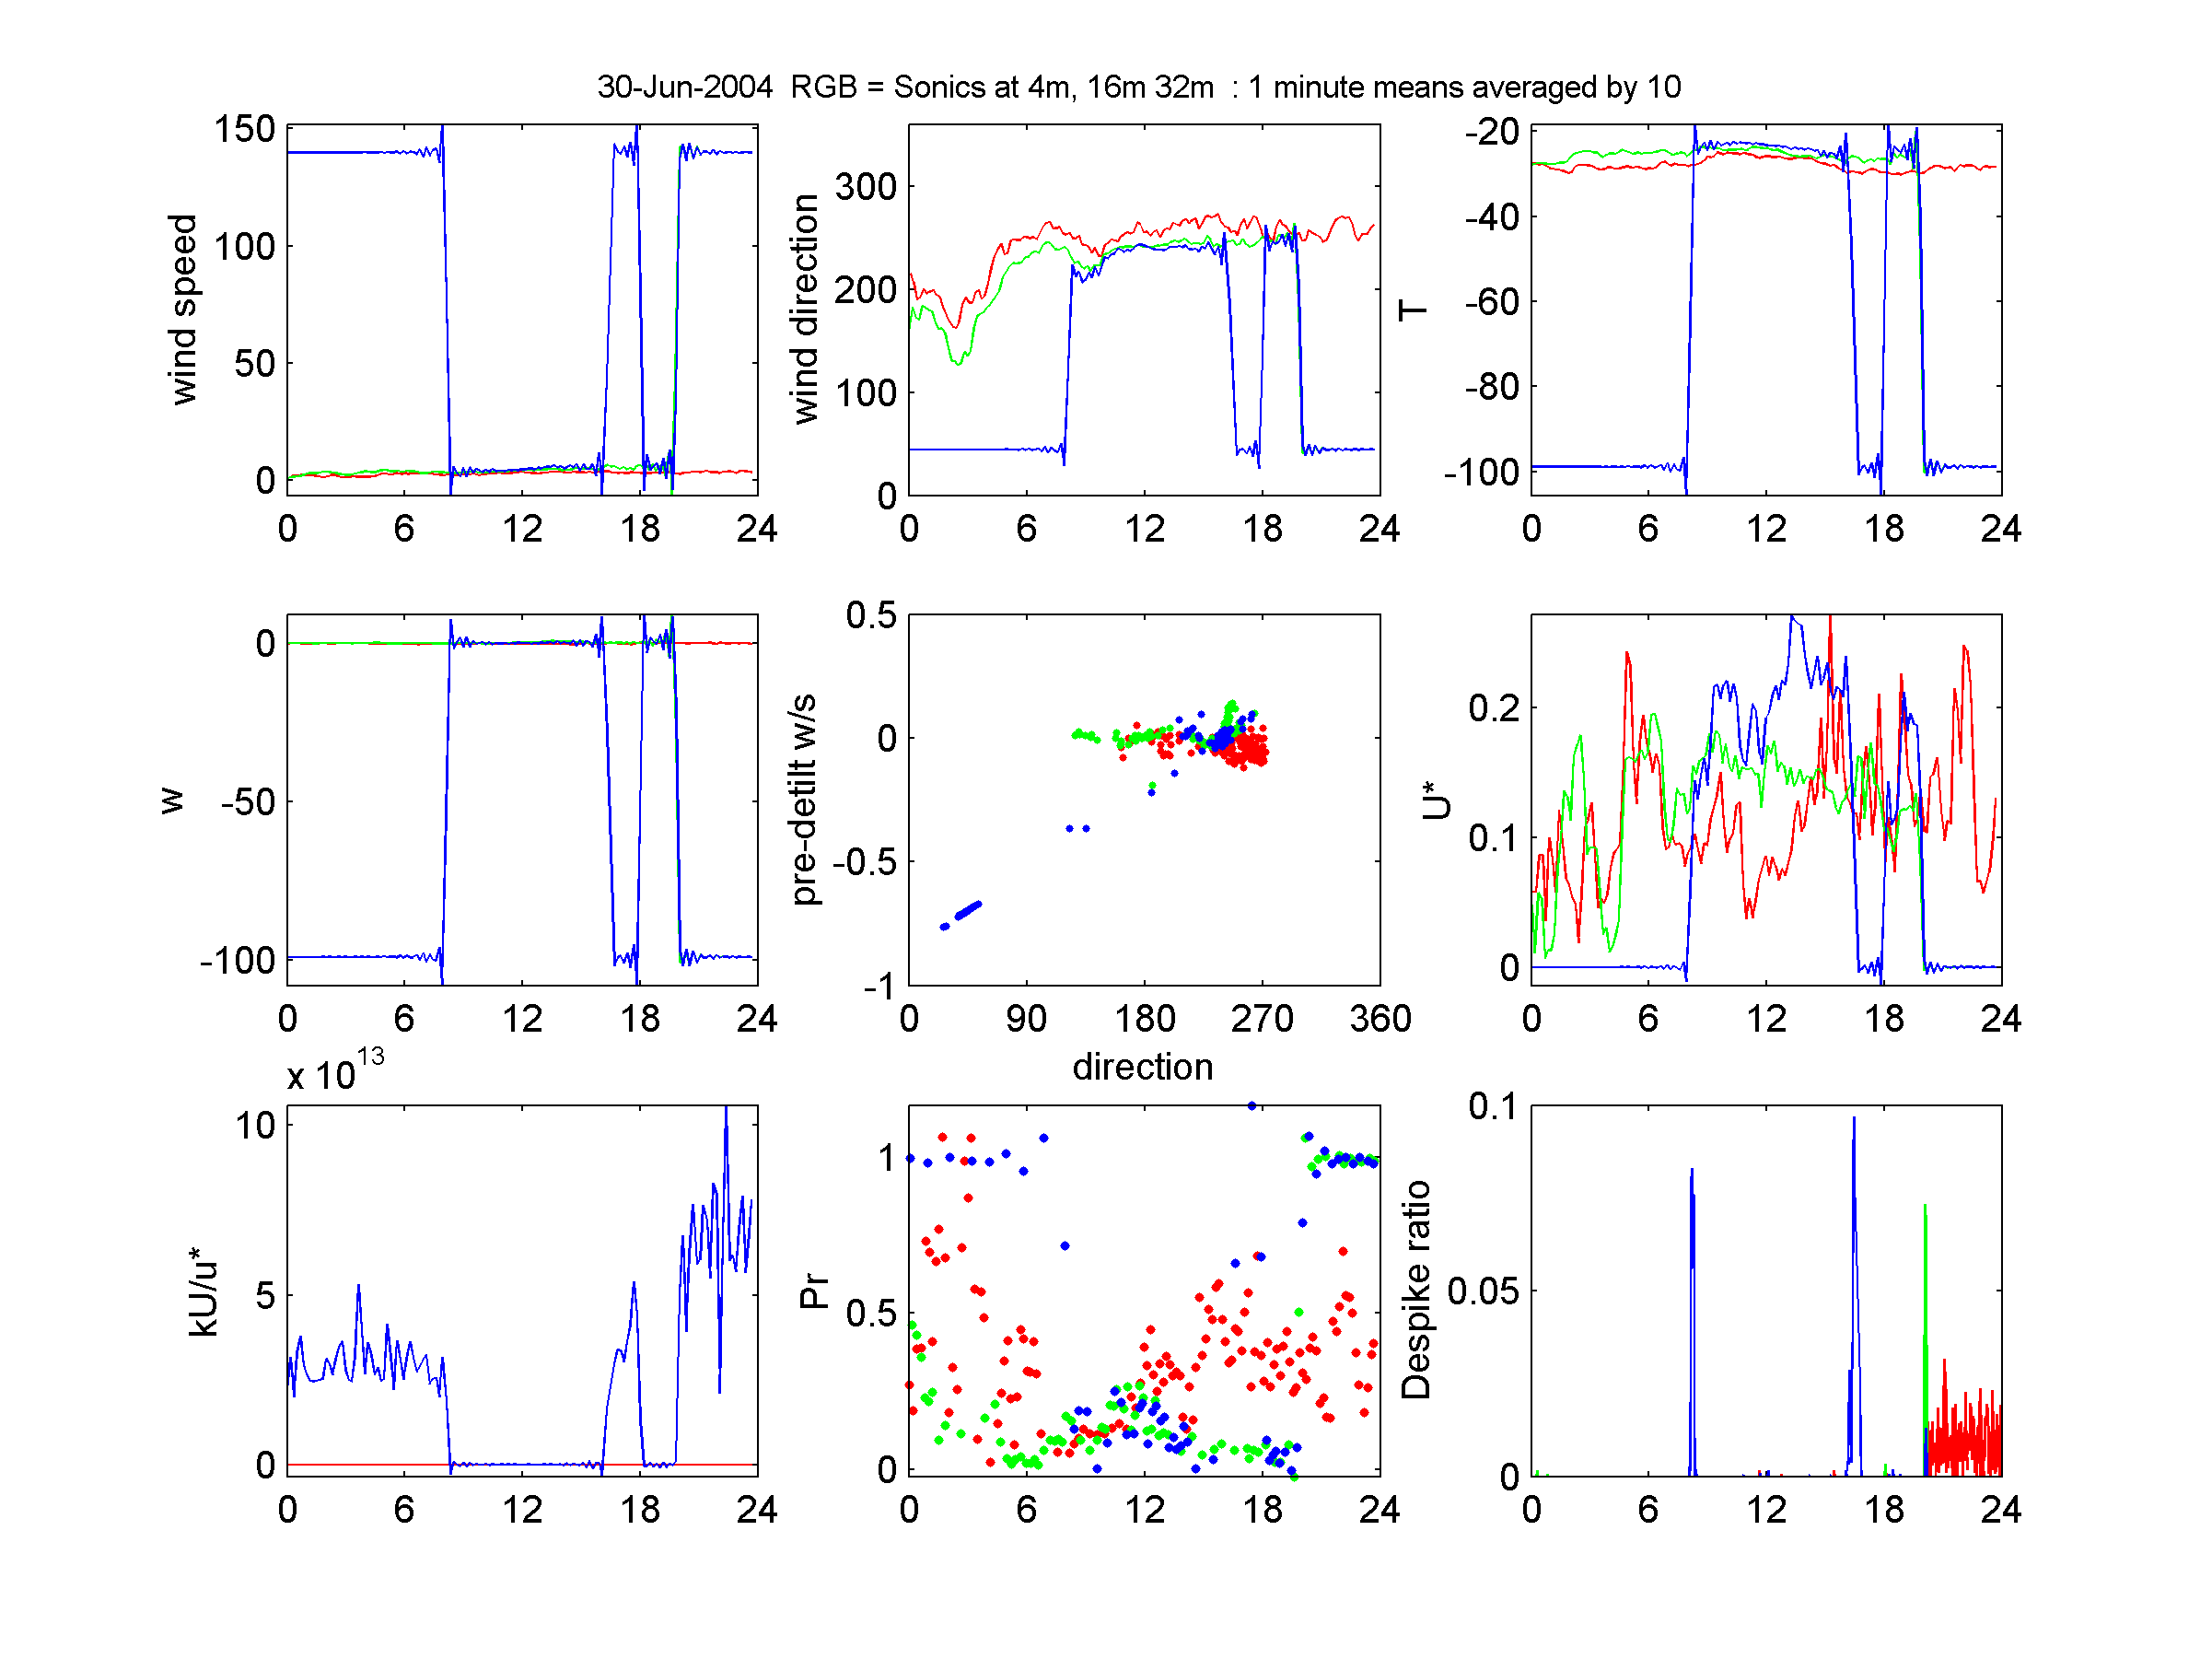
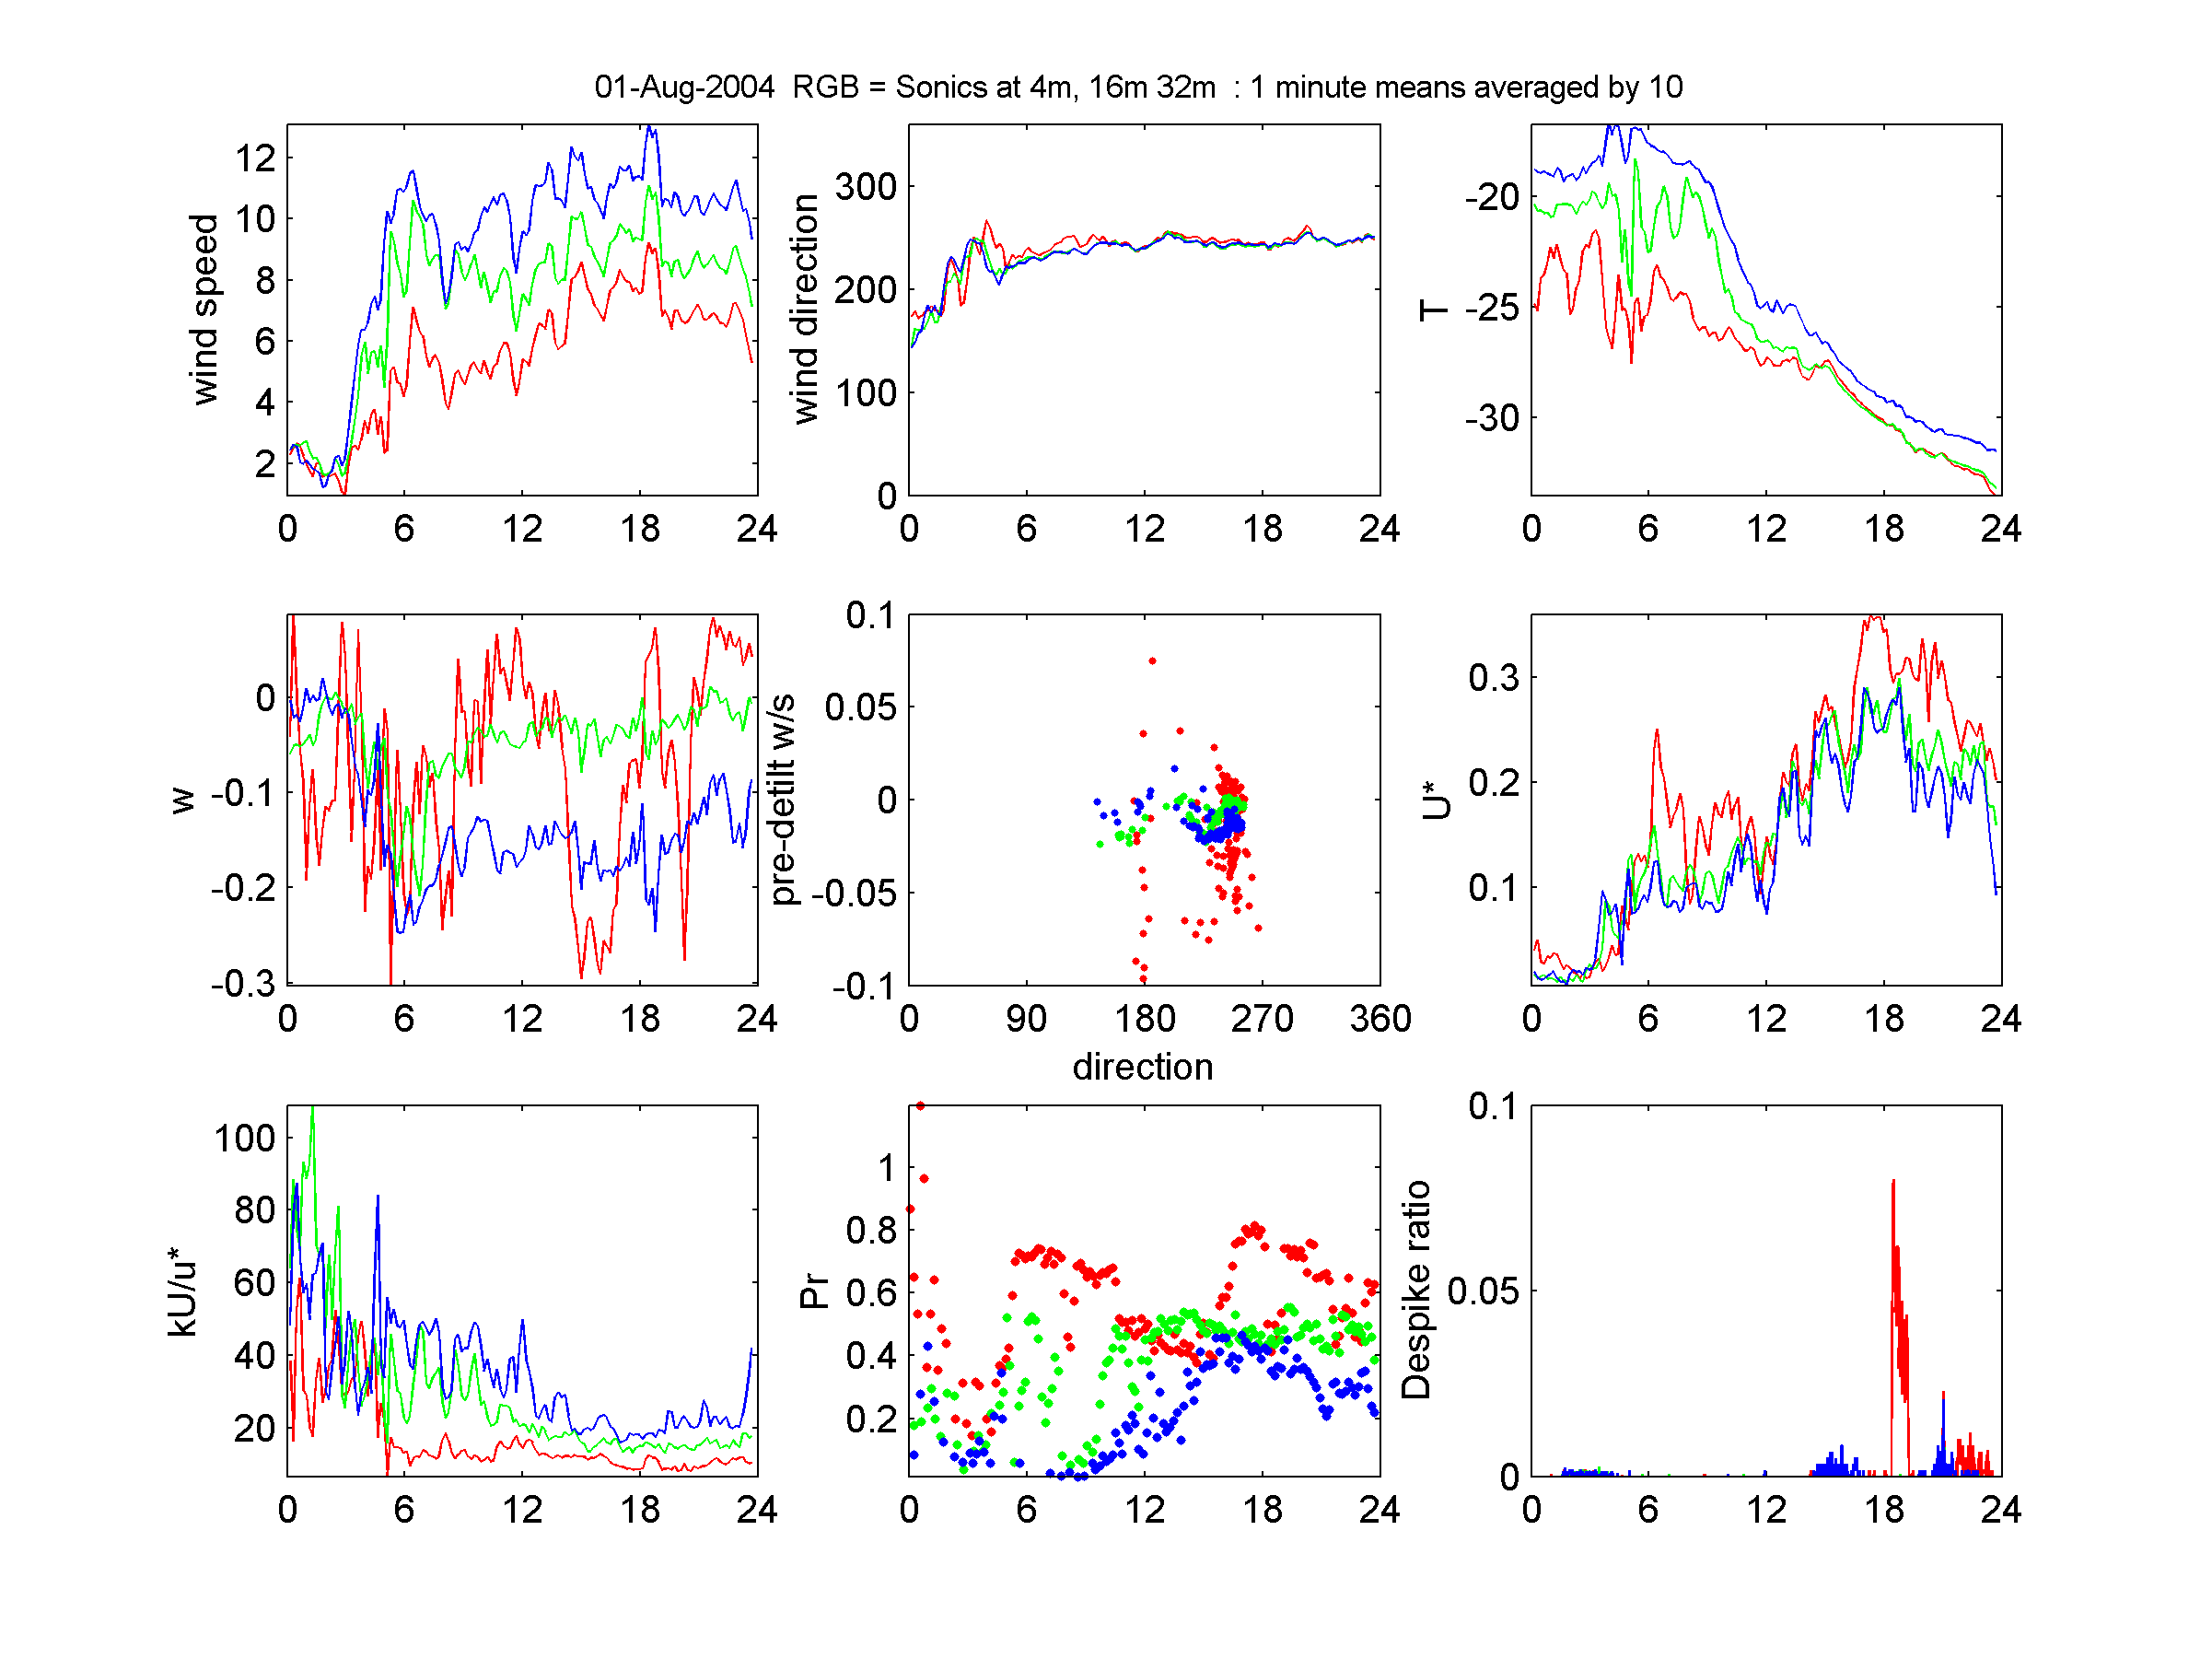
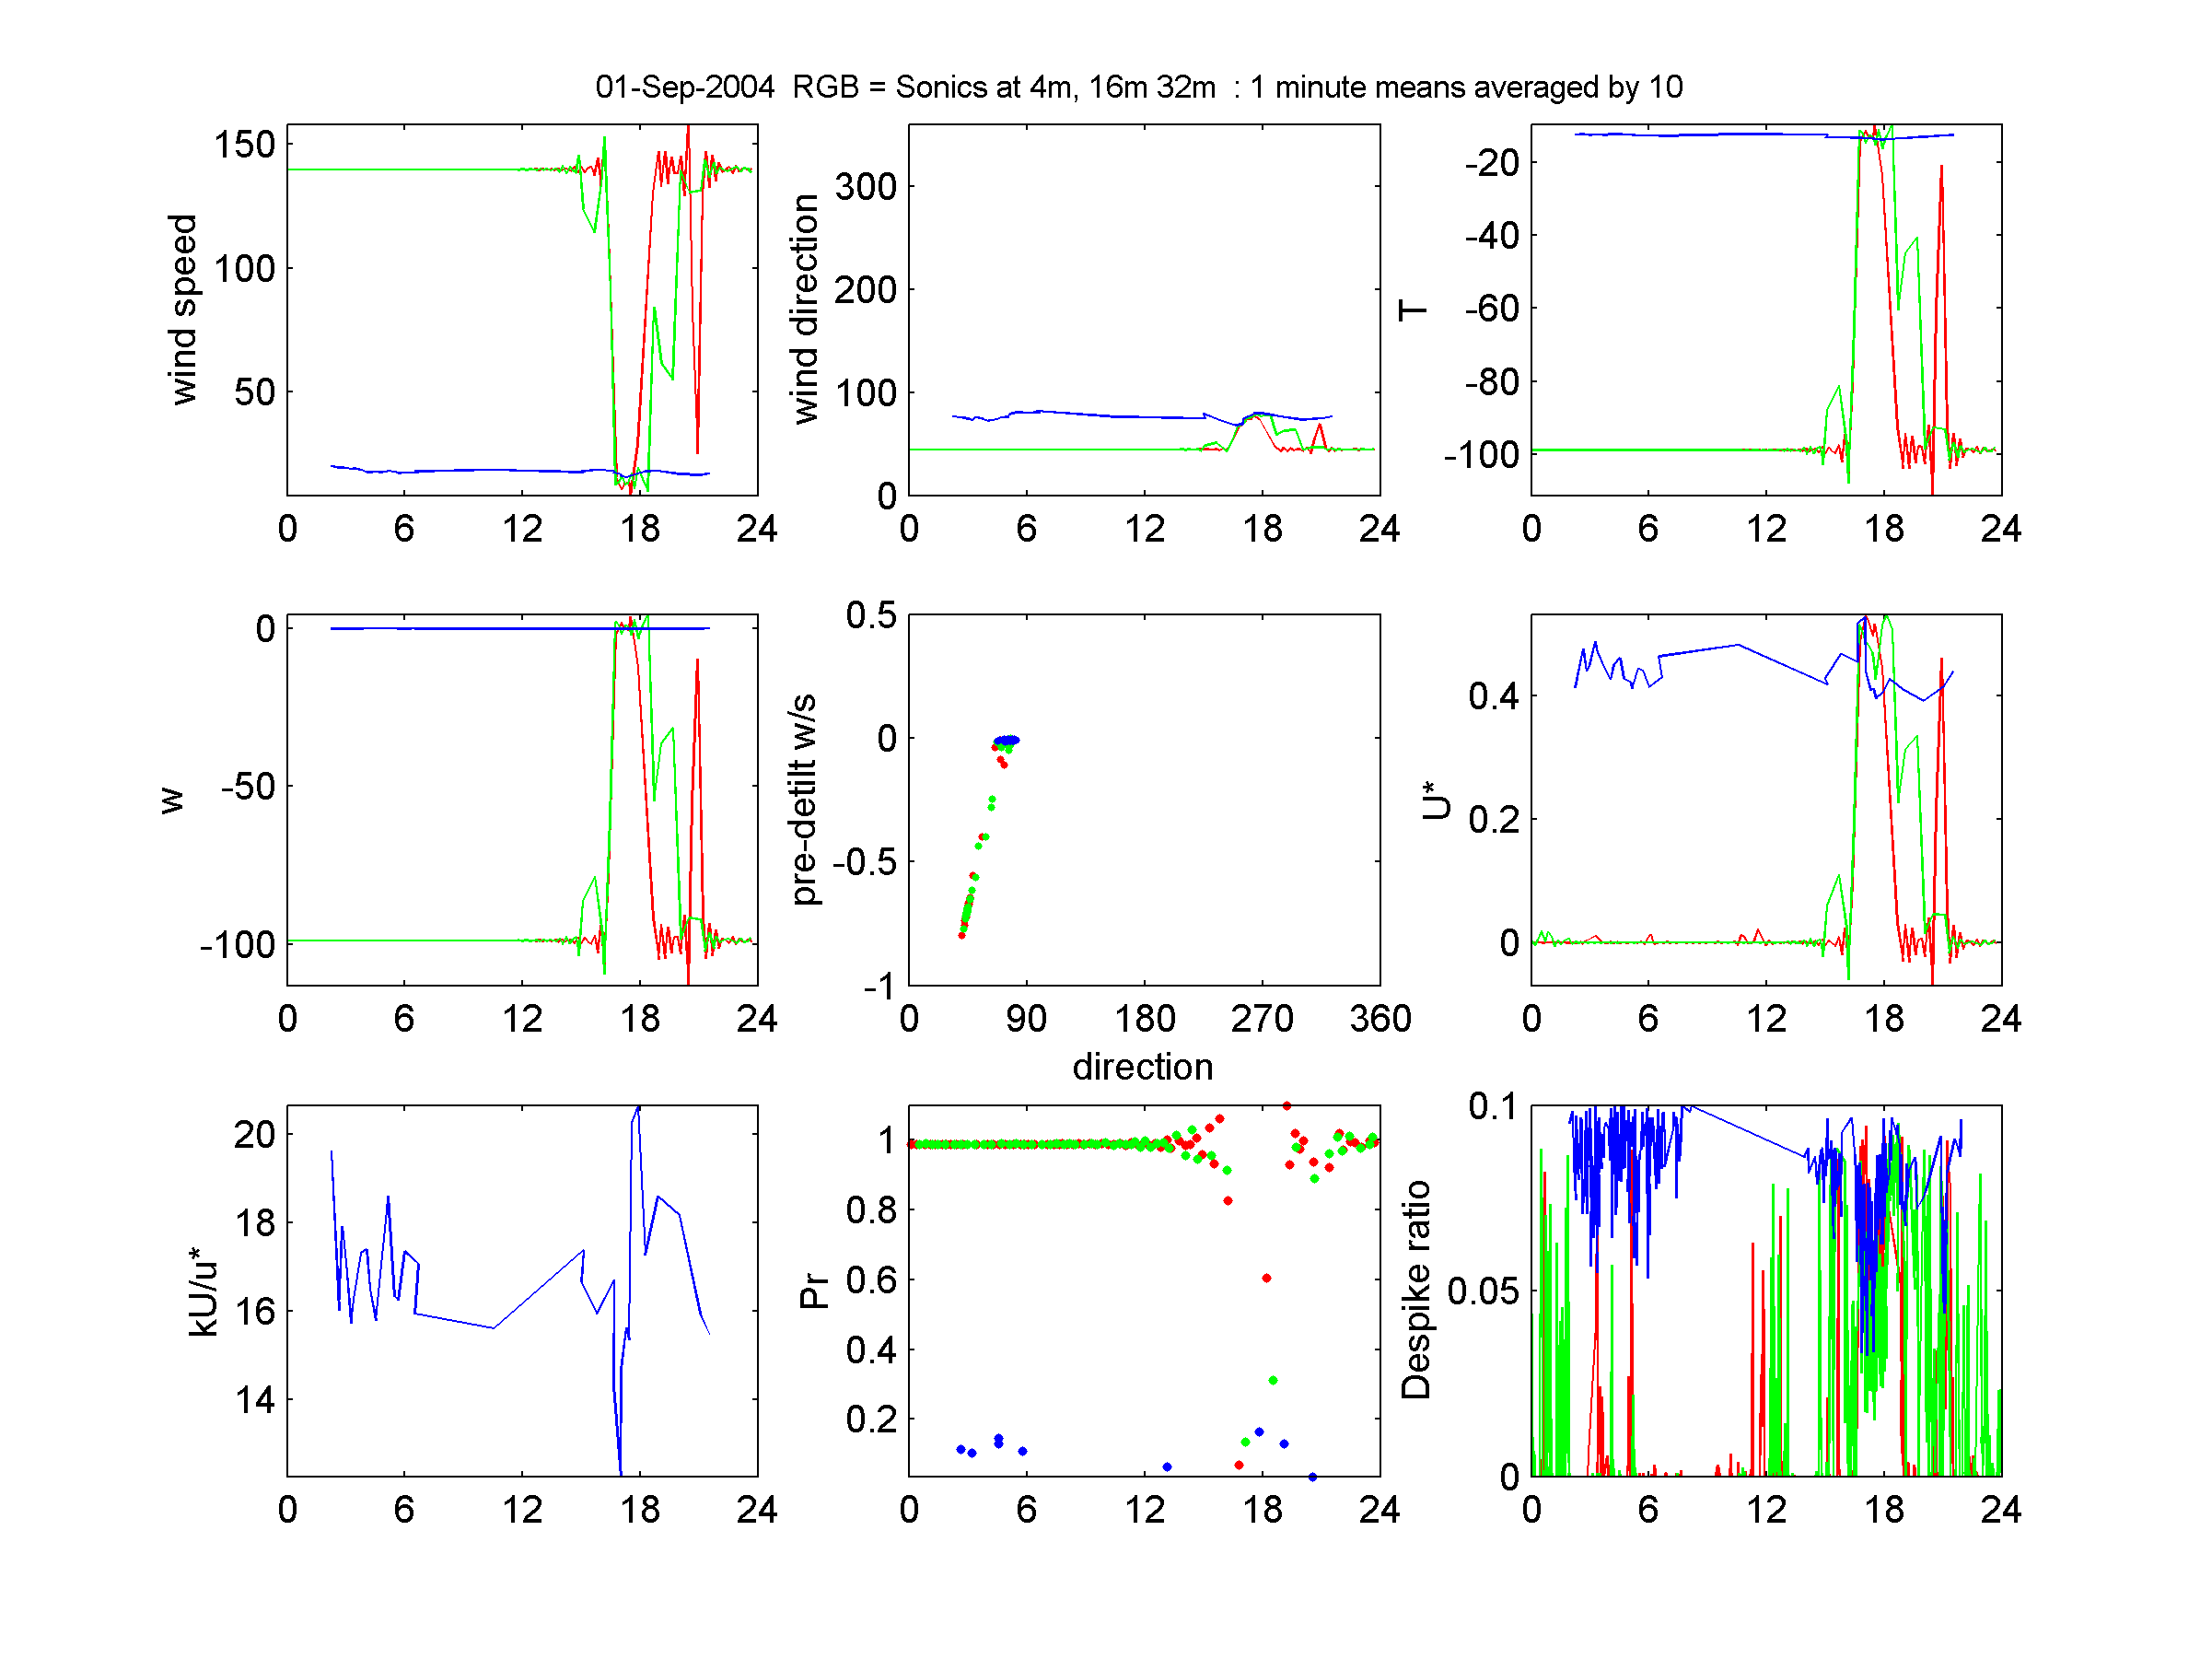
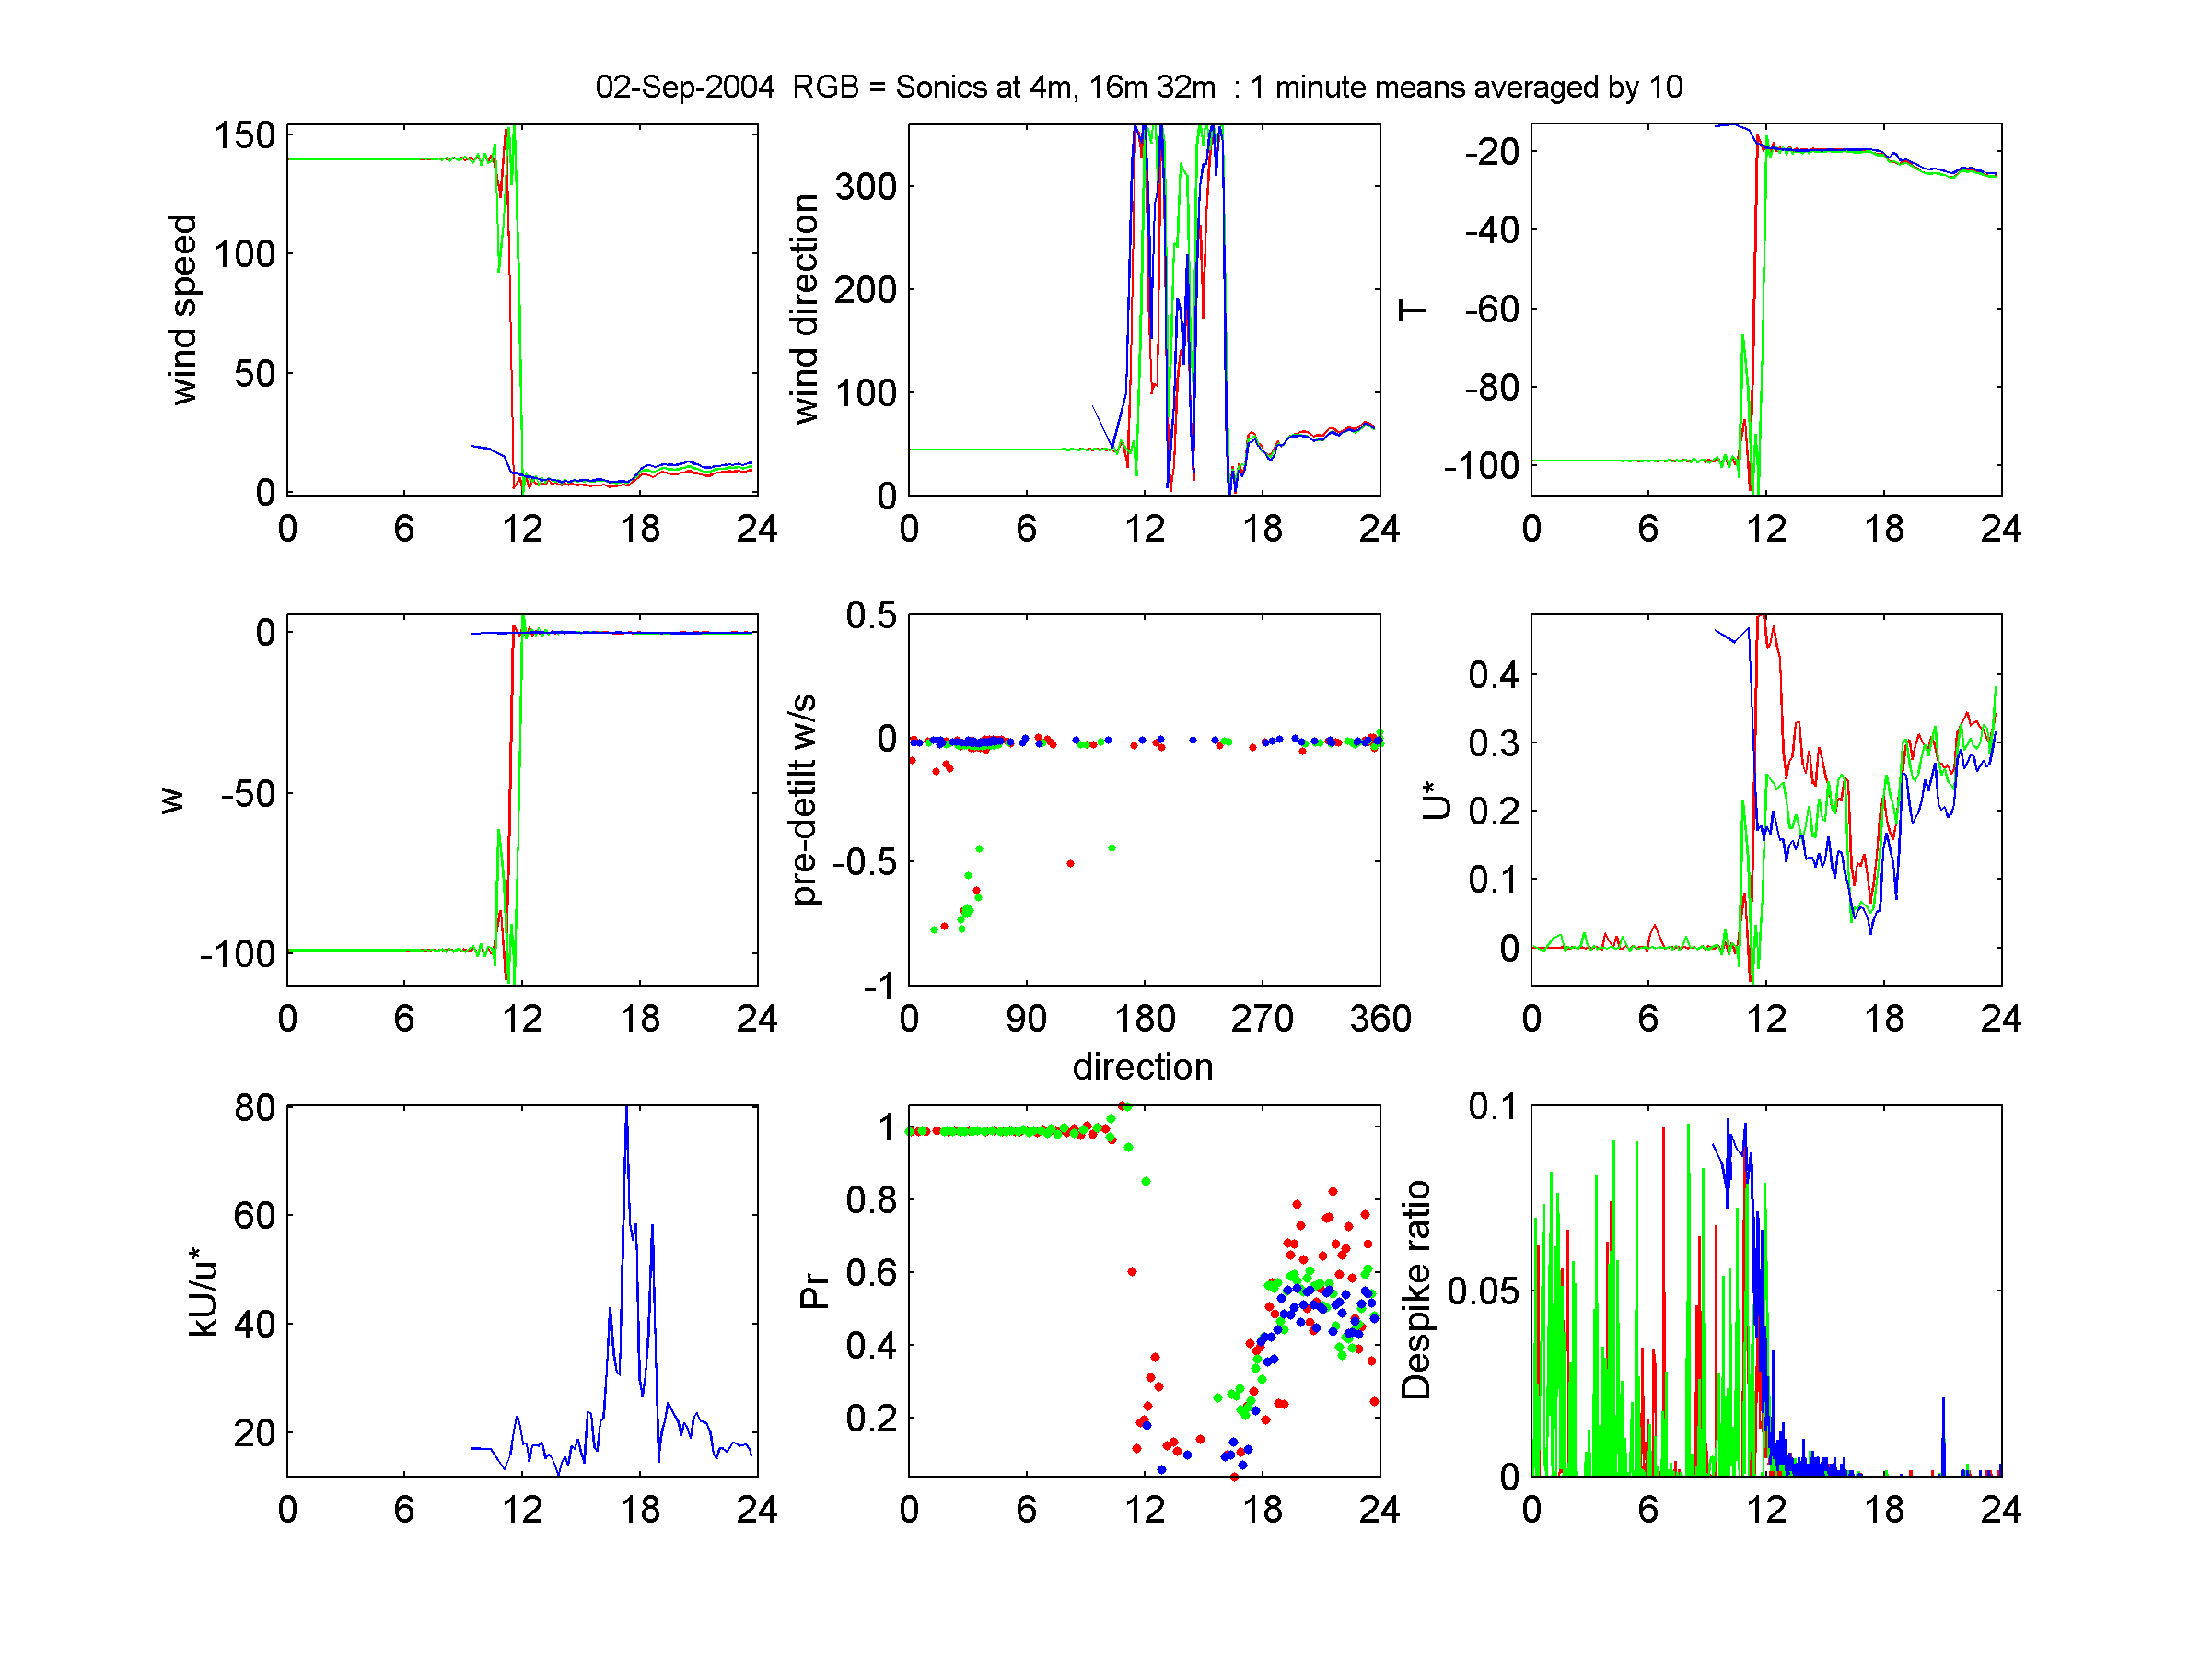
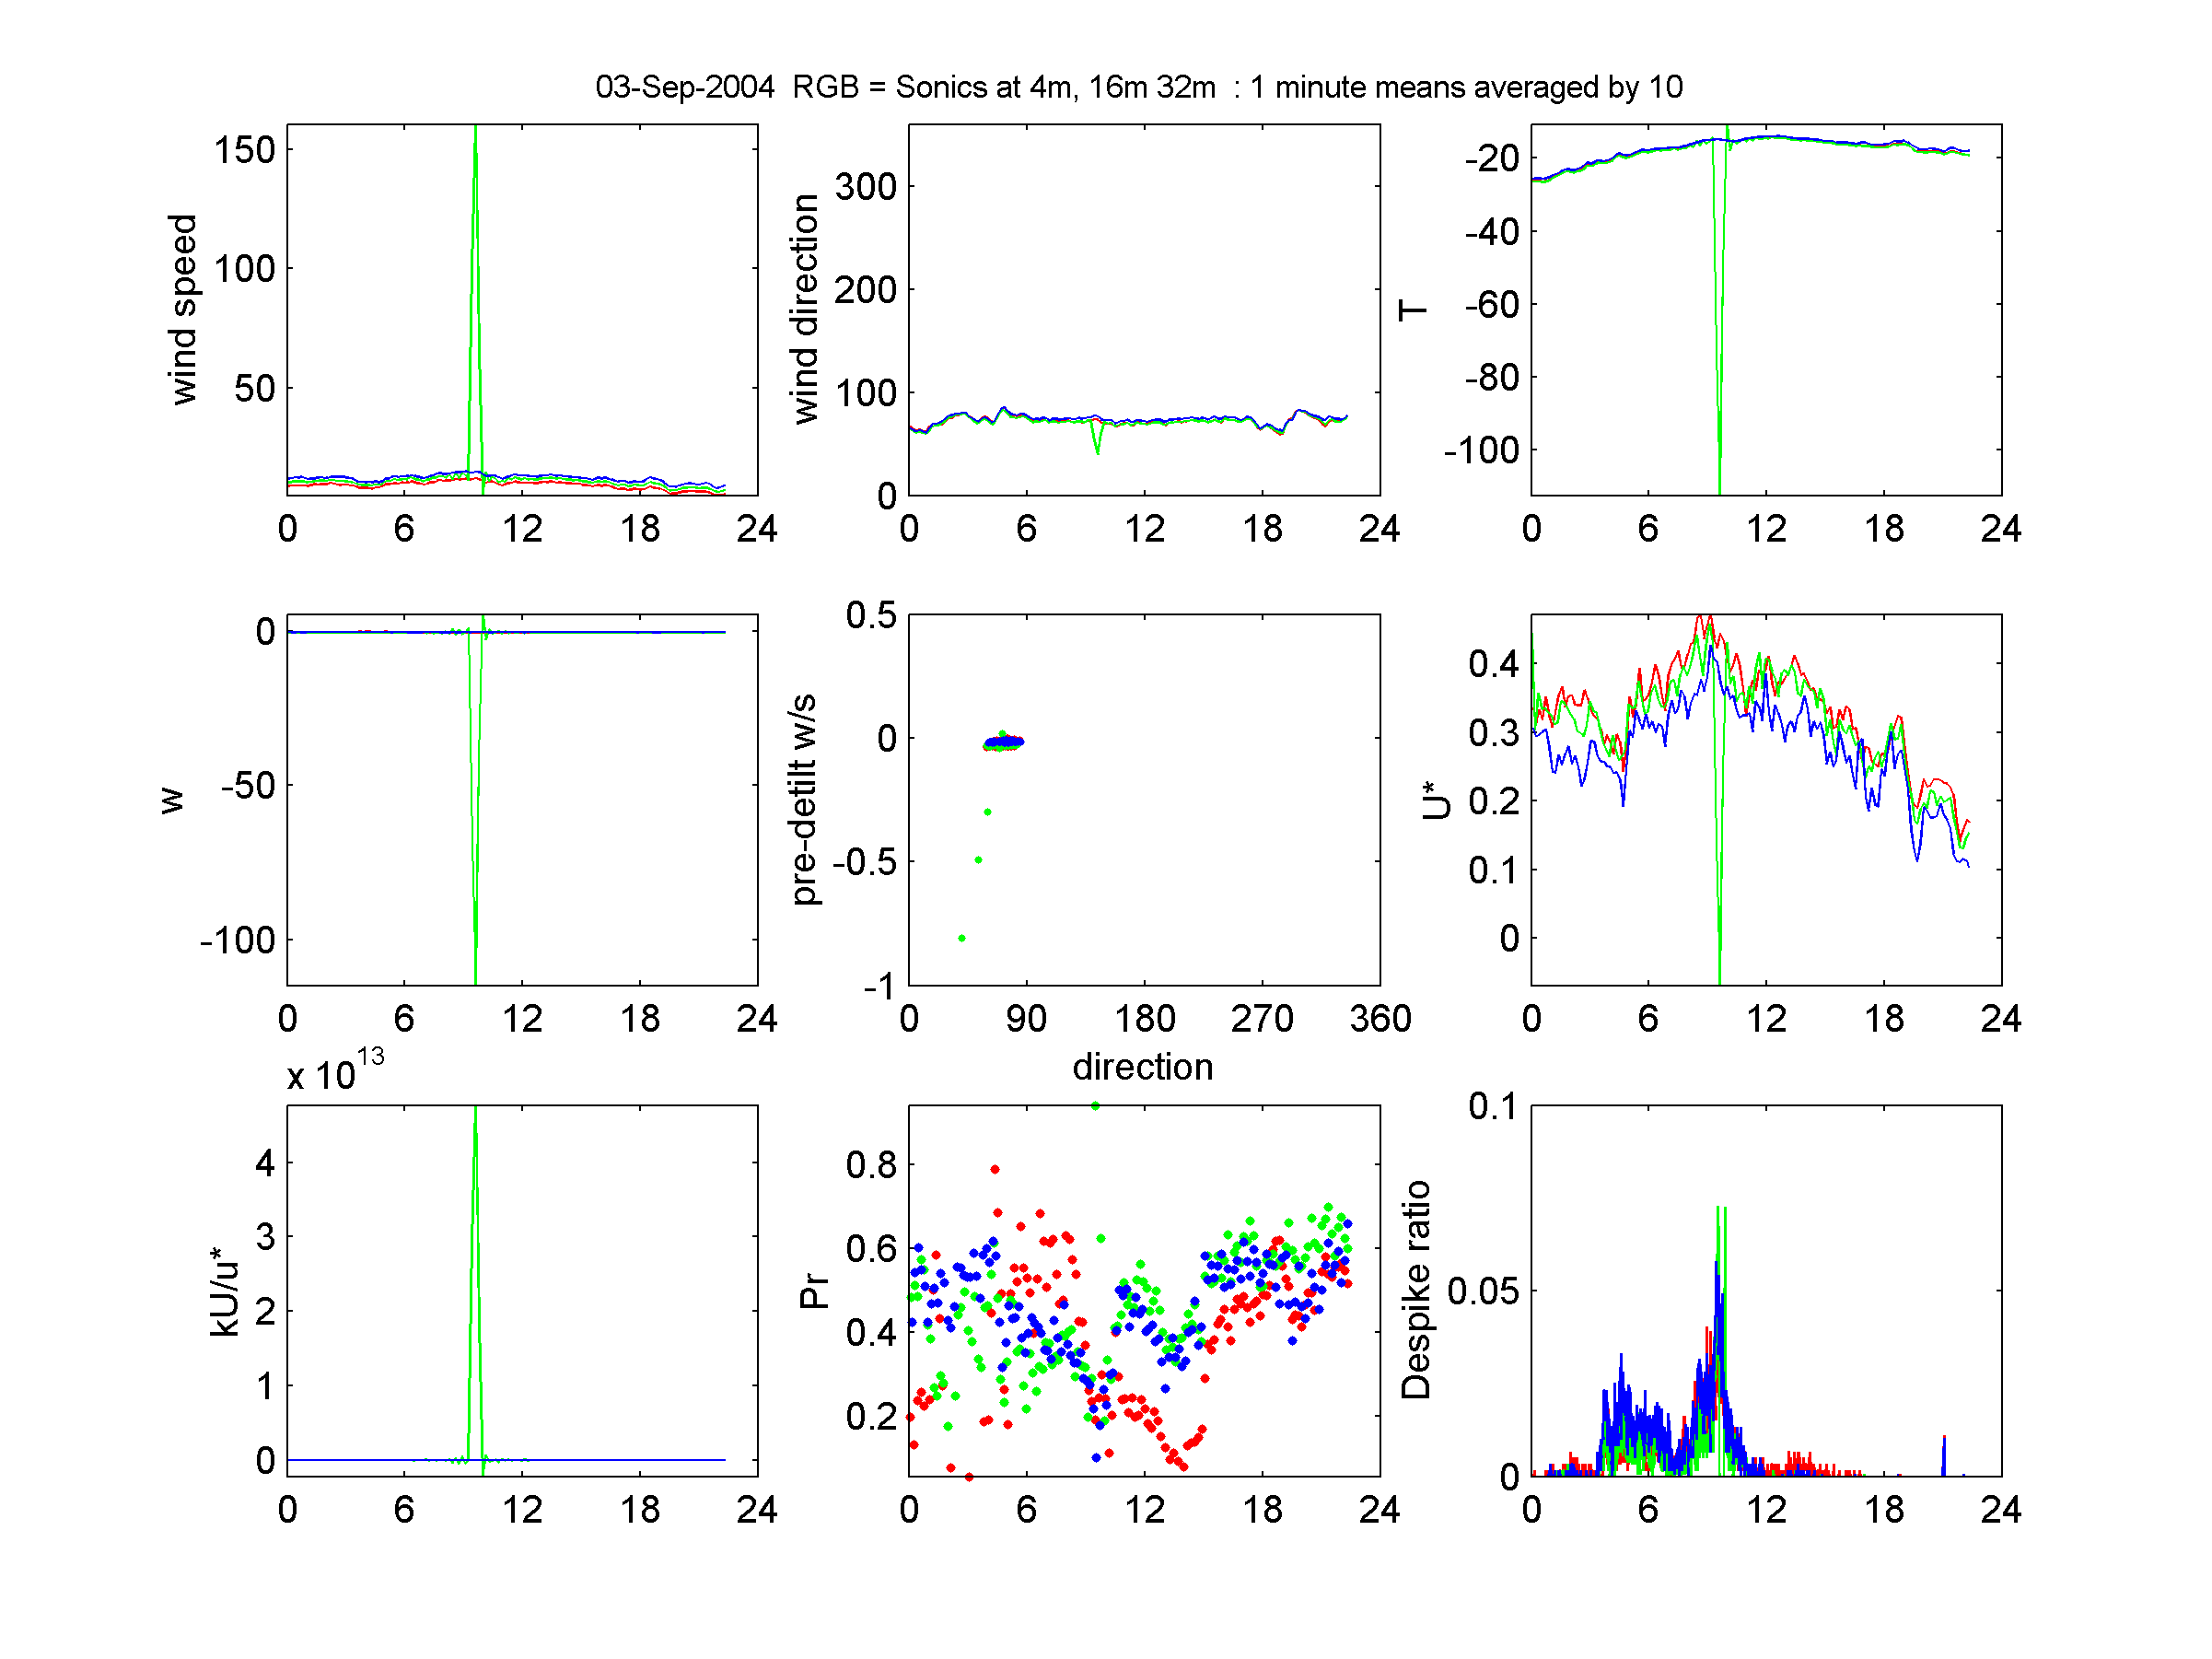
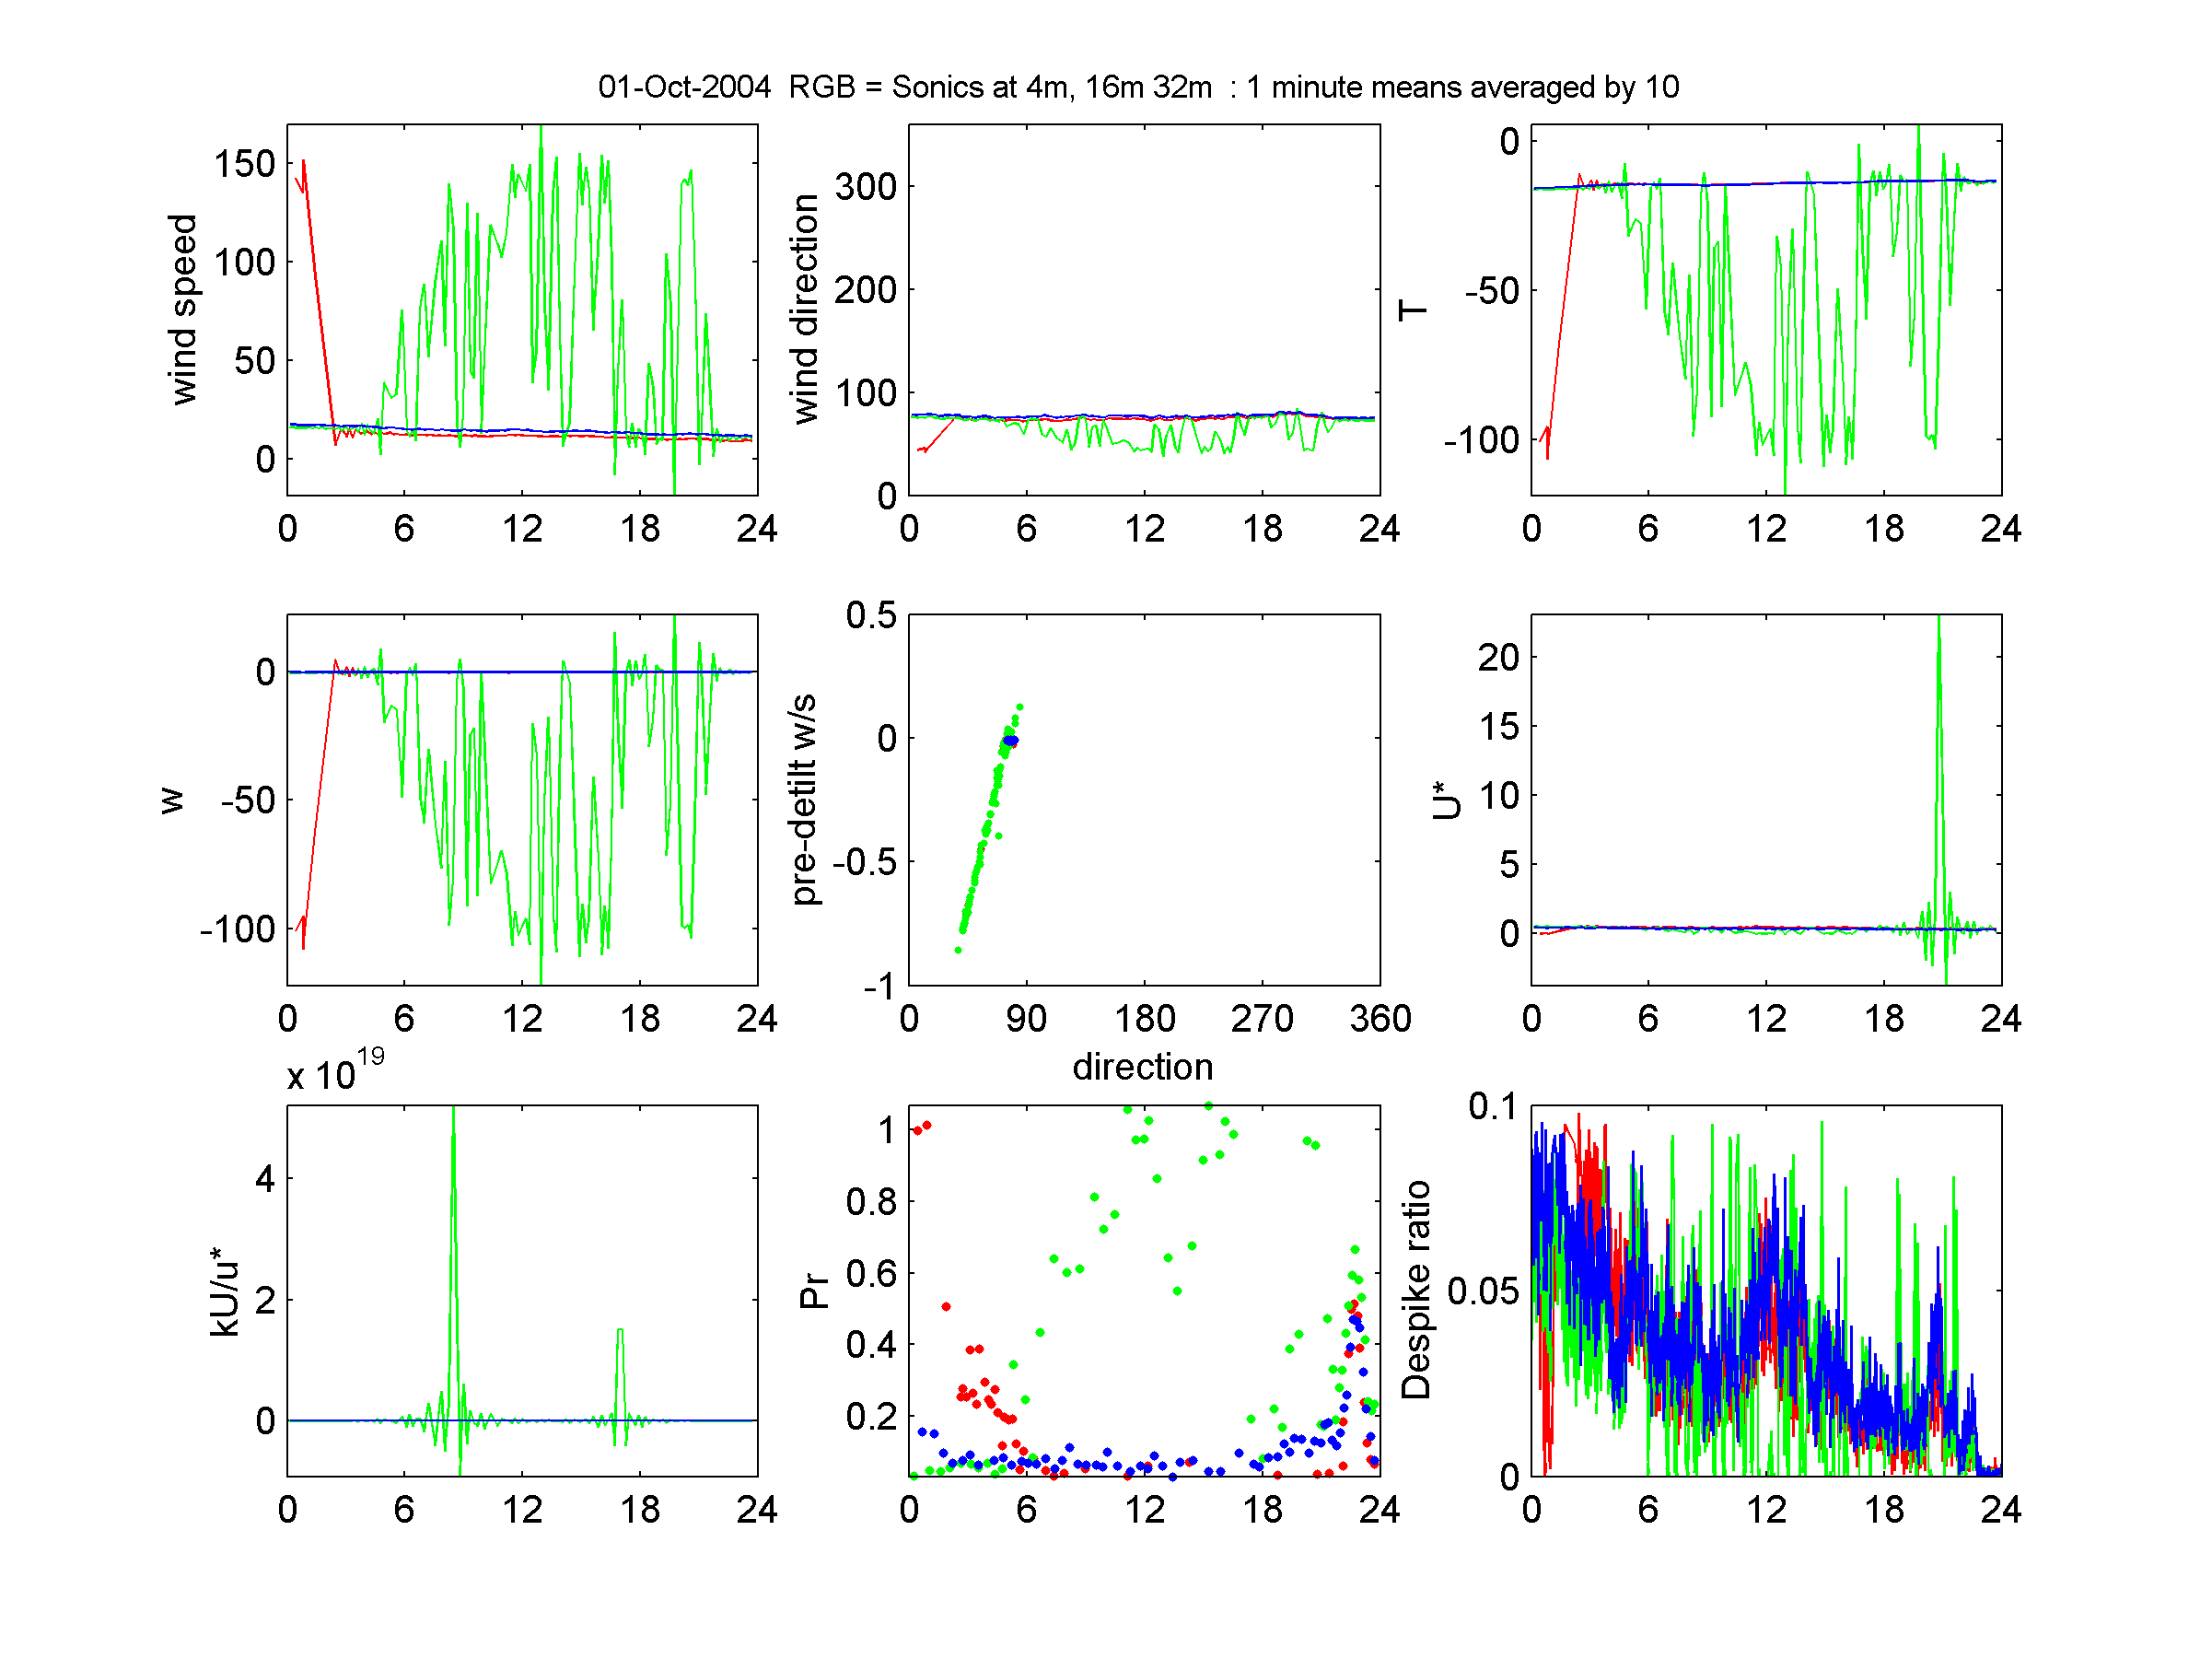
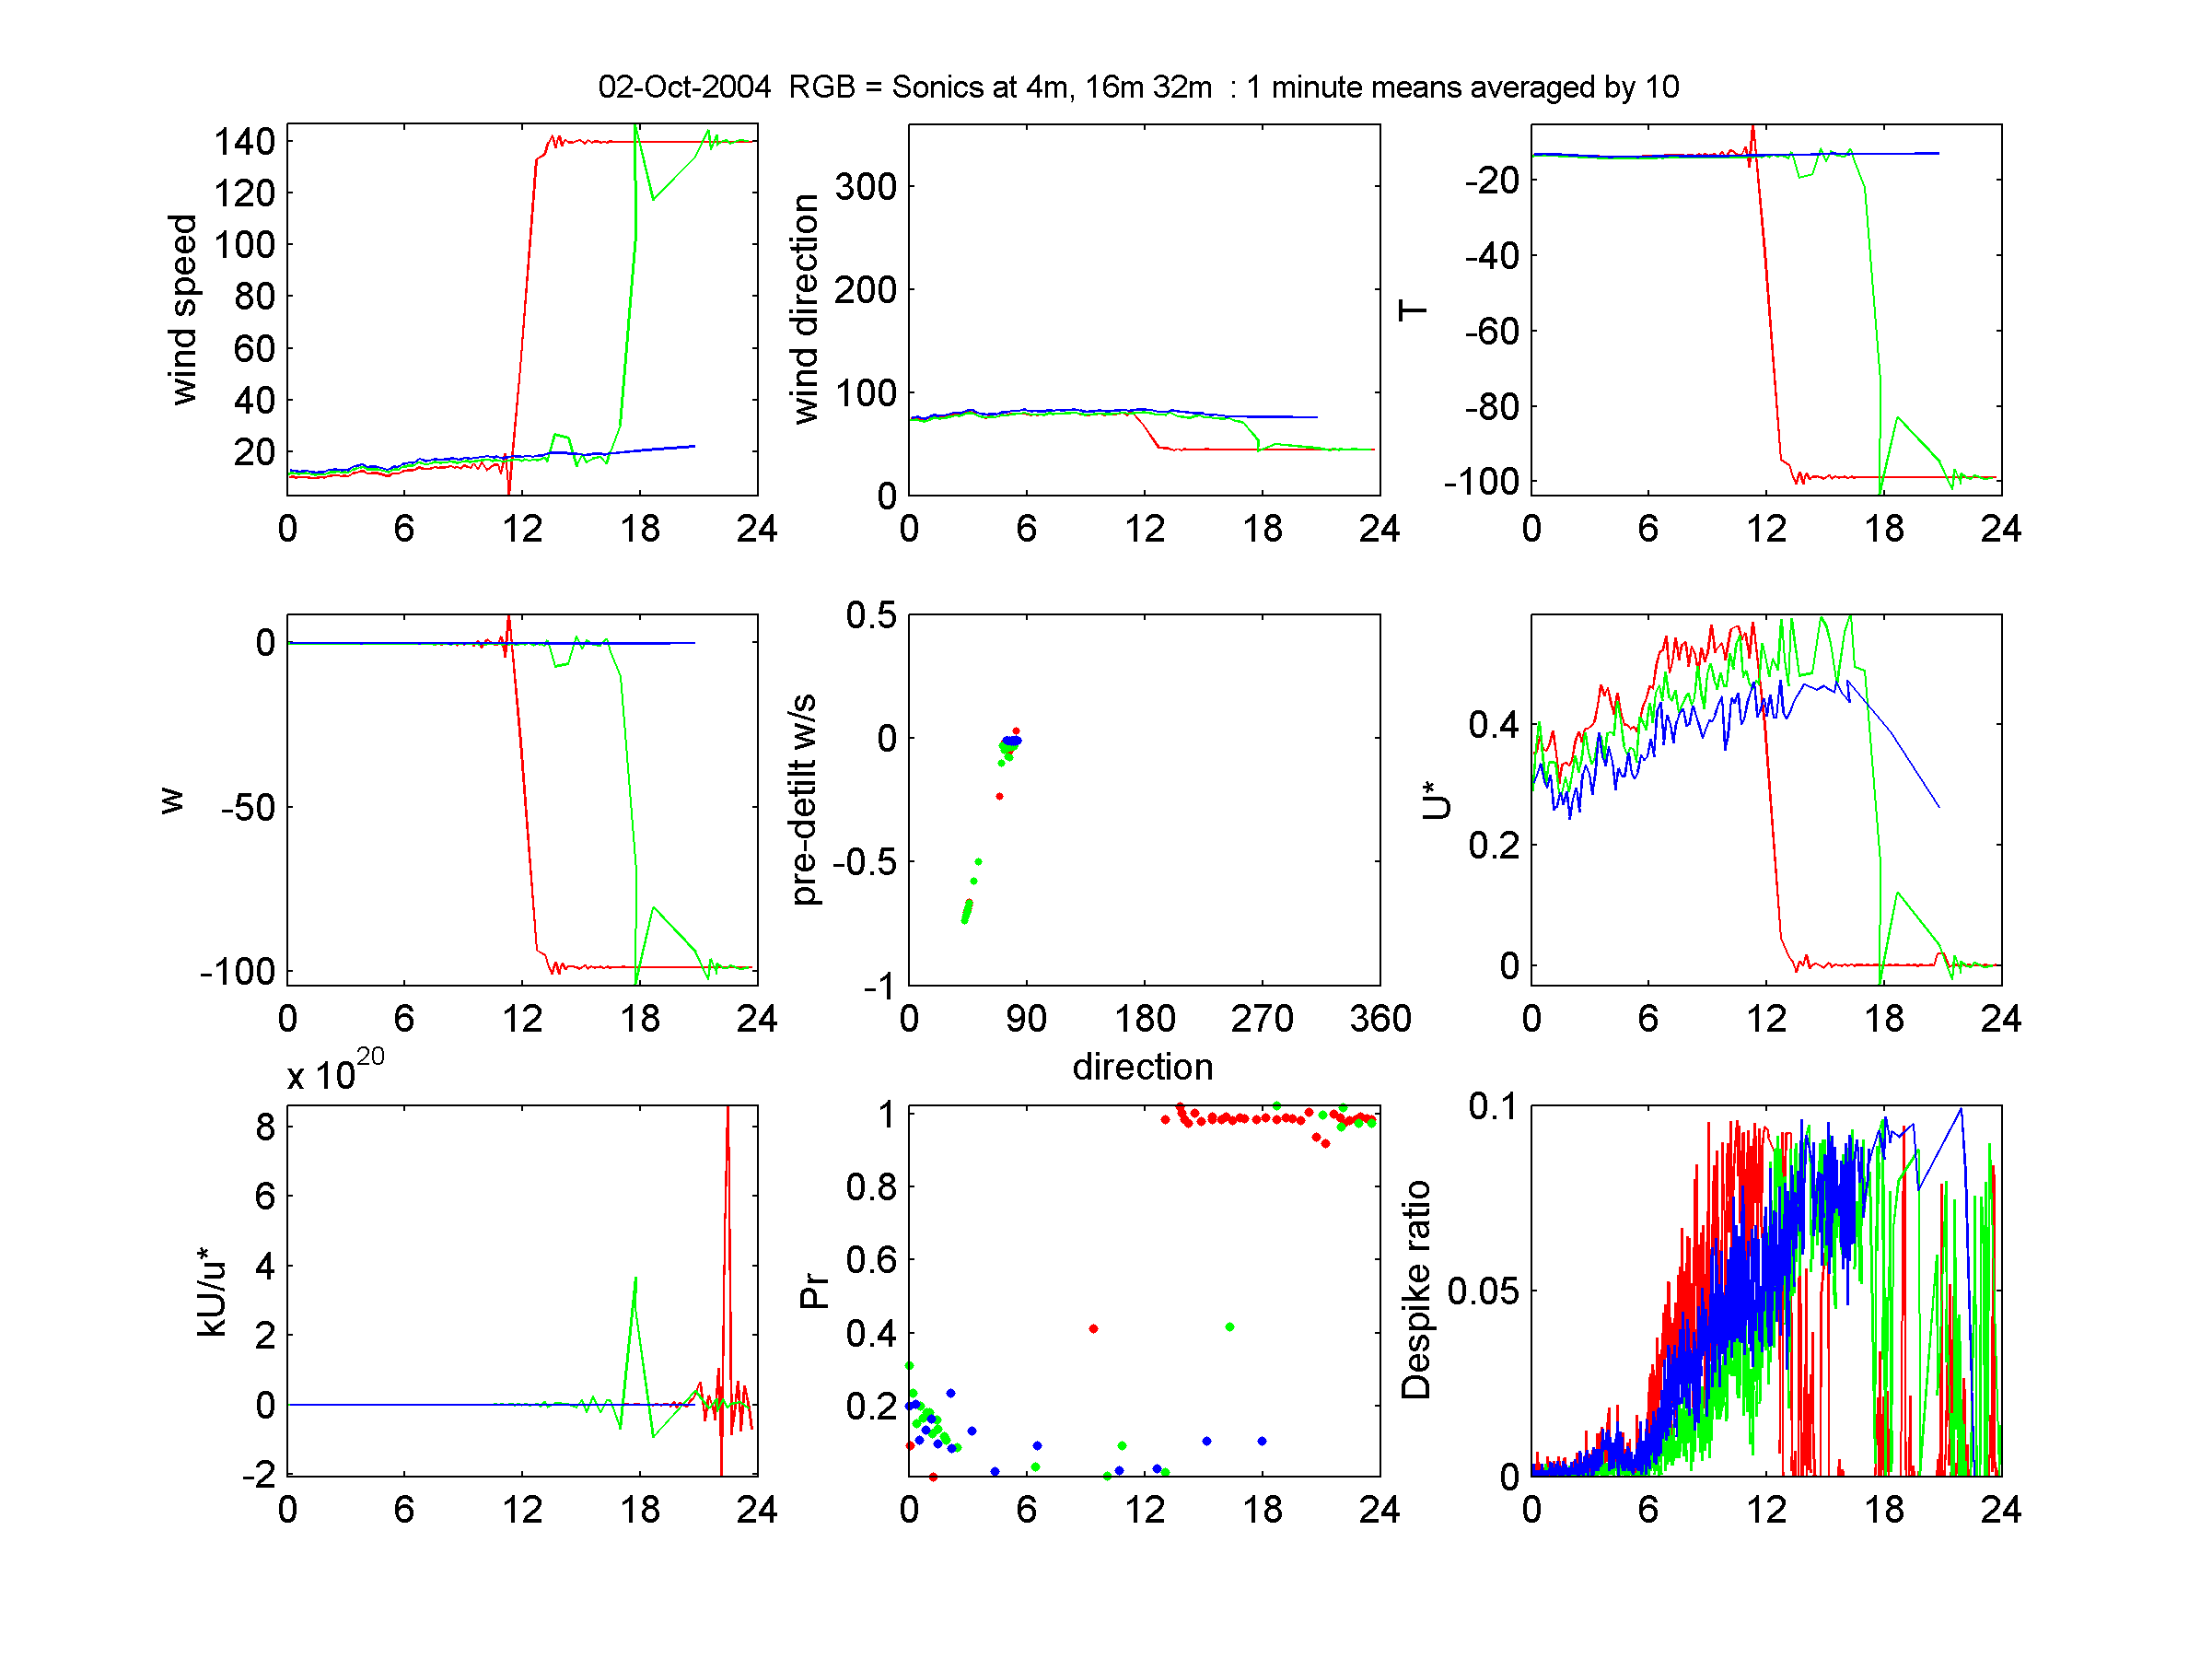
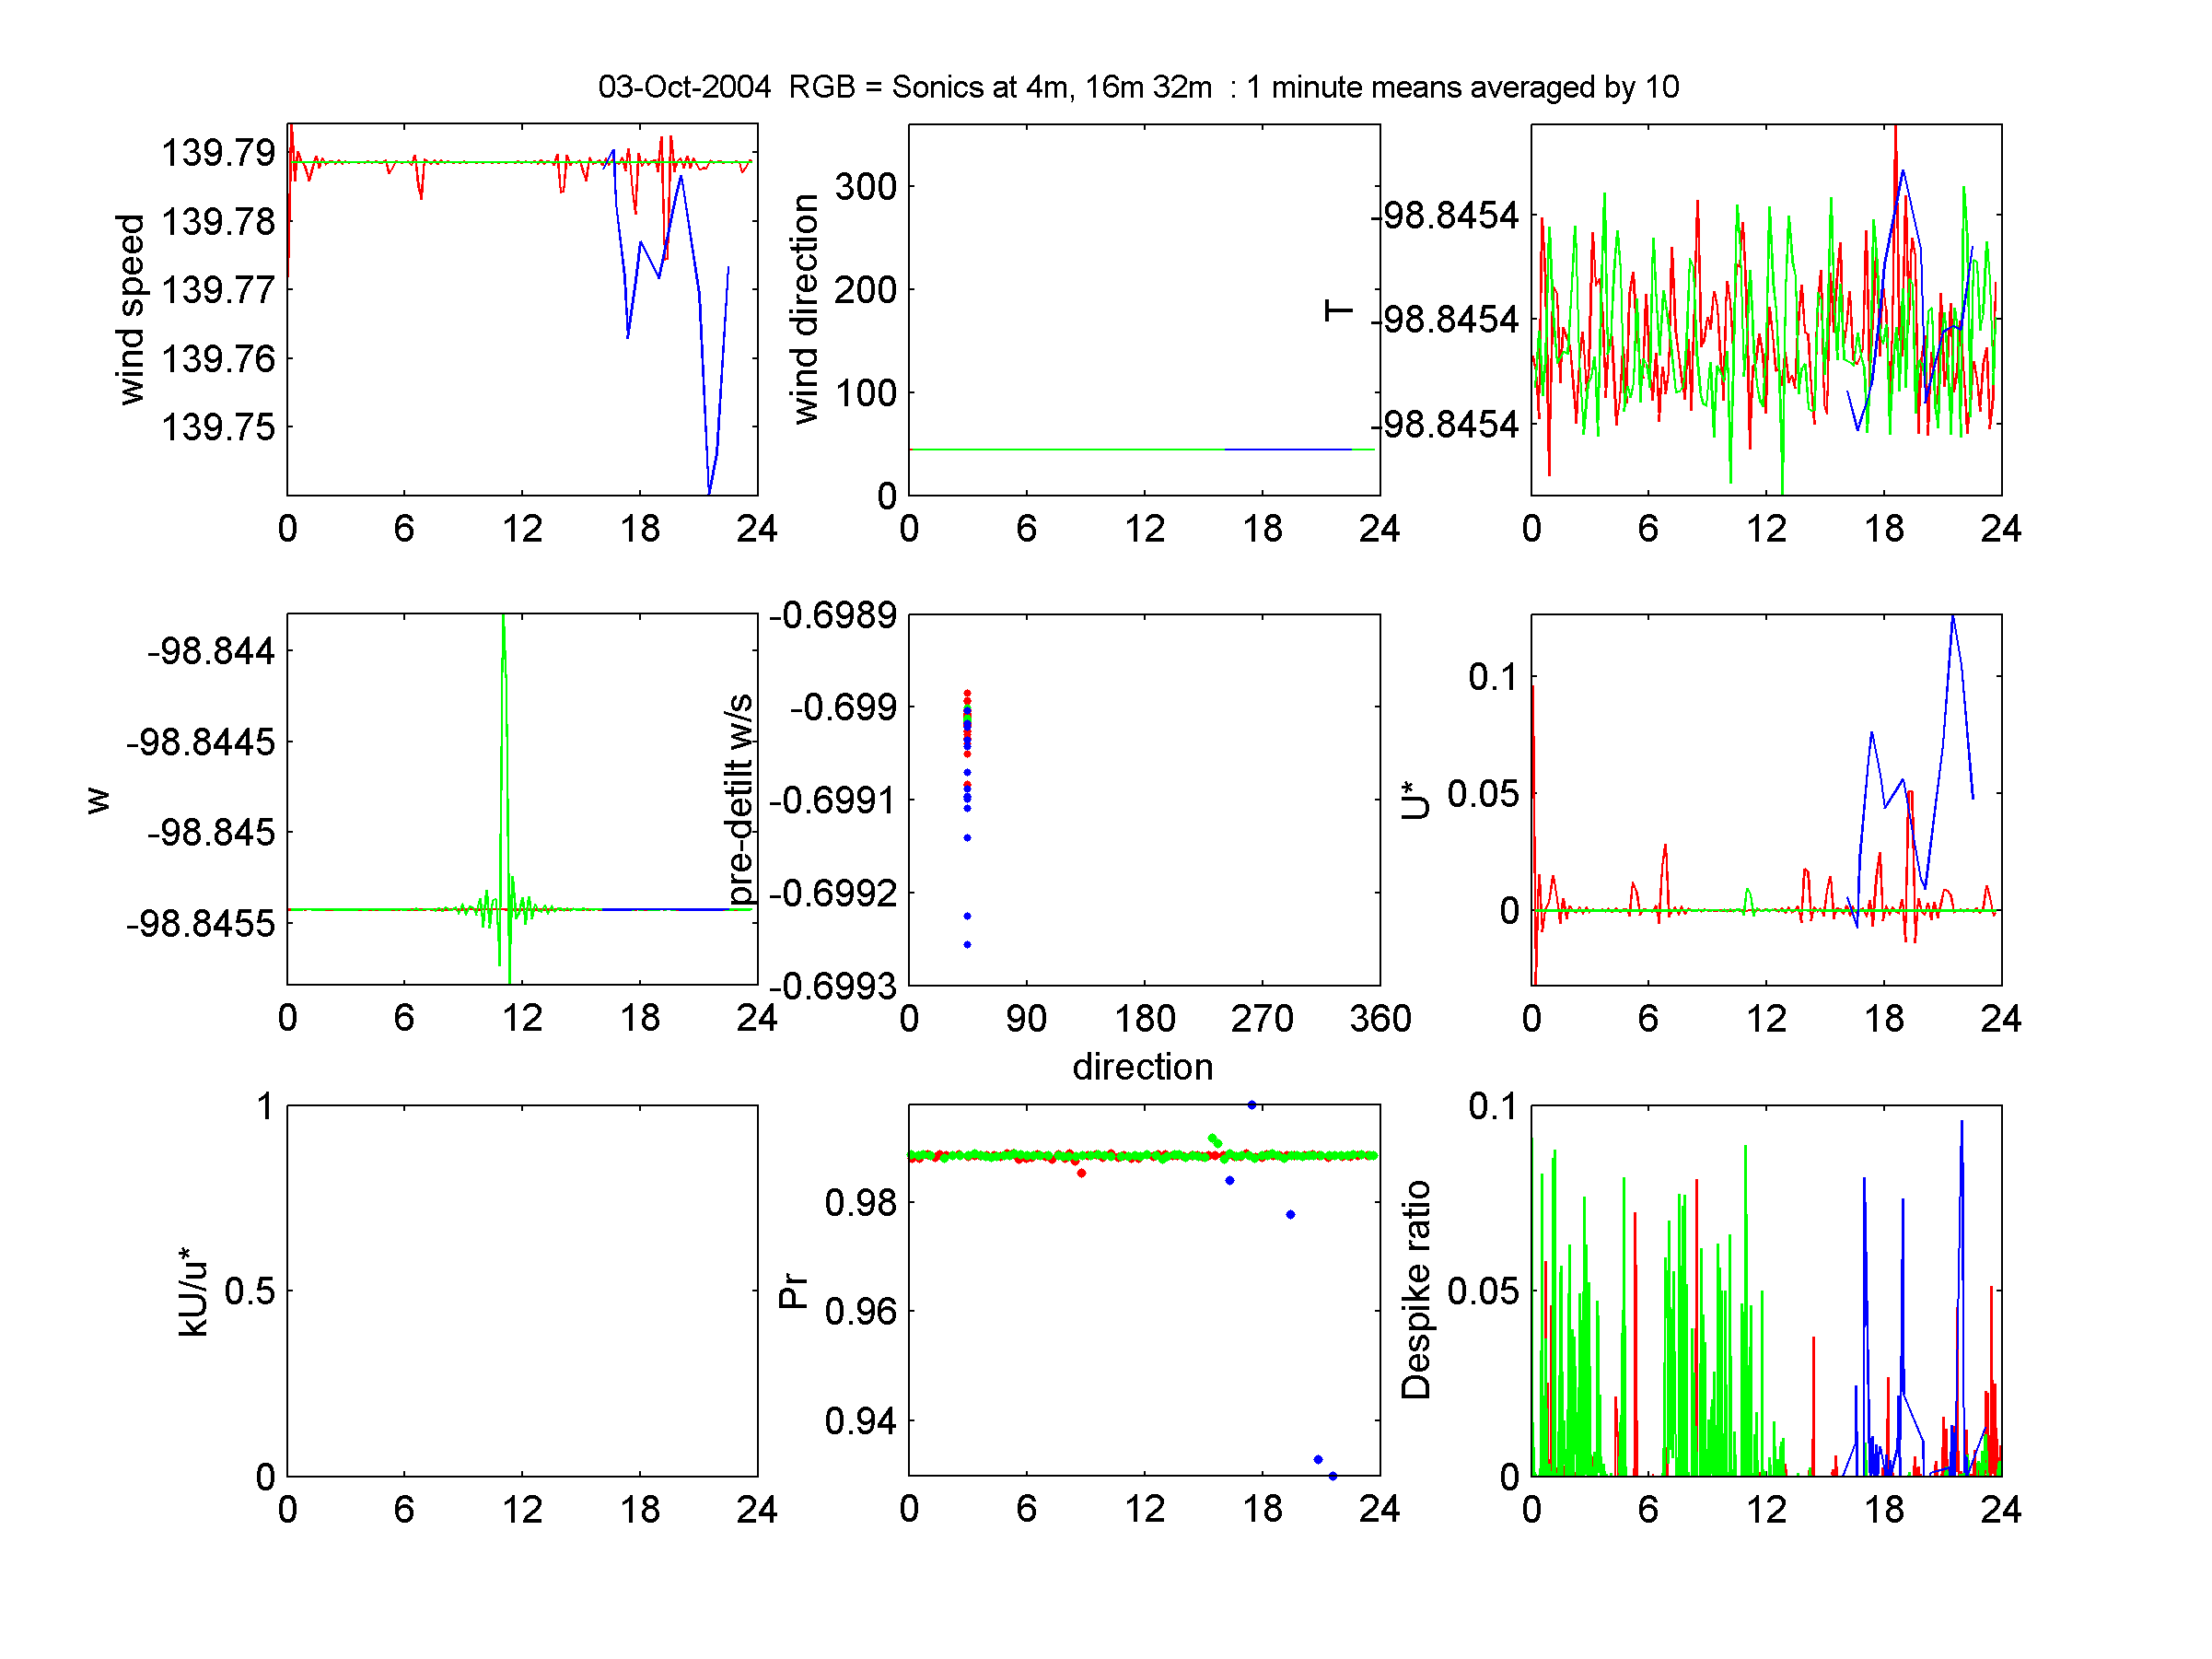
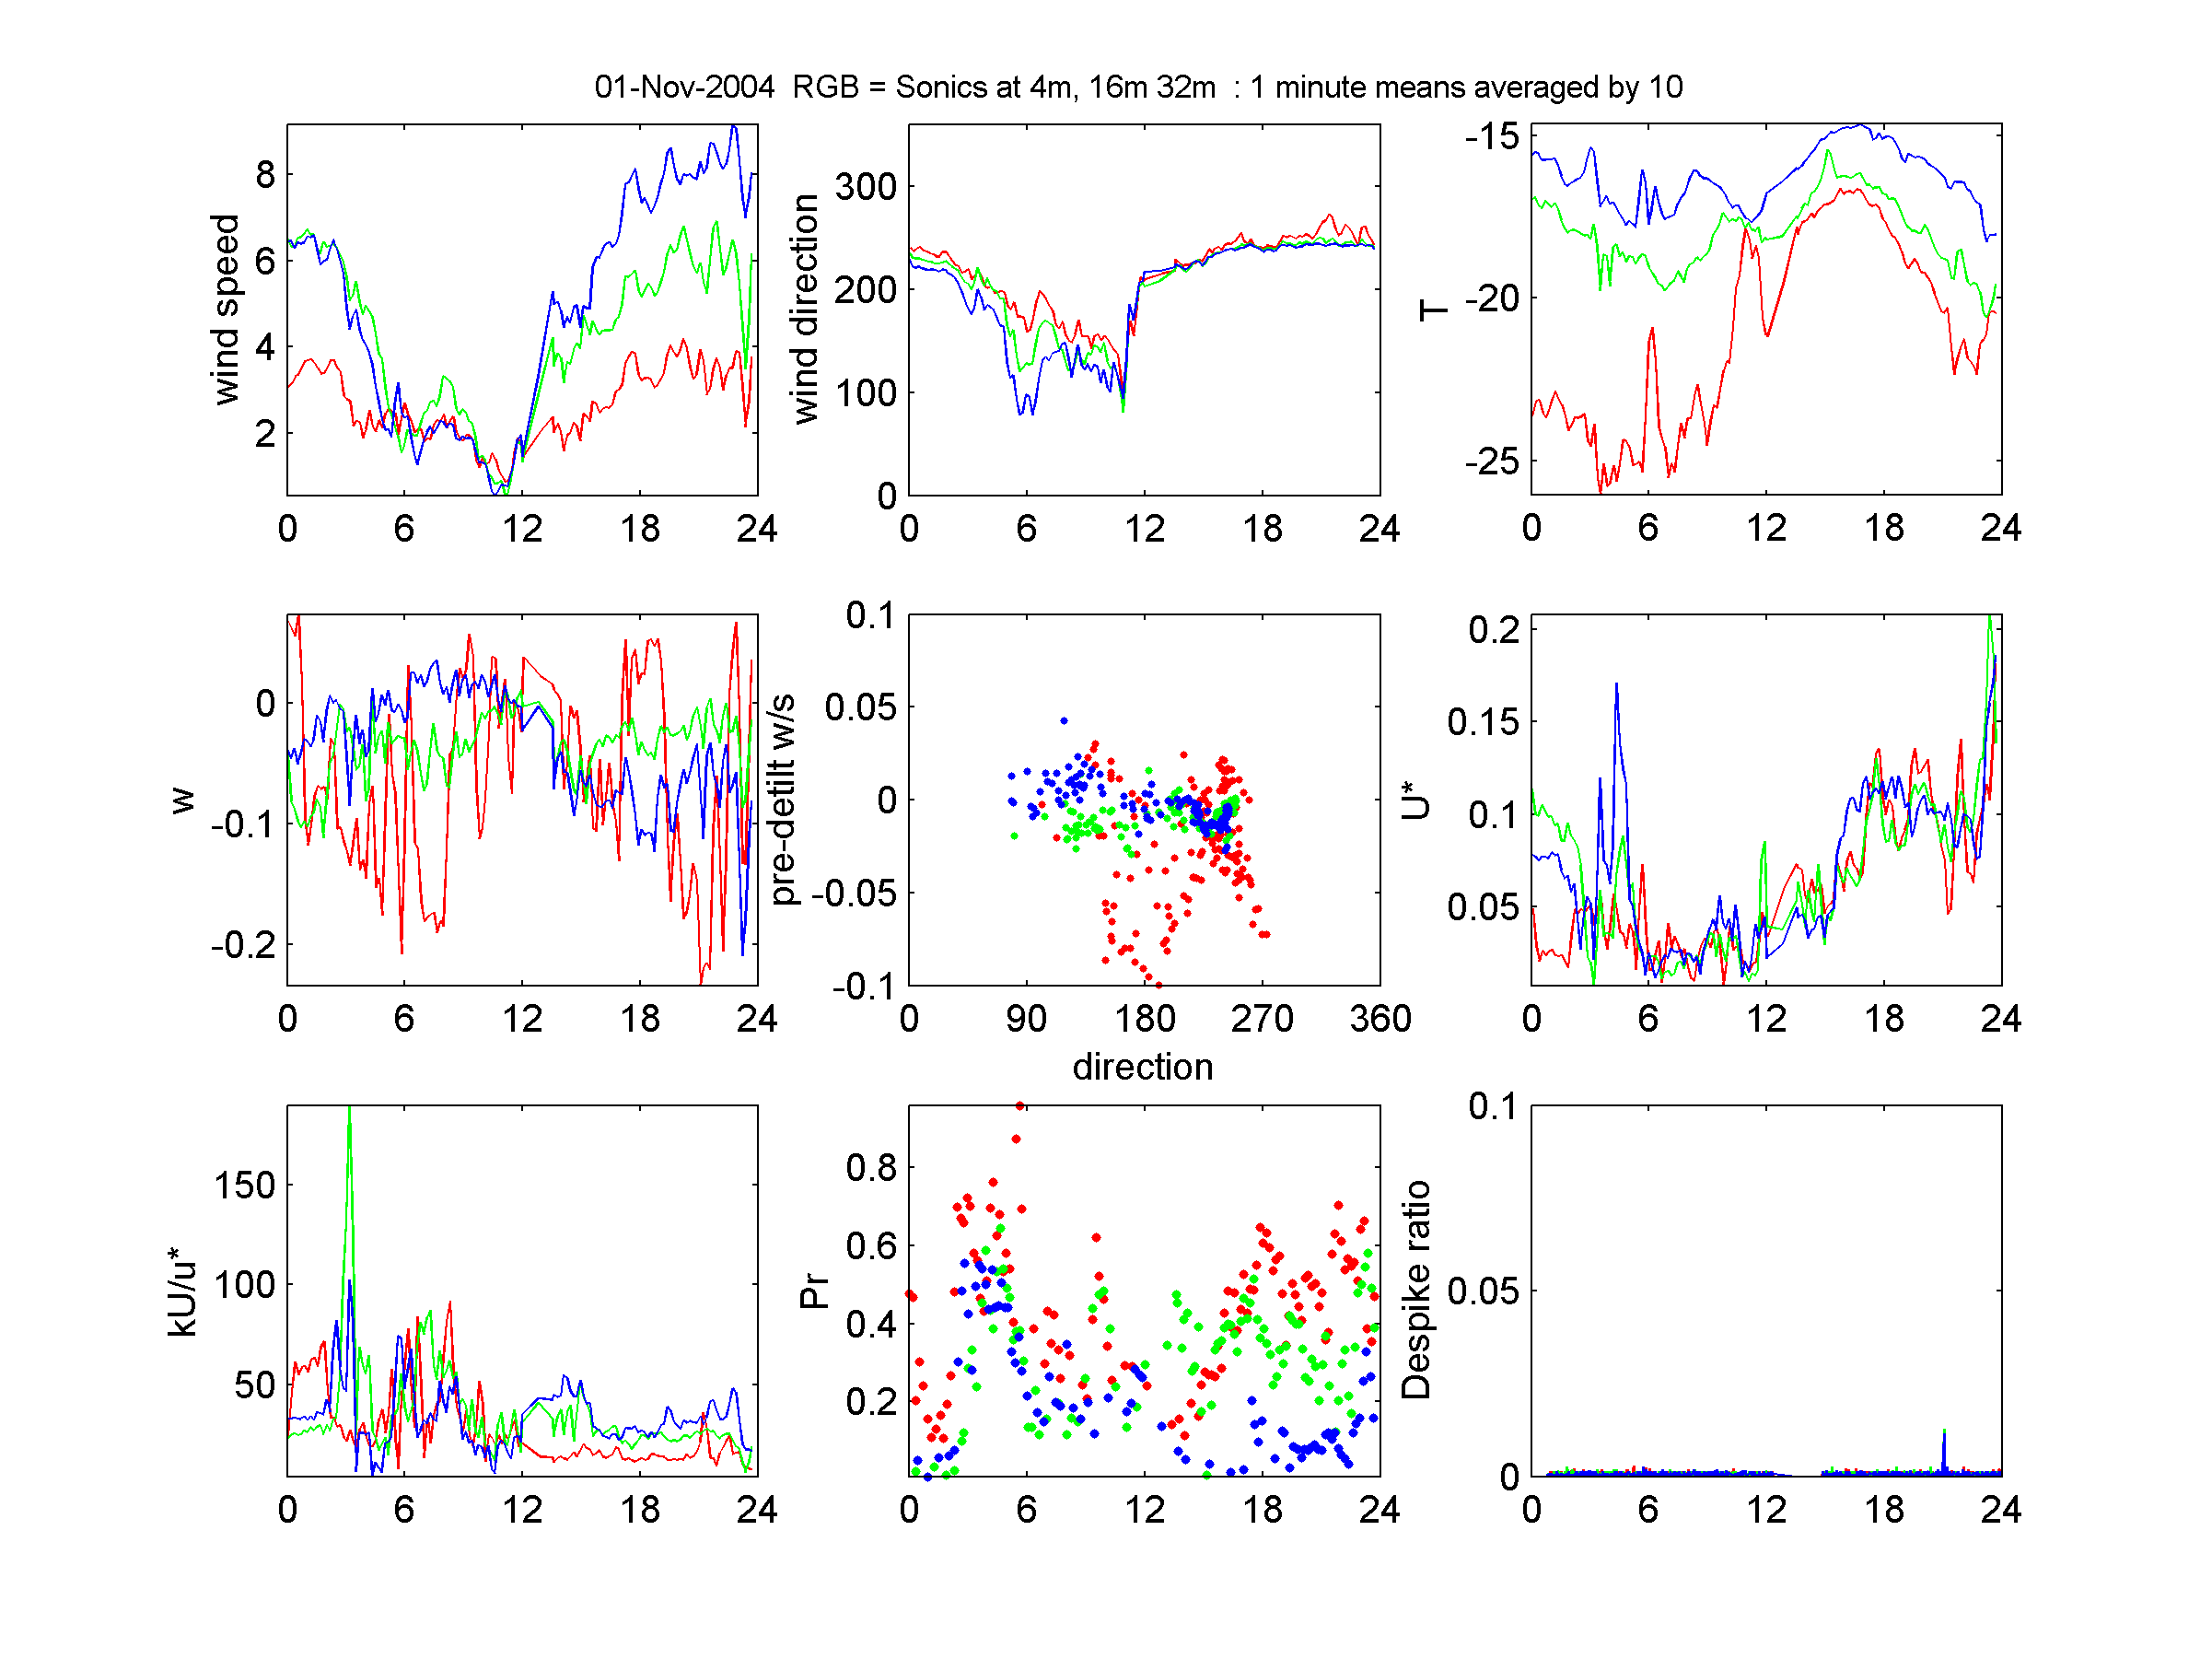
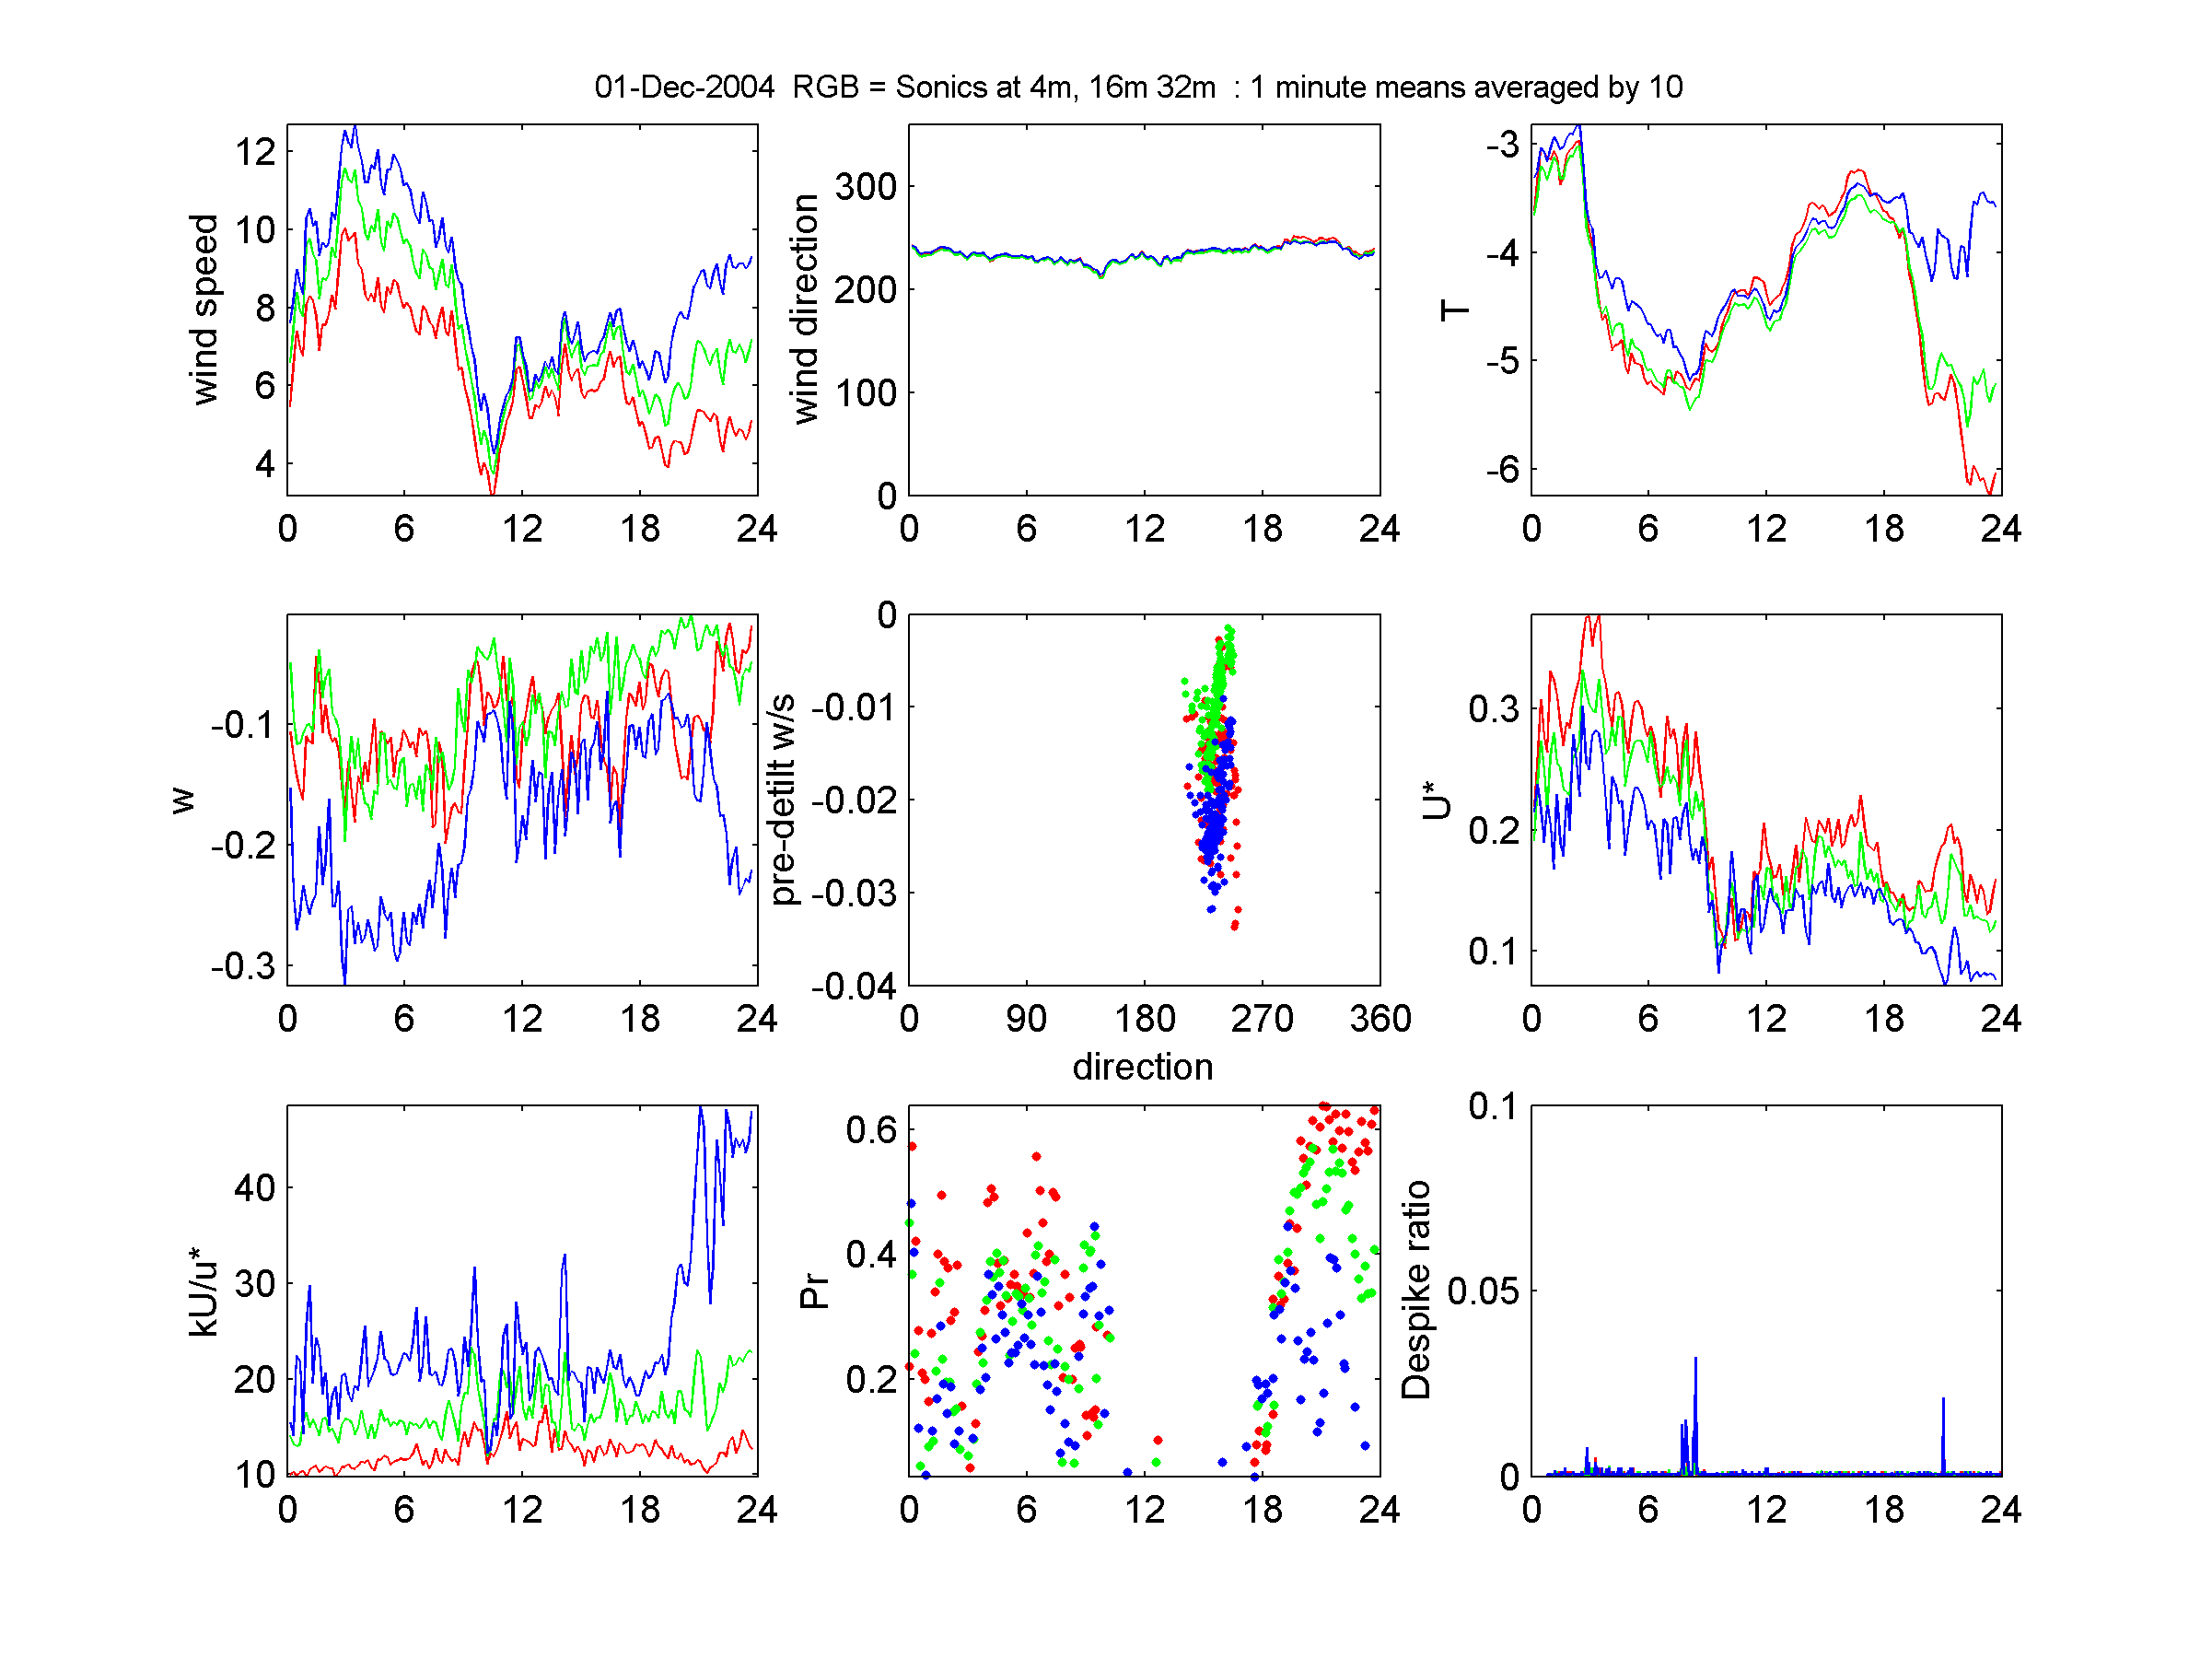
Means: which show time series of speed, direction
and Temperature; mean w, pre-tilt corrected w/s, u*; kU/u*, Pr,
de-spike ratio
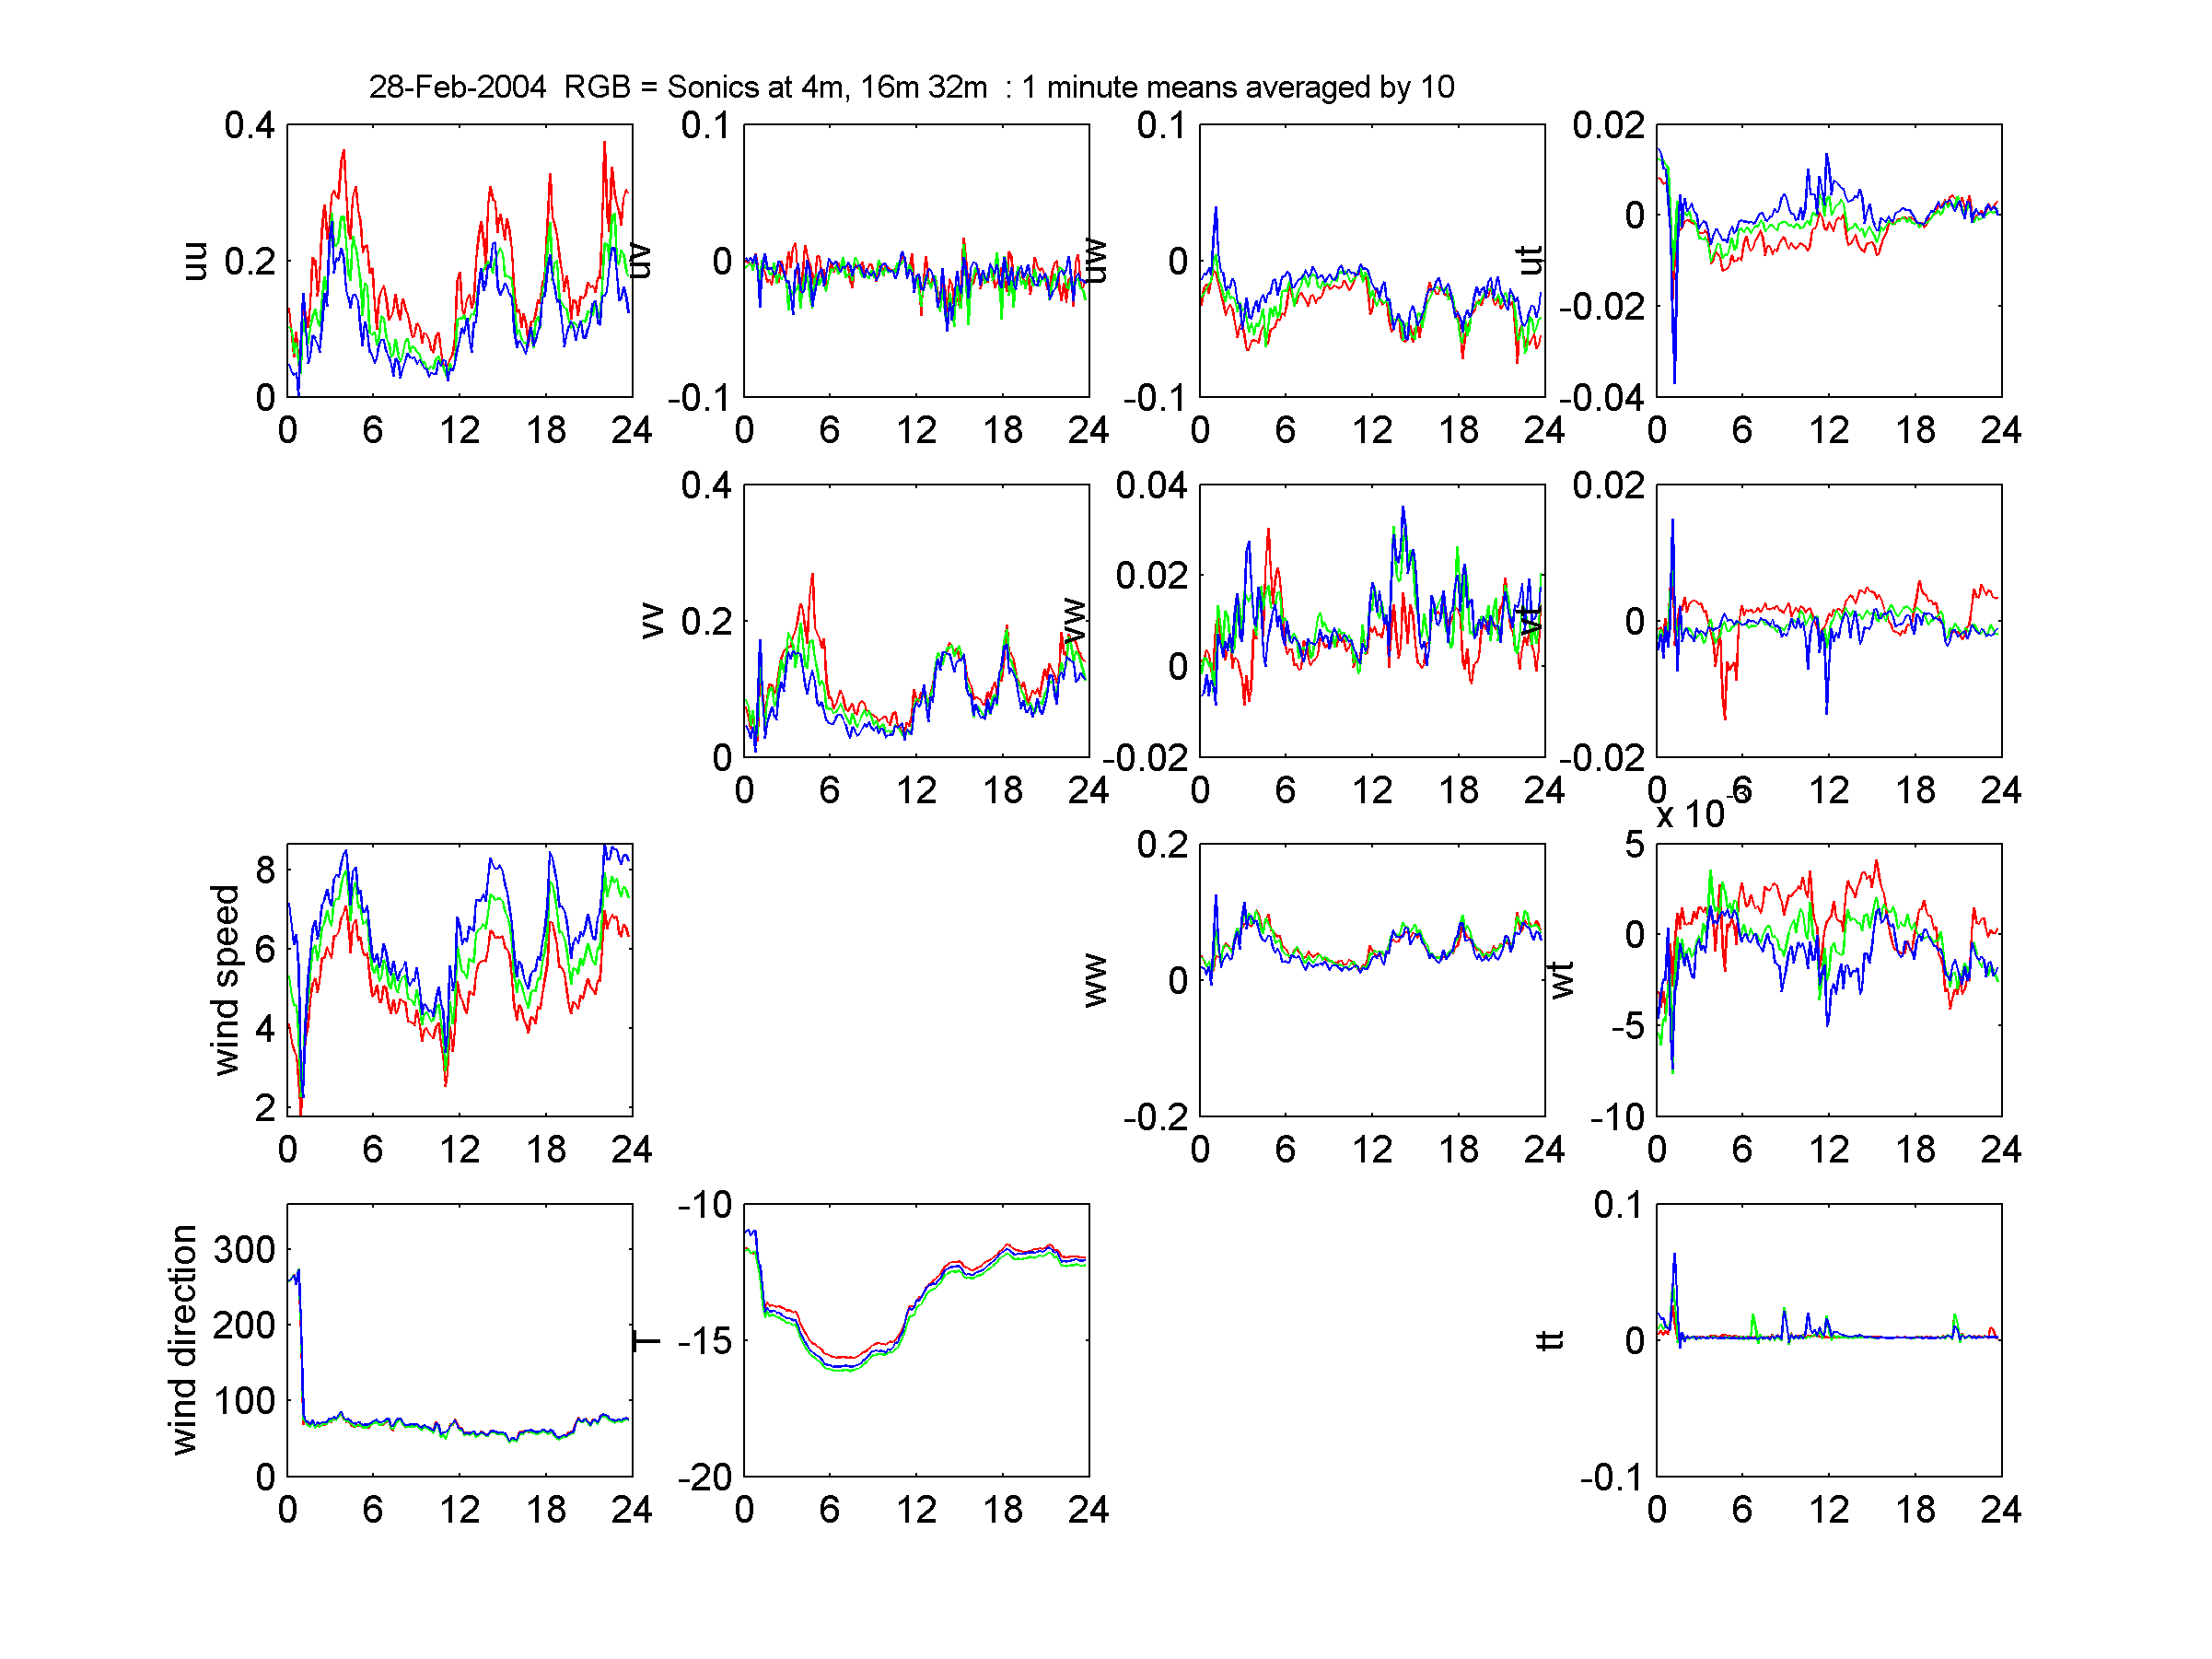
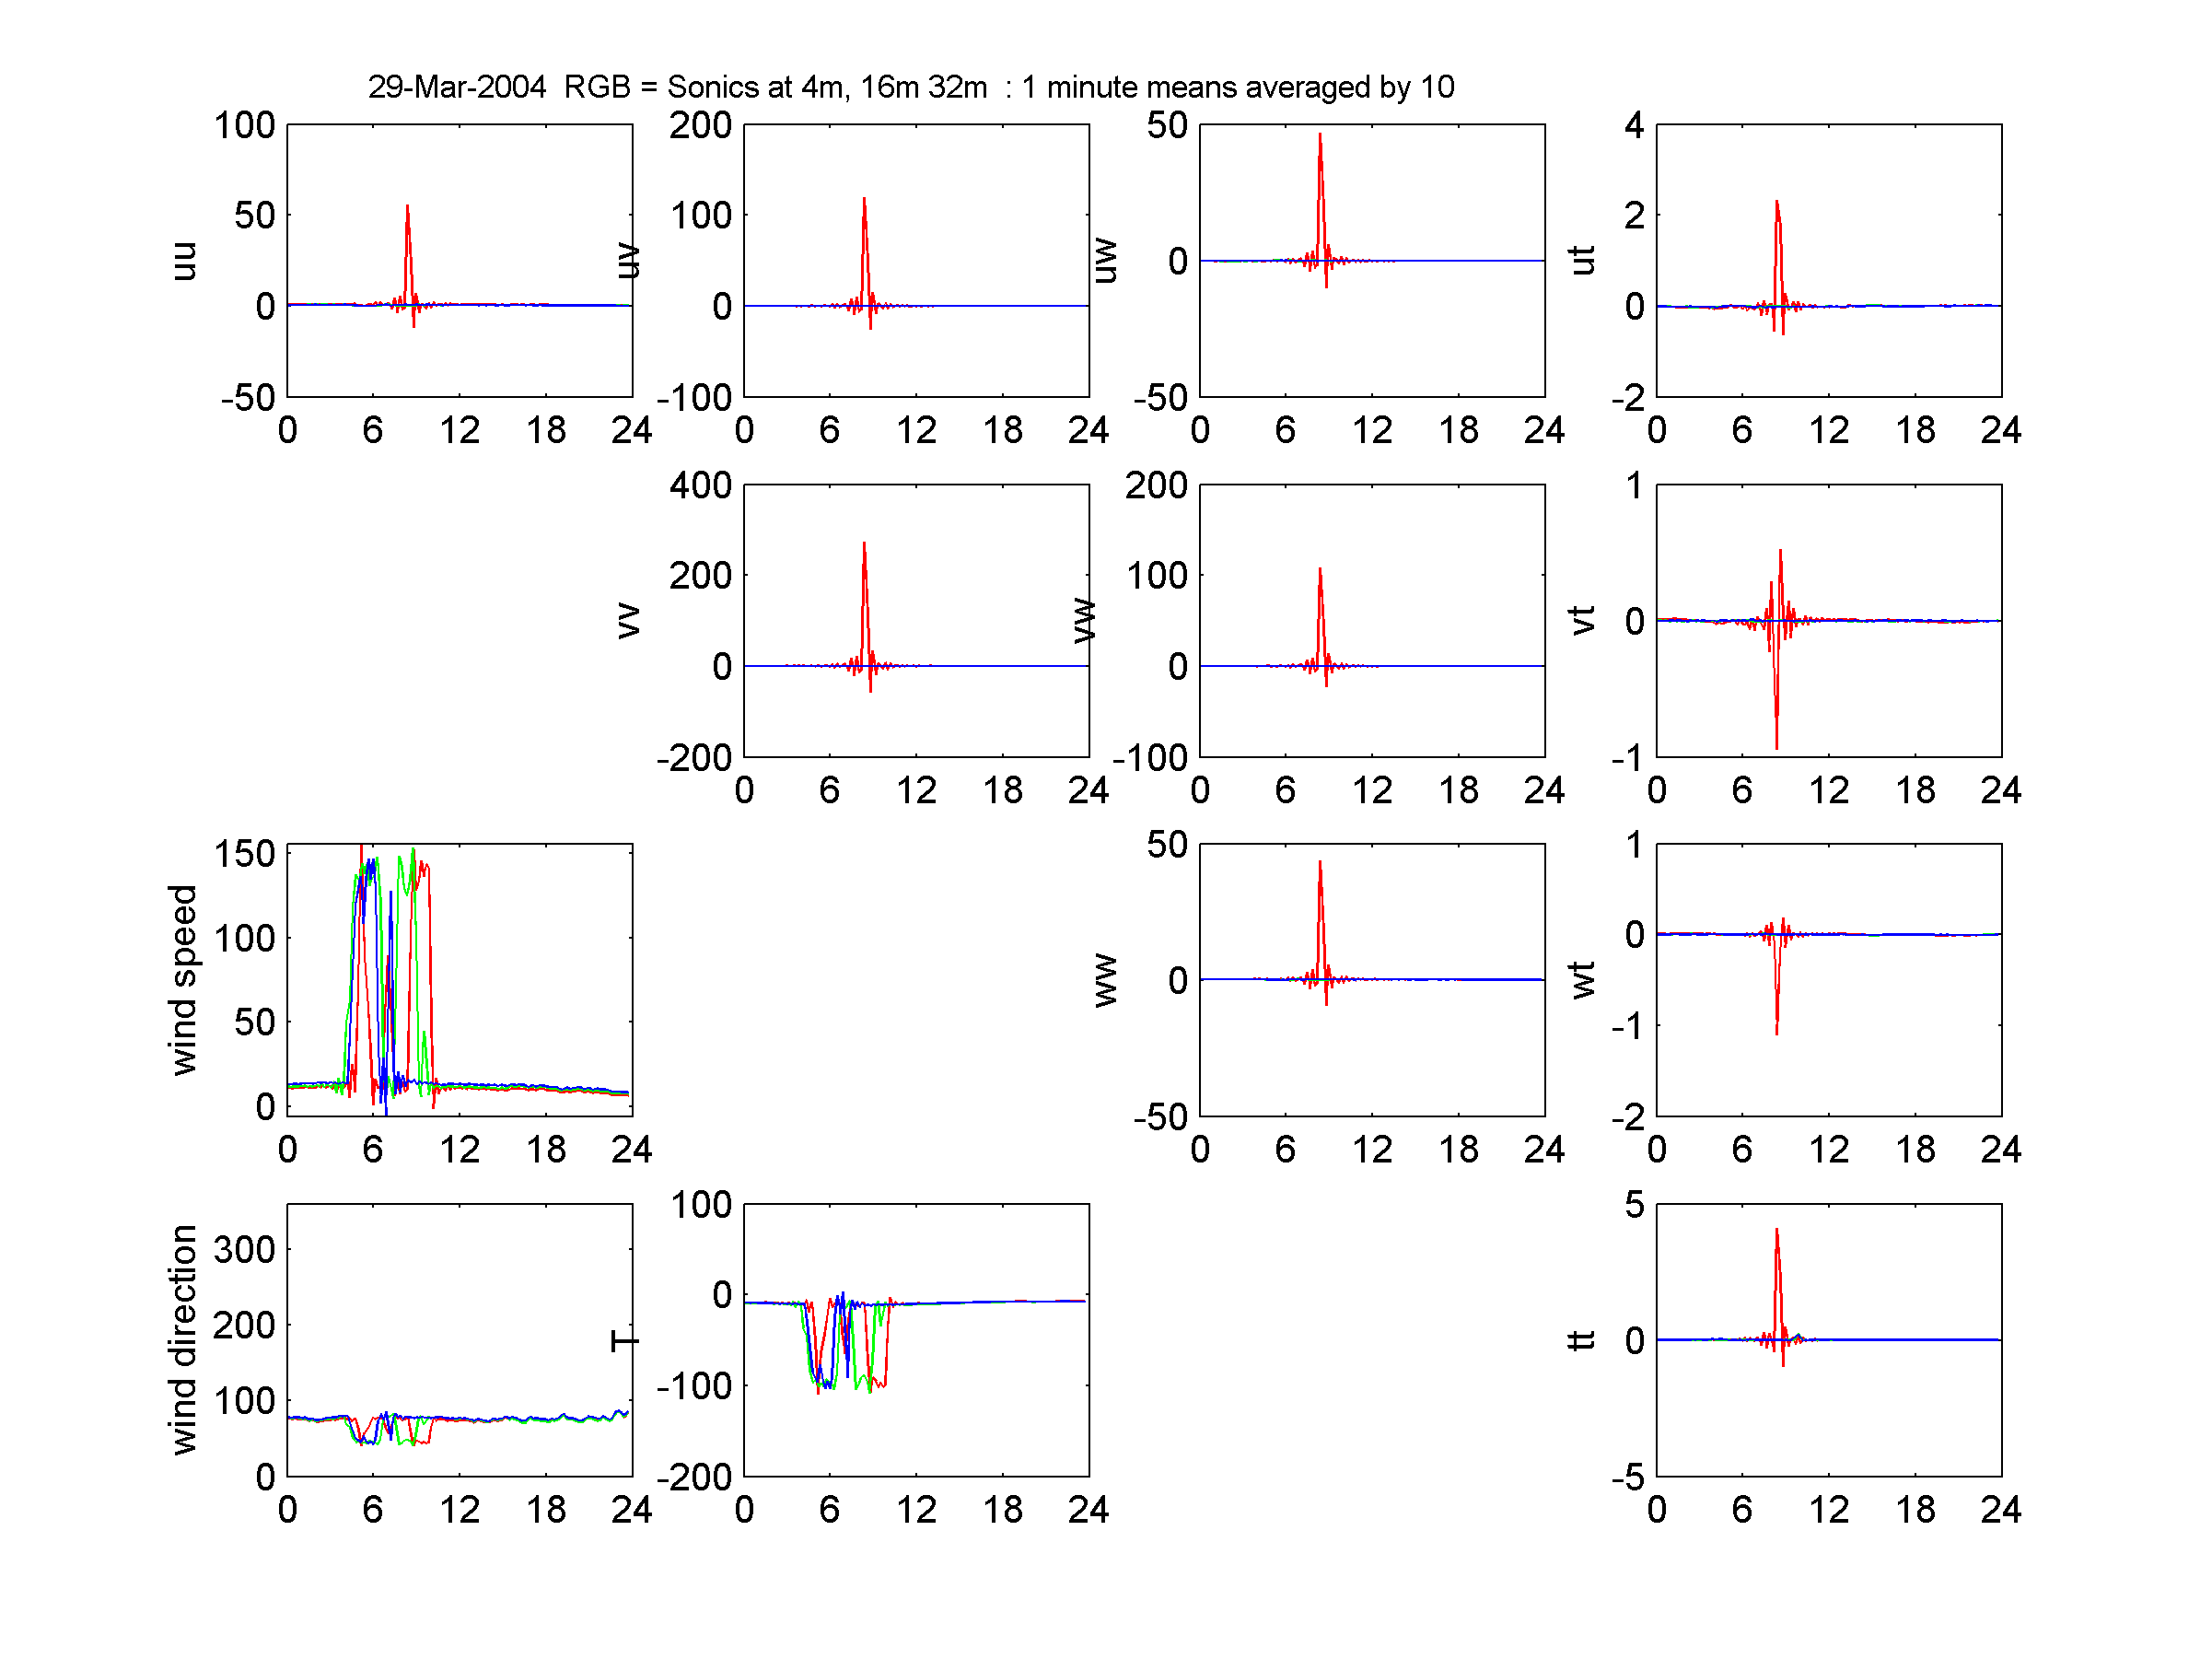
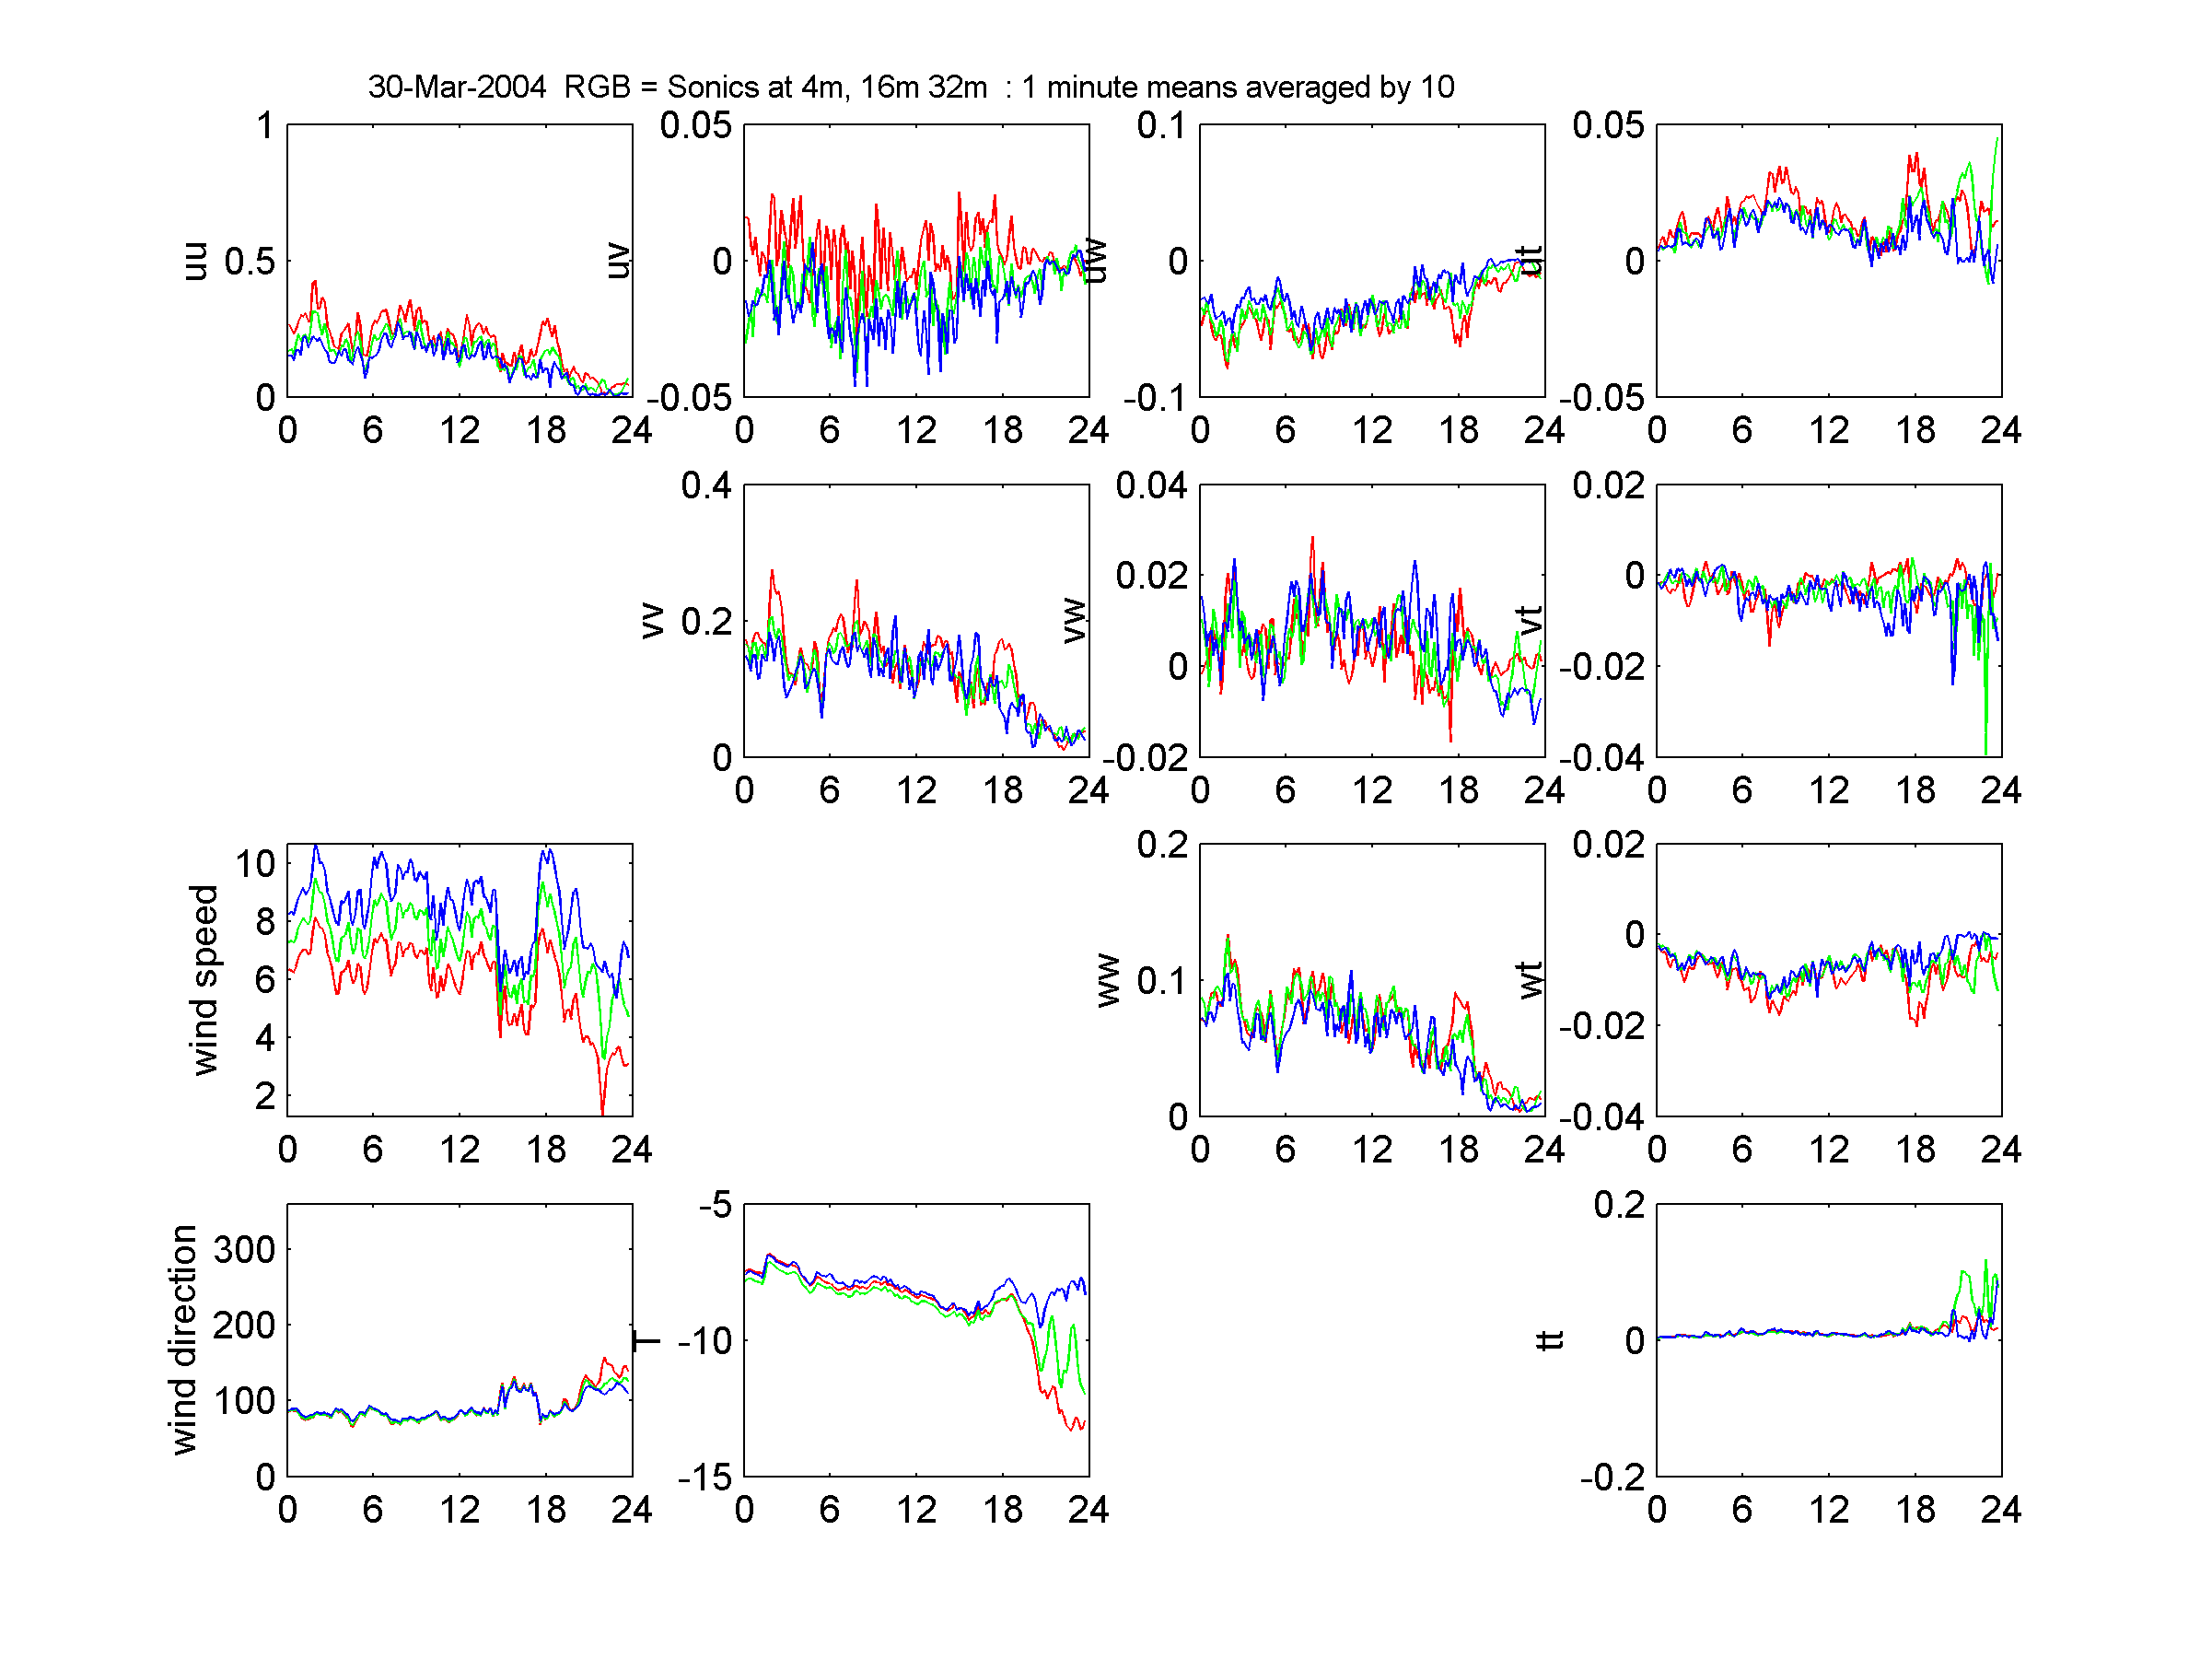
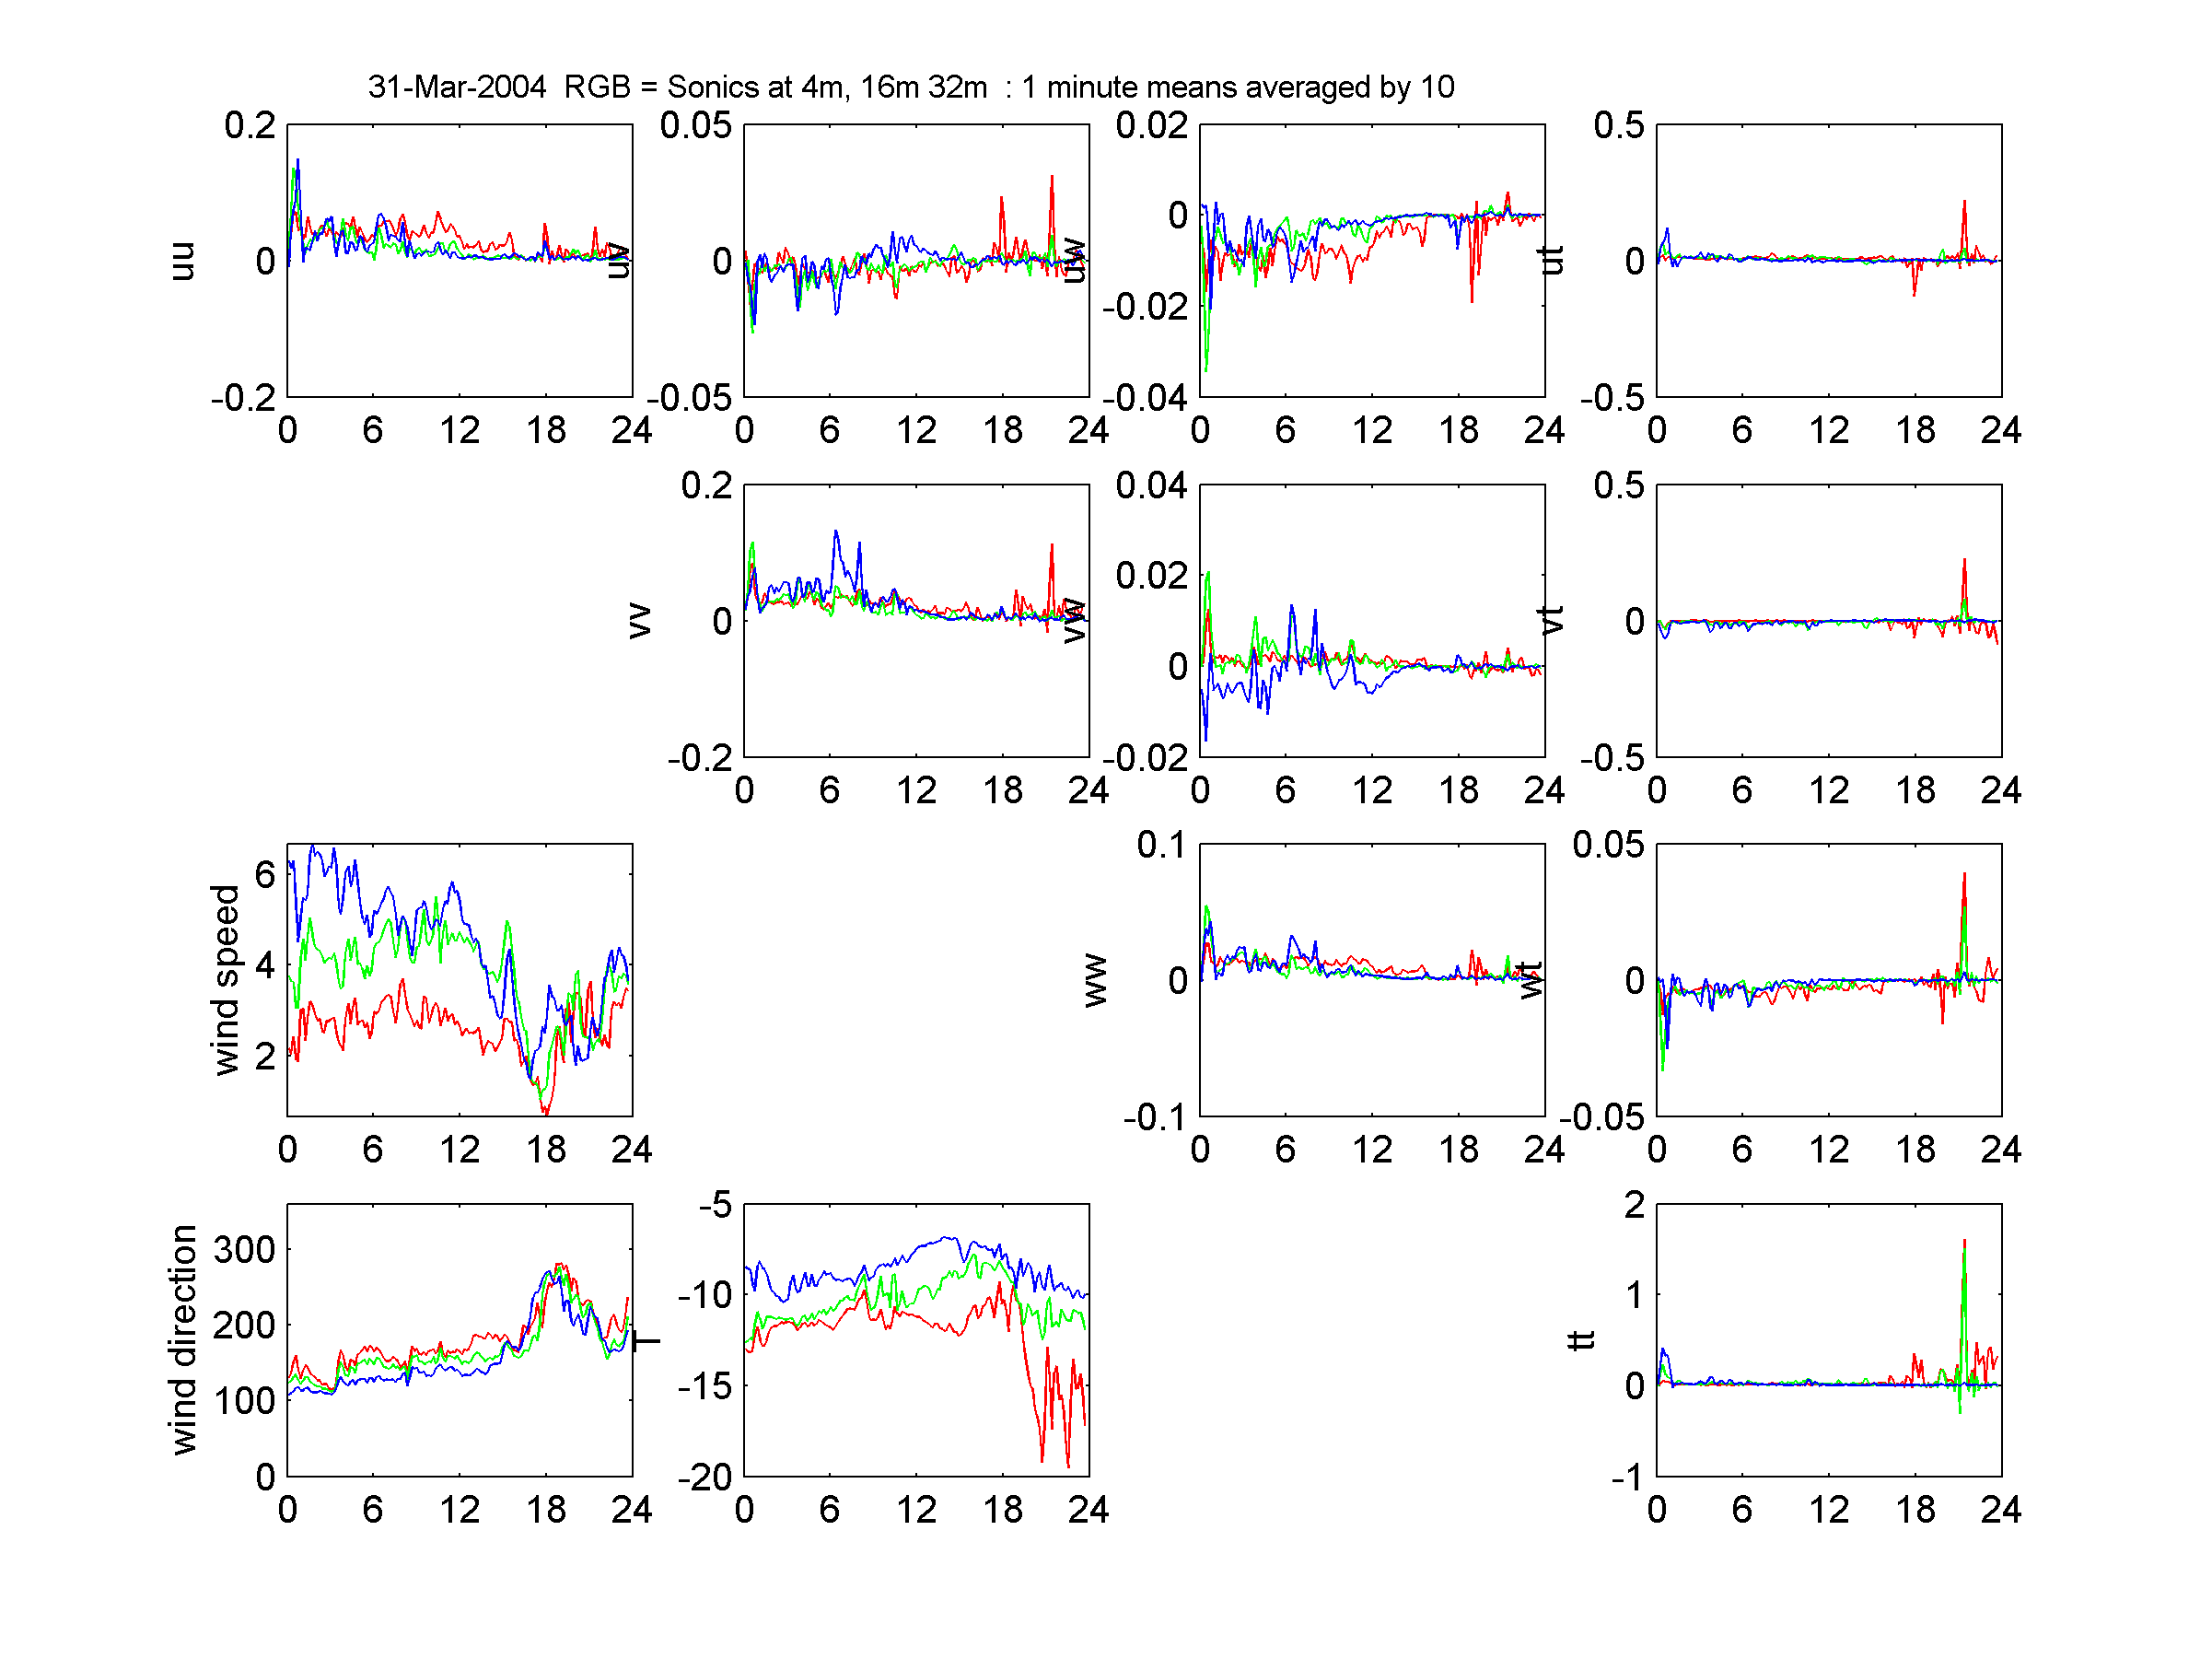
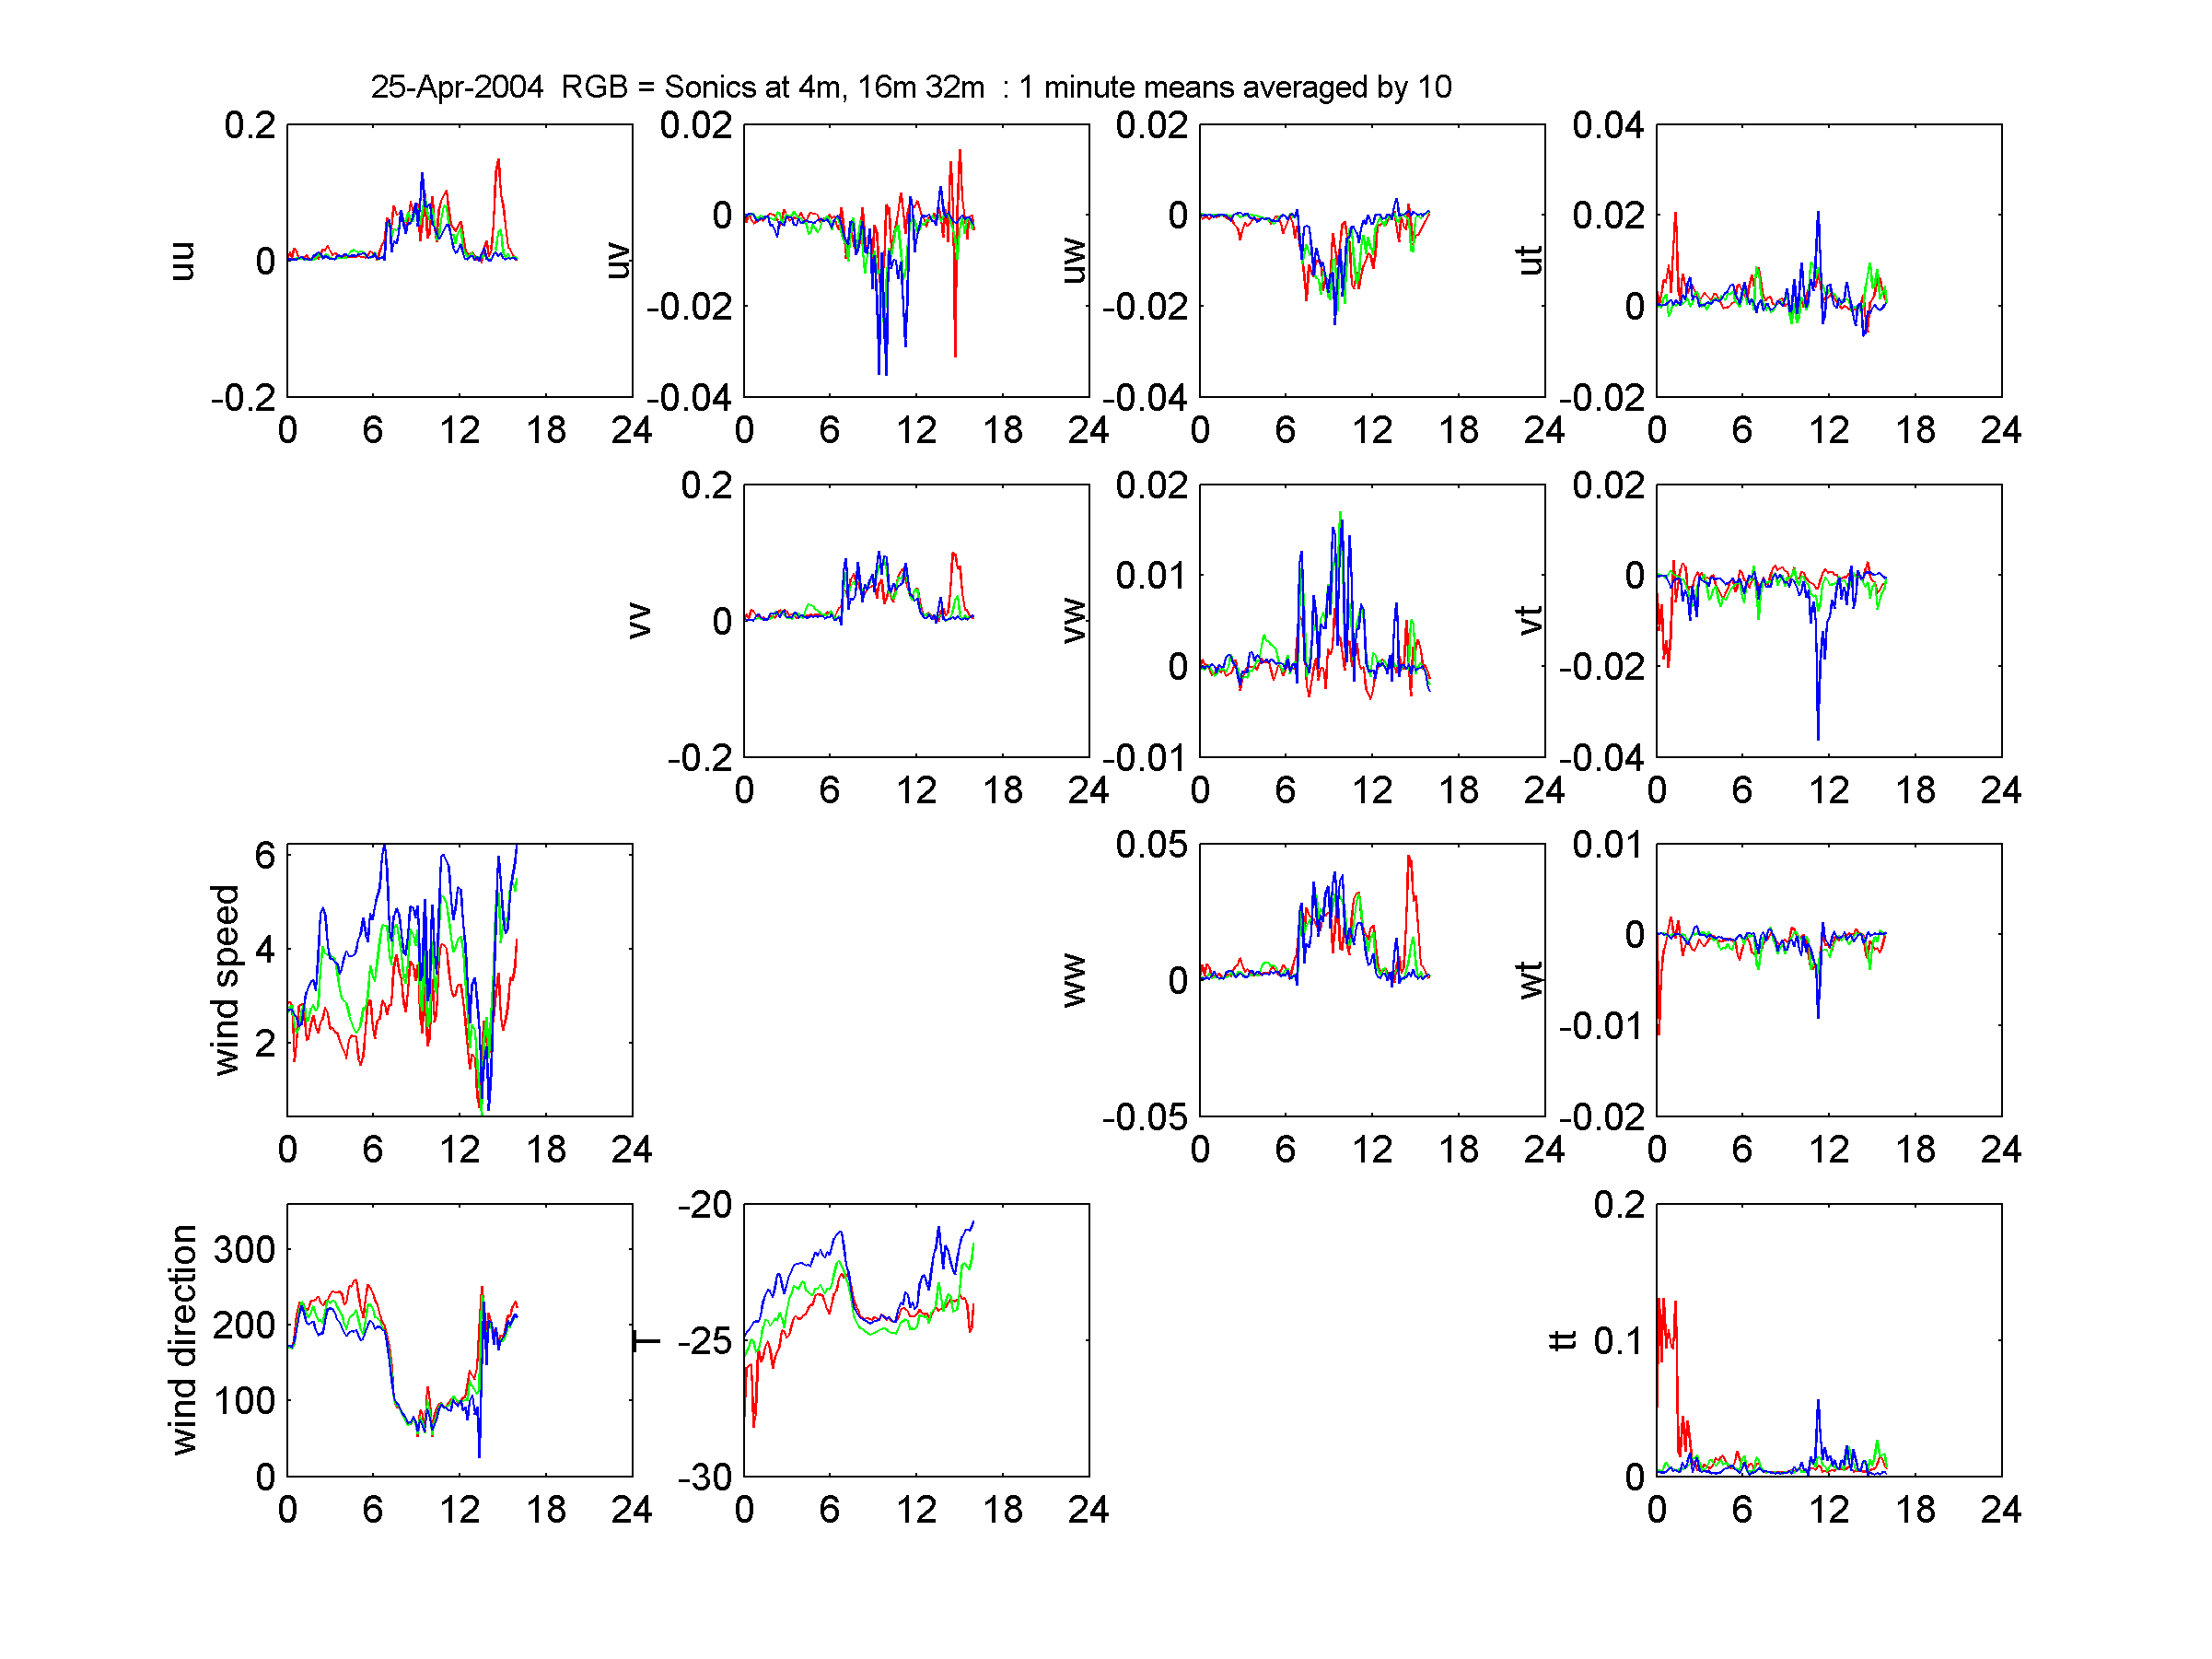
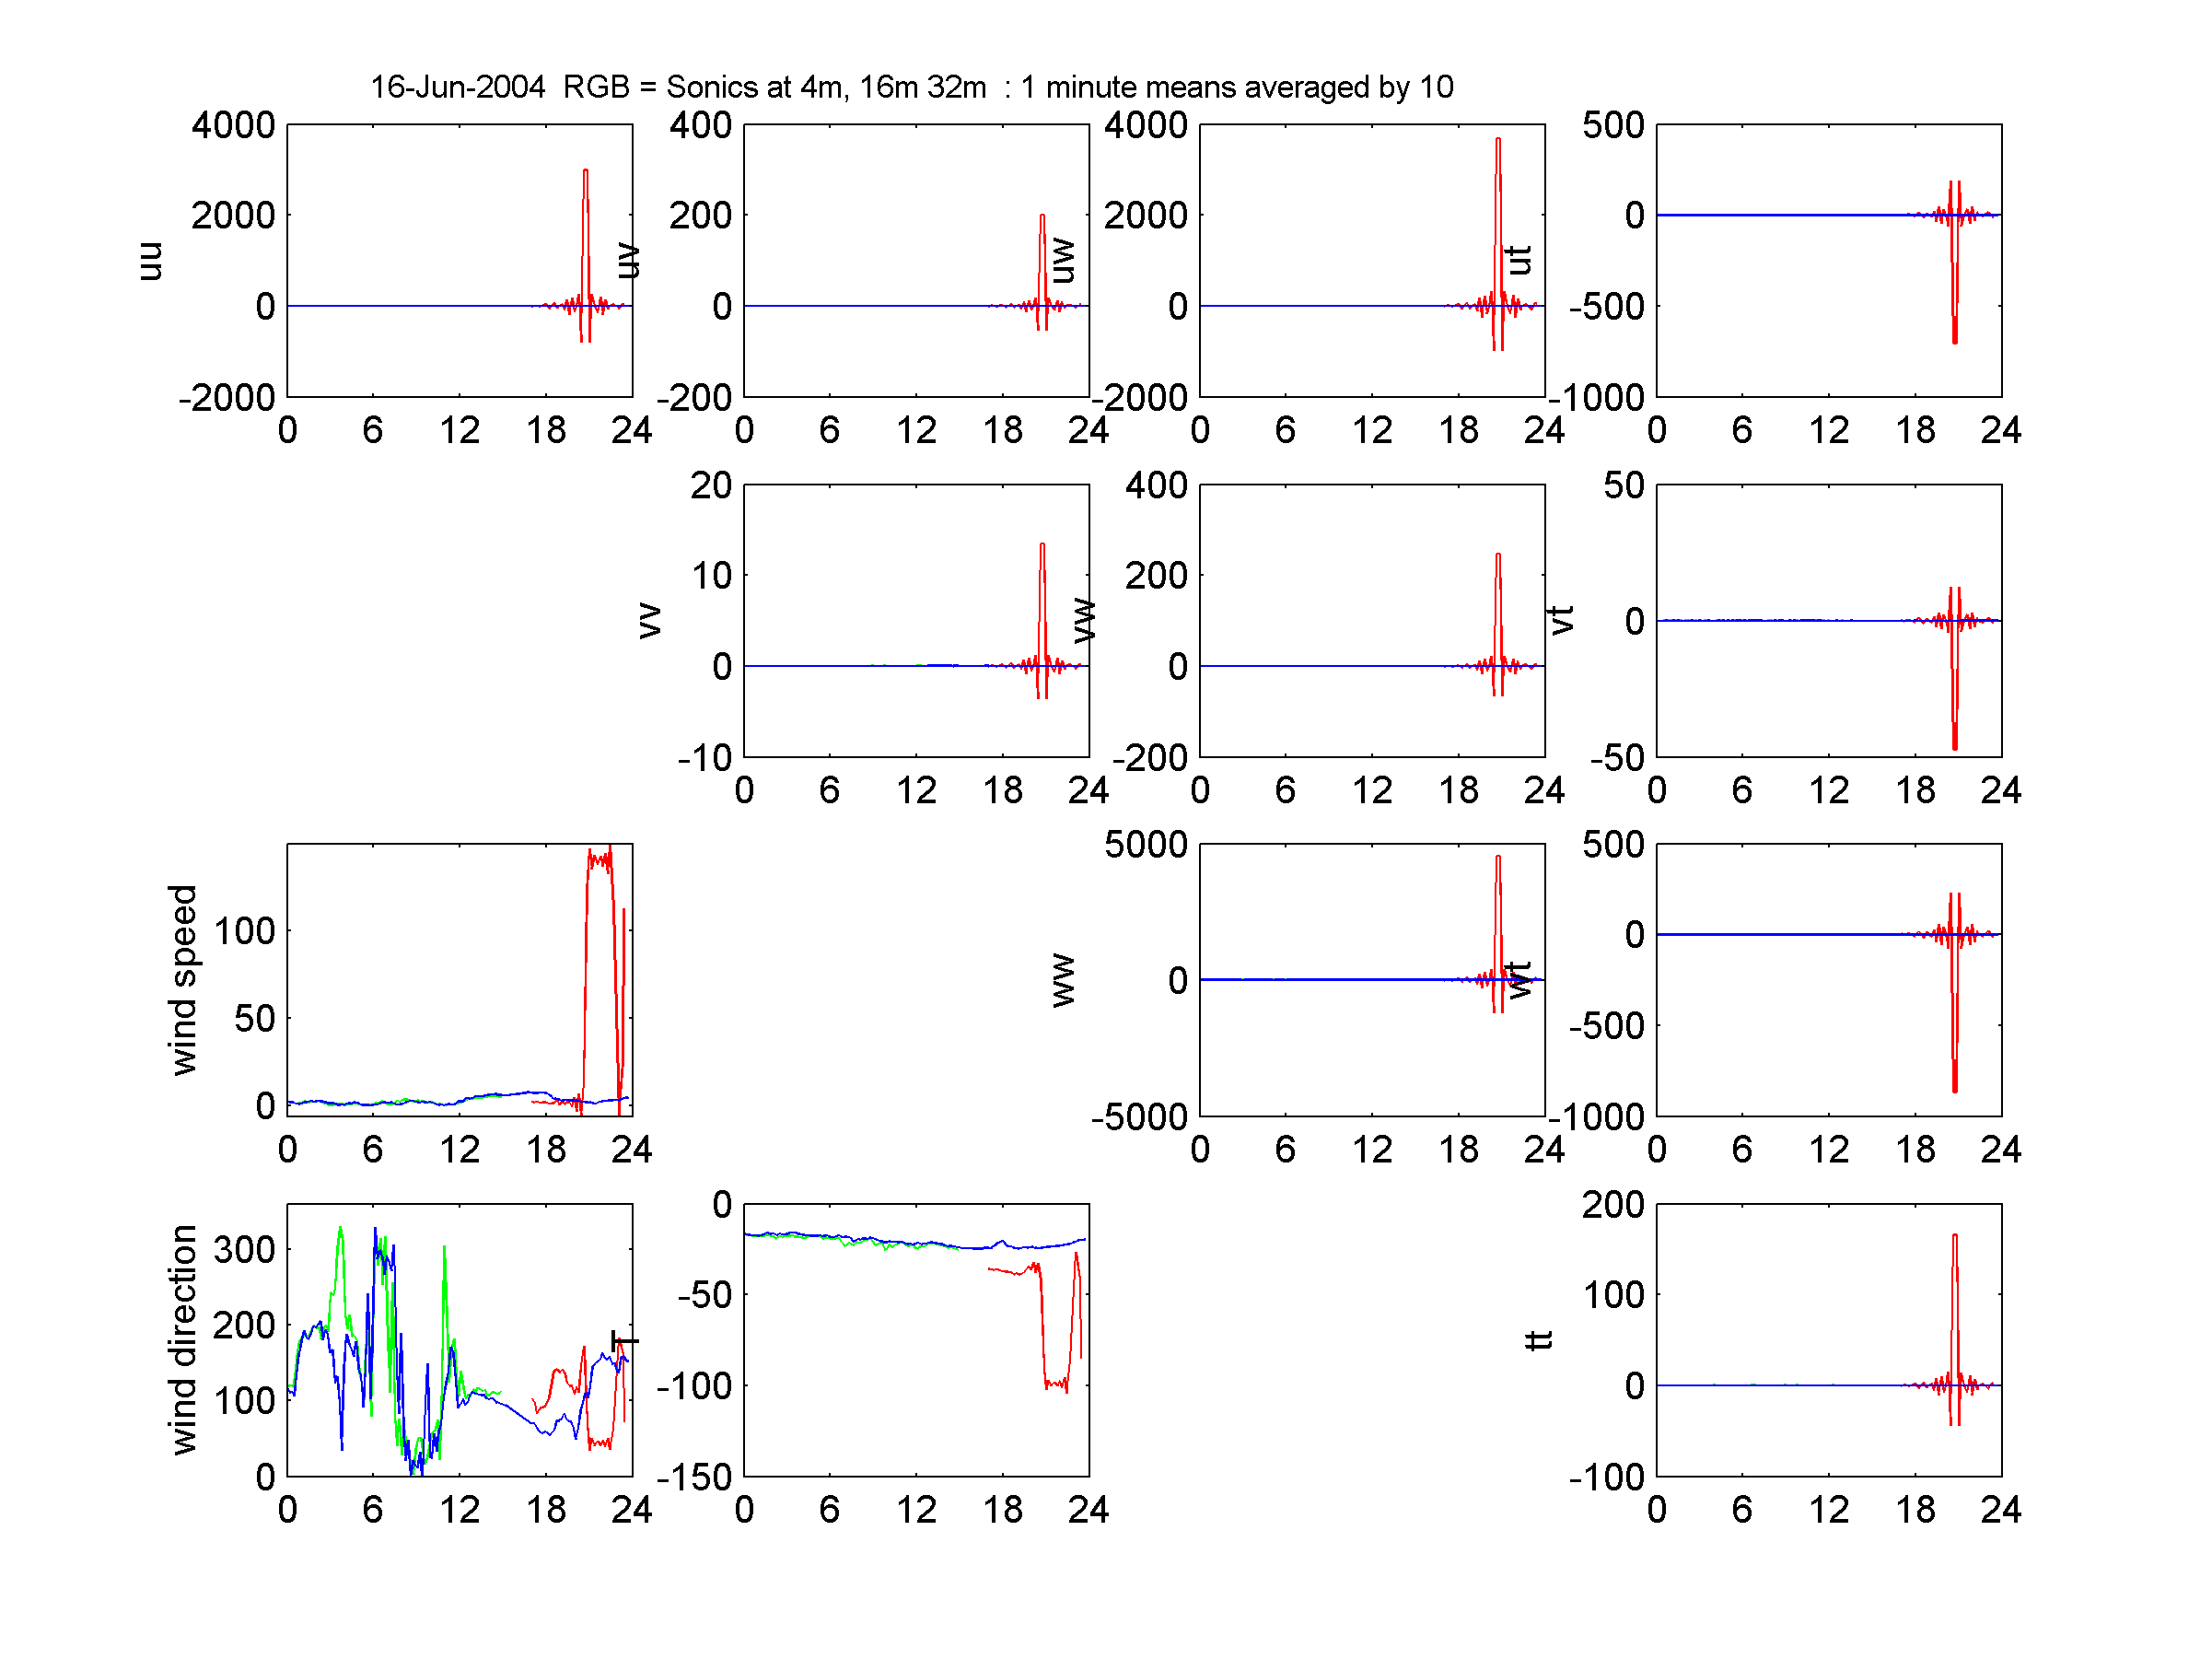
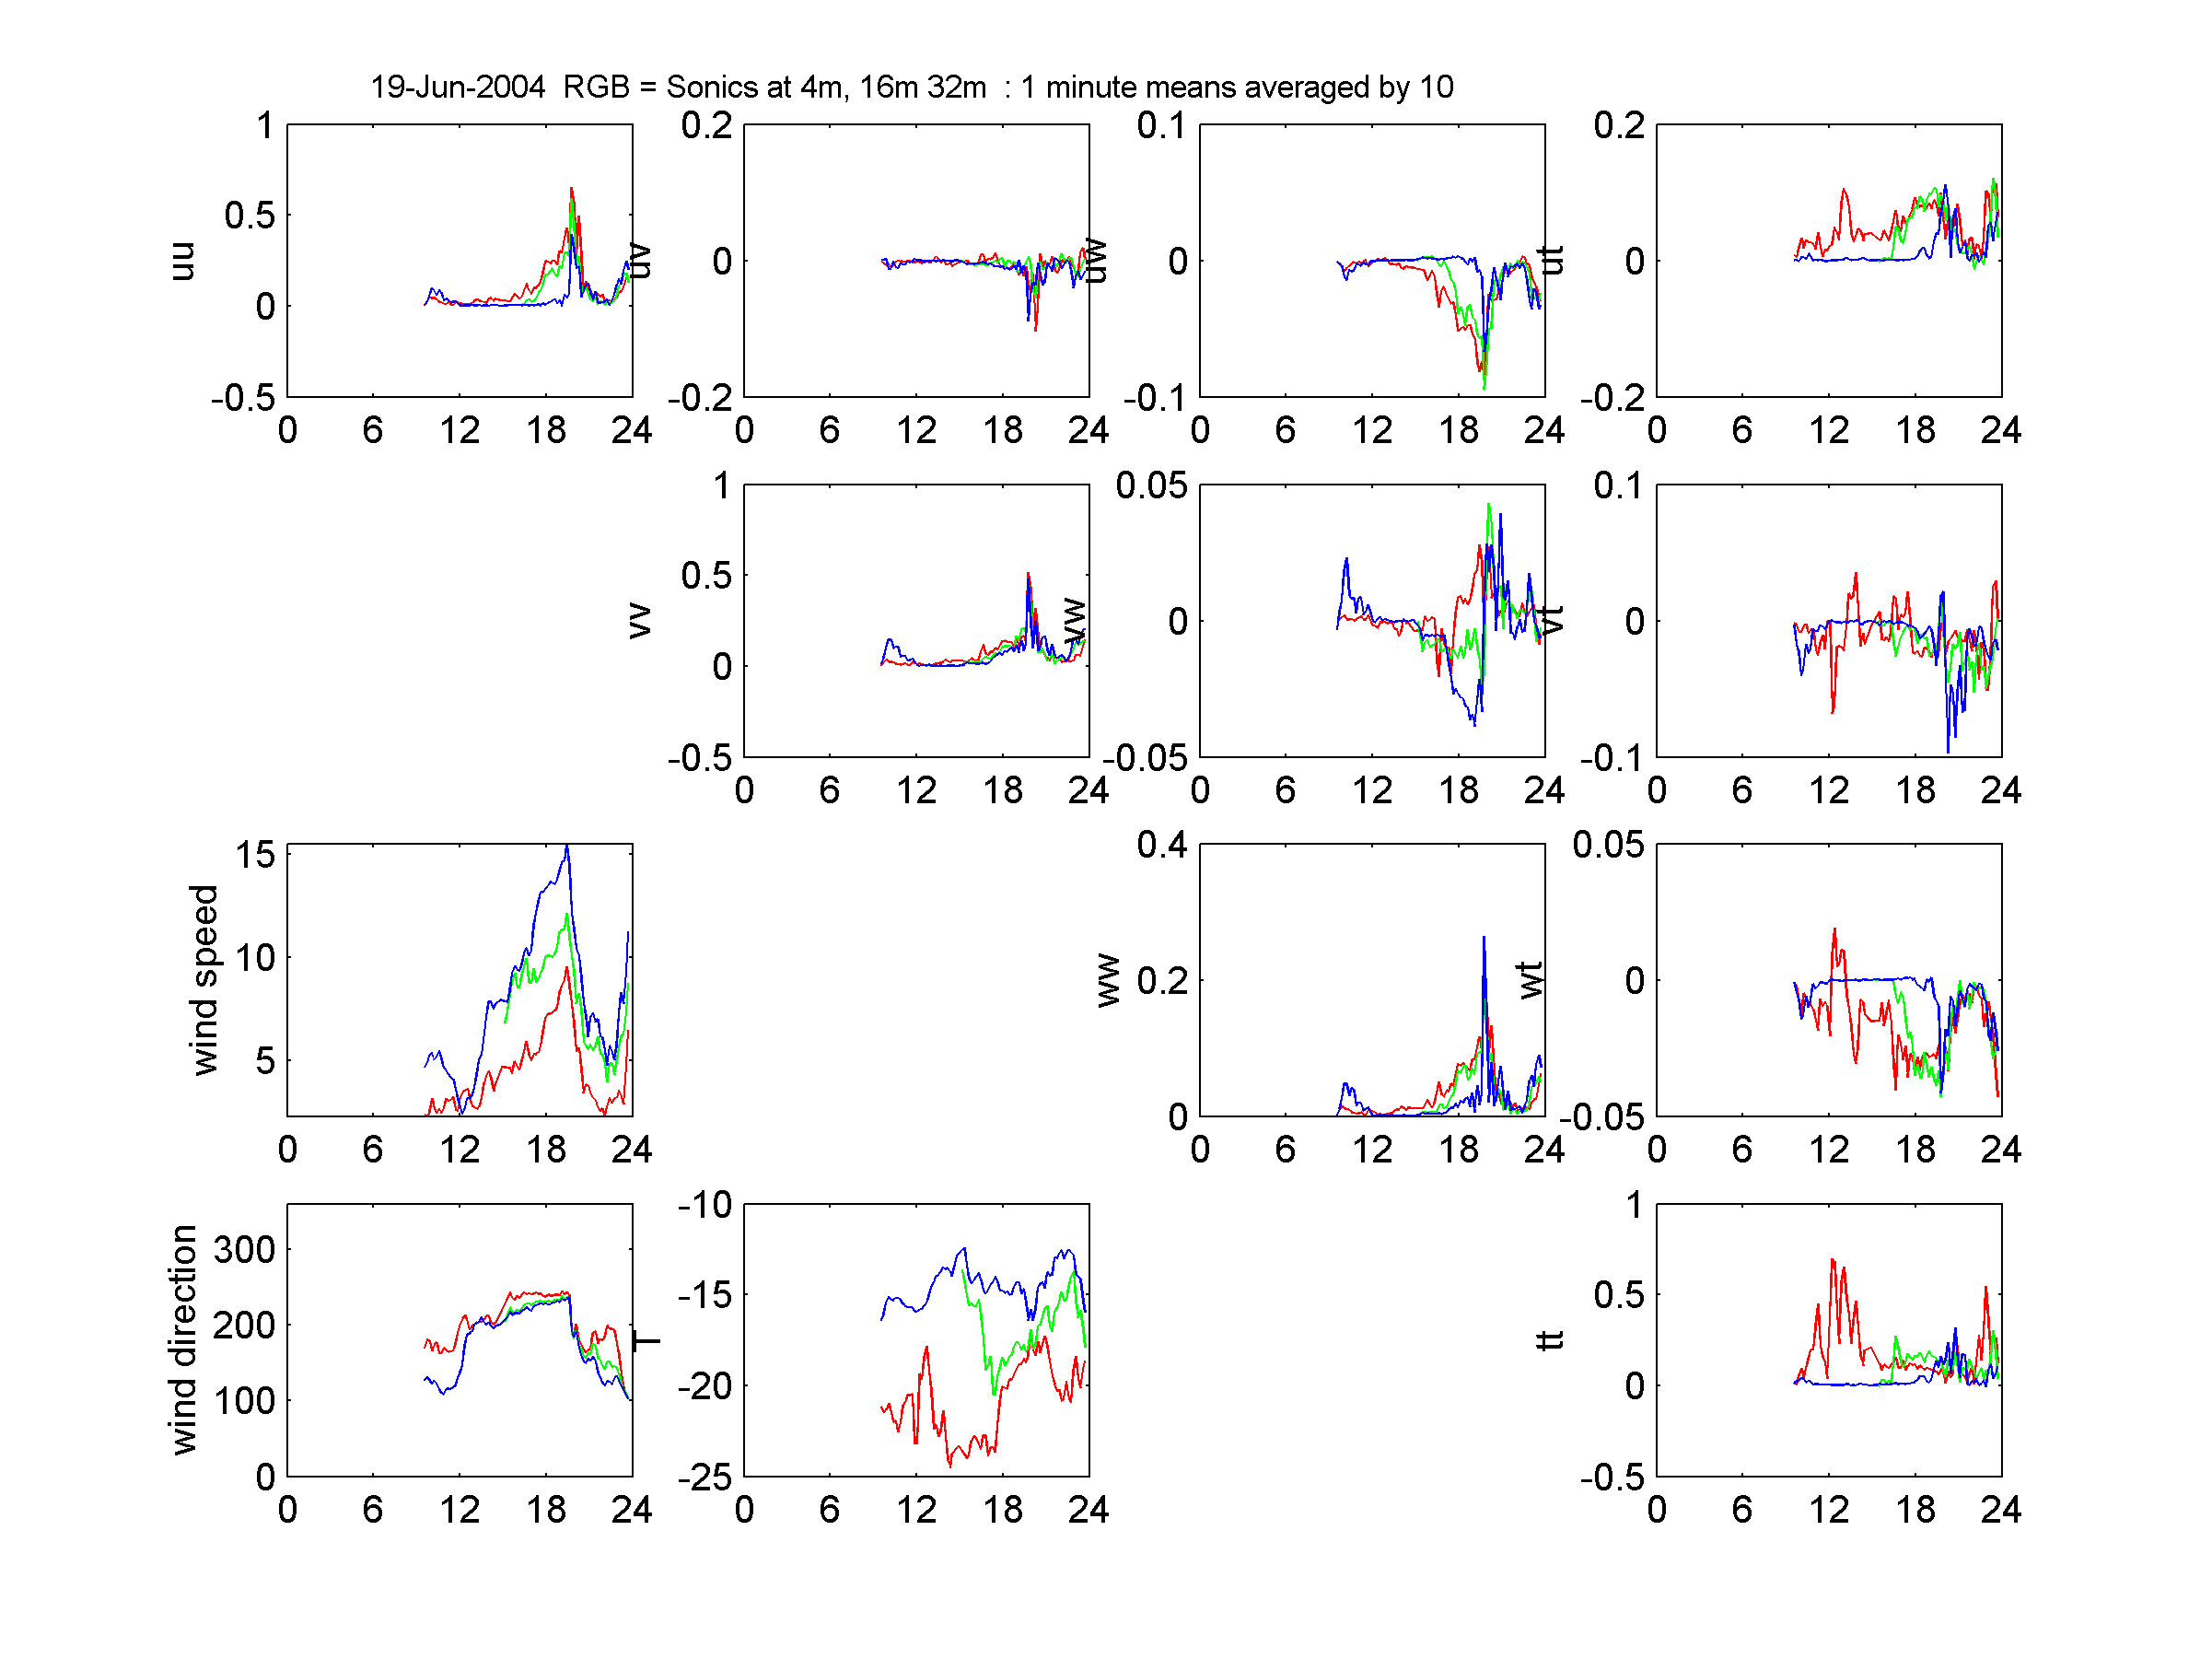
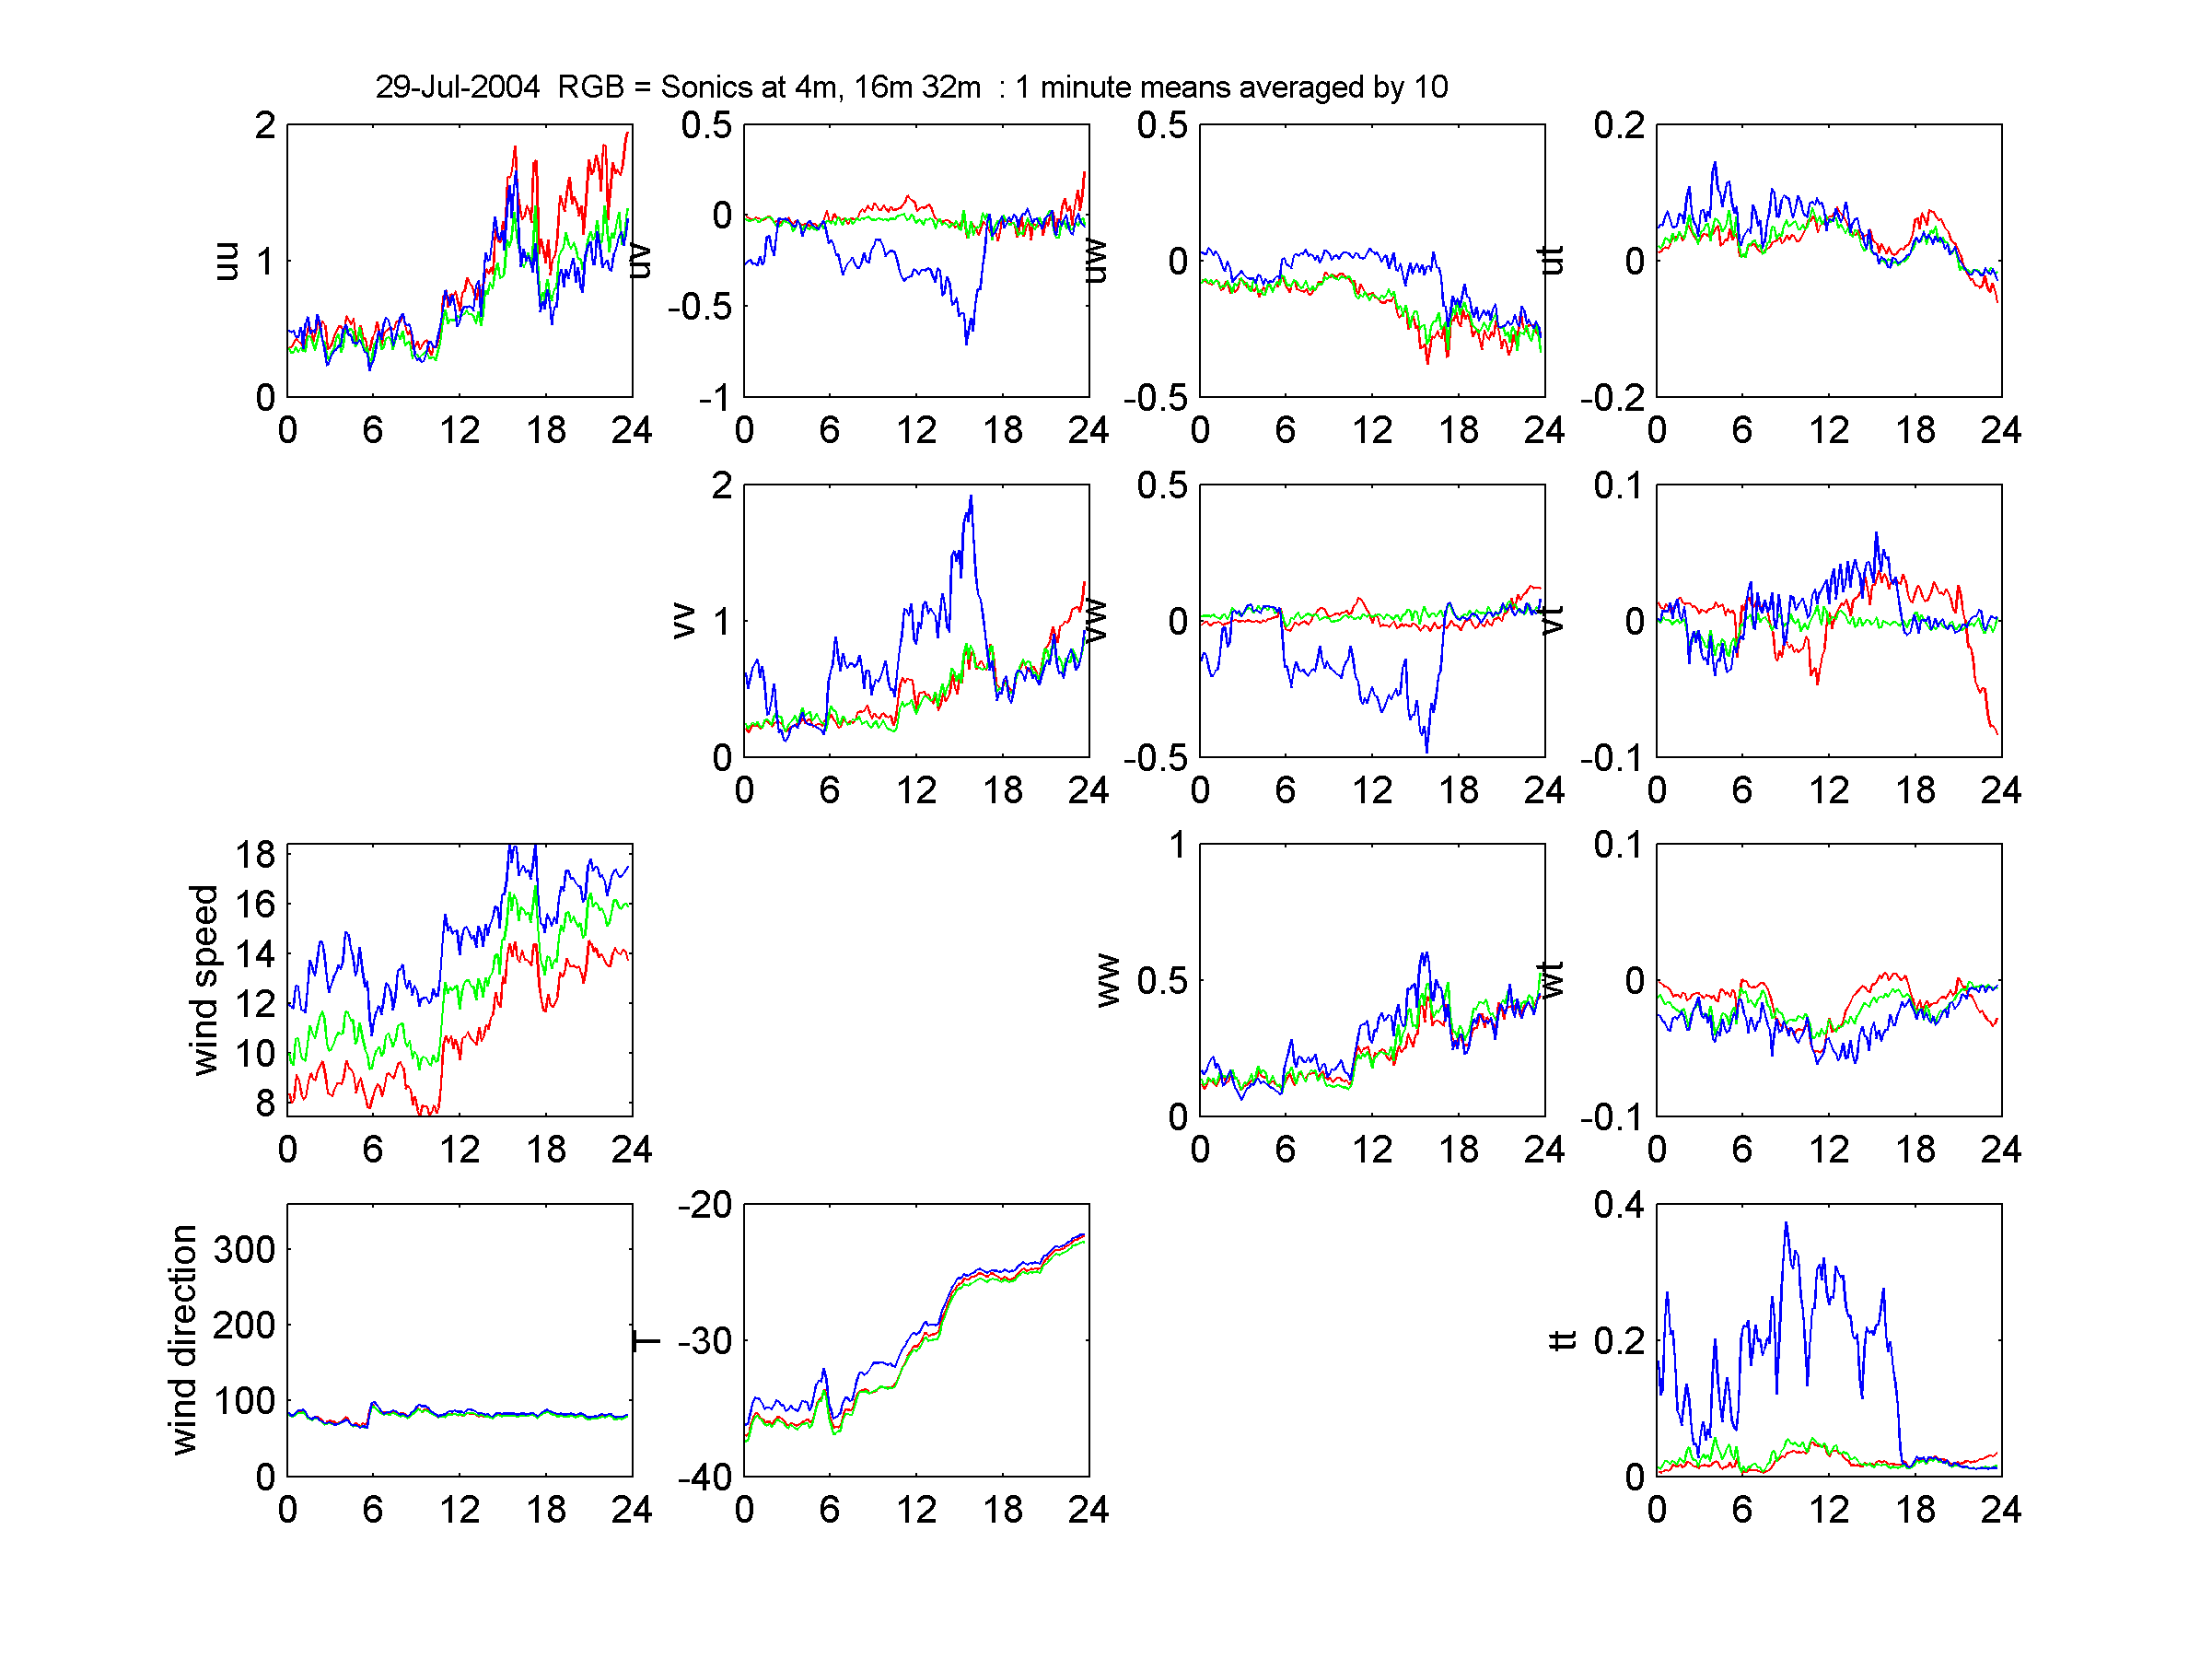
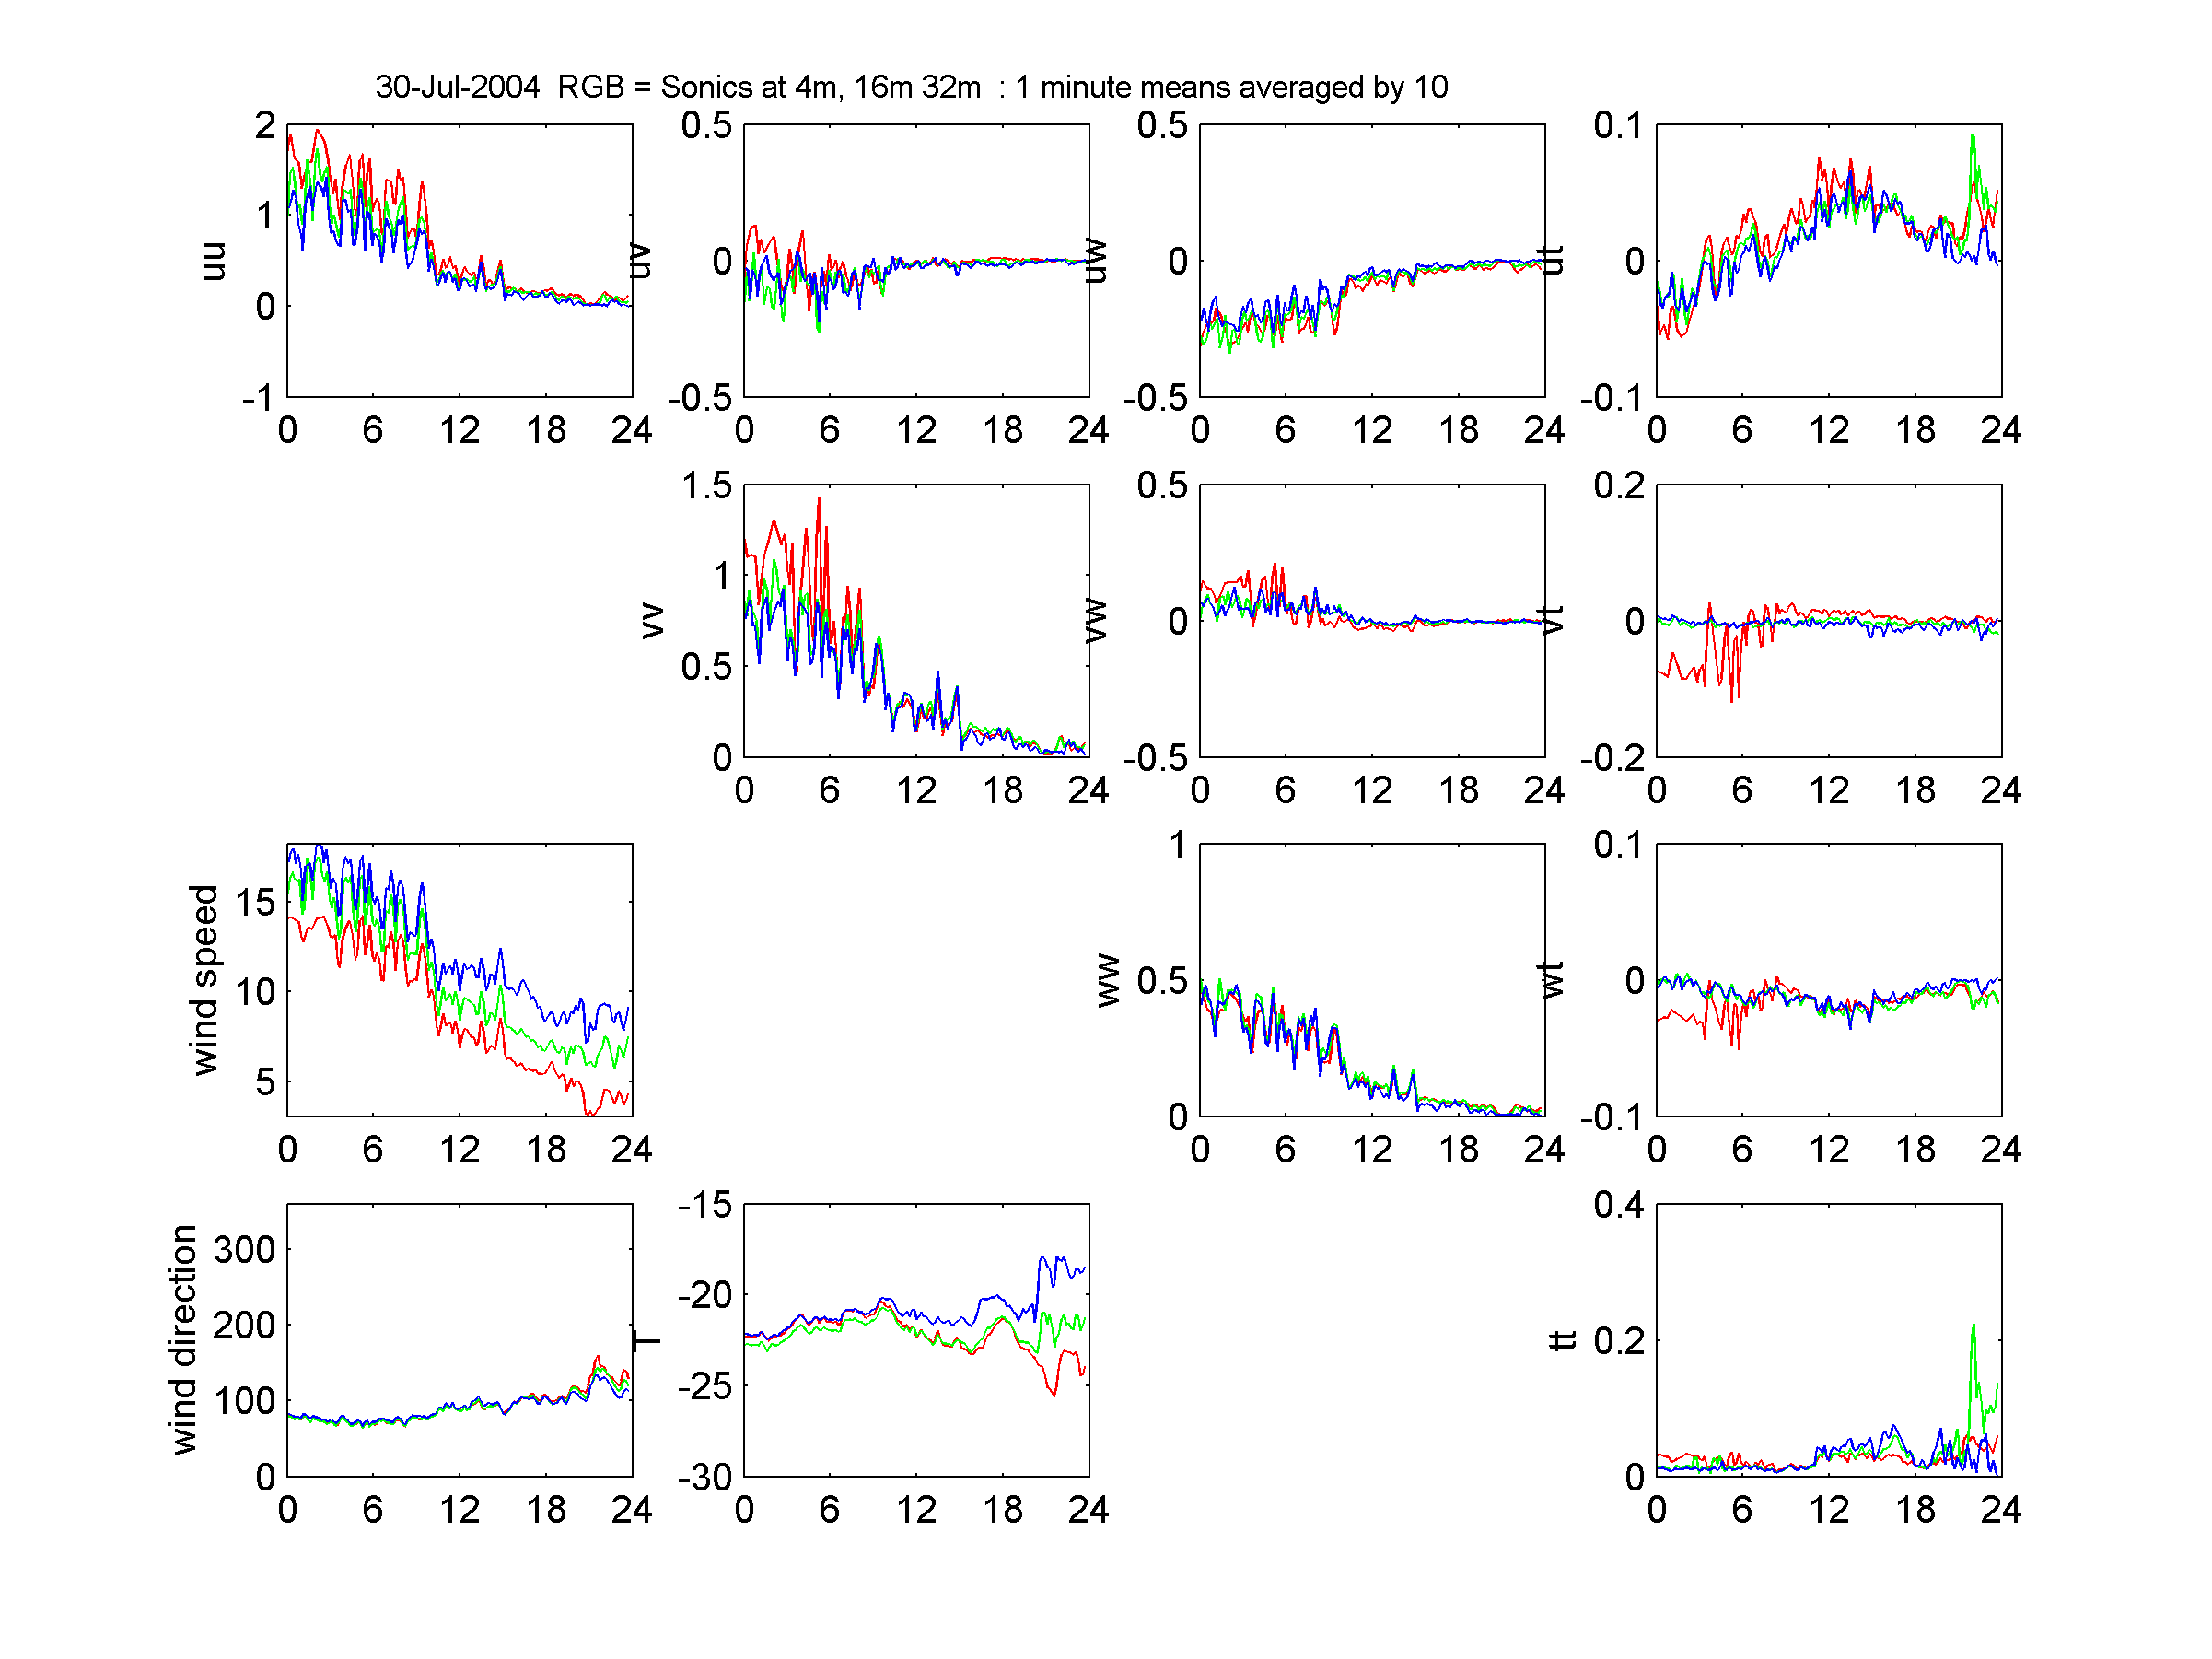
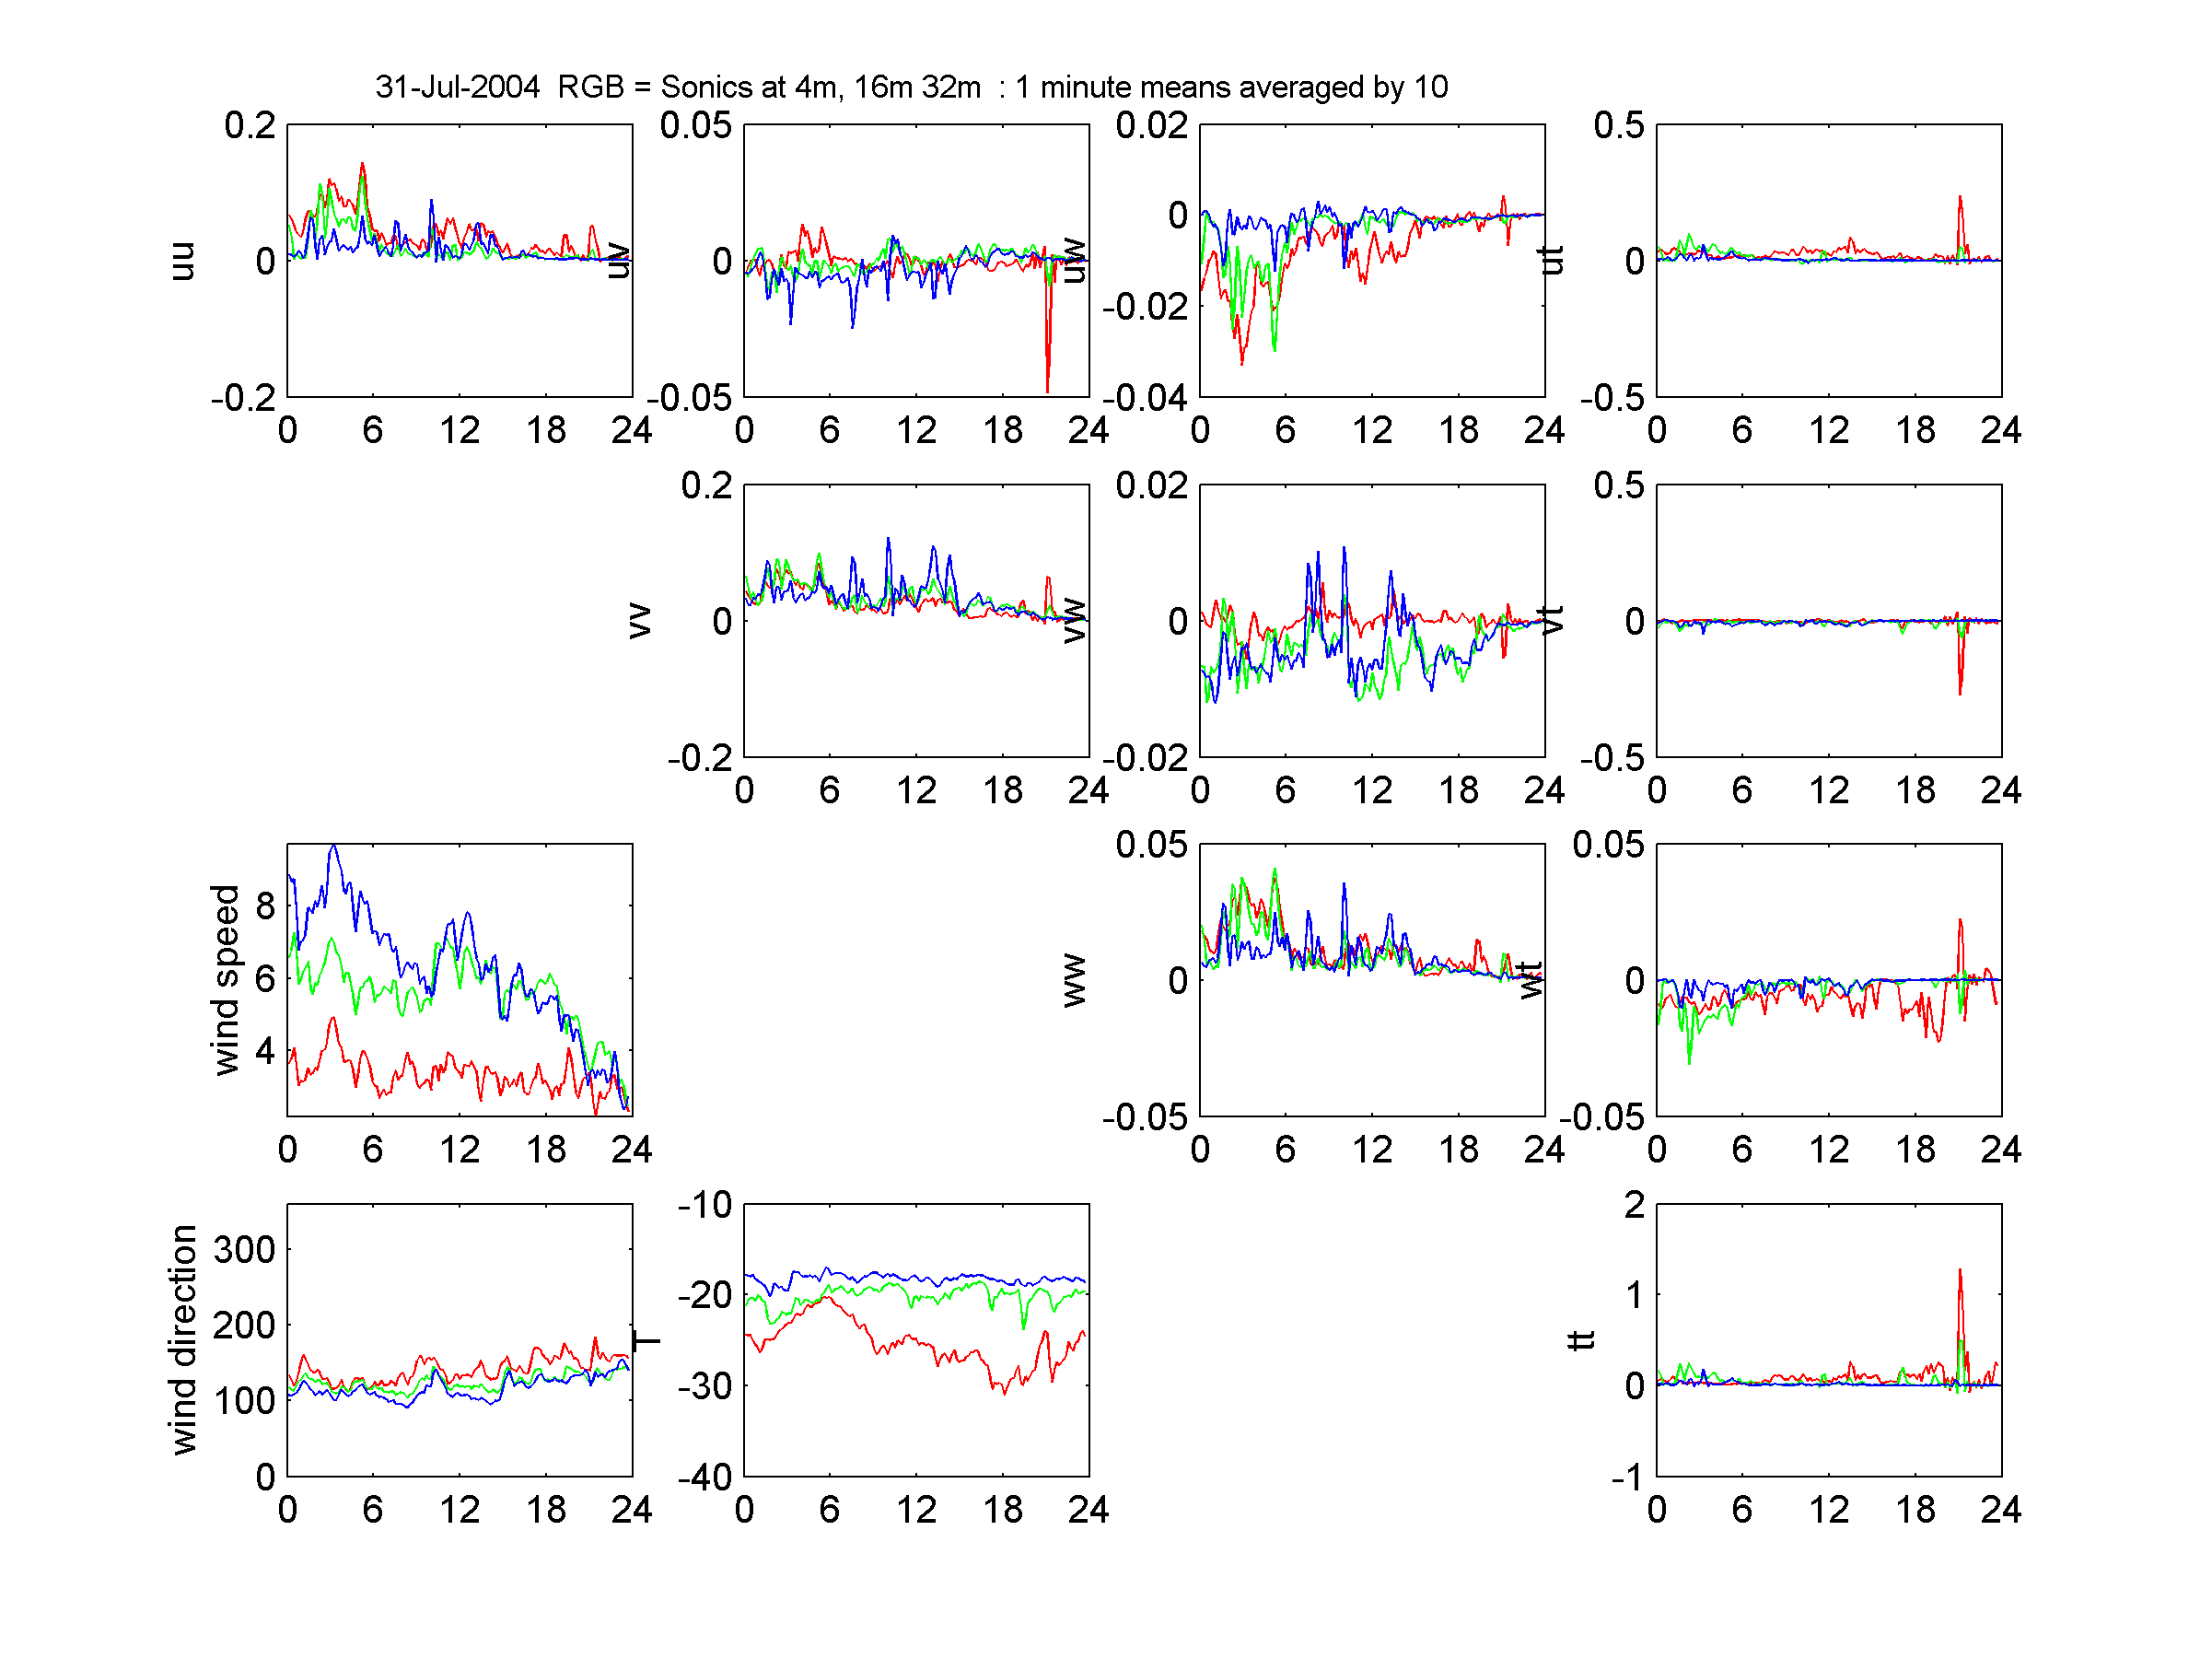
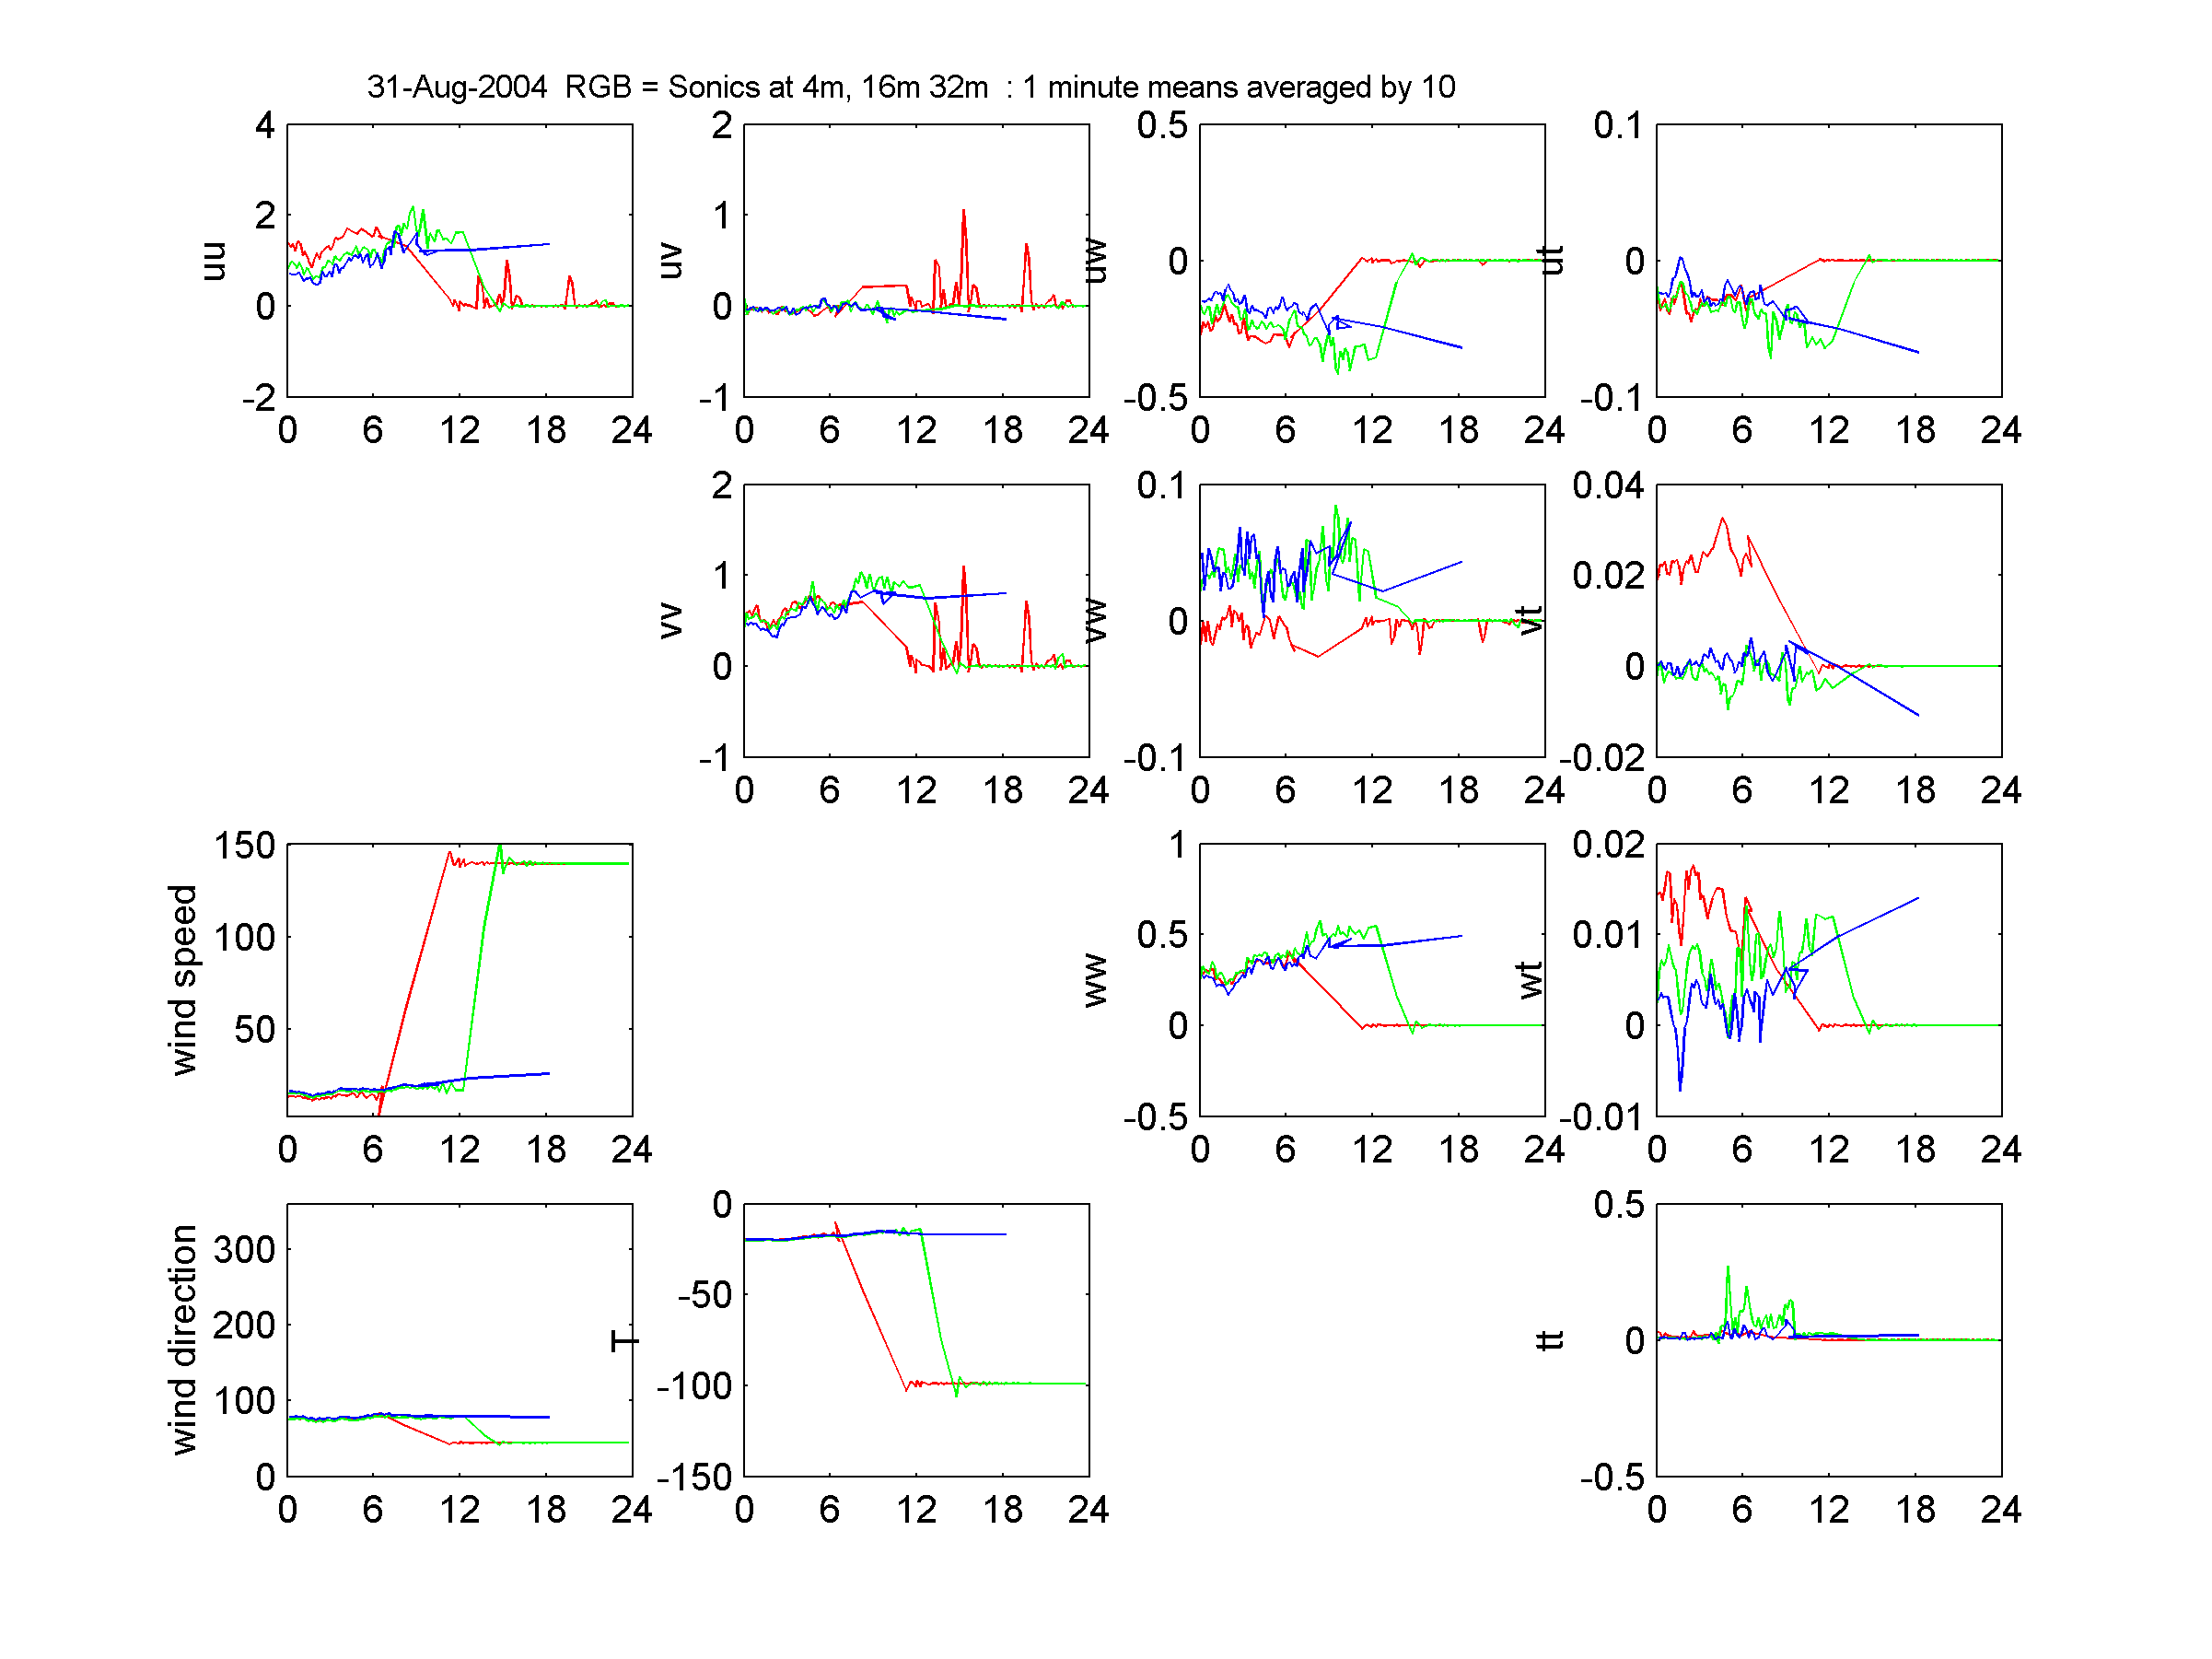
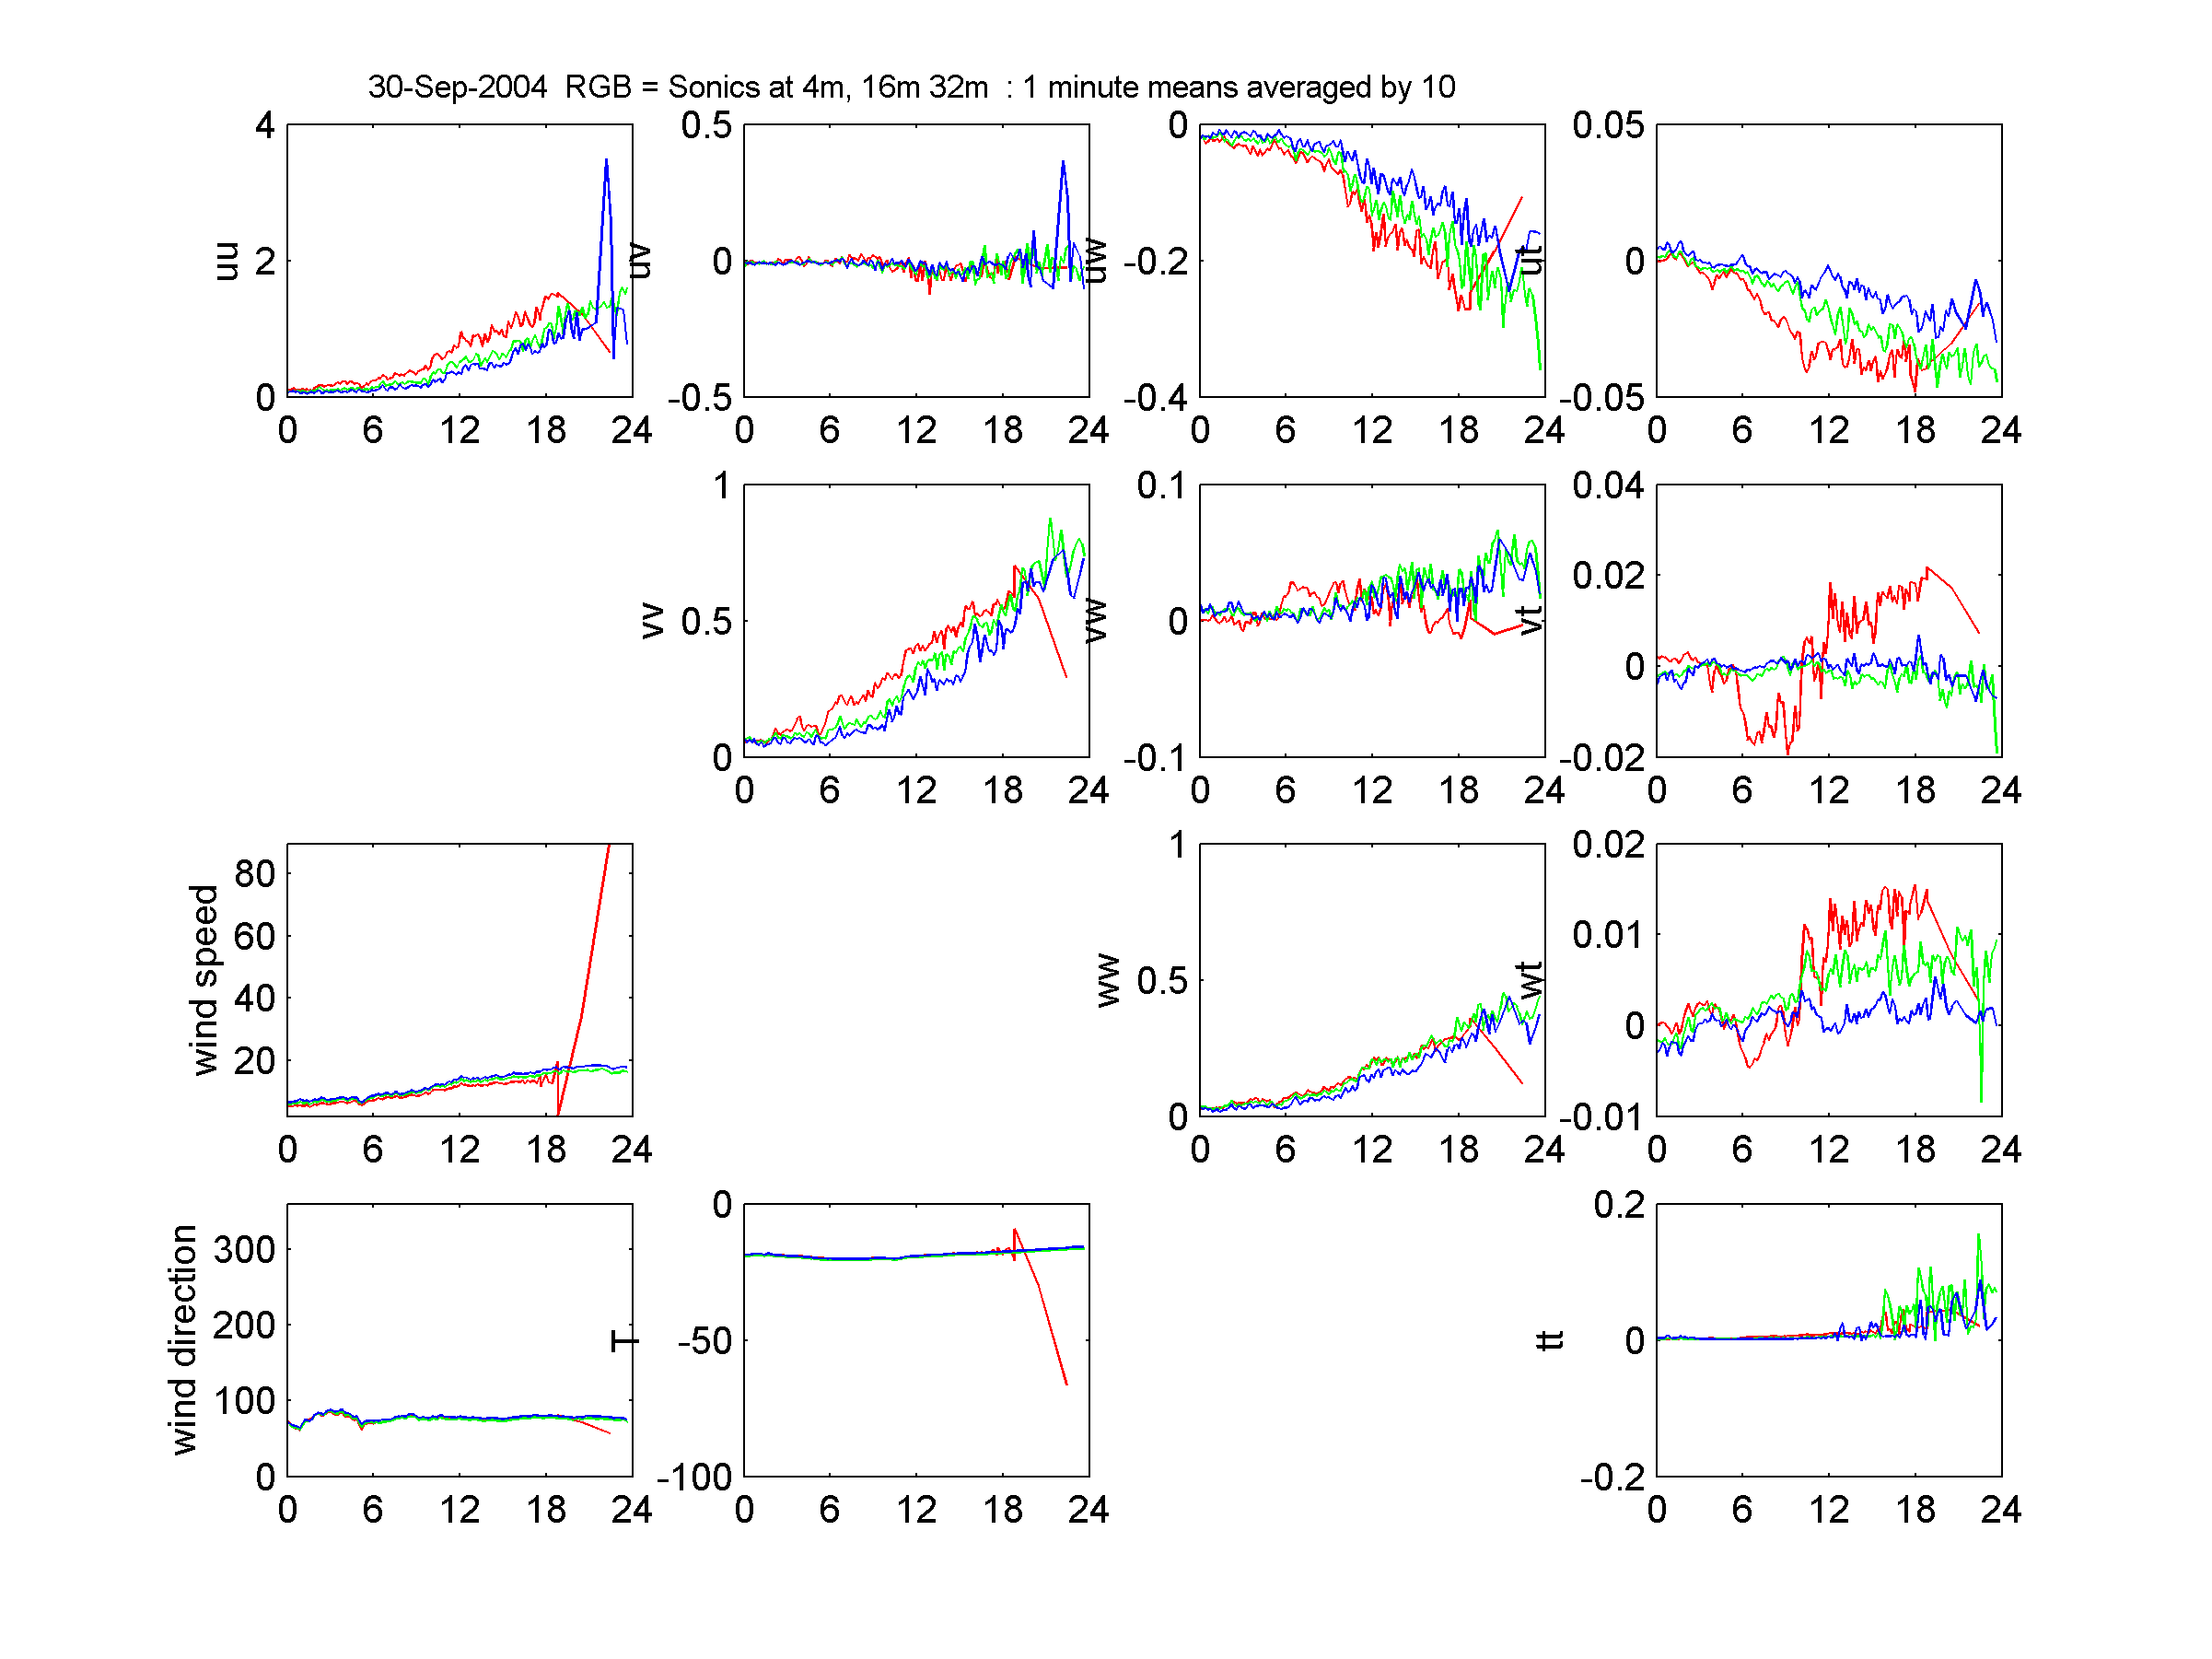
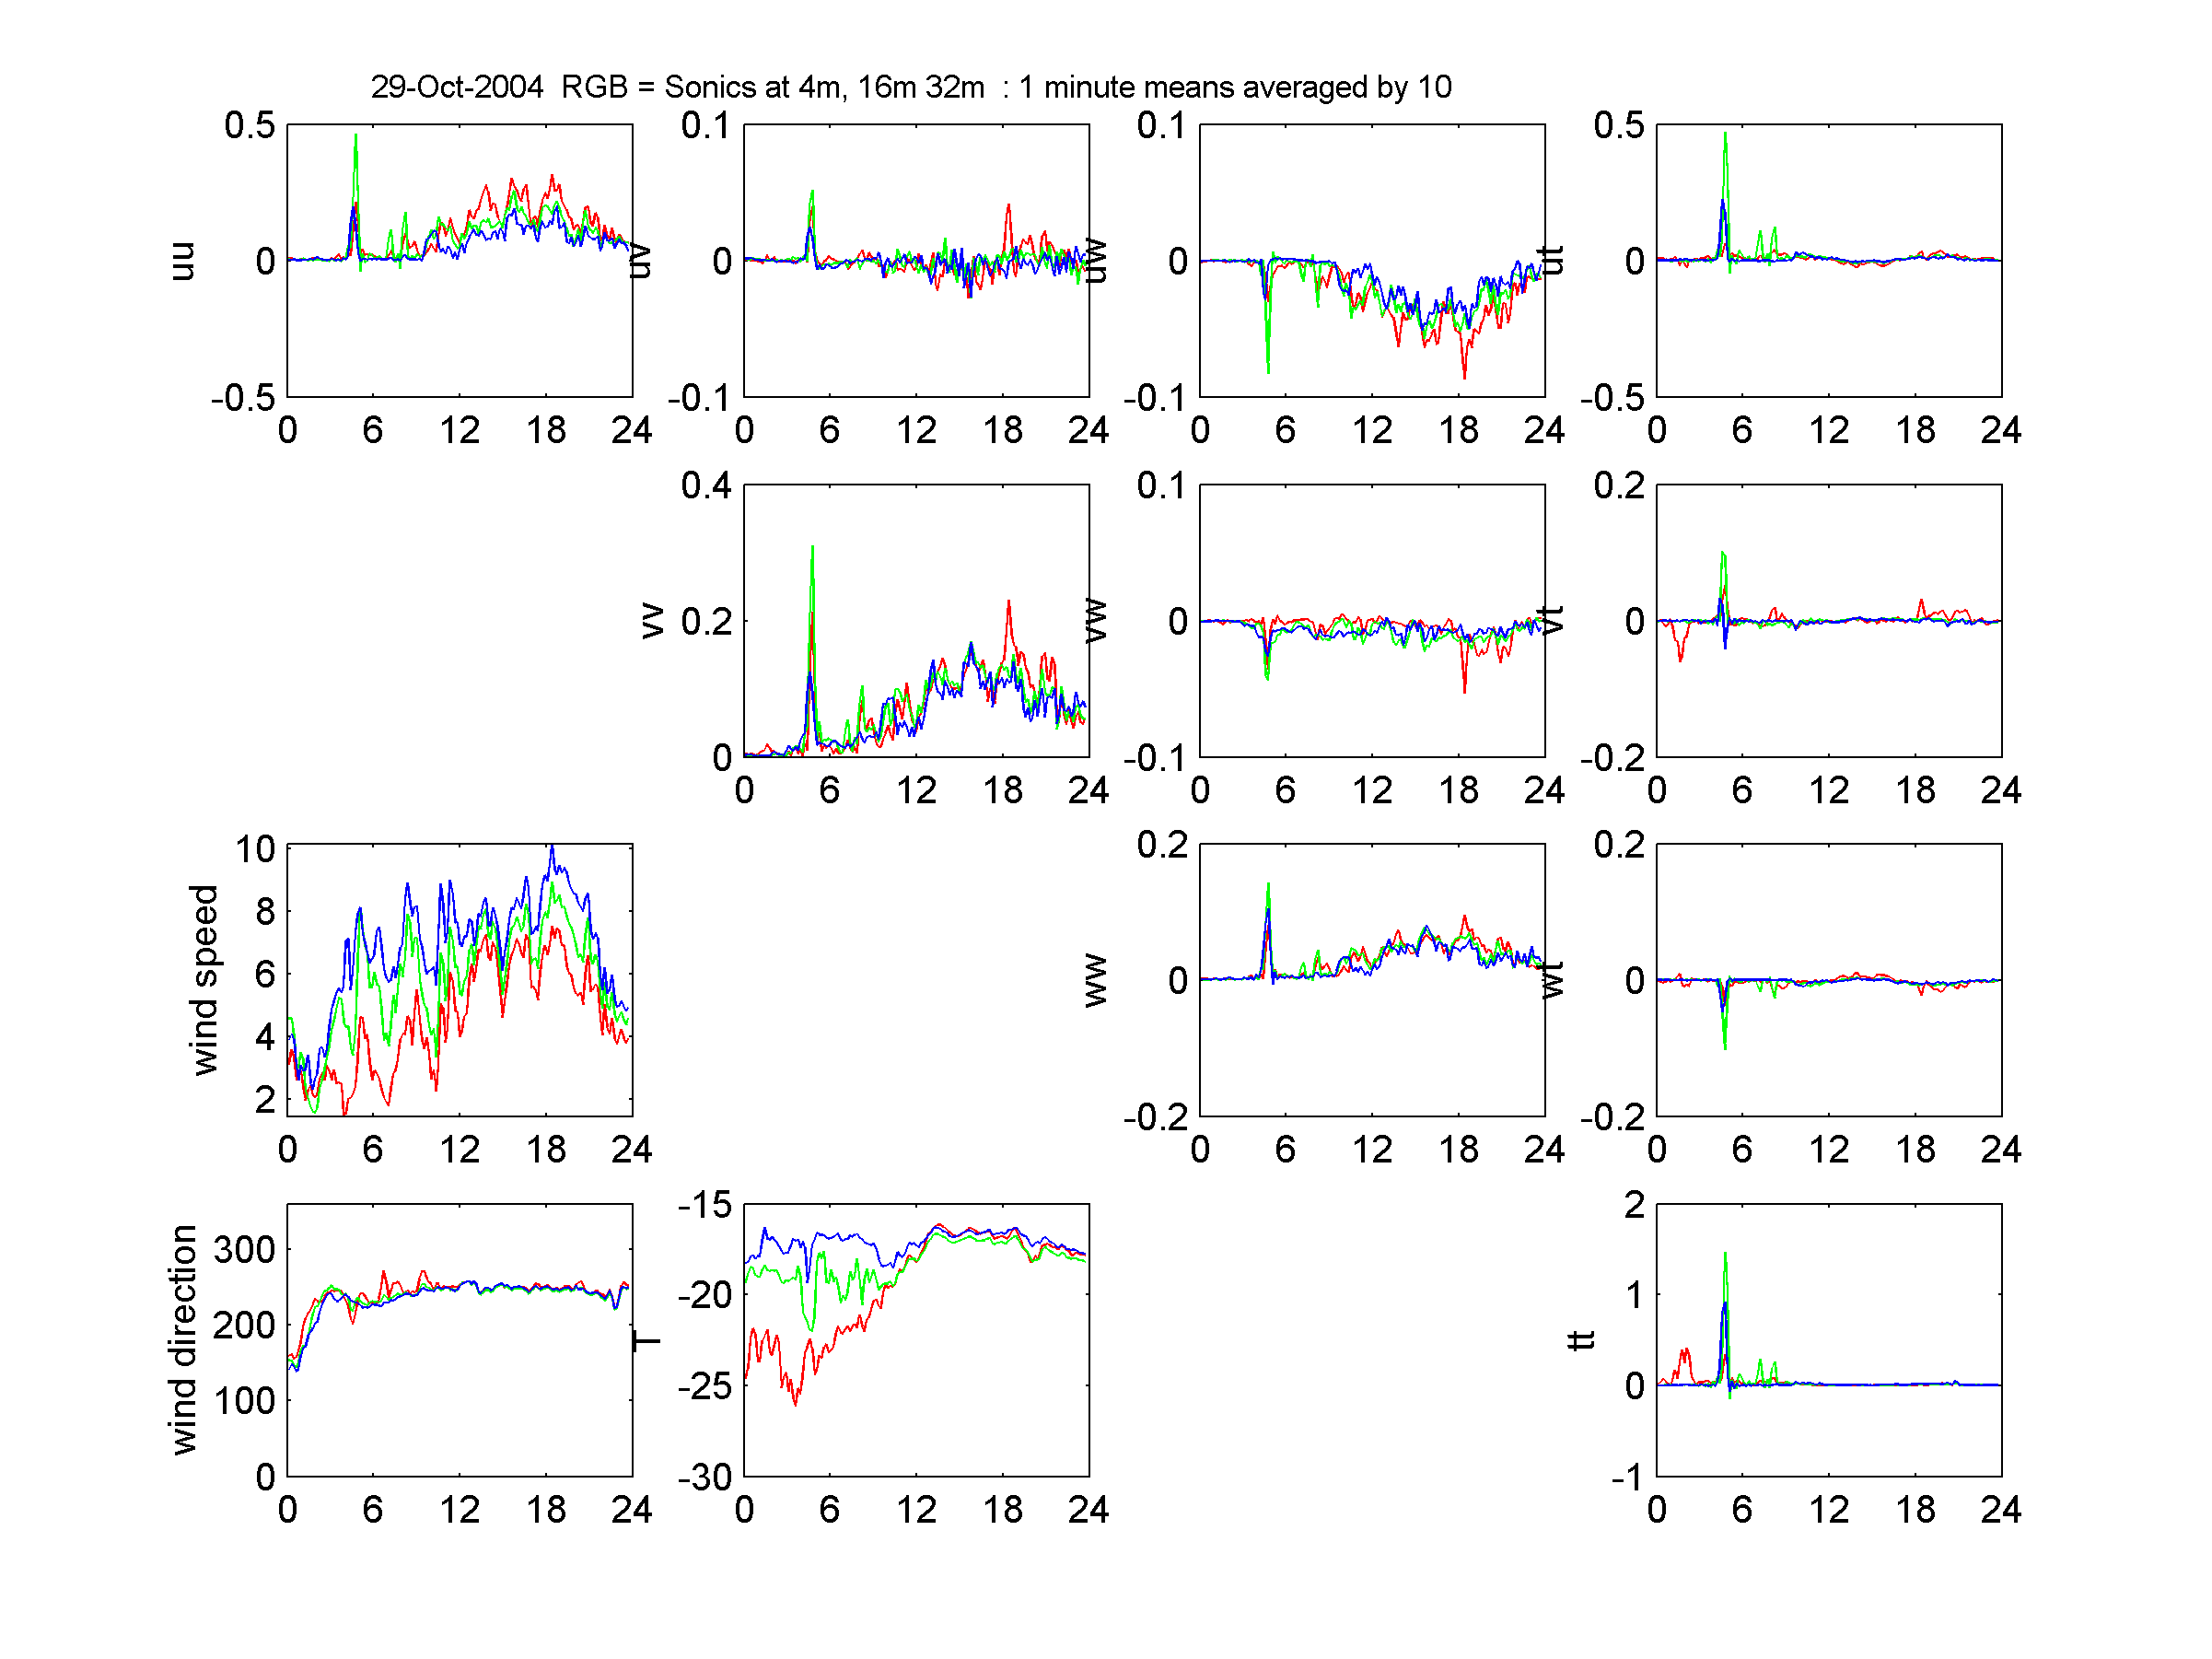
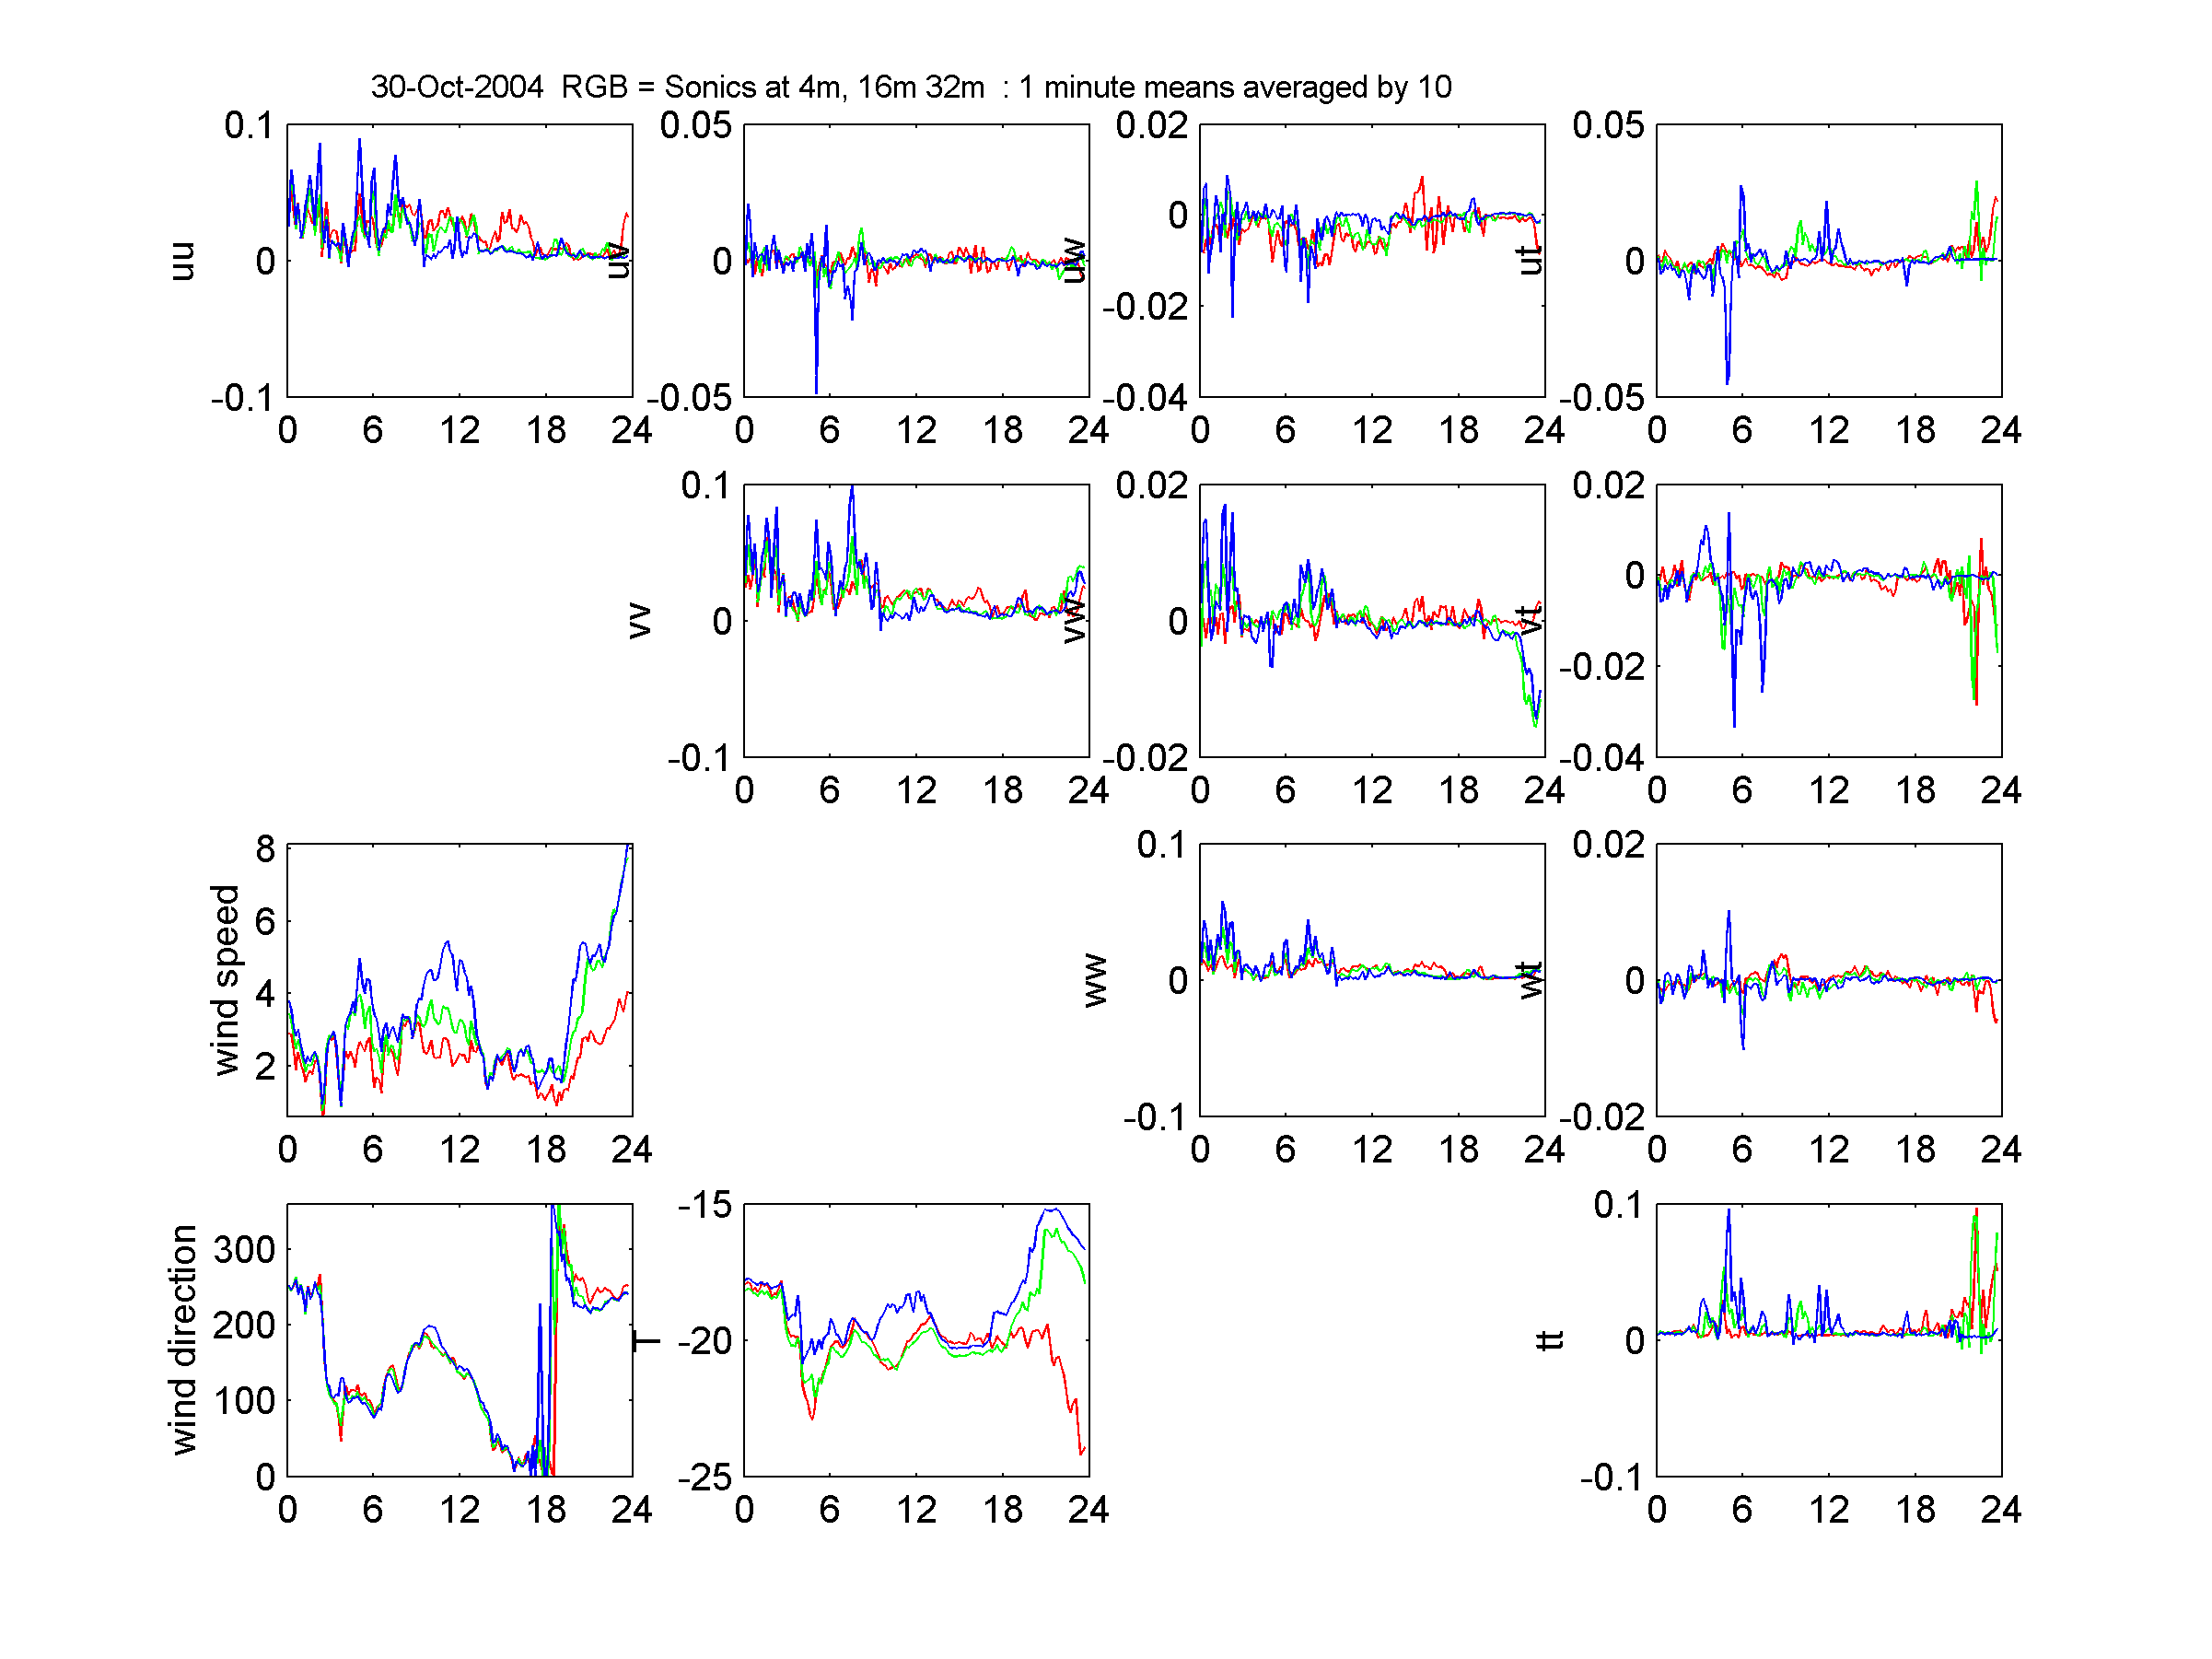
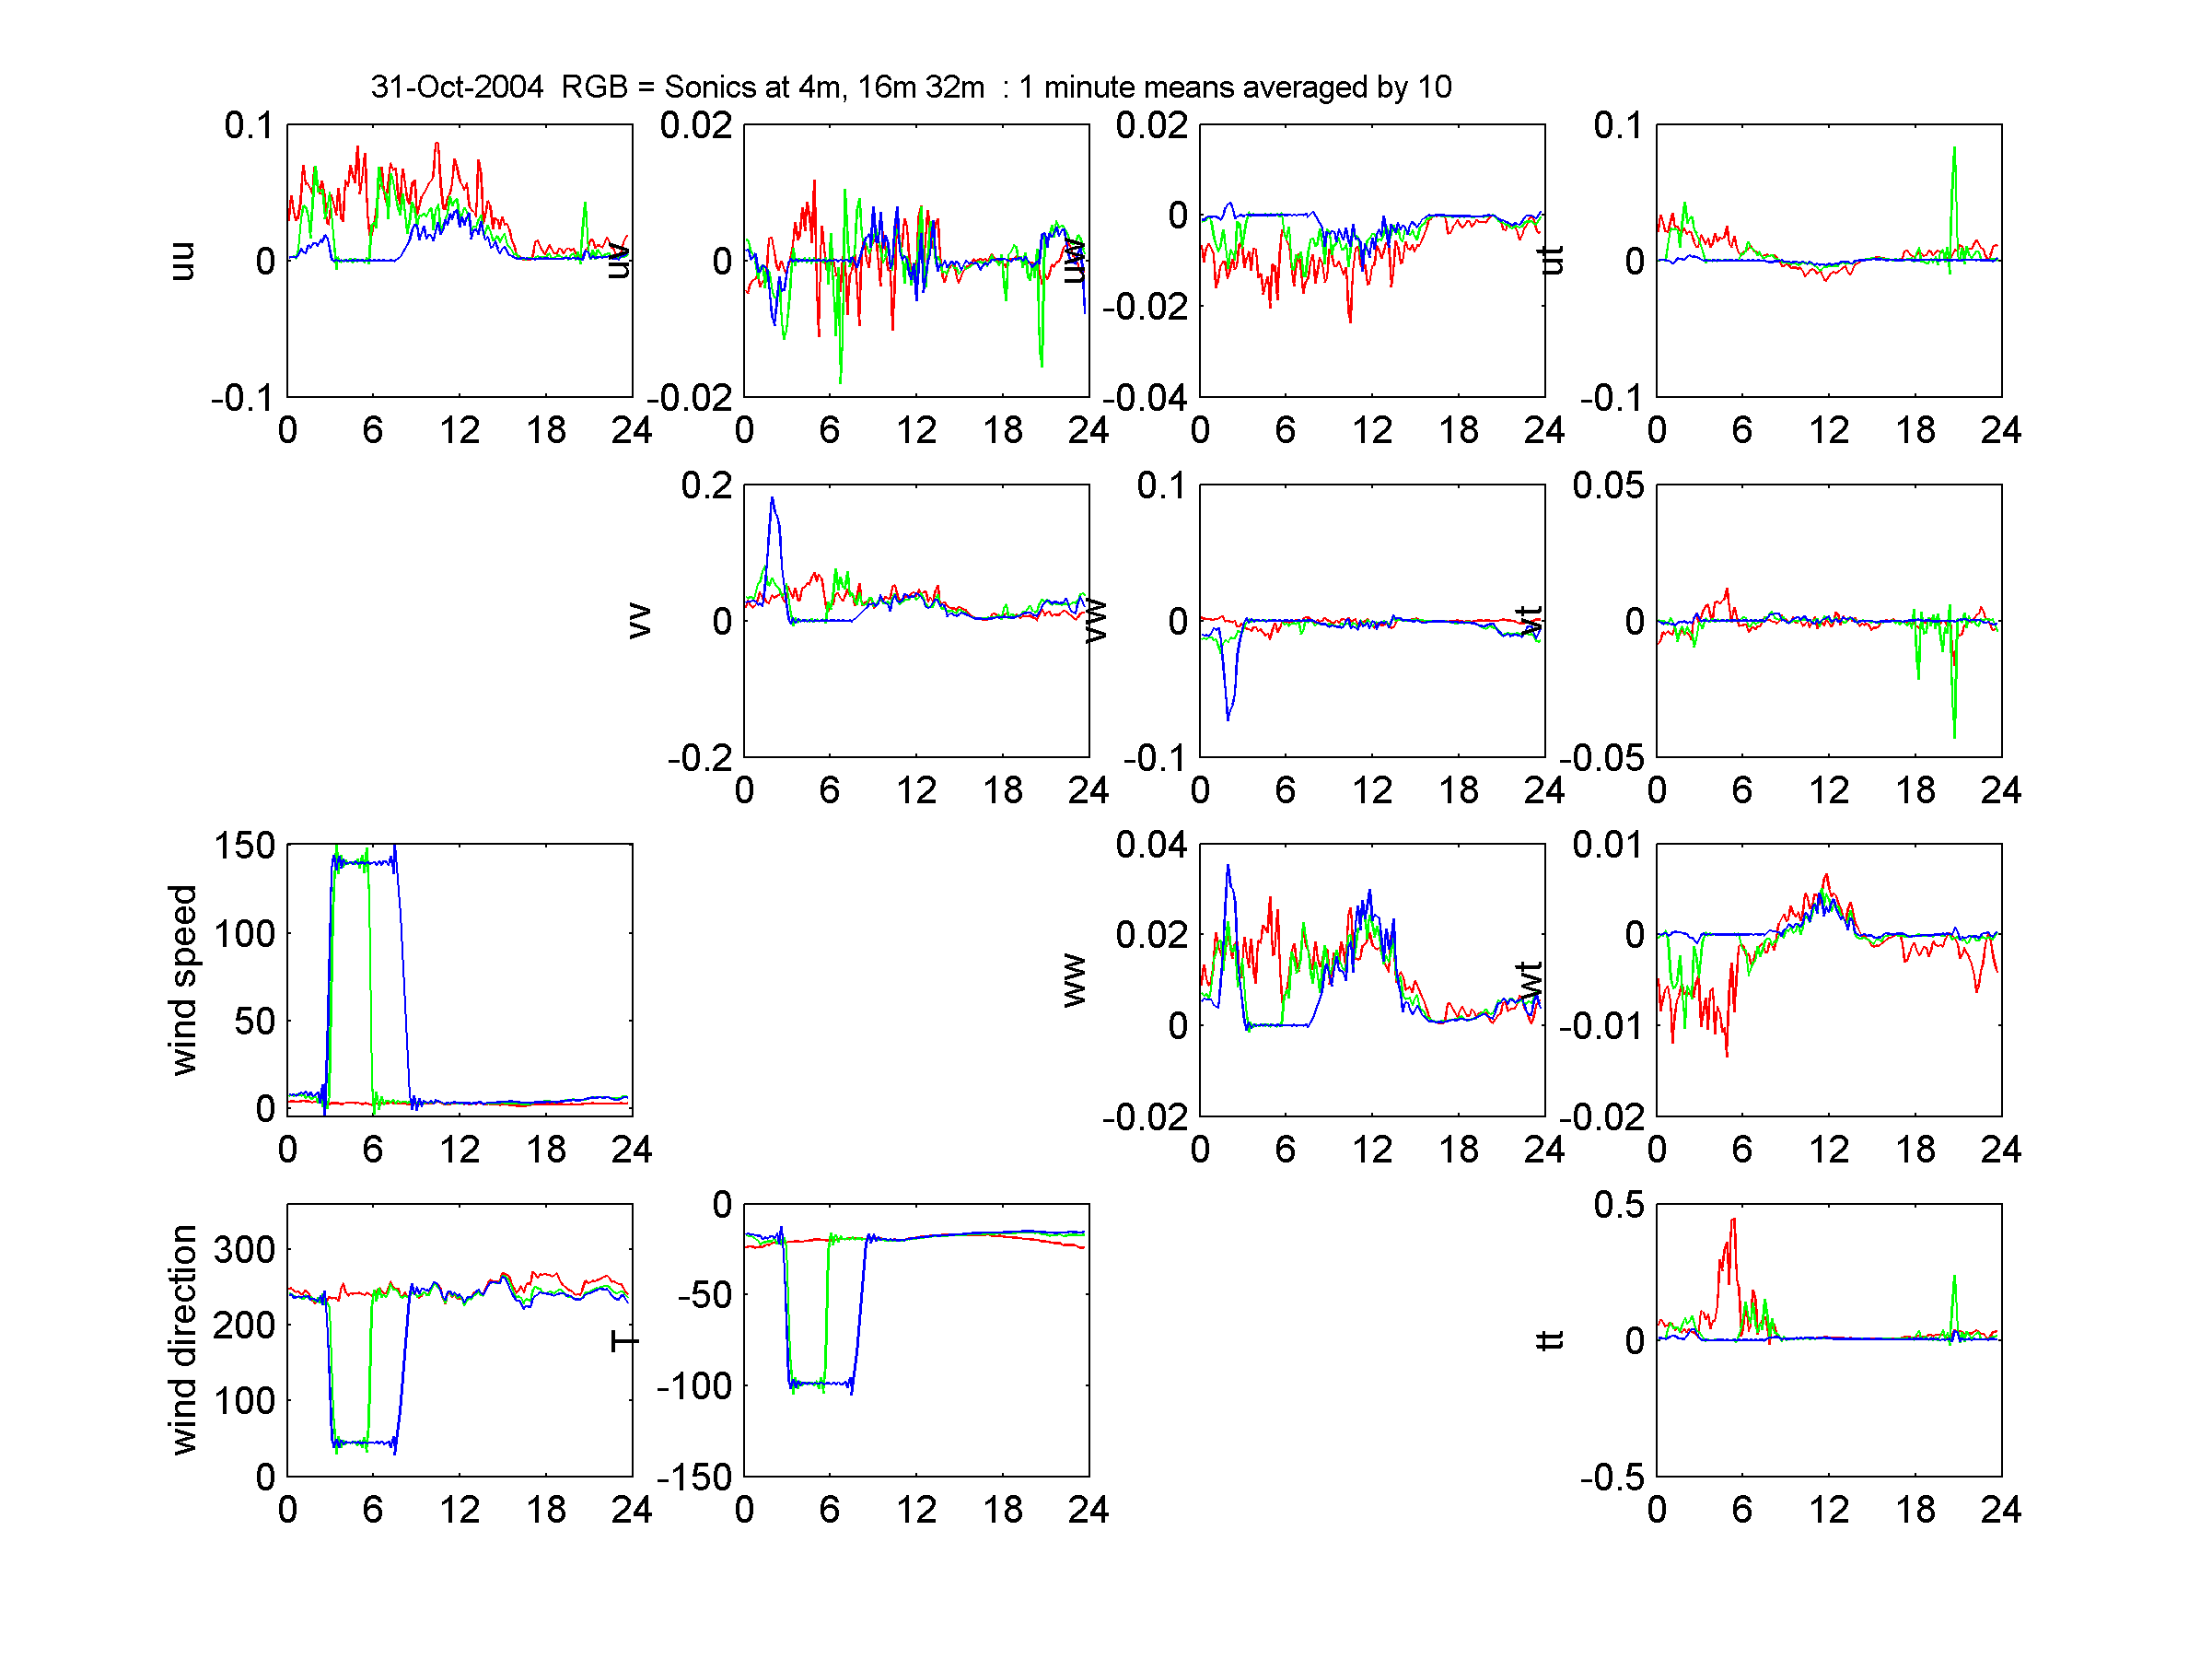
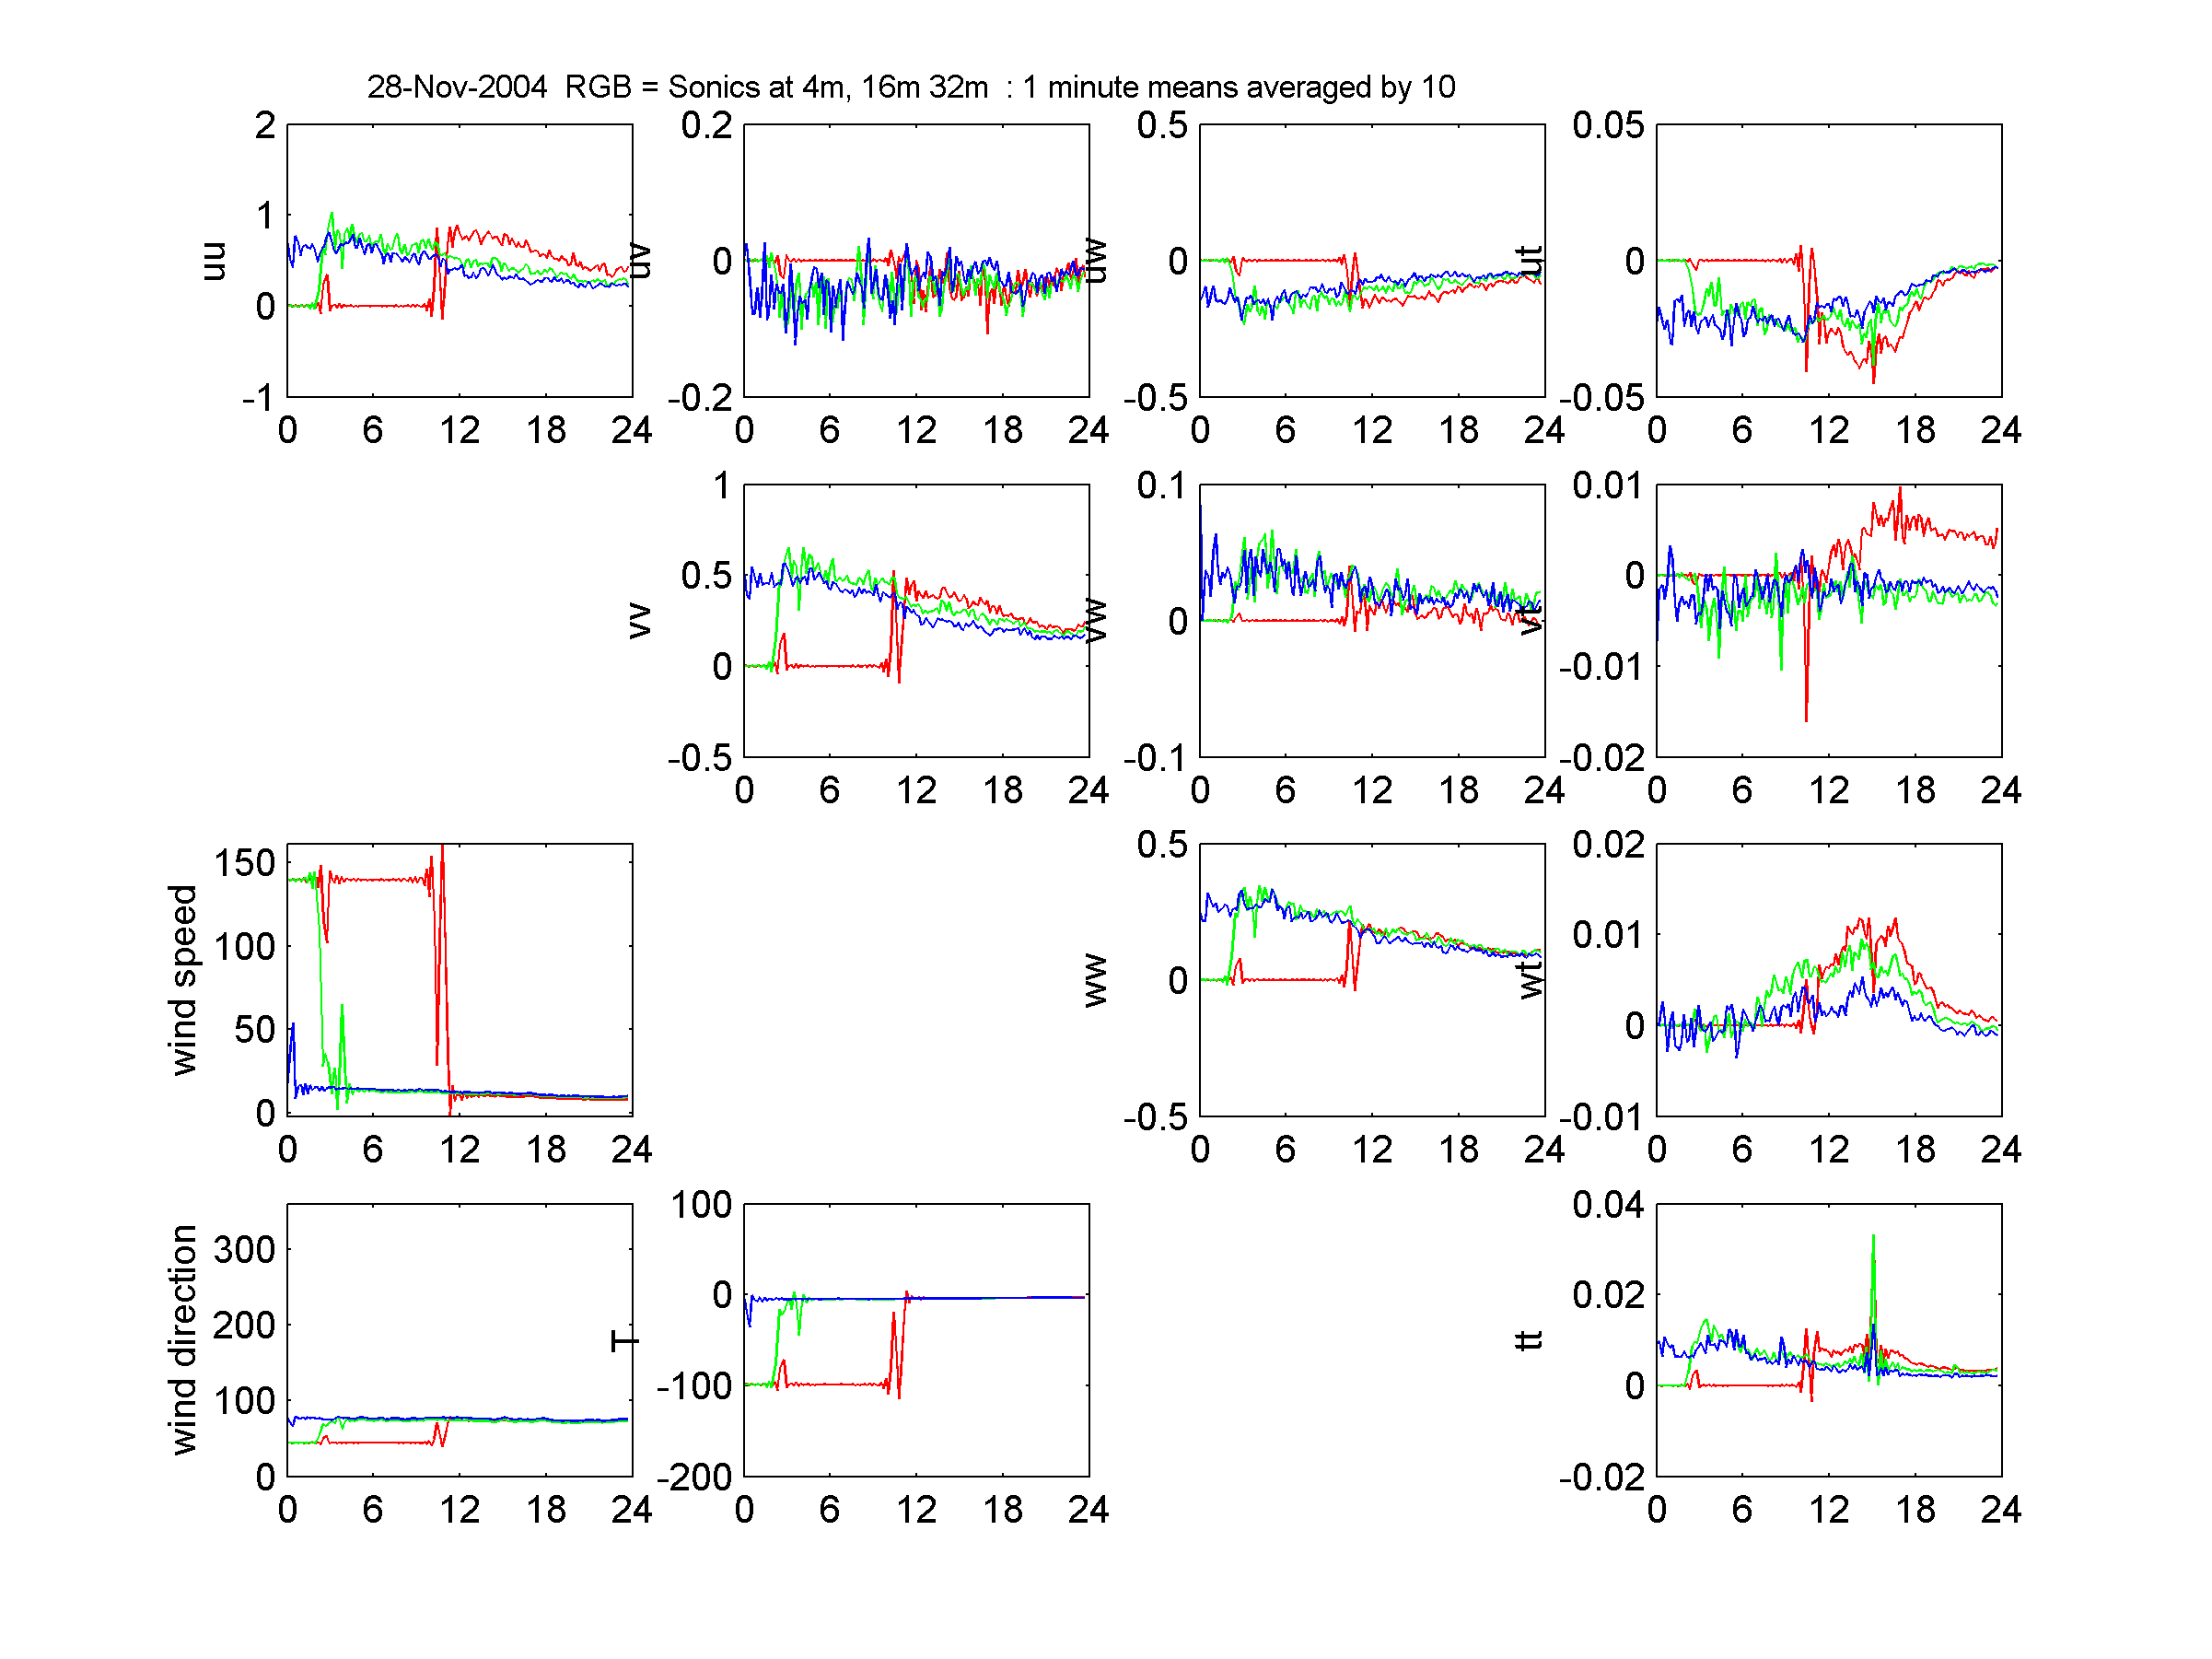
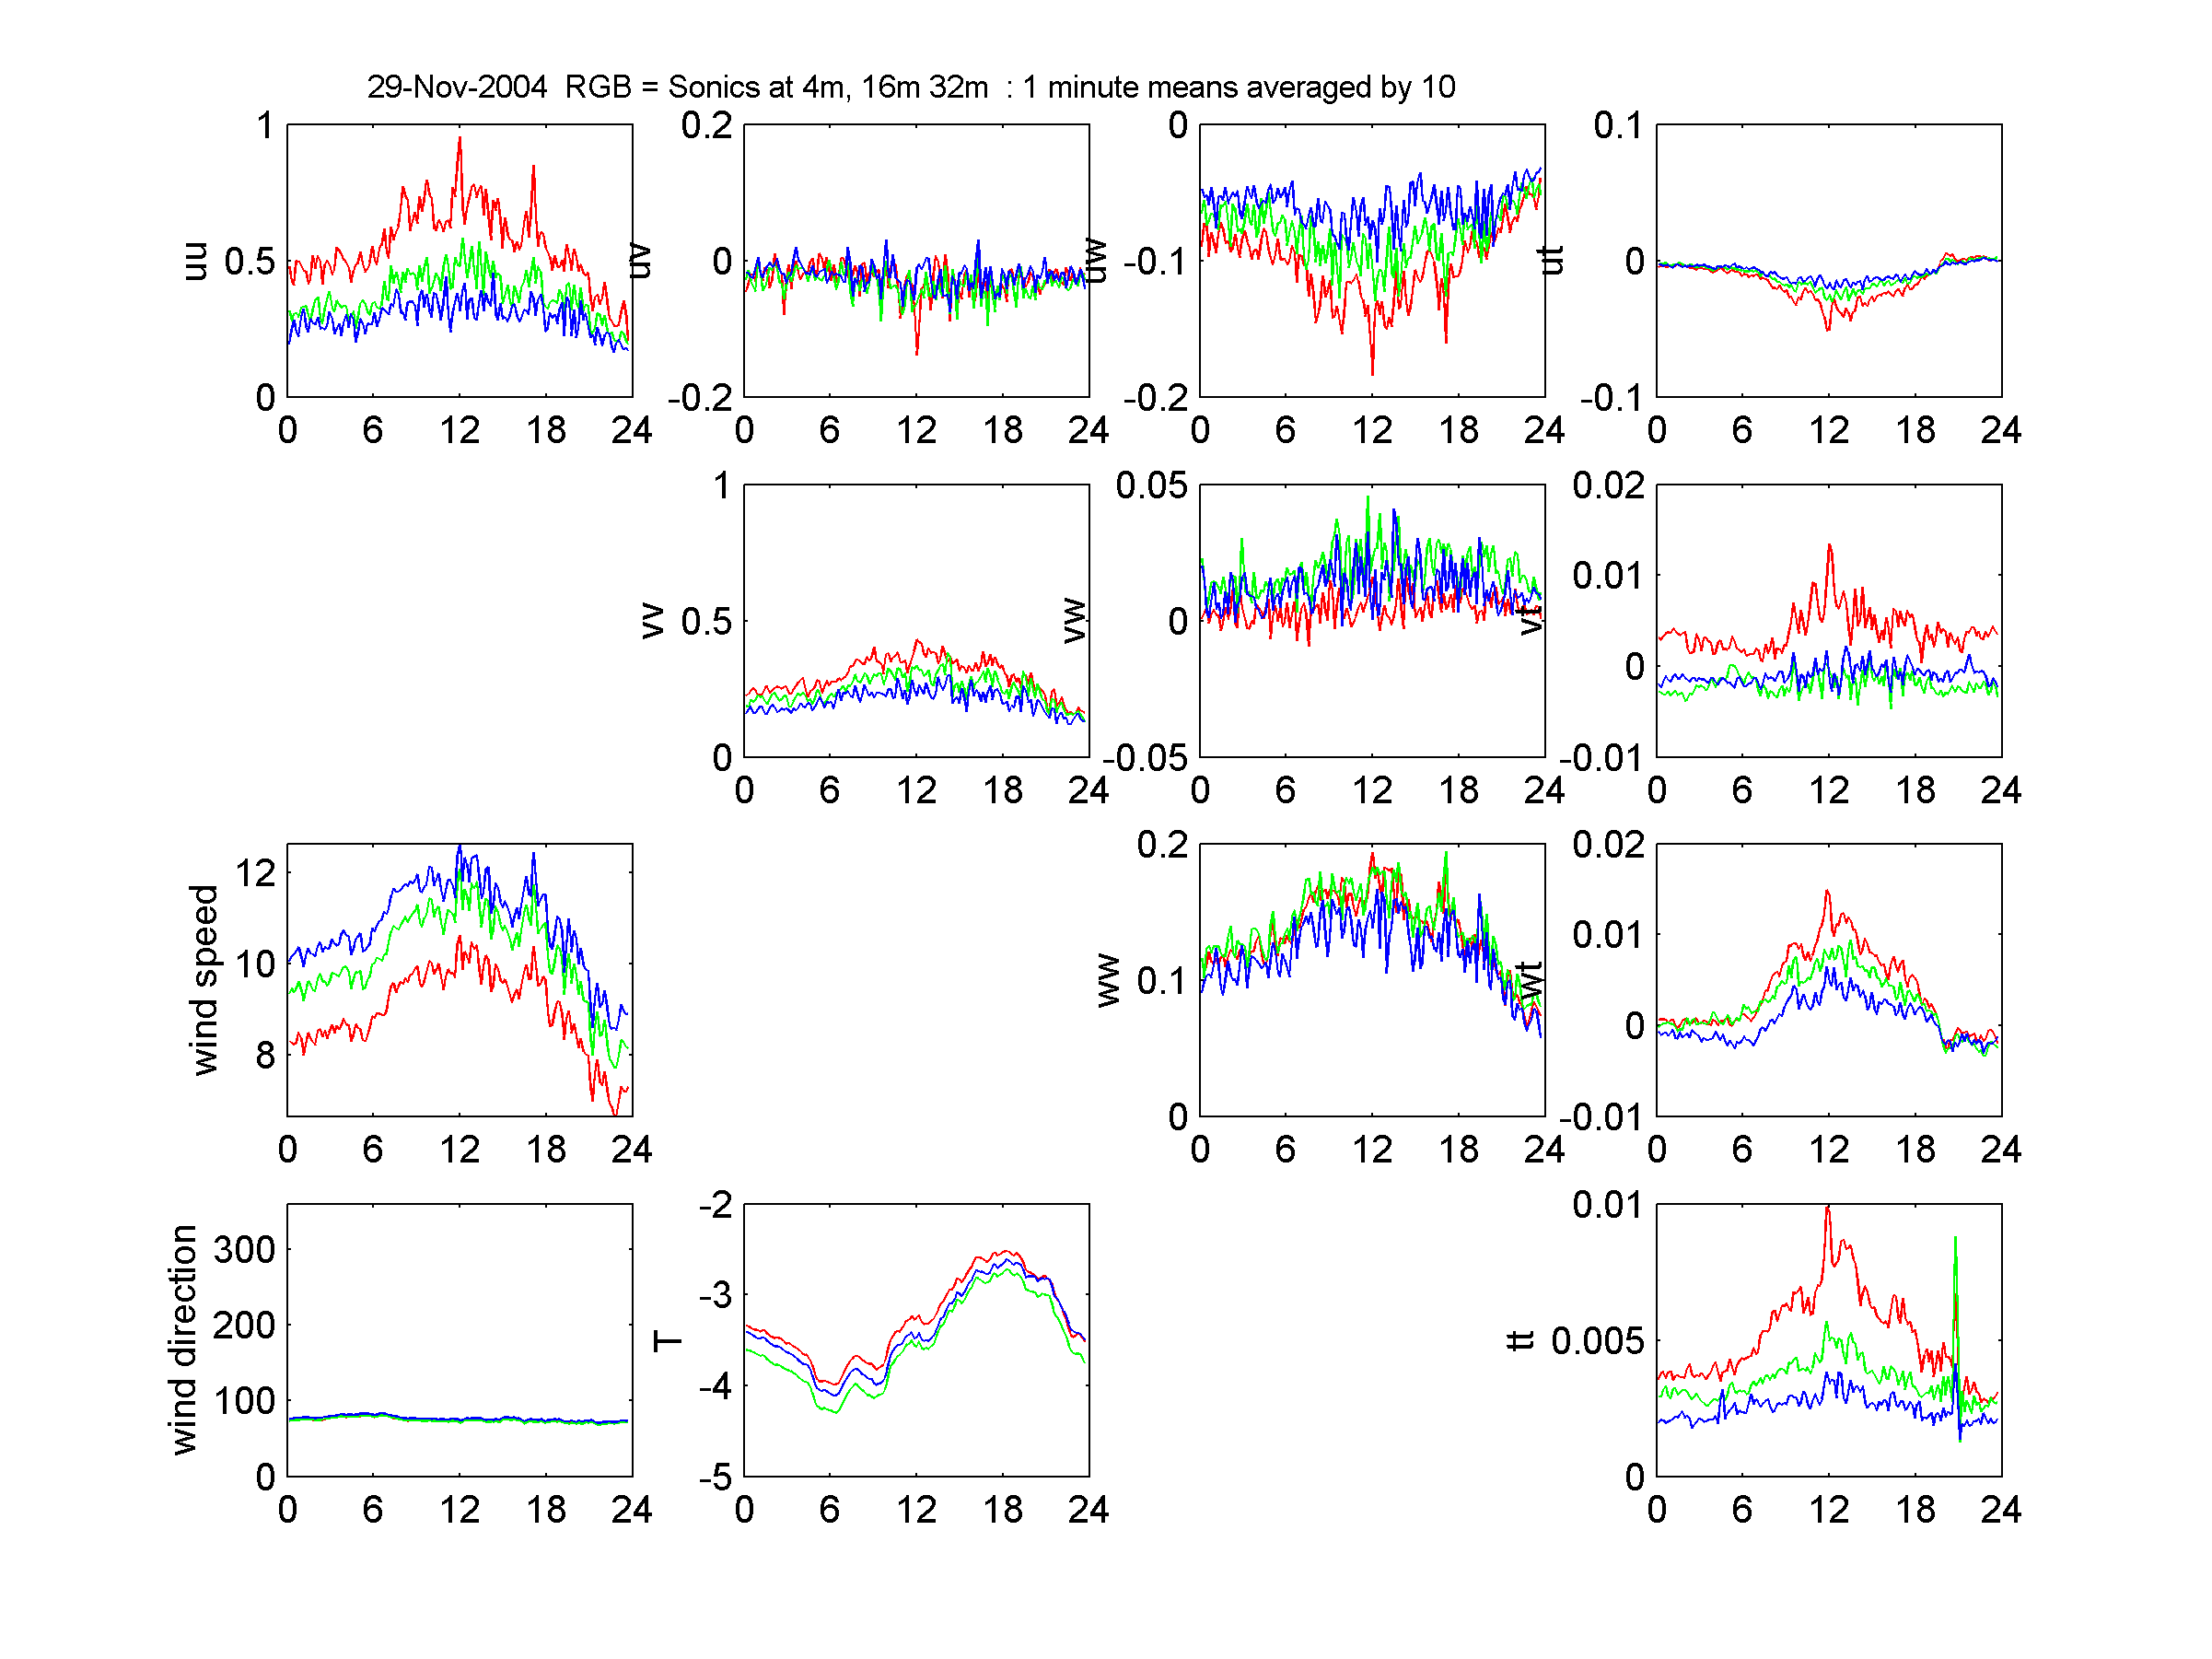
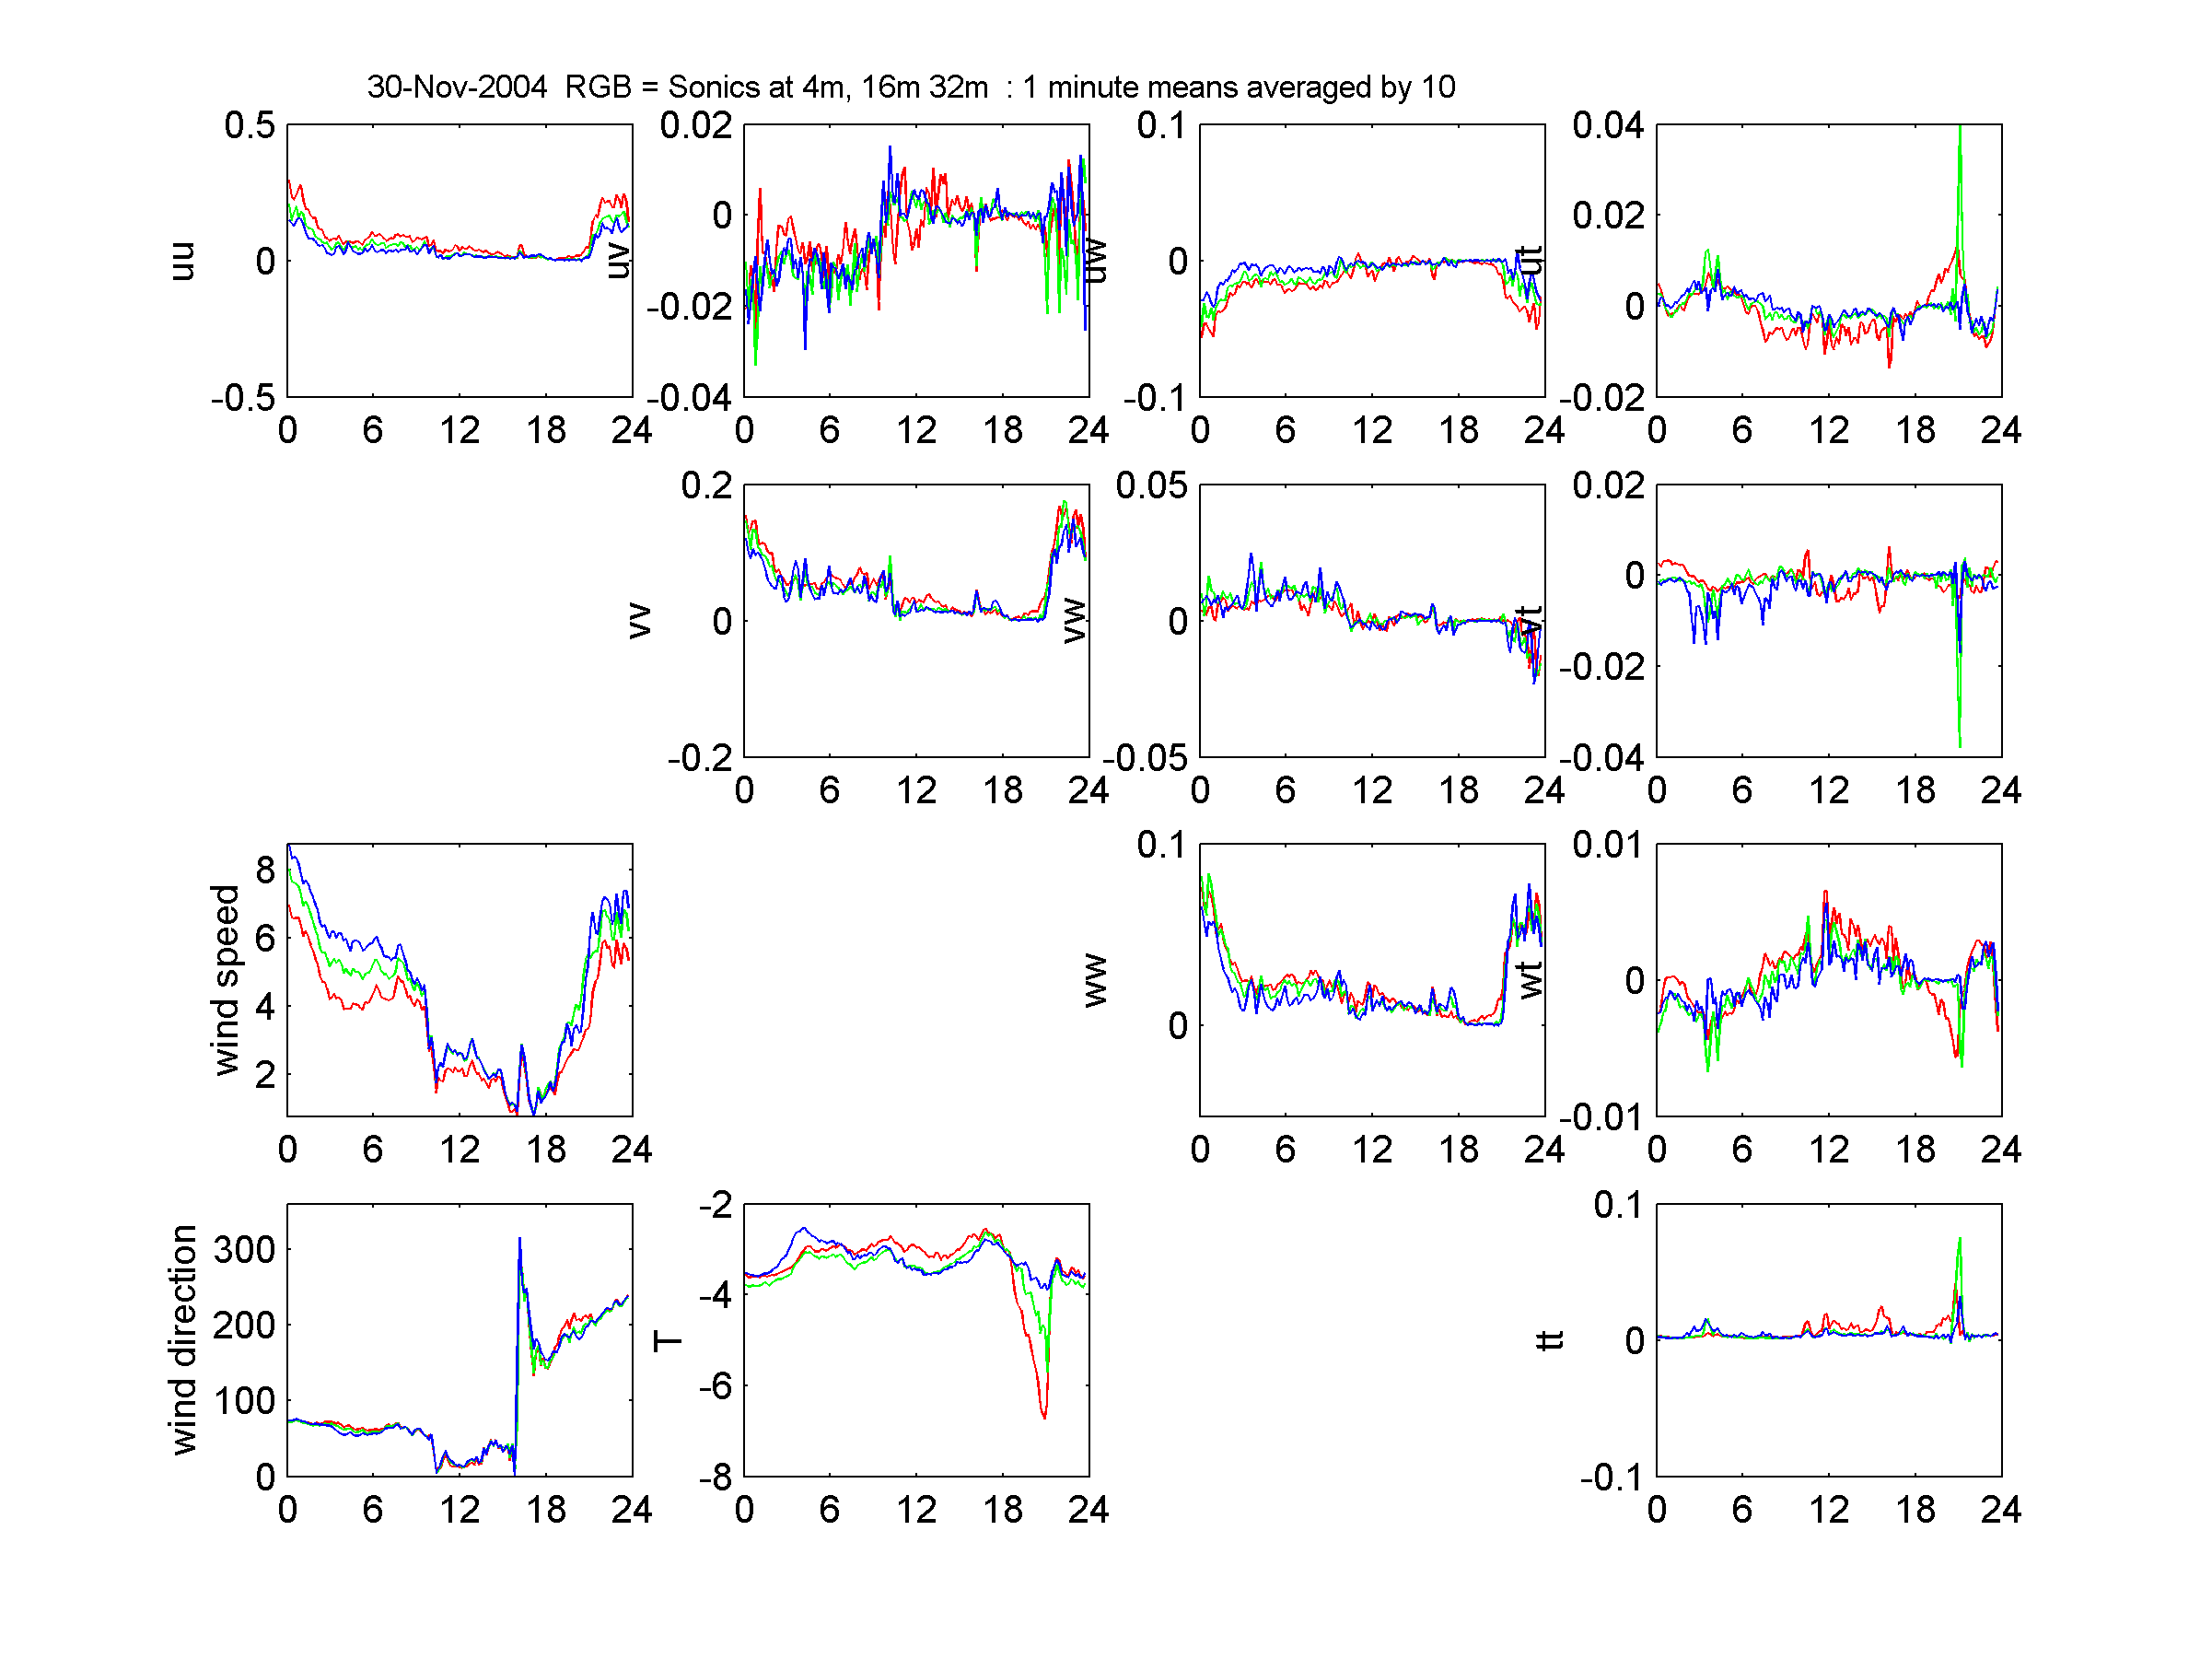
Cross Products, presented in a triagular array of images:
| u'u' |
u'v'
|
u'w'
|
u't'
|
|
v'v'
|
v'w'
|
v't'
|
|
|
w'w'
|
w't'
|
|
|
|
t't
|
The "de-spike" ratio is an indication of quality, indicating the ratio
of identified poor samples to .
There are only data available on the days indicated.
Times are in GMT: Halley is at 76S 26W.
If you wish to use the images or would like the original data, please contact
Phil Anderson