|
|
|
| [BAS Science] [BAS home] [ Met home] | Meteorology and Ozone Monitoring Unit |
ANTARCTIC OZONE
This page gives information about ozone at Halley, Rothera and Vernadsky/Faraday
stations. It was either updated or new data was added on 2024 April 22.
The next update is likely to be on or about May 13.
Antarctic ozone today: Air is beginning to descend over the south pole. Ozone values are a little lower over the continent and higher over the southern ocean. They currently range from a low of around 260 Dobson Units (DU) to a high of around 340 DU. The temperature of the ozone layer over Antarctica is falling from the summer maximum, but is well above the -78°C PSC formation threshold throughout the ozone layer. The temperature of the ozone layer is warmest over the Southern Ocean and declines towards the equator and pole.
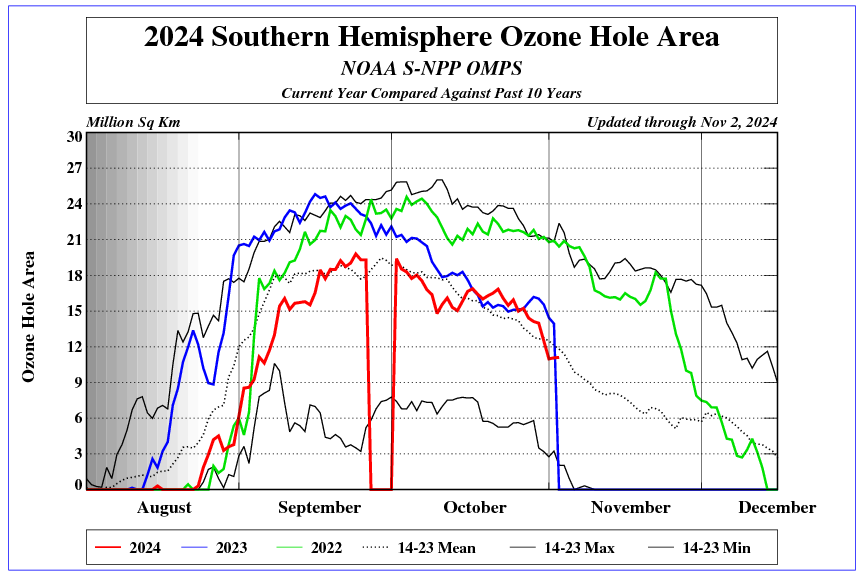
The polar vortex began to form in mid May 2023 and grew to reach 33 million square kilometres (msqkm) by mid September, close to average. It shrank slowly till early December, then more rapidly, disappearing at the end of the month. It became significantly less stable in the second half of September and remained unstable until late October. The area with potential Polar Stratospheric Clouds (PSC) also began to grow from mid May and reached a peak of around 26 msqkm in mid July. It declined slowly to 22 msqkm in mid September and it then shrank more rapidly, disappearing by October 24. An ozone hole formed in late June largely due to dynamical effects, reaching an area of 3 msqkm, before disappearing again. The main ozone hole began to form in late July and grew to 26 msqm in mid September, near the largest over the last decade. It shrank slowly and finally filled on December 19. It remained larger than the average over the last decade, but similar to the last couple of years for the majority of its existence. The ozone hole elongated over South Georgia from September 22 to 25. It stretched towards the tip of South America in early October.
Our thoughts and prayers are with our Ukrainian colleagues in Kyiv and at Vernadsky, who continue with their scientific work despite the invasion of their country.
September 16 is World Ozone Day.
See the final situation report for last year for information on the 2022 - 2023 season.
Notes: An ozone hole is defined as an area with values below 220 Dobson Units (DU). On average a column of air will hold 300 DU of ozone, equivalent to 3mm of ozone at sea-level pressure. Most of the ozone is between 10 and 40 km with a peak at around 20 km. The Antarctic ozone hole is usually largest in early September and deepest in late September to early October. Prior to the formation of ozone holes, Antarctic ozone values were normally at their lowest in the autumn (ie March). On occasion atmospheric vertical motions create small areas with ozone substantially below the long term average. Different satellites give different views of the exact ozone distribution. The continent covers 14 million sq. km. There are marked differences between the various satellite ozone measurements and analyses. The KNMI analysis and TEMIS forecasts are close to the observed values, whereas the Canadian analysis seems largely based on SMOBA data and is clearly at variance with ground based observations.
UNEP assessements: September 16 is world ozone day, and in 2009 the final UN Member State to ratify the Montreal Protocol signed up. All 197 Member States have now ratified the protocol up to and including the Beijing amendments. 2007 was the International Year of the Ozone Layer. A summary of the WMO/UN 2014 Ozone Assessment, the Assessment for Decision-Makers was released on 2014 September 10. 2017 was the 30th Anniversary of the Montreal Protocol. UNEP released the 2022 Scientific Assessment of Ozone Layer Depletion in 2023 January.
News: Observations reported in Nature in May 2018 showed that the rate of decline of CFC-11, an ozone depleting substances in the atmosphere, which is also a greenhouse gas, had become slower than predicted. This suggested that either something unusual was taking place in the atmosphere or that there were additional man-made emissions. The paper suggested that the most likely reason was illegal manufacture and release from somewhere in eastern Asia. Investigation by the EIA found that production of polyurethene foam in China could explain the observed changes. They encouraged the Chinese government to take immediate action. This became news again in May 2019 when another paper was published in Nature. The Chinese government took action and by 2021 the rate of decline had returned to that expected.
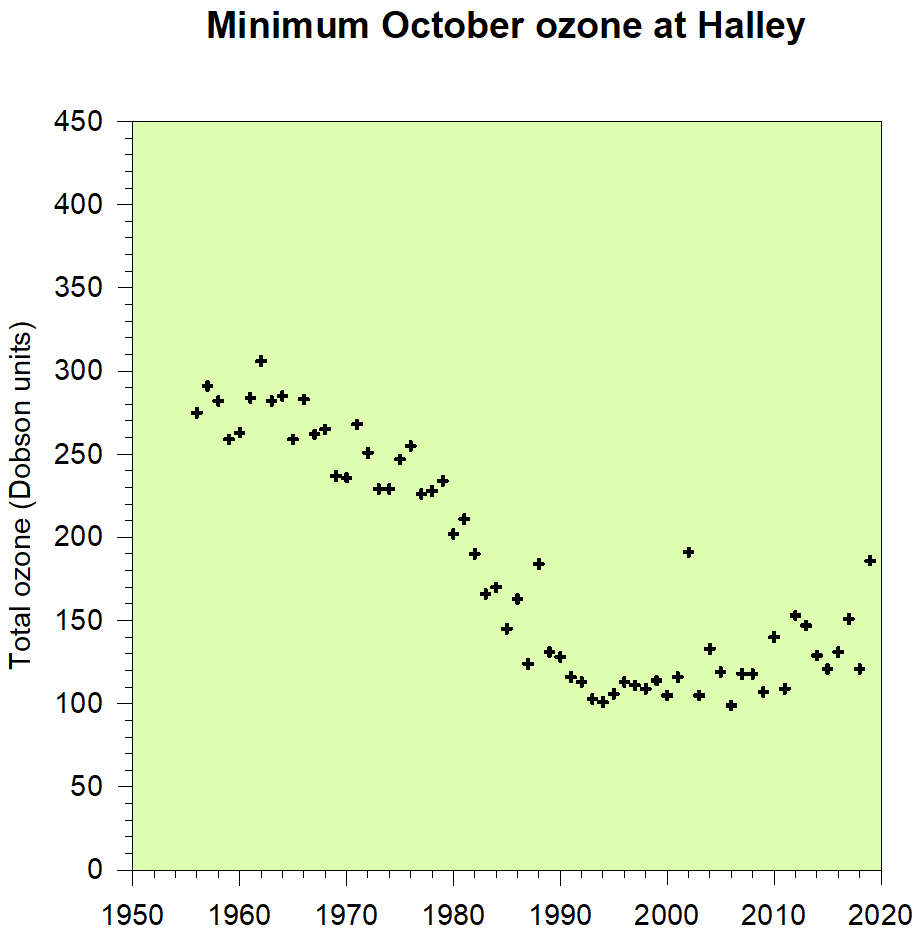
 Observations
from Halley since 1994 (the year when ozone depleting gasses were at their peak
according to one estimate) show a slow increase of about 1 DU per year in the
minimum ozone amount recorded each October. However, the inter-annual variation
is such that this trend is not quite significant at the 99% level, ie the data
is also just consistent with no change in the minimum amount. Although the
amount of ozone destroying substances in the atmosphere is going down, the
inter-annual variation in the size and depth of the ozone hole is largely
controlled by the meteorological conditions in the stratosphere. The
provisional Halley 2015 October minimum value was lower than that of 2014, 2013
and 2012 and this was due to the prevailing meteorological conditions. It
was also influenced by the eruption from Calbuco in southern Chile. Models suggest that recovery
may be more rapid after 2010. The 2019 October ozone minimum at Halley was
the highest since the split ozone hole of 2002 and the overall springtime
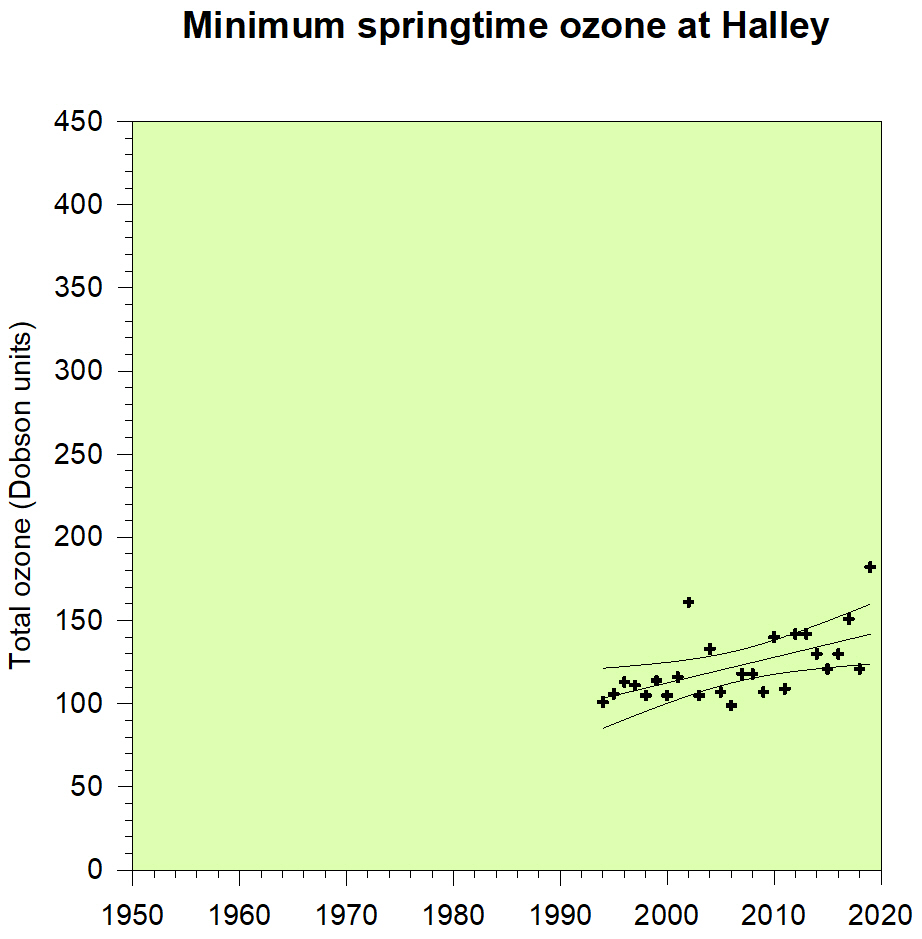
minimum the highest since 1982. The springtime (ie September and October)
minimum ozone values at Halley are slightly better fitted by a quadratic than a
linear fit. It is still too soon to say that we have
had the worst ever ozone hole, particularly as there has been no major volcanic
eruption in the Southern Hemisphere since 1992. There has also been little
cooling of the lower stratosphere since the mid 1990s. A simple linear extrapolation of the trend in
minimum values gives the final year with ozone hole levels as 2070, whilst the
quadratic fit suggests 2035, though the error bars on this estimate are very
large. Satellite data, which shows good agreement with the Dobson
data, has been used to fill the gaps in 2016 and 2017.
Observations
from Halley since 1994 (the year when ozone depleting gasses were at their peak
according to one estimate) show a slow increase of about 1 DU per year in the
minimum ozone amount recorded each October. However, the inter-annual variation
is such that this trend is not quite significant at the 99% level, ie the data
is also just consistent with no change in the minimum amount. Although the
amount of ozone destroying substances in the atmosphere is going down, the
inter-annual variation in the size and depth of the ozone hole is largely
controlled by the meteorological conditions in the stratosphere. The
provisional Halley 2015 October minimum value was lower than that of 2014, 2013
and 2012 and this was due to the prevailing meteorological conditions. It
was also influenced by the eruption from Calbuco in southern Chile. Models suggest that recovery
may be more rapid after 2010. The 2019 October ozone minimum at Halley was
the highest since the split ozone hole of 2002 and the overall springtime
minimum the highest since 1982. The springtime (ie September and October)
minimum ozone values at Halley are slightly better fitted by a quadratic than a
linear fit. It is still too soon to say that we have
had the worst ever ozone hole, particularly as there has been no major volcanic
eruption in the Southern Hemisphere since 1992. There has also been little
cooling of the lower stratosphere since the mid 1990s. A simple linear extrapolation of the trend in
minimum values gives the final year with ozone hole levels as 2070, whilst the
quadratic fit suggests 2035, though the error bars on this estimate are very
large. Satellite data, which shows good agreement with the Dobson
data, has been used to fill the gaps in 2016 and 2017.
Click on a thumbnail to get the latest graph or high resolution images, which are updated more frequently than the thumbnails.
 Halley - Total ozone:
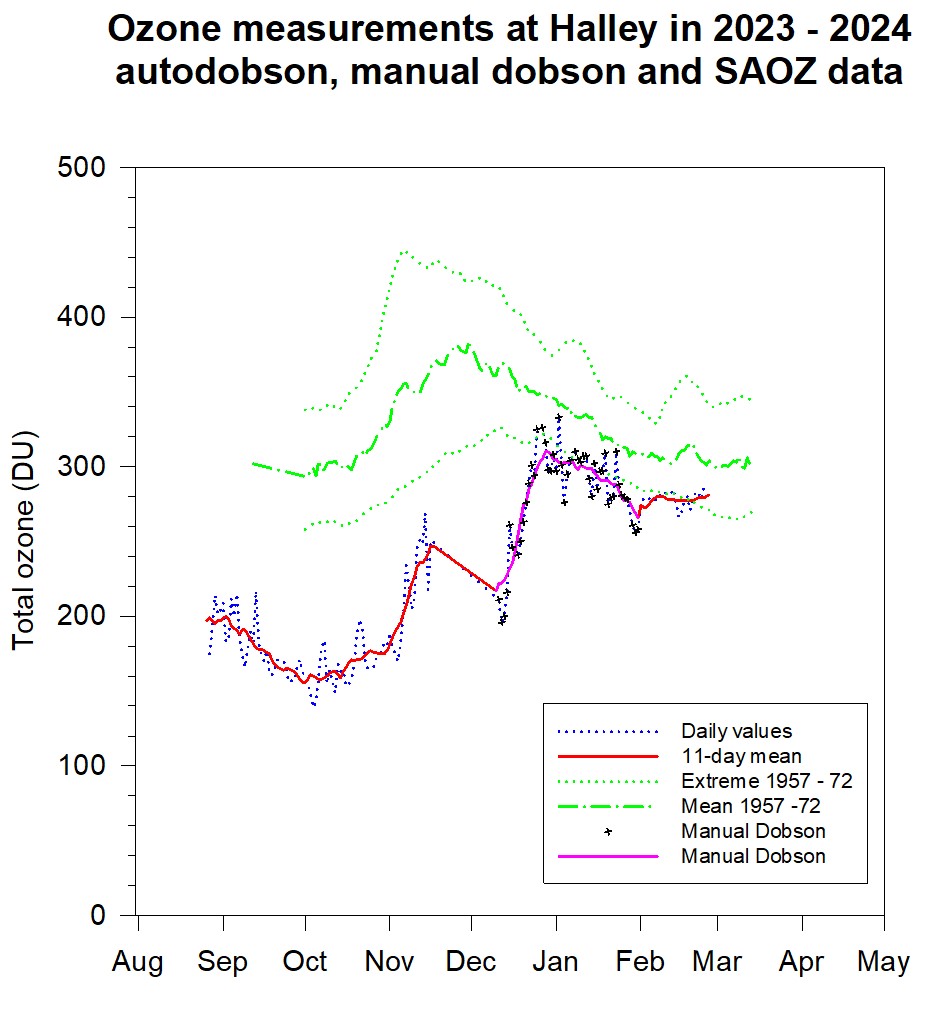
The Dobson ozone observing season at Halley normally begins at the end of August and
ends in mid April. Very early and late season observations are made
with the Sun at low elevation, and are less accurate than those made during the
main observing period of September 6 to April 6. See the
final situation report for 2019 for further information. There are
no staff on the station during the Antarctic winter and all
observations are made by automated instruments, which only observe the zenith
sky. The station was re-occupied for the 2023/24 season in late November and
closed in early February.
Halley - Total ozone:
The Dobson ozone observing season at Halley normally begins at the end of August and
ends in mid April. Very early and late season observations are made
with the Sun at low elevation, and are less accurate than those made during the
main observing period of September 6 to April 6. See the
final situation report for 2019 for further information. There are
no staff on the station during the Antarctic winter and all
observations are made by automated instruments, which only observe the zenith
sky. The station was re-occupied for the 2023/24 season in late November and
closed in early February.
The autoDobson (#73) ceased operation for the period of winter darkness on 2023 April 15. Ozone measurements re-commenced on August 27, when values were around 200 DU. Daily values fell to a minimum of around 155 DU at the end of September. They then slowly rose and were around 250 DU when the instrument failed in mid November. The lowest daily value for the year was 139 DU on October 4, whilst the highest before the instrument failed was 269 DU on November 14. CD observations have been brought into line with AD zenith, but further calibration is required as the instrument is still reading high compared to the SAOZ. It suffered progressive malfunction from November 15 onwards due to water ingress, which has affected the optics, possibly including the wedges. It will be returned to the northern hemisphere for refurbishment. Manual observations with Dobson #31 were made from December 11 to January 31; this gives results similar to the SAOZ.
SAOZ observations restarted in early August. The broad picture suggests that ozone values were around 230 DU at the beginning of August and fell to a minimum of around around 120 DU at the end of September. However they fell for a short period to a mean of 170 DU towards the end of August giving the lowest August value ever recorded at Halley of 114 DU on August 24, though the instrument may read low compared to the Dobson when ozone values are low. Daily values slowly rose to a peak of around 280 DU in late November, but then fell to 220 DU as the residual ozone hole returned to the station. Values rose to a second peak of around 310 DU at the end of the year. Values slowly fell and reached around 270 DU (10% depletion) at the equinox. They have since risen to around 310 DU (no depletion). The lowest daily value seen this season was 111 DU on October 4, the highest was 329 DU on November 30. The station was within the ozone hole from August 17 to November 13.
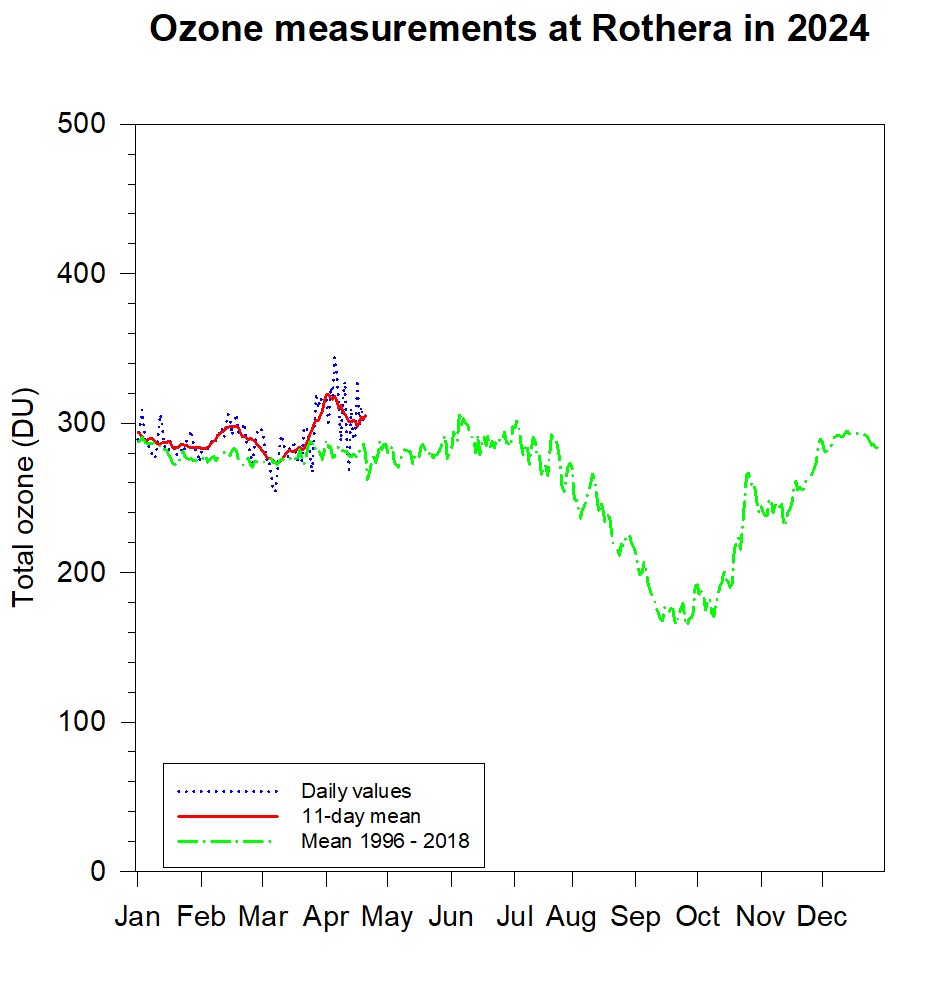
Rothera - Total ozone:
Real-time graphs showing current ozone and NO2 levels. Values
were around 270 DU at the
June solstice. There was no clear sign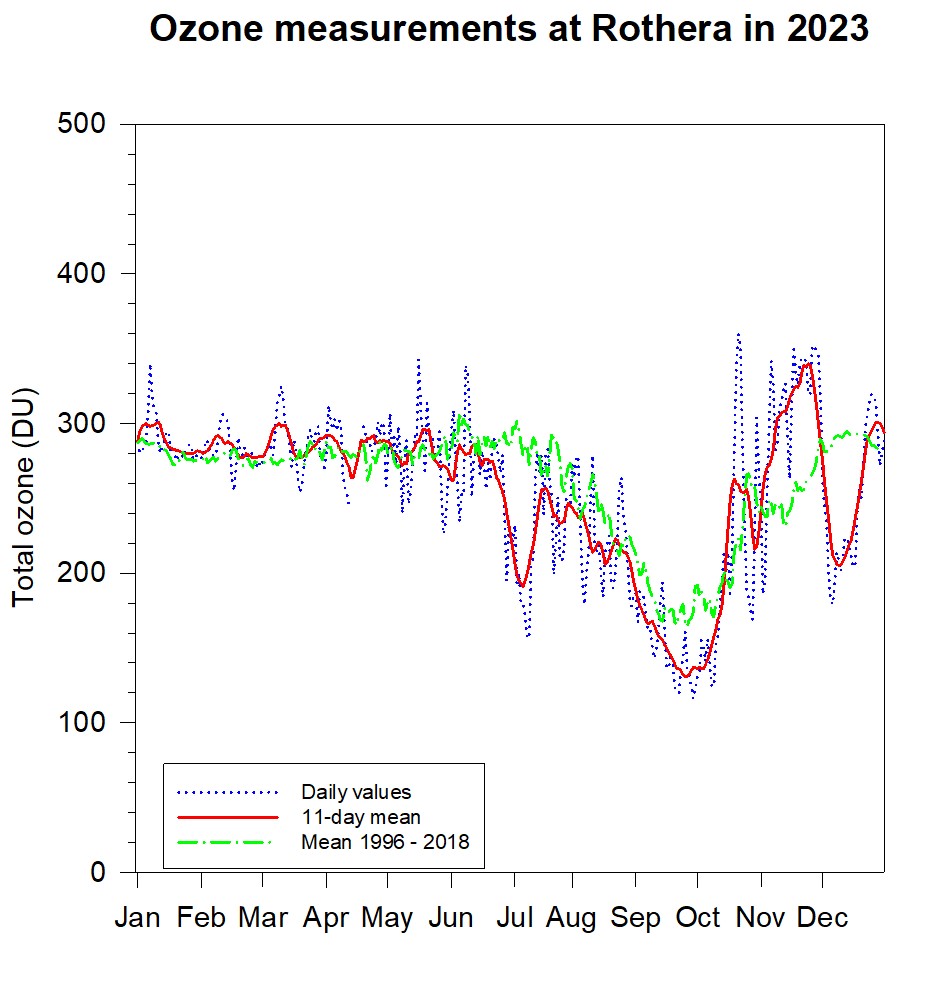 of the
usual
of the
usual
 autumn
minimum, however there were clear signs of wave activity. Values began dropping
after the solstice and reached ozone hole levels of around 190 DU in early July,
much lower than the long term average. They rose to reach 250 DU mid July, but
then fell rapidly reaching around 130 DU in late September, much lower than the
long term mean. Values rose to a peak of around 340 DU towards the end of
November, much higher than the long term mean. They then fell to 210 DU in early
December as the relict ozone hole moved back over the station. They rose to a
second peak of 300 DU at the end of 2023 and in 2024 have been close to the long
term average, which shows a slow decline from 290 DU in early January to 280 DU
at the equinox. They have since risen to around 310 DU. Superimposed on the general trends described here
are fluctuations with periods of days to around a month and values can change by
over 50% in a few days in the spring when the polar vortex rotates across the
station. The lowest daily value this season was 116 DU on September 29,
whilst the highest so far is 360 DU on October 21. The
station was within the ozone hole from August 10 to October 15,
October 29-30 and again from December 6-14.
autumn
minimum, however there were clear signs of wave activity. Values began dropping
after the solstice and reached ozone hole levels of around 190 DU in early July,
much lower than the long term average. They rose to reach 250 DU mid July, but
then fell rapidly reaching around 130 DU in late September, much lower than the
long term mean. Values rose to a peak of around 340 DU towards the end of
November, much higher than the long term mean. They then fell to 210 DU in early
December as the relict ozone hole moved back over the station. They rose to a
second peak of 300 DU at the end of 2023 and in 2024 have been close to the long
term average, which shows a slow decline from 290 DU in early January to 280 DU
at the equinox. They have since risen to around 310 DU. Superimposed on the general trends described here
are fluctuations with periods of days to around a month and values can change by
over 50% in a few days in the spring when the polar vortex rotates across the
station. The lowest daily value this season was 116 DU on September 29,
whilst the highest so far is 360 DU on October 21. The
station was within the ozone hole from August 10 to October 15,
October 29-30 and again from December 6-14.
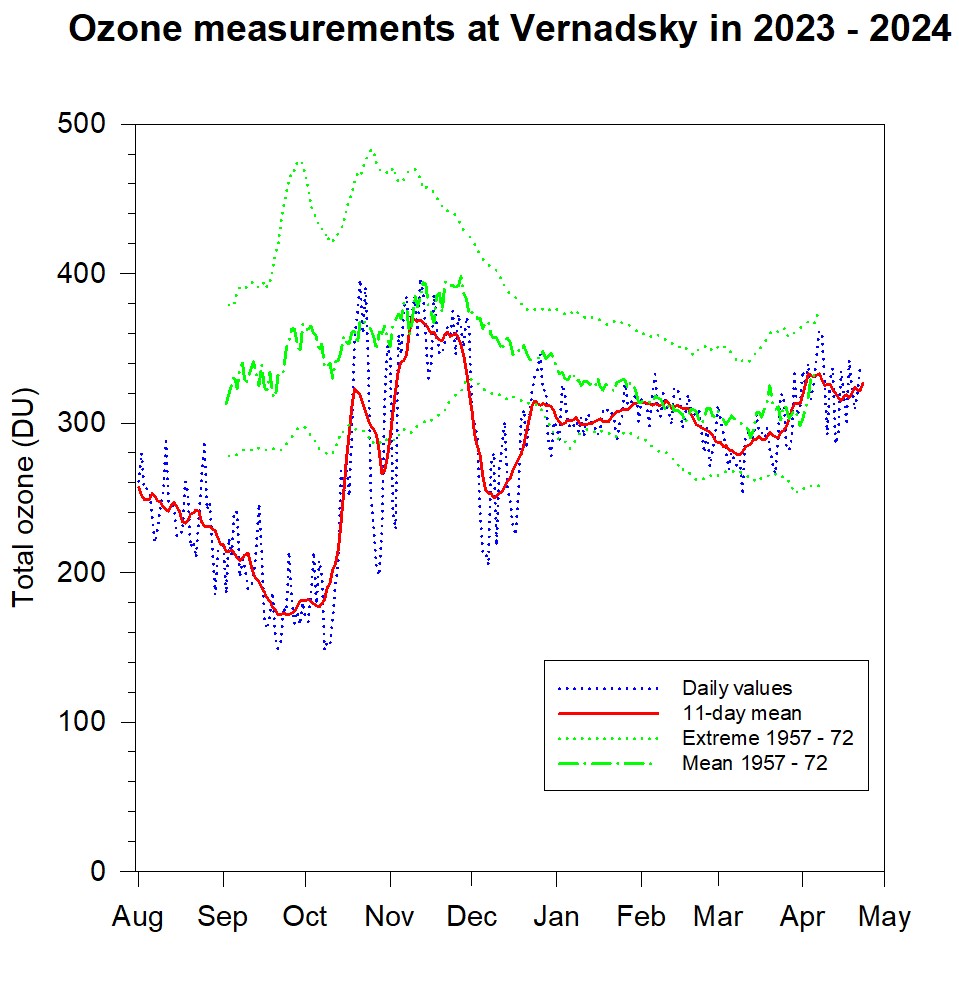 Vernadsky - Total ozone:
Vernadsky station is run by the
National Antarctic Scientific Centre of Ukraine.
It is some 250 km north of Rothera. The observing season began in late
July, when ozone values were around 260 DU. Mean values fell and reached a
minimum of around 170 DU in late September (50% depletion). Values rose rapidly to a peak
of around 360 DU in early November and then
now slowly fell until the end of the month. They then fell rapidly as the relict
ozone hole returned and reached 250
DU in early December, a long way below average. They rose to a second peak of
around 315 DU (10% depletion) and fell to around 300 DU in early January.
They rose to a broad peak of around 310 DU in early February, close to average.
They declined to around 290 DU by the March equinox, but have since increased to
around 340 DU, 10% above the long term mean. The lowest daily value seen this season was 144 DU on September
21 and the highest was 392 DU on November 12. The station was within the ozone hole from August 30 to October 13.
Vernadsky - Total ozone:
Vernadsky station is run by the
National Antarctic Scientific Centre of Ukraine.
It is some 250 km north of Rothera. The observing season began in late
July, when ozone values were around 260 DU. Mean values fell and reached a
minimum of around 170 DU in late September (50% depletion). Values rose rapidly to a peak
of around 360 DU in early November and then
now slowly fell until the end of the month. They then fell rapidly as the relict
ozone hole returned and reached 250
DU in early December, a long way below average. They rose to a second peak of
around 315 DU (10% depletion) and fell to around 300 DU in early January.
They rose to a broad peak of around 310 DU in early February, close to average.
They declined to around 290 DU by the March equinox, but have since increased to
around 340 DU, 10% above the long term mean. The lowest daily value seen this season was 144 DU on September
21 and the highest was 392 DU on November 12. The station was within the ozone hole from August 30 to October 13.
Superimposed on the general trends during the year are fluctuations with periods of days to around a month and values can change by over 50% in a few days in the spring when the polar vortex rotates across the station, which is usually near the edge region of the polar vortex. Very early and late season observations are made with the Sun at low elevation, and are less accurate than those made during the main observing period of August 6 to May 6. The instrument constants were revised on November 14 and previously published values for 2023 have changed by a small amount. A further small revision is likely.
 Temperature
and PSCs: The 100 hPa pressure level is near the base of the ozone
layer, but is reached by most radiosonde flights. The
temperature at this height is sufficiently cold from July to October that polar
stratospheric clouds (PSCs) can form. Note: "the normal" is used to refer to
the long term mean for the time of year.
Temperature
and PSCs: The 100 hPa pressure level is near the base of the ozone
layer, but is reached by most radiosonde flights. The
temperature at this height is sufficiently cold from July to October that polar
stratospheric clouds (PSCs) can form. Note: "the normal" is used to refer to
the long term mean for the time of year.
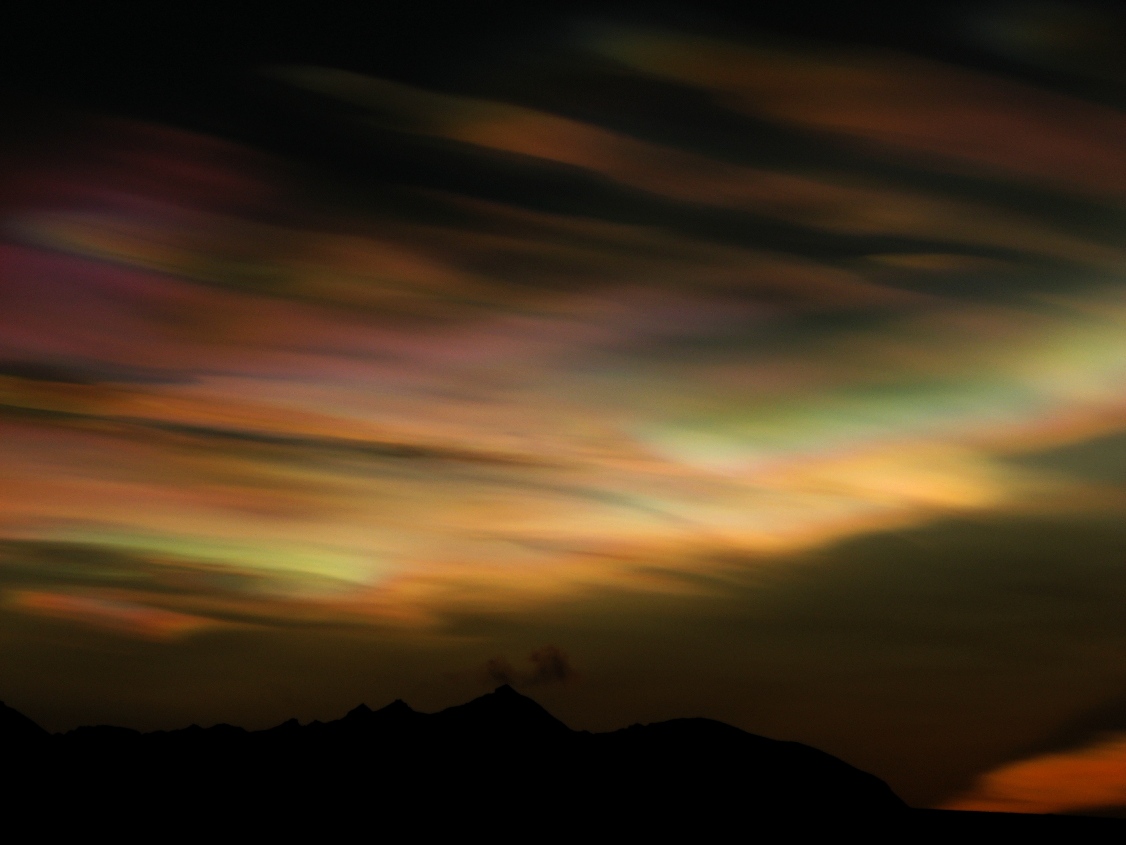
Both Halley and Rothera see
displays of nacreous clouds. Those at Halley are of the form described
during the IGY as "ultra-cirrus". Clouds were seen at Rothera
on July 6, 7, 11, 12, 14, 17, 18, 23, 25, 27, August 7, 10, 13, 14, 16, 18, 21 during the 2023 season.
Halley - 100 hPa temperature: Radiosonde flights are only
made during the short summer season. The temperature was around -62°C when
flights resumed in mid December and rose to a peak of around -43°C at the end of
the month. It remained near the summer maximum and was around -44°C when
flights finished at the end of January.
Peninsula - 100 hPa temperature:
The "Peninsula temperature" is usually the mean of five flights per week
from Rothera and one from Marambio and may include other stations when available.
In 2022/23 additional flights were made in support of YOPP at Frei and
Vernadsky. The 100 hPa temperature remained close to the average, but
with weak wave activity with a period of around a month,
until
All the colder winters in the ozone layer
have been within the last 15 years.
Arctic: The
northern polar vortex grew to a peak of around 13 msqkm in early January,
declined to around 10 msqkm towards the end of the month, then grew again to 14
msqkm by mid February. It shrank and had more or less disappeared by the equinox. The area
with potential PSCs reached a peak of 8 msqkm around the time of the solstice,
but then shrank to near zero in early January. The area increased again at
the end of January and reached around 5 msqkm in early February, with ozone depletion taking
place over northern Scandinavia. The area declined to zero by late February, but
with a short lived reappearance in early March.
Temperatures are now above the
Polar Stratospheric Cloud (PSC) formation temperature in all parts of the Arctic stratosphere. Ozone values
are beginning to decline from a peak of over 600 DU, but remain high. They are highest over the
Arctic Ocean and lower
elsewhere. They range from around 290 DU to around 520 DU. Ozone amounts over the UK are around
370 DU. PSCs were observed from Scotland on
December 19 and across England on December 21. Ozone depletion took place and
there was a small ozone hole, lasting from around December 19 to 24, which was
across the UK for much of this period.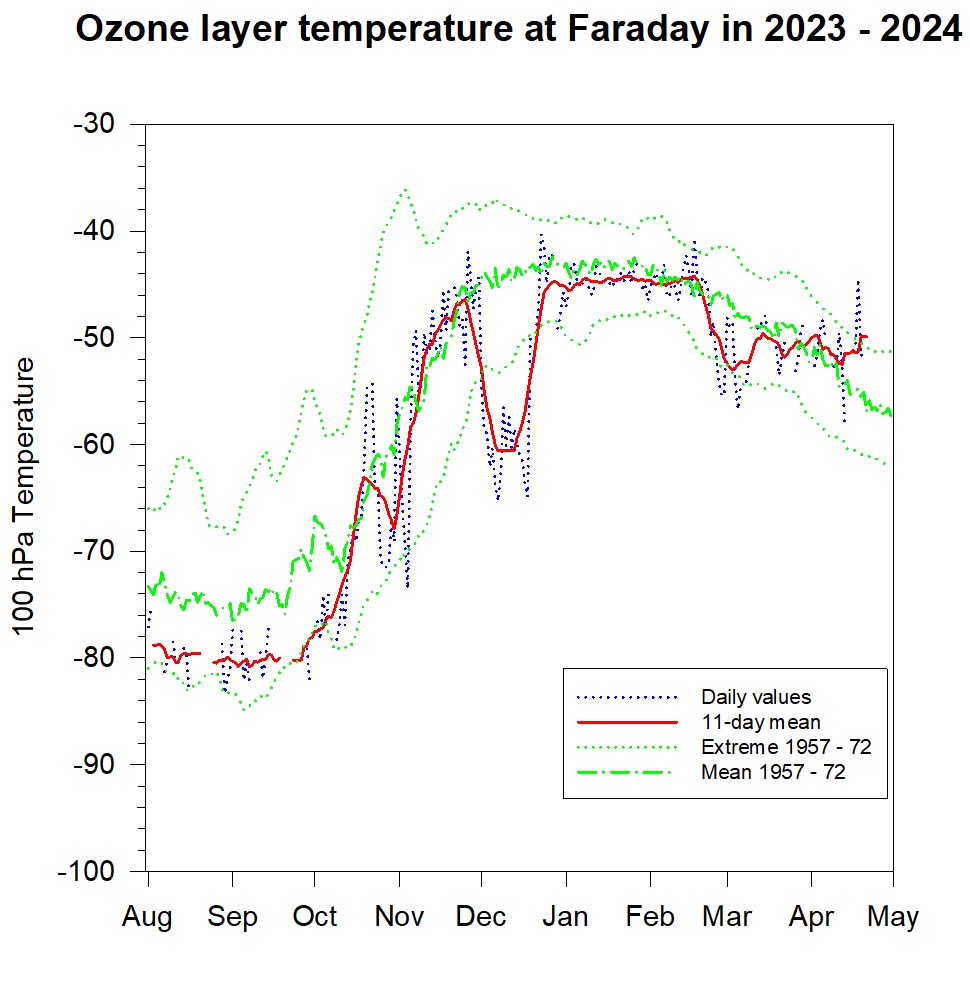 the
winter solstice, then fell more rapidly. It reached a broad minimum of around
-80°C between mid August and late September, substantially below average. It
rose rapidly to a peak of around -46°C in late November, close to the historical
average. It then fell rapidly back to -61°C in early December as the relict
polar vortex moved back over the station. As the ozone hole filled it rose to a
second peak of around -44°C at the end of the year. The temperature remained
close to the summer maximum until mid February, but then declined rapidly to
-54°C in early March, which is around 5° below the long term mean. The
temperature has since remained at around -51°C and is now about 5°
above the long term mean. There is often large day to day variation during the spring because the area is
in the edge region of the circumpolar vortex.
the
winter solstice, then fell more rapidly. It reached a broad minimum of around
-80°C between mid August and late September, substantially below average. It
rose rapidly to a peak of around -46°C in late November, close to the historical
average. It then fell rapidly back to -61°C in early December as the relict
polar vortex moved back over the station. As the ozone hole filled it rose to a
second peak of around -44°C at the end of the year. The temperature remained
close to the summer maximum until mid February, but then declined rapidly to
-54°C in early March, which is around 5° below the long term mean. The
temperature has since remained at around -51°C and is now about 5°
above the long term mean. There is often large day to day variation during the spring because the area is
in the edge region of the circumpolar vortex.
The north polar vortex is usually smaller and more disturbed than the corresponding one that forms during the Antarctic winter.
There are sometimes significant differences (over 100 DU) between modeled, satellite and ground-based measurements, particularly when there is large variation in total column ozone. Ozone values over the Arctic during 2022/23 are shown in our Northern Hemisphere OMI movie. For more UK information see the DEFRA UK Stratospheric Ozone Measurements page.
Equator: Ozone
levels are normally lowest over the tropics and TEMIS plots show nothing unusual.
The latest theories on how the ozone layer will change in response to increased
carbon dioxide in the atmosphere suggest that there will be a slow decline in
ozone amounts over tropical and sub-tropical regions.
Measurements reported here refer to
ozone in the "ozone layer", where most of the ozone in the atmosphere is found.
This "layer" stretches from roughly 10 to 40 km above the Earth's surface, with a
peak at around 20 km. Bringing all the ozone in the "layer" down to ground
level would give a thickness of around 3mm of pure ozone, which reduces to
around 1mm at the height of the ozone hole. A little ozone also exists
closer to the Earth's surface and
research shows that natural halogens in Antarctica can produce
depletion in this near surface layer. The theoretical basis for the
formation of the Antarctic ozone hole and its link with the halogen chemistry of
man-made substances is well established and the mechanism is described at sites
such as the Ozone Hole Tour at the
Cambridge University Centre for Atmospheric Science. The BAS ozone
bulletins contained the actual ozone values reported together with an
analysis of the situation. These were distributed by email on request, but are
now superceded by this web site. The last
email ozone bulletin
was issued on 2002 May 28. The final situation report
of each season is archived for historical reference. Please read this metadata
description before asking any questions about the data.
[updated 2024 March 18]. Older data (1972 - 2011) has been
recomputed and all the preliminary values are posted. Some of the
zenith sky regressions do not give a good fit and will be improved. The
direct sun measurements during this period are unlikely to change. Provisional daily
mean ozone values for 2023/2024 for Halley
[Manual Dobson, Updated 2024 February 12] and Vernadsky. [Updated 2024 April 22].
Note : The calibration of the current instruments is not yet
fully determined as the instruments use ongoing solar measurements for in-situ
calibration. The manual Dobson at Halley was changed in 2012 February and
required maintenance in 2013 August. The zenith sky tables or other
calibration values were last revised on 2018 February 4, but the daily means may
still have errors up to 5%, particularly when ozone values or the solar
elevation are low. Halley has become a summer only station and there are no manual observations
between 2017 February 15 and 2017 December 7,
2018 February 26 and 2018 December 10, 2019 February 16 and 2021 January 10 and
since 2021 February 10. The instrument calibration constants
are being
revised, so values given here may change. The automated Dobson is likely
to have larger errors as it has not been callibrated under low ozone conditions.
The instrument constants for Dobson 123 at Vernadsky were revised in 2019
October and may require further revision. The preliminary Halley and Vernadsky
values should therefore be treated with some caution. Temperature
and Ozone graphs for Halley and Vernadsky/Faraday. [Updated 2021 December 14].
The historic period shown in the inline graphs is for 1957 - 1972. Rothera
Cambridge Some background information on
Halley,
Rothera
and
Faraday
stations is available from BAS. Information about Vernadsky station is also
available from the Ukrainian Antarctic Centre. Information about Vladimir
Ivanovich Vernadsky Some surface and upper air synoptic
data is also available on line from our
public data page. Southern Hemisphere ozone
hole movies for 1997/1998 , 1998/1999
, 1999/2000 , 2000/2001
, 2001/2002 , 2002/2003
, 2003/2004 , 2004/2005
, 2005 [TOMS], 2005/2006
, 2006/2007 , 2007/2008
, 2008/2009 , 2009/2010
, 2010/2011 , 2011/2012
, 2012/2013 , 2013/2014
, 2014/2015 , 2015/2016
, 2016/2017 , 2017/2018
, 2018/2019 , 2019/2020
[OMI], 2020/2021 , 2021/2022
[OMPS], 2022/2023 , 2023/2024
[OMI, updated to 2024 March 31]. A short sequence of the
2001 ozone hole. A composite sequence of the 2022 and 2021 ozone holes
running from 2022 June 21 to 2022 September 13 and 2021 September 14 to 2021
December 31. Requests for permission to use this data or for further
information should be sent to Jon Shanklin who maintains these pages.
© Copyright Natural Environment Research Council - British
Antarctic Survey 2024
Satellite:
Satellite imagery
gives a global perspective on the ozone hole, though there
are marked differences between the different satellites, demonstrating the need
for verification by ground based stations. Our
2022/2023 Antarctic ozone hole movie was produced
from OMI images, which are generally well calibrated with respect to ground
based measurements. KNMI analyses are shown on the
Canadian Met Service world ozone maps pages. The KNMI model is
generally better at analysis and forecasting in the Antarctic. The Canadian
composite plot appears to give undue weight to the SMOBA observations.
The SMOBA and TOAST analyses both use SBUV and TOVS data, but
the TOAST algorithm may at times over-estimate ozone depletion.
In 2022/23 the SMOBA analysis did not pick up ozone depletion over Antarctica and gave unreasonably high values over the Arctic.
It was possibly being affected by smoke from forest fires. US NWS
CPC plots from NOAA show the
current area of the ozone hole, though note that this is often a preliminary
plot. The Sciamachy
uv index from the ESA Tropospheric Emission Monitoring Internet
Service shows the exposure risk at any location. TEMIS also provide
forecasts of total ozone out to 9 days.
Background and related material
Ozone bulletins
Ozone data
Two documents describe our standard operating procedures:
The BAS Dobson Manual
and the BAS ozone station
instructions. A paper describing the stations, observing programs and
reduction procedures is in preparation. Most of our data is available on line,
however please note that this is provisional and likely to change without
warning. You must request permission to reproduce the data and we may be
able to supply more suitable or more up to date material. If data from
Halley is used you must give the station name as Halley; Halley Bay was a
geographical feature that no longer exists.
Halley
Provisional daily mean ozone values for Halley in
2011/12 , 2012/13
,
2013/14 , 2014/15
,
2015/16 , 2016/17
, 2017/18 , 2018/19
, 2019/20 , 2020/21
, 2021/22 , 2022/23
, 2023/24 using Dobson 31 in manual operation.
Provisional daily mean ozone values for Halley in
2005/06 , 2006/07
,
2007/08 , 2008/09
,
2009/10 , 2010/11
,
2011/12 using Dobson 73 in manual mode. 2017/18
, 2018/19 , 2019/20
, 2020/21 , 2021/22
, 2022/23 , 2023/24 using Dobson 73 in auto mode.
Provisional daily mean ozone values for Halley in
1991/92 , 1992/93
,
1993/94 , 1994/95
,
1995/96 , 1996/97
,
1997/98 , 1998/99
,
1999/00 , 2000/01
,
2001/02 , 2002/03
,
2003/04 , 2004/05
,
2005/06
using Dobson 103.
Provisional daily mean ozone values for Halley in
1981/82 , 1982/83
,
1983/84 , 1984/85
,
1985/86 , 1986/87
,
1987/88 , 1988/89
,
1989/90 , 1990/91
,
1991/92
using Dobson 123.
Provisional daily mean ozone values for Halley in
1972/73 ,
1973/74 , 1974/75
,
1975/76 , 1976/77
,
1977/78 , 1978/79
,
1979/80 , 1980/81
,
1981/82
using Dobson 31.
Provisional individual ozone values for Halley
in
2011/12 , 2012/13
,
2013/14 , 2014/15
, 2015/16 ,
2016/17 , 2017/18 ,
2018/19 , 2019/20 ,
2020/21 , 2021/22 ,
2022/23 , 2023/24 using Dobson 31 in manual operation.
Provisional individual ozone values for Halley in
2005/06 , 2006/07
,
2007/08 , 2008/09
,
2009/10 , 2010/11
,
2011/12 with Dobson 73 in manual mode, 2017/18
, 2018/19 , 2019/20
, 2020/21 , 2021/22
, 2022/23 , 2023/24 using Dobson 73 in auto mode.
Provisional individual ozone values for Halley in
1991/92 , 1992/93
,
1993/94 , 1994/95
,
1995/96 , 1996/97
,
1997/98 , 1998/99
,
1999/00 , 2000/01
,
2001/02 , 2002/03
,
2003/04 , 2004/05
,
2005/06
using Dobson 103.
Provisional individual ozone values for Halley in
1981/82 , 1982/83
,
1983/84 , 1984/85
,
1985/86 , 1986/87
,
1987/88 , 1988/89
,
1989/90 , 1990/91
,
1991/92
using Dobson 123.
Provisional individual ozone values for Halley in
1972/73 ,
1973/74 , 1974/75
,
1975/76 , 1976/77
,
1977/78 , 1978/79
,
1979/80 , 1980/81
,
1981/82
using Dobson 31.
Faraday/Vernadsky
Provisional daily mean
ozone values for Vernadsky in
2004/05 , 2005/06
, 2006/07 ,
2007/08 , 2008/09
, 2009/10 ,
2010/11 , 2011/12
, 2012/13 ,
2013/14 , 2014/15
, 2015/16 ,
2016/17 , 2017/18 ,
2018/19 , 2019/20 ,
2020/21 , 2021/22 ,
2022/23 , 2023/24 using Dobson 123.
Provisional daily mean ozone values for Vernadsky in
1983/84 , 1984/85
, 1985/86 ,
1986/87 , 1987/88
, 1988/89 ,
1989/90 , 1990/91
, 1991/92 ,
1992/93 , 1993/94
, 1994/95 ,
1995/96 , 1996/97
, 1997/98 ,
1998/99 , 1999/00
, 2000/01 ,
2001/02 , 2002/03
, 2003/04 ,
2004/05 using Dobson 31.
Provisional daily mean ozone values for Vernadsky in
1971/72 ,
1972/73 , 1973/74
, 1974/75 ,
1975/76 , 1976/77
, 1977/78 ,
1978/79 , 1979/80
, 1980/81 ,
1981/82 , 1982/83
, 1983/84 ,
1984/85 using Dobson 73.
Provisional individual ozone values for Vernadsky in
2004/05 , 2005/06
, 2006/07 ,
2007/08 , 2008/09
, 2009/10 ,
2010/11 , 2011/12
, 2012/13 ,
2013/14 , 2014/15
, 2015/16 ,
2016/17 , 2017/18 ,
2018/19 , 2019/20 ,
2020/21 , 2021/22 ,
2022/23 , 2023/24 using Dobson 123.
Provisional individual ozone values for Vernadsky in
1983/84 , 1984/85
, 1985/86 ,
1986/87 , 1987/88
, 1988/89 ,
1989/90 , 1990/91
, 1991/92 ,
1992/93 , 1993/94
, 1994/95 ,
1995/96 , 1996/97
, 1997/98 ,
1998/99 , 1999/00
, 2000/01 ,
2001/02 , 2002/03
, 2003/04 ,
2004/05 using Dobson 31.
Provisional individual ozone values for Vernadsky in
1971/72 ,
1972/73 , 1973/74
, 1974/75 ,
1975/76 , 1976/77
, 1977/78 ,
1978/79 , 1979/80
, 1980/81 ,
1981/82 , 1982/83
, 1983/84 ,
1984/85 using Dobson 73.
Provisional Dobson monthly mean ozone values for Faraday/Vernadsky and Halley between 1956 and 2023 April.
Monthly mean satellite ozone values for Halley from 2004 October to 2022
December.
Note the satellite season lasts longer into April and starts earlier in August
than do Dobson measurements. Overall there is good agreement between the
two datasets, so the satellite data may be used to fill Dobson data gaps.
Provisional monthly minimum ozone values for Faraday/Vernadsky between 1972 and 2022 April and Halley between 1956 and 2022 April.
Mean daily ozone values for the period 1957 - 1972 for
Faraday
and Halley. [NB: not corrected to Bass-Paur]
Daily ozone values for the period 1957 - 1973 for Faraday and Halley. [Revised to Bass-Paur]
Provisional Halley SAOZ total column nitrogen dioxide
and ozone:
2013 [processing revised 2013 November 22] , 2014 ,
2015 , 2016 , 2021 ,
2022 , 2023 , 2024
[updated 2024 April 22] and as
real-time graphs showing current ozone and NO2 levels.
The SAOZ did not run from when the station closed before the 2018 winter until
the 2021/22 summer. There was no power during the 2022 winter.
Ozone & nitrogen dioxide:
SAOZ total column nitrogen dioxide and ozone:
1996 ,
1997 , 1998 ,
1999 ,
2000 , 2001 ,
2002 ,
2003 , 2004 ,
2005 ,
2006 , 2007 and
2008
[to 2008 January 22].
"New" SAOZ total column nitrogen dioxide and ozone:
2006 , 2007 ,
2008 ,
2009 , 2010 ,
2011 ,
2012 , 2013 ,
2014 ,
2015 , 2016 , 2017 ,
2018 , 2019 , 2020 ,
2021 , 2022 , 2023 ,
2024 [updated 2024
April 22]
and as
real-time graphs showing current ozone and NO2 levels. Data is missing
between 2013 December 23 and 2014 January 6. Data from 2017 January 6 to
May 8 is
likely to be revised as there were some issues with the instrument. Some
data in 2017 October and November, which show high standard deviation is also
suspect, though in some cases this simply reflects large changes in ozone column
during the day. There are some shorter periods with missing data due to
computer glitches. These became more problematic in 2019 and no data was collected
between 2019 January 18 and March 4.
Provisional monthly mean ozone values
from 1996 to 2022 December.
Note that means for some months are based on partial data.
Ozonesondes:
During 2003 we carried out ozone sonde flights at Rothera as part of the
QUOBI project. Data from these
flights
is available in NASA-AMES format. Animation
of the ozonesonde flight results [note that although the ozone scale on these
graphs reads nanobars, it should read mPa].
Bentham ozone. Provisional values for 1997
/ 1998 / 1999 /
2000
/ 2001 / 2003 /
2004 [updated 2004 November 5]. The
Bentham instrument ran until 2012, but data from it has not been used to produce
further ozone values.
 Some
experimental data from an automated Dobson making zenith only observations is available, but this is not well
calibrated, particularly when ozone amounts are above 350 DU and when the sun is
low in the sky. It has been brought back into operation for trials and some
preliminary data is now available, though there are some technical issues with
the instrument leading to data gaps. The instrument resumed operation in
2023 September after it underwent callibration at Hohenpeissenberg in
2023 July. The instrument constants have been adjusted, but there is still
uncertainty in the zenith sky equations, particularly when ozone amounts are
high. Ozone hole values were seen on 2023 December
21 and 23 when a small ozone hole passed over the UK. Ozone values were
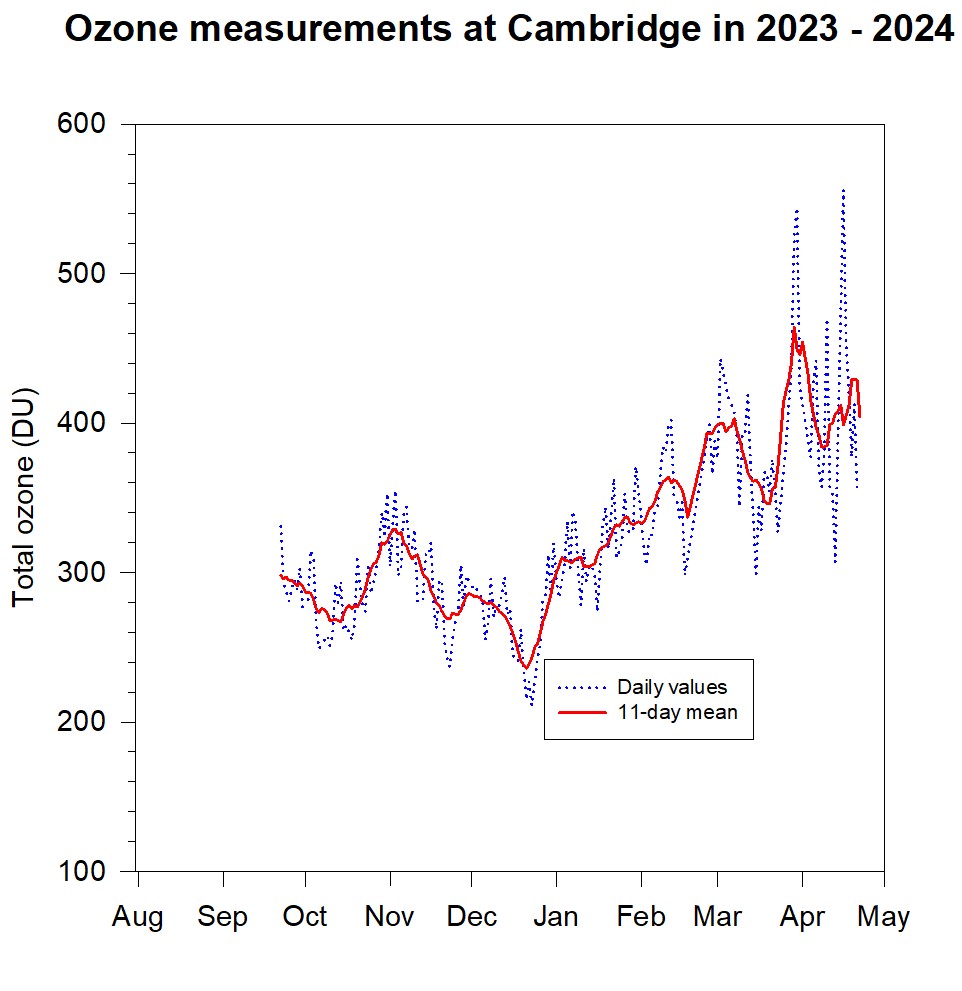
exceptionally high on 2024 March 28 and 29, reaching above 500 DU.
Some
experimental data from an automated Dobson making zenith only observations is available, but this is not well
calibrated, particularly when ozone amounts are above 350 DU and when the sun is
low in the sky. It has been brought back into operation for trials and some
preliminary data is now available, though there are some technical issues with
the instrument leading to data gaps. The instrument resumed operation in
2023 September after it underwent callibration at Hohenpeissenberg in
2023 July. The instrument constants have been adjusted, but there is still
uncertainty in the zenith sky equations, particularly when ozone amounts are
high. Ozone hole values were seen on 2023 December
21 and 23 when a small ozone hole passed over the UK. Ozone values were
exceptionally high on 2024 March 28 and 29, reaching above 500 DU.
Provisional daily mean ozone values for Cambridge in
2018/19 , 2019/20 ,
2021/22 , 2022/23 ,
2023/24 [updated 2024 April 22] using Dobson 103 in automode.
Provisional individual ozone values for Cambridge in 2018/19 , 2019/20 ,
2021/22 , 2022/23 , 2023/24
using Dobson 103 in automode.
Northern Hemisphere movies for 2000/2001 , 2001/2002
, 2002/2003 ,
2003/2004
, 2004/2005 , 2005
[TOMS], 2005/2006 ,
2006/2007
, 2007/2008 , 2008/2009
, 2009/2010 , 2010/2011
, 2011/2012 , 2012/2013
, 2013/2014 , 2014/2015
, 2015/2016 , 2016/2017
, 2017/2018 , 2018/2019
, 2019/2020 [OMI], 2020/2021
, 2021/2022 [OMPS], 2022/2023
, 2023/2024
[OMI, updated to 2024 March 31]. A short sequence of ozone depletion during the
2002/03 northern winter showing the difference from the normal.
The annual OMI movies are about 7Mb and were compiled from daily TOMS images until the end of 2005; from
2005/06 until 2019/20 and again from 2022/23 they were compiled from OMI images.
For 2020/21 and 2021/22 they used OMPS images
and the annual file size is over 16Mb.
The movies begin and end on the June solstice.
Today's
forecast OMI Antarctic image
The
current area of the hole and
other latest details are available from the NOAA Climate Prediction Center.
Environment Canada have a set of
daily maps showing both northern and southern ozone levels from a variety of
sources, though these are currently unavailable.
The Sciamachy uv index
from the ESA Tropospheric Emission Monitoring Internet Service.
Note that west longitude is negative when entering co-ordinates.
Contacts