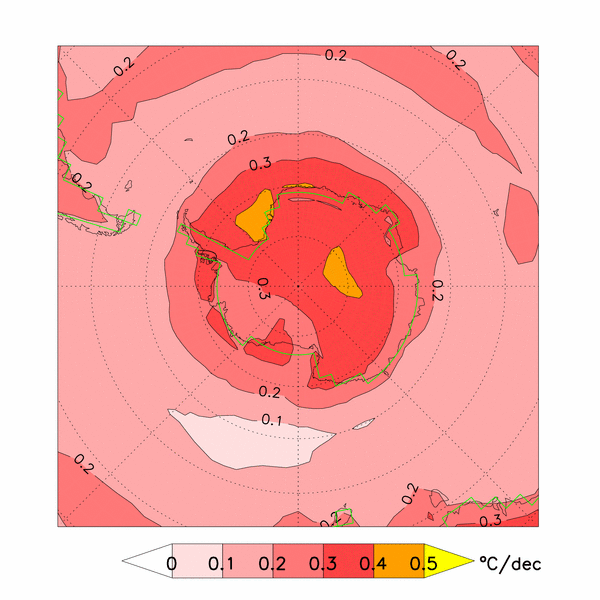
Change in annual mean surface temperature, 2000-2100

21st century change in annual mean surface* temperature (°C per decade). This is a multi-model weighted average of 19 models** from the CMIP3 archive (which was compiled to assist preparation of the IPCC Fourth Assessment Report (AR4) and is hosted at the Lawrence Livermore National Laboratory). Only model output from climate model runs following the SRESA1B future emissions scenario was used here. The model weights and details of their derivation are shown in Bracegirdle et al. (2008).
*surface temperature plotted here is the temperature of the surface in contact with the atmosphere, e.g. land surface temperature over land and sea surface temperature over open sea.
**the models are: 'bccr_bcm2_0', 'cccma_cgcm3_1', 'cnrm_cm3', 'csiro_mk3_0', 'gfdl_cm2_0', 'gfdl_cm2_1', 'giss_model_e_h', 'giss_model_e_r', 'iap_fgoals1_0_g', 'inmcm3_0', 'ipsl_cm4', 'miroc3_2_hires', 'miroc3_2_medres', 'mpi_echam5', 'mri_cgcm2_3_2a', 'ncar_ccsm3_0', 'ncar_pcm1', 'ukmo_hadcm3' and 'ukmo_hadgem1'
Bracegirdle, T. J., W. M. Connolley, and J. Turner (2008), Antarctic climate change over the twenty first century, Journal of Geophysical Research-Atmospheres, 113, D03103, doi: 10.1029/2007jd008933.
